
Abstract
Introduction:
DNA ploidy (P), stroma fraction (S), and nucleotyping (N) collectively known as PSN, have proven prognostic accuracy in stage II colorectal cancer (CRC). However, few studies have reported on the prognostic value of the PSN panel in stage III colon cancer patients receiving capecitabine and oxaliplatin adjuvant chemotherapy.
Objectives:
This study aimed to validate PSN’s prognostic impact on stage III colon cancer, identifying candidates for optimized adjuvant chemotherapy duration.
Design:
A retrospective analysis was conducted on a cohort of stage III colon cancer patients from April 2008 to June 2020.
Methods:
Postoperative pathological samples from stage III colon cancer patients who underwent radical surgery and postoperative adjuvant chemotherapy at Sun Yat-sen University Cancer Center were retrospectively collected. Automated digital imaging assessed PSN, categorizing risk groups. Kaplan–Meier, Cox regression, and time-dependent receiver operating characteristic analysis compared model validity.
Results:
Significant differences in 5-year disease-free survival (DFS) and overall survival (OS) were noted among PSN-based low-, moderate-, and high-risk groups (DFS: 92.10% versus 83.62% versus 79.80%, p = 0.029; OS: 96.69% versus 93.99% versus 90.12%, p = 0.016). PSN emerged as an independent prognostic factor for DFS [hazard ratio (HR) = 1.409, 95% confidence interval (CI): 1.002–1.981, p = 0.049] and OS (HR = 1.720, 95% CI: 1.127–2.624, p = 0.012). The PSN model, incorporating perineural invasion and tumor location, displayed superior area under the curve for 5-year (0.692 versus 0.553, p = 0.020) and 10-year (0.694 versus 0.532, p = 0.006) DFS than TNM stage. In the PSN high-risk group, completing eight cycles of adjuvant chemotherapy significantly improved 5-year DFS and OS compared to four to seven cycles (DFS: 89.43% versus 71.52%, p = 0.026; OS: 96.77% versus 85.46%, p = 0.007).
Conclusion:
The PSN panel effectively stratifies stage III colon cancer, aiding in optimized adjuvant chemotherapy duration determination.
Introduction
Approximately one-third of colorectal cancer (CRC) patients are diagnosed with stage III colon cancer, and these patients typically undergo curative tumor resection.1,2 However, the 5-year disease-free survival (DFS) with surgery alone ranges from 13.9% to 79.6%, and the addition of adjuvant chemotherapy contributes approximately a 20% improvement to 5-year DFS. 3 Current guidelines recommend adjuvant chemotherapy with the capecitabine and oxaliplatin (CapOX) regimen for 3–6 months in patients with pathologically confirmed stage III colon cancer and proficient mismatch repair (pMMR).4,5 However, chemotherapy-related toxicity, particularly oxaliplatin-based sensory neurotoxicity, prevents 20–30% of patients from completing the entire planned duration of adjuvant chemotherapy.6,7 Hence, it is crucial to identify additional pathological factors that can more accurately classify patients into distinct recurrence risk groups, potentially aiding in the development of personalized adjuvant chemotherapy strategies.
The International Duration Evaluation of Adjuvant Therapy (IDEA) trial introduced individualized durations of adjuvant chemotherapy according to TNM staging-based stratification. 8 The IDEA study’s final results recommended a 3-month duration of CapOX chemotherapy for low-risk patients (T1–3 N1 disease) and a 6-month duration for high-risk patients (T4, N2, or both). However, TNM stage was only generated based on the gross level of the tumor, and the tumor cell structure level was not specifically assessed. Accumulating studies have found that factors such as lymphovascular invasion, perineural invasion, tumor deposits, and tumor budding are associated with a poor prognosis in stage III colon cancer.9–12 Meticulous analysis of tumor cell structure is expected to improve predictive power for long-term prognostic outcomes of stage III colon cancer patients.
Chromosomal instability is a major type of genomic instability, with DNA aneuploidy or tetraploidy being closely associated with tumor progression and metastasis in CRC.13,14 The stroma fraction is defined in hematoxylin and eosin (H&E) stained tissue sections as the proportion of the area occupied by tumor cells relative to stromal cells, and high-stroma fraction is associated with poor prognosis of CRC patients. 15 Nucleotyping, which utilizes machine learning image texture analysis, is employed to determine chromatin organization in tumor cell nuclei. Previous studies demonstrated that the changes in chromosome structure, position, and number, significantly affect nucleotide polymorphism and genomic arrangement, influencing gene expression and cell differentiation, and CRC patient’s survival.16,17 Recently, the status of DNA ploidy (P), stroma fraction (S), and nucleotyping (N) (PSN) can be automatically assessed using machine learning image analysis methods. Additionally, the accuracy of the PSN panel in guiding treatment decisions for stage II CRC patients has been demonstrated in previous studies.18,19 However, few studies have reported on the prognostic value of the PSN panel in stage III colon cancer patients receiving CapOX adjuvant chemotherapy.
In this study, we investigated the prognostic value of combining PSN in stage III colon cancer patients. Additionally, we aimed to identify specific patient groups that could benefit from a 6-month course of adjuvant chemotherapy based on their prognostic risk as determined by the PSN panel.
Methods
Patient population
A retrospective analysis was conducted on stage III colon cancer specimens from the Department of Pathology at Sun Yat-sen University Cancer Center, spanning April 2008 to June 2020. Inclusion criteria were: (1) pathologically confirmed stage III colon adenocarcinoma with pMMR status; (2) undergoing curative resection for colon tumor; (3) completion of at least four cycles of CapOX adjuvant chemotherapy; (4) absence of preoperative anticancer treatment; (5) a minimum of 3 months postoperative follow-up after the last chemotherapy cycle; (6) availability of paraffin-embedded pathological tissues suitable for PSN assessment. The specific treatment regimen and administration method for CapOX are as follows: Oxaliplatin at a dose of 130 mg/m2 is administered intravenously on the first day and capecitabine at a dose of 1000 mg/m2 is administered orally twice daily on days 1–14 for a 3-week cycle. Clinical information and follow-up data were sourced from the electronic medical record system. This study adhered to The Strengthening the Reporting of Observational Studies in Epidemiology Statement Guidelines. 20
Tumor sampling
For PSN analyses, a pathologist selected a representative tumor block from each patient and delineated the entire epithelial tumor region. Two senior pathologists independently completed the selection of all representative tumor blocks and the delineation of tumor regions. All clinical information of the patients was concealed from the pathologists. The PSN panel assessments were conducted at Ningbo Meishan FTZ MBM Clinical Lab Co., Ltd. using DNA image cytometry.
Measurement of DNA ploidy
For DNA ploidy analysis, 5 μm formalin fixation and paraffin-embedding (FFPE) sections were prepared, and the tumor area was identified through H&E staining. A 50 μm section, containing more than 50% tumor tissue, was selected from the tumor-rich FFPE block. The nuclei of tumor cells were extracted as described in previous studies. 21 A 100 μl solution was centrifuged at 600 rpm for 5 min using Cytospin to prepare a cell nuclei monolayer on a slide. Prior to Feulgen staining, the slides were air-dried and fixed overnight with 4% formaldehyde. 22 Each nucleus was imaged using a high-resolution digital scanner (Aperio AT2, from Leica in Germany), and these images were subsequently automatically sorted into different sets, representing tumor nuclei, reference nuclei, and discarded nuclei. DNA ploidy histograms were generated using the PWS Classifier software (Kent, UK) based on the total optical density of the nuclei. The DNA ploidy histograms were classified into four categories, diploid, aneuploid, tetraploid, and polyploid. Aneuploid, tetraploid, and polyploid samples were grouped as non-diploid in this study.
Stroma-tumor fraction analysis
Stroma fraction was calculated automatically from digital scans of 5-μm H&E-stained sections using stroma analysis software, as reported by Danielsen et al. 23 H&E-stained tissue sections were scanned at 40× magnification using an Aperio AT2 scanner (Leica, Germany). The pathologist utilized software (Kent, UK) for delineating the tumor area in the scanned images. Patients with stroma content exceeding 50% were classified as high-stroma fraction, while those with less than 50% were classified as low-stroma fraction.
Nucleotyping analysis
Nucleotyping was performed automatically, in line with prior study recommendations. 17 Tumor samples were independently classified using PWS Classifier from the same set of images of tumor nuclei that was used for DNA ploidy analysis. Chromatin organization was quantified through the entropy of pixel gray levels in nuclear subregions, recorded in a Gray Level Entropy Matrix (GLEM). GLEMs, stratified by nuclear area and subregion size, were linked to form a four-dimensional GLEM extension, termed GLEM4D. Adaptive machine learning algorithms were applied to each GLEM4D element to associate with patient outcomes. In this study, these pre-trained weights were directly applied to predict patient prognosis based on GLEM4D. The chromatin value for each patient was calculated by multiplying each GLEM4D element by its weight. Patients with a value greater than 0.044 were categorized into the chromatin homogeneous (CHO) group, and those with less than 0.044 into the chromatin heterogeneous (CHE) group, as determined in the previous study. 17
Identification of risk groups based on PSN
Non-diploid DNA, CHE, and high-stroma fraction have been identified as risk factors for poor prognosis in CRC patients. 19 Accordingly, patients were stratified based on the presence of these risk factors. Groups were formed with subjects having zero, one, or at least two of these factors, categorized, respectively, as low, moderate, and high risk.
Follow-up
The follow-up was conducted every 3 months for the first 2 years and then semiannually for the subsequent 3 years after surgery through clinical visits. Follow-up procedures included physical exams, serum carcinoembryonic antigen level assessments, endoscopy, and abdominal and pelvic computed tomography scans. DFS was the interval from tumor resection to the date of disease recurrence, death, or the last follow-up. Overall survival (OS) was the interval from tumor resection to the date of death from any cause or the last follow-up. The final follow-up was on 21 November 2023.
Statistical analysis
Descriptive analysis was employed to summarize the clinical features of the total patients. Continuous variables were presented as medians and interquartile ranges (IQRs), and categorical variables as frequency percentages. The log-rank test was used to compare survival differences between groups. Survival curves were plotted using the Kaplan–Meier method. The association between clinicopathological factors and DFS and OS was assessed using the Cox regression model. The Cox regression analysis was conducted using IBM SPSS Statistics for Windows (IBM Corp., Armonk, NY, USA). Multivariate Cox proportional hazards analysis was performed using variables whose p value was less than 0.05 in the univariate analysis. Nomogram was constructed using the ‘rms’ R software package and subsequently underwent 1000 bootstrap resamples for internal validation to evaluate its predictive accuracy. Referring to the methodology proposed by previous study, time-dependent receiver operating characteristic (ROC) curves were constructed and the difference in the area under the curve (AUC) between two models was compared using the ‘timeROC’ package in R software. 24 The concordance index (C-index) of the models was compared using the ‘compare C’ package. A two-sided p value below 0.05 was deemed statistically significant.
Result
Patient characteristics
Initially, 350 consecutive patients with stage III colon cancer were identified, of whom 50 were excluded due to inadequate pathological tissue samples or insufficient follow-up records. Ultimately, 300 patients with complete PSN results were included in the analysis. The clinical and pathological characteristics of the patients are presented in Table 1. The median age of patients was 57 years (IQR: 47–65 years) and 44.7% of patients were male. All patients underwent at least 4 cycles of CapOX adjuvant chemotherapy, with 137 (45.6%) patients completing 8 cycles. Within the total cohort, 127 (42.3%) patients were identified as diploid, and 173 (57.7%) as non-diploid; 47 (15.7%) patients were identified as CHE, and 253 (84.3%) as CHO; 230 (76.7%) were identified with a low stroma fraction and 70 (23.3%) with a high-stroma fraction. According to PSN risk identification, 107 (35.7%) patients were classified as low-risk group, 106 (35.3%) as moderate-risk group, and 87 (29.0%) as high-risk group. By the end of the follow-up period, recurrence or metastasis had occurred in 55 (18.3%) patients, and 38 (12.7%) patients experienced cancer-related mortality. The median DFS and OS were 81.2 months (IQR: 47.1–122.7 months) and 91.0 months (IQR: 54.0–125.2 months), respectively.
Patient demographics, tumor characteristics, and treatment in total patients.
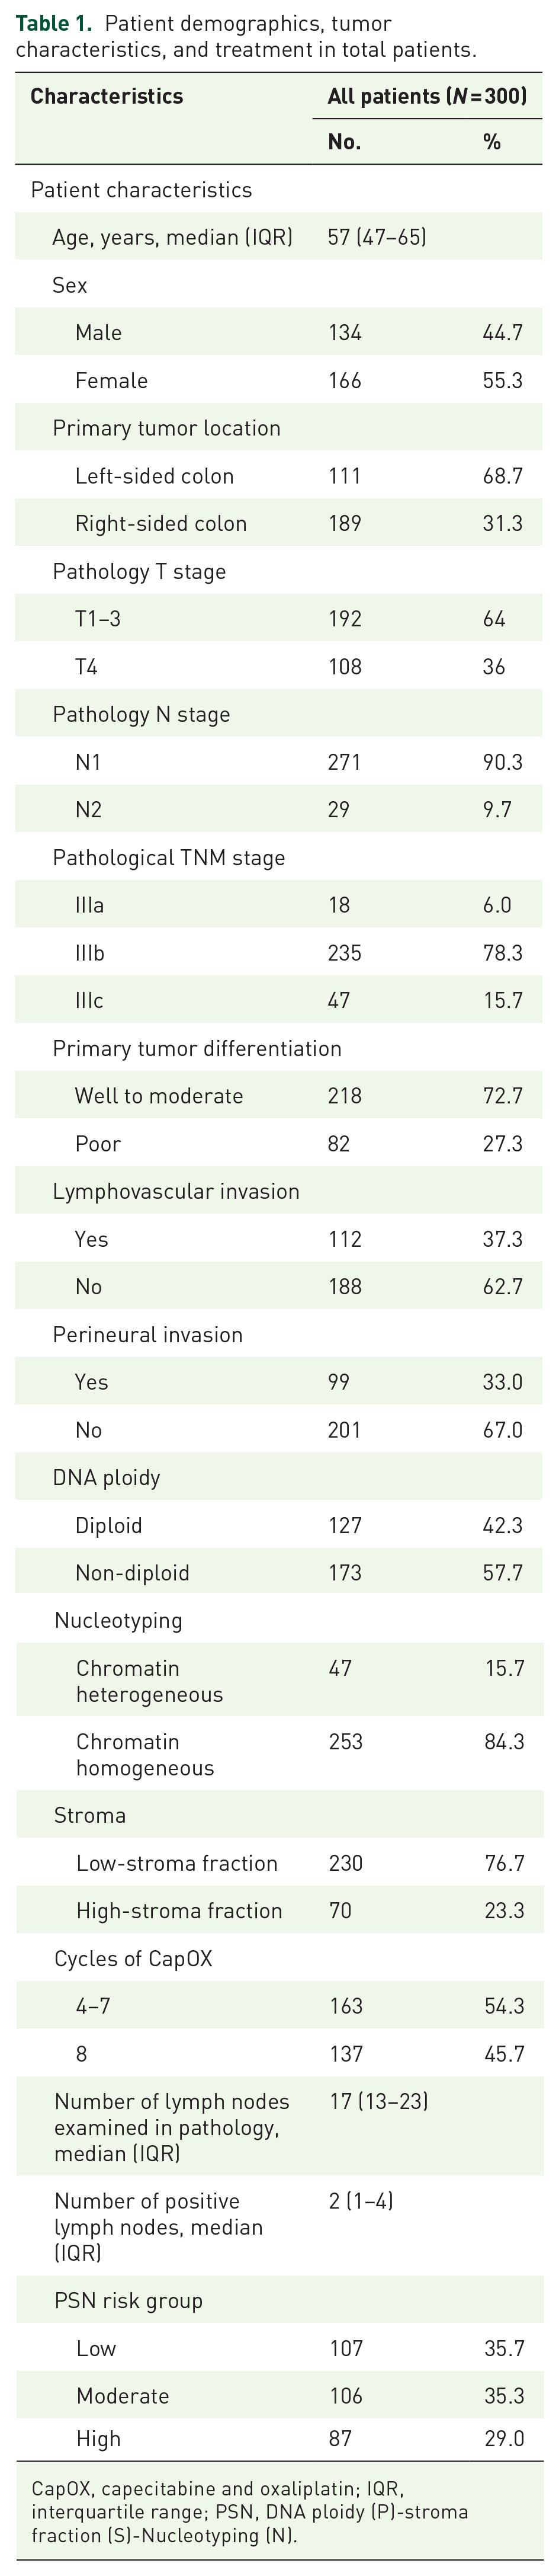
CapOX, capecitabine and oxaliplatin; IQR, interquartile range; PSN, DNA ploidy (P)-stroma fraction (S)-Nucleotyping (N).
Survival analysis
Regarding survival outcomes, patients were divided into three risk groups based on their PSN combination. The PSN high-risk group presented the lowest 5-year DFS rate [92.10% versus 83.62% versus 79.80%, p = 0.029, Figure 1(a)] and 5-year OS rate [96.69% versus 93.99% versus 90.12%, p = 0.016, Figure 1(b)] among the three groups. Subsequent survival analyses were separately conducted to assess the impacts of DNA diploidy, stroma fraction, and nucleotyping on 5-year DFS and OS rates. The results indicated that patients with high-stroma fraction had reduced 5-year DFS rate (88.64% versus 75.61%, p = 0.003) and 5-year OS rate [95.02% versus 89.93%, p = 0.028, Supplemental Figure S1(A) and (B)]. Although 5-year DFS rate did not show a significant difference [90.10% versus 82.17%, p = 0.075, Supplemental Figure S1(C)], patients with non-diploid DNA showed lower 5-year OS rate [97.29% versus 91.31%, p = 0.045, Supplemental Figure S1(D)] compared with those with diploid DNA. No significant difference was observed in 5-year DFS and OS rates between CHE and CHO groups [DFS: 85.33% versus 86.19%, p = 0.968; OS: 93.53% versus 95.20%, p = 0.529, Supplemental Figure S1(E) and (F)].

Kaplan–Meier survival curves of in stage III colon cancer patients grouped by PSN panel. (a) DFS. (b) OS.
The results of univariate and multivariate Cox analyses, which assessed factors influencing DFS and OS among all patients, are presented in Tables 2 and 3. Univariate analysis identified PSN high-risk group [hazard ratio (HR) = 1.573, 95% confidence interval (CI): 1.119–2.221, p = 0.009], pathological TNM stage IIIc (HR = 1.797, 95% CI: 1.033–3.126, p = 0.038), perineural invasion (HR = 2.165, 95% CI: 1.264–3.708, p = 0.005), and right-sided colon cancer (HR = 2.244, 95% CI: 1.183–4.256, p = 0.013) as risk factors for DFS. Additionally, being in the PSN high-risk group (HR = 1.745, 95% CI: 1.138–2.676, p = 0.011) and receiving four to seven cycles of CapOX adjuvant chemotherapy (HR = 0.489, 95% CI: 0.242–0.990, p = 0.047) were identified as risk factors for OS. Multivariate analysis demonstrated that PSN high-risk group (HR = 1.409, 95% CI: 1.002–1.981, p = 0.049), perineural invasion (HR = 1.981, 95% CI: 1.150–3.413, p = 0.014), and right-sided colon cancer (HR = 1.932, 95% CI: 1.006–3.712, p = 0.048) the independent predictive factors for unfavorable DFS. PSN high-risk group (HR = 1.720, 95% CI: 1.127–2.624, p = 0.012) was identified as the independent predictive factors for unfavorable OS.
Univariable and multivariable Cox analysis of risk factors for disease-free survival in patients with stage III colon cancer.
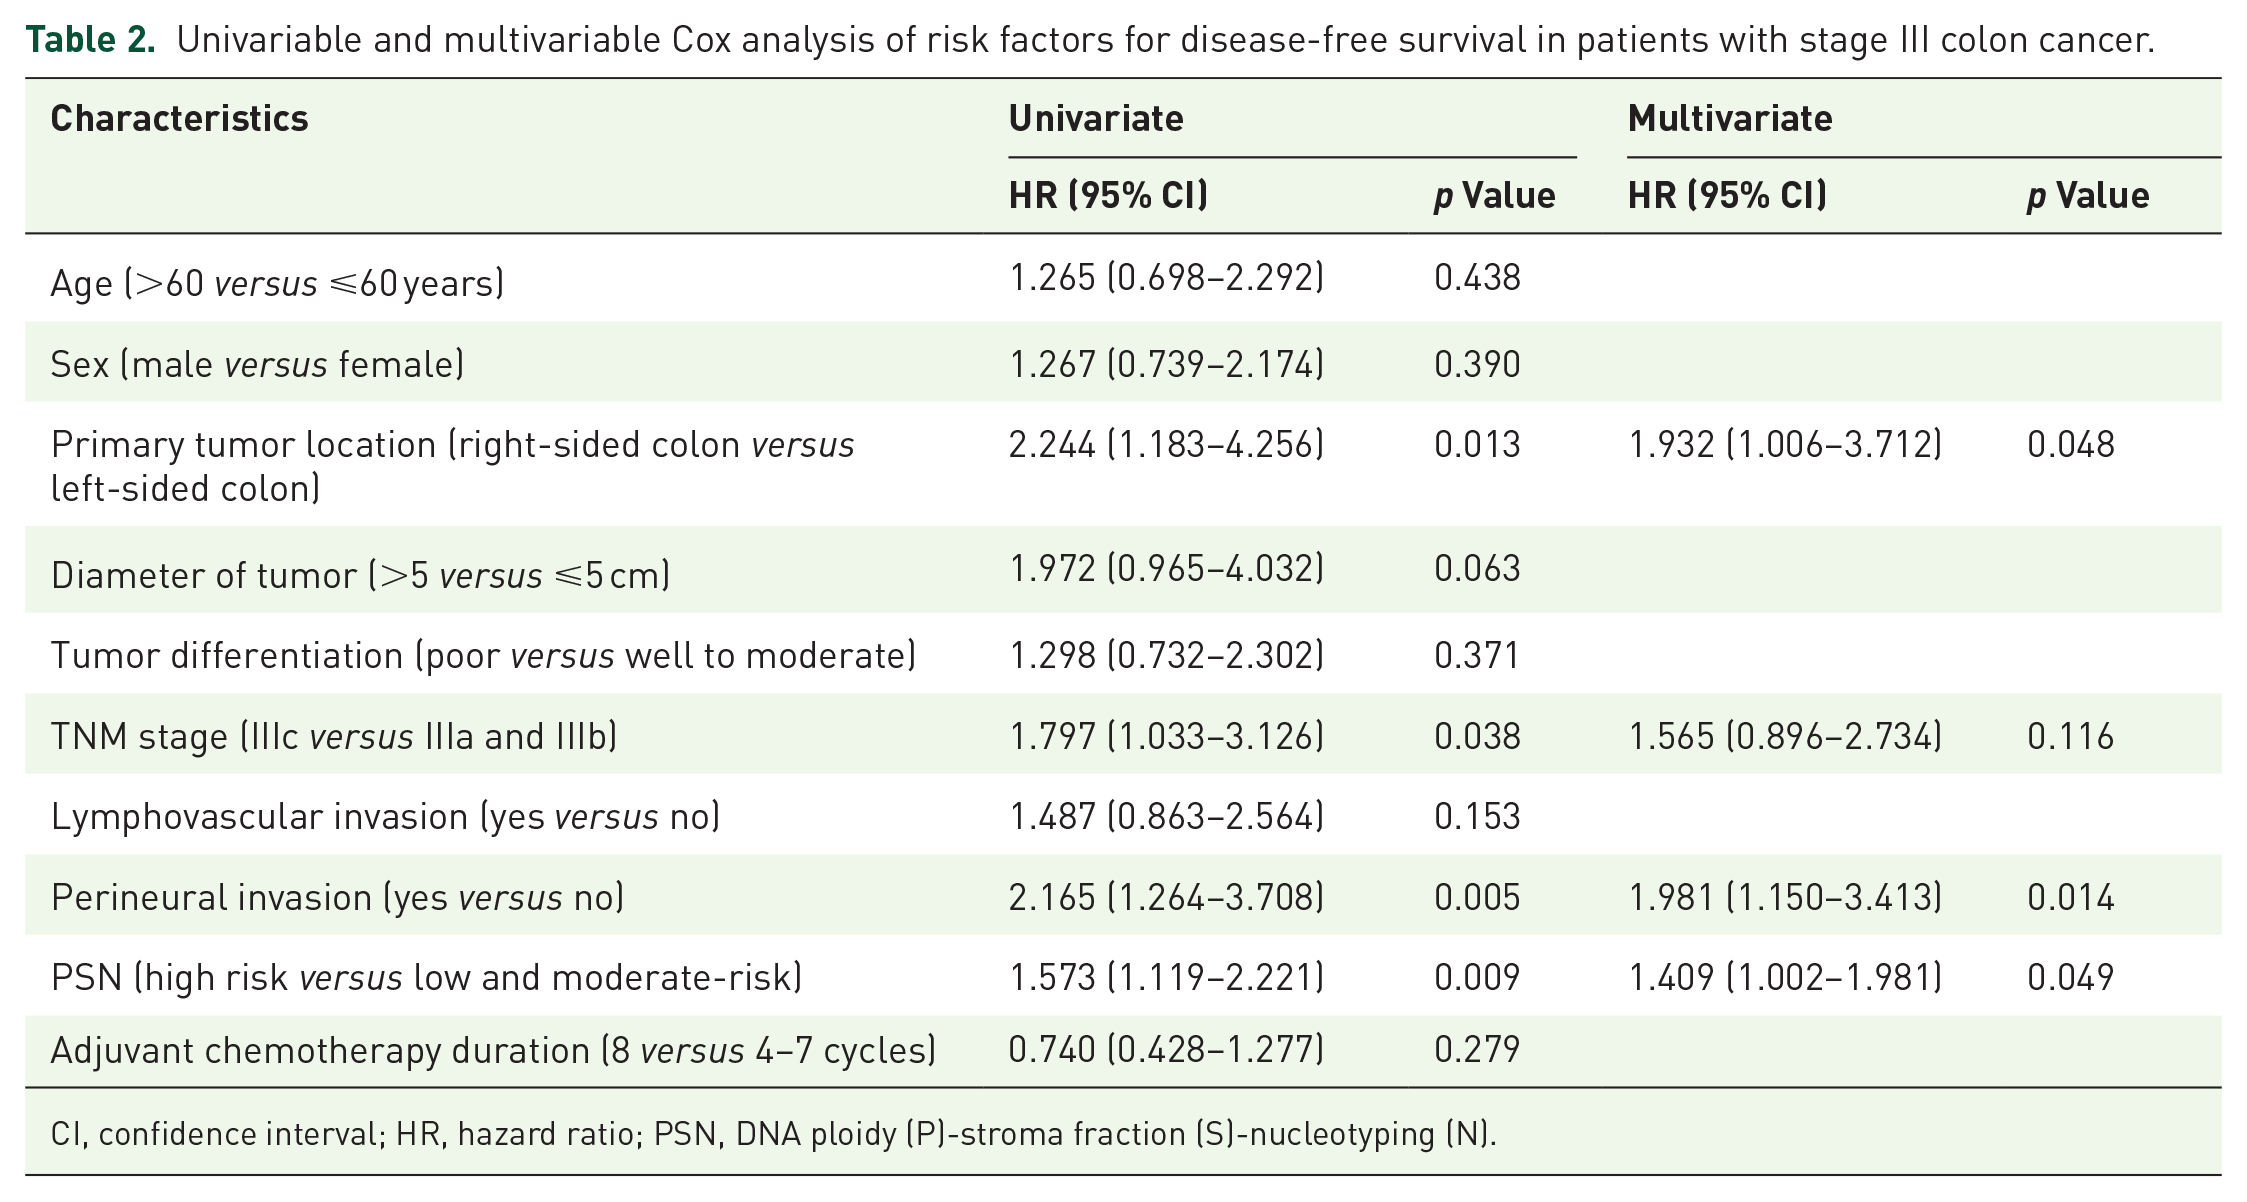
CI, confidence interval; HR, hazard ratio; PSN, DNA ploidy (P)-stroma fraction (S)-nucleotyping (N).
Univariable and multivariable Cox analysis of risk factors for overall survival in patients with stage III colon cancer.
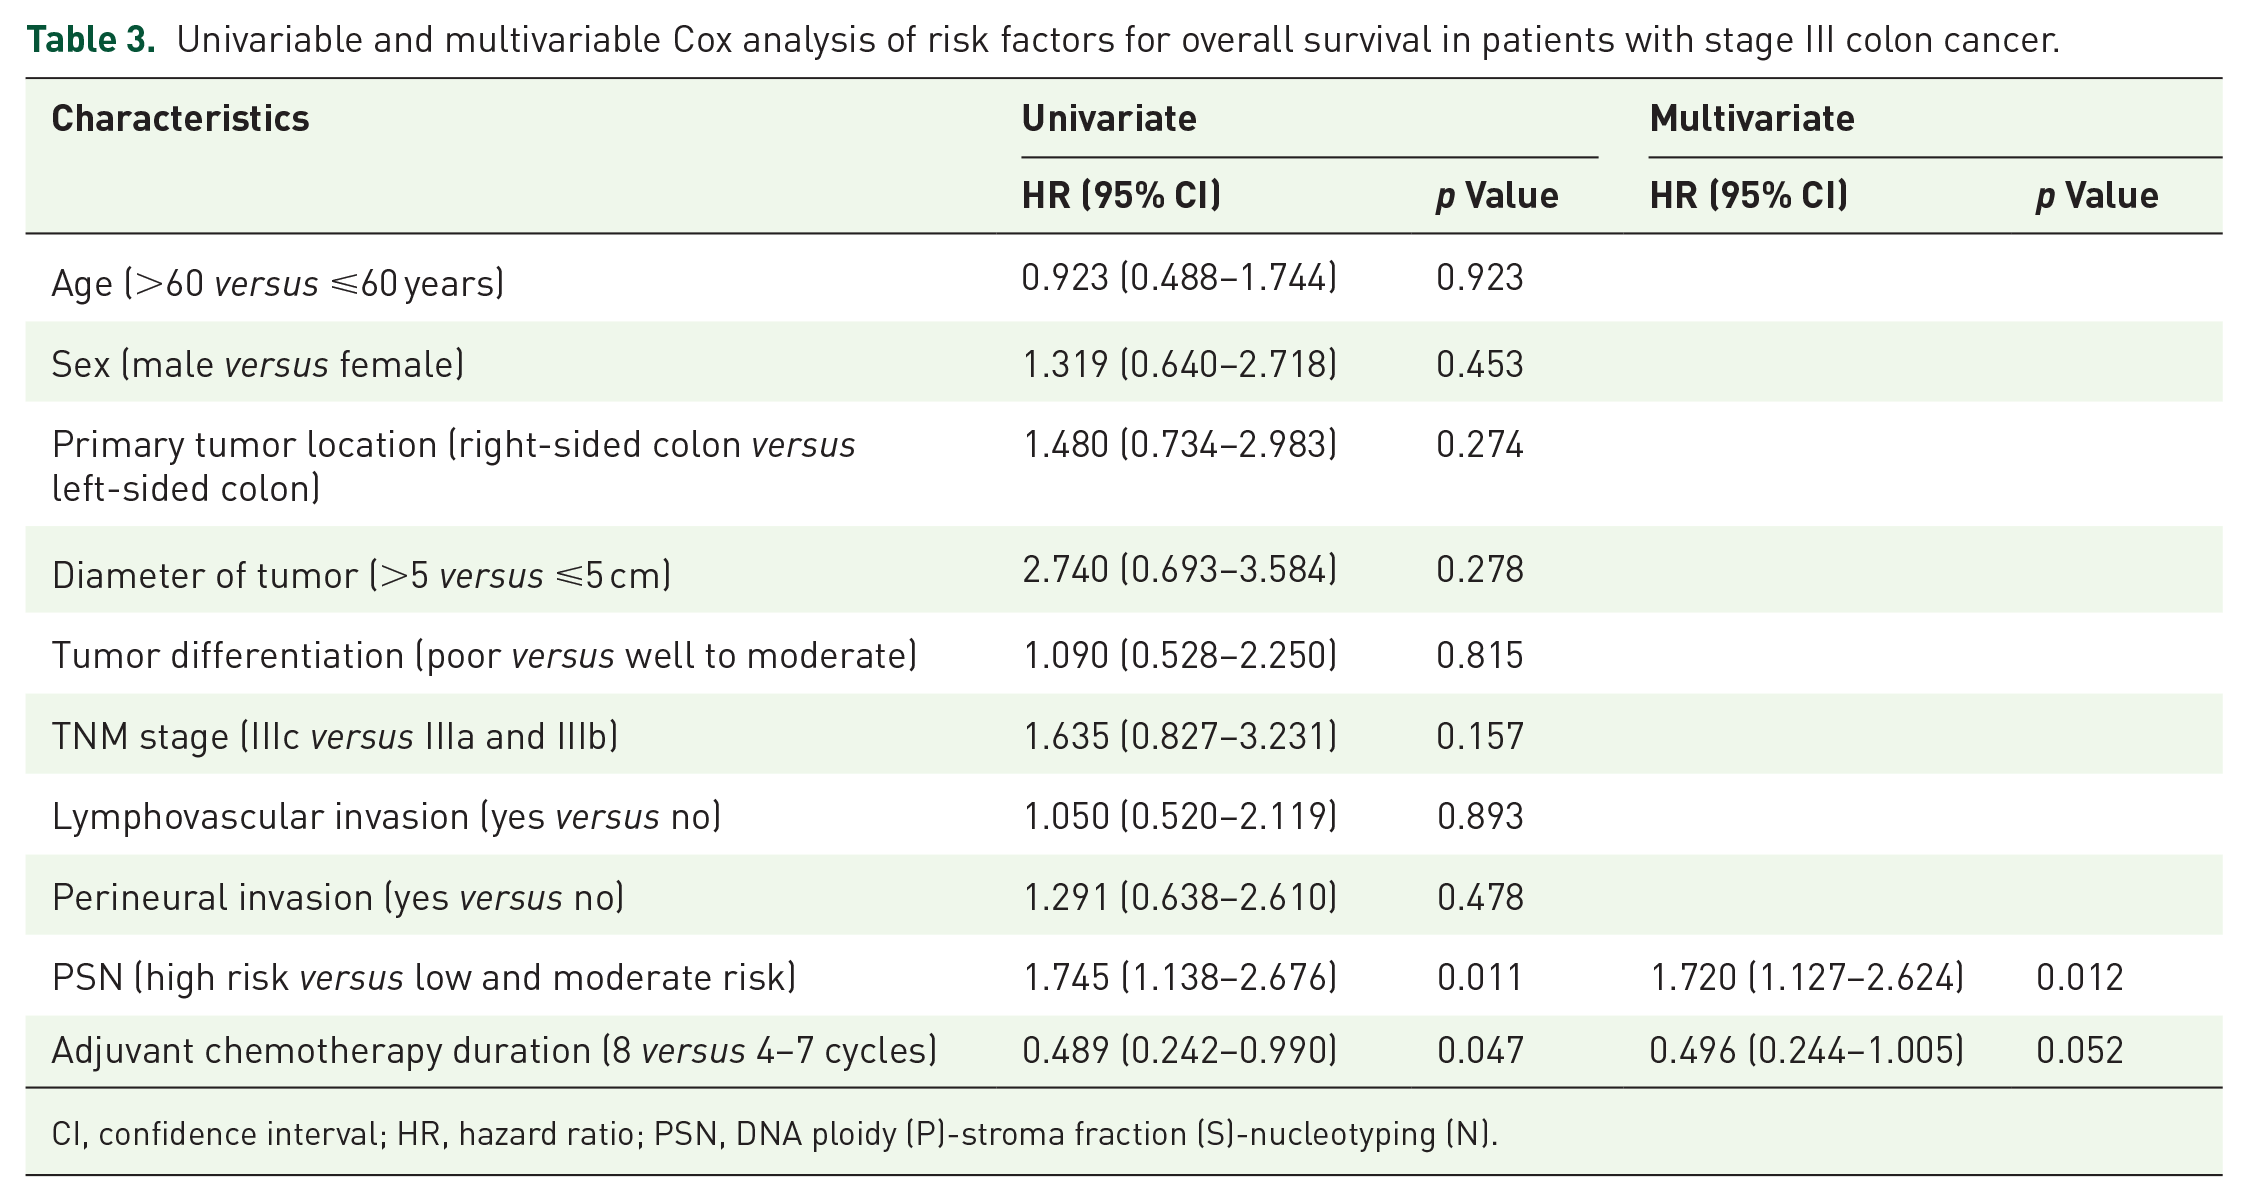
CI, confidence interval; HR, hazard ratio; PSN, DNA ploidy (P)-stroma fraction (S)-nucleotyping (N).
Construction DFS predicting model with incorporation of PSN panel
A nomogram model was constructed to predict DFS by integrating all risk factors identified in the multivariate Cox regression analysis, including PSN, perineural invasion, and tumor location [Figure 2(a)]. Comparing the models before and after the inclusion of the PSN, the PSN panel inclusive model exhibited a superior C-index [0.651 versus 0.632, p = 0.048, Figure 2(b)] for DFS prediction. The nomogram model, formulated by combining PSN, perineural invasion, and tumor location, yielded a markedly higher C-index compared to the pathological TNM stage for DFS prediction [0.651 versus 0.558, p = 0.001, Figure 2(c)]. In internal verification, the calculated C-index were 0.683, indicating that the nomogram model had good discrimination. Time-dependent ROC curves were subsequently plotted for both the nomogram predictive model and pathological TNM stage. The AUC for the predictive model was significantly higher than pathological TNM stage for predicting 5-year DFS [0.692 versus 0.553, p = 0.020, Figure 2(d)] and 10-year DFS [0.694 versus 0.532, p = 0.006, Figure 2(e)].
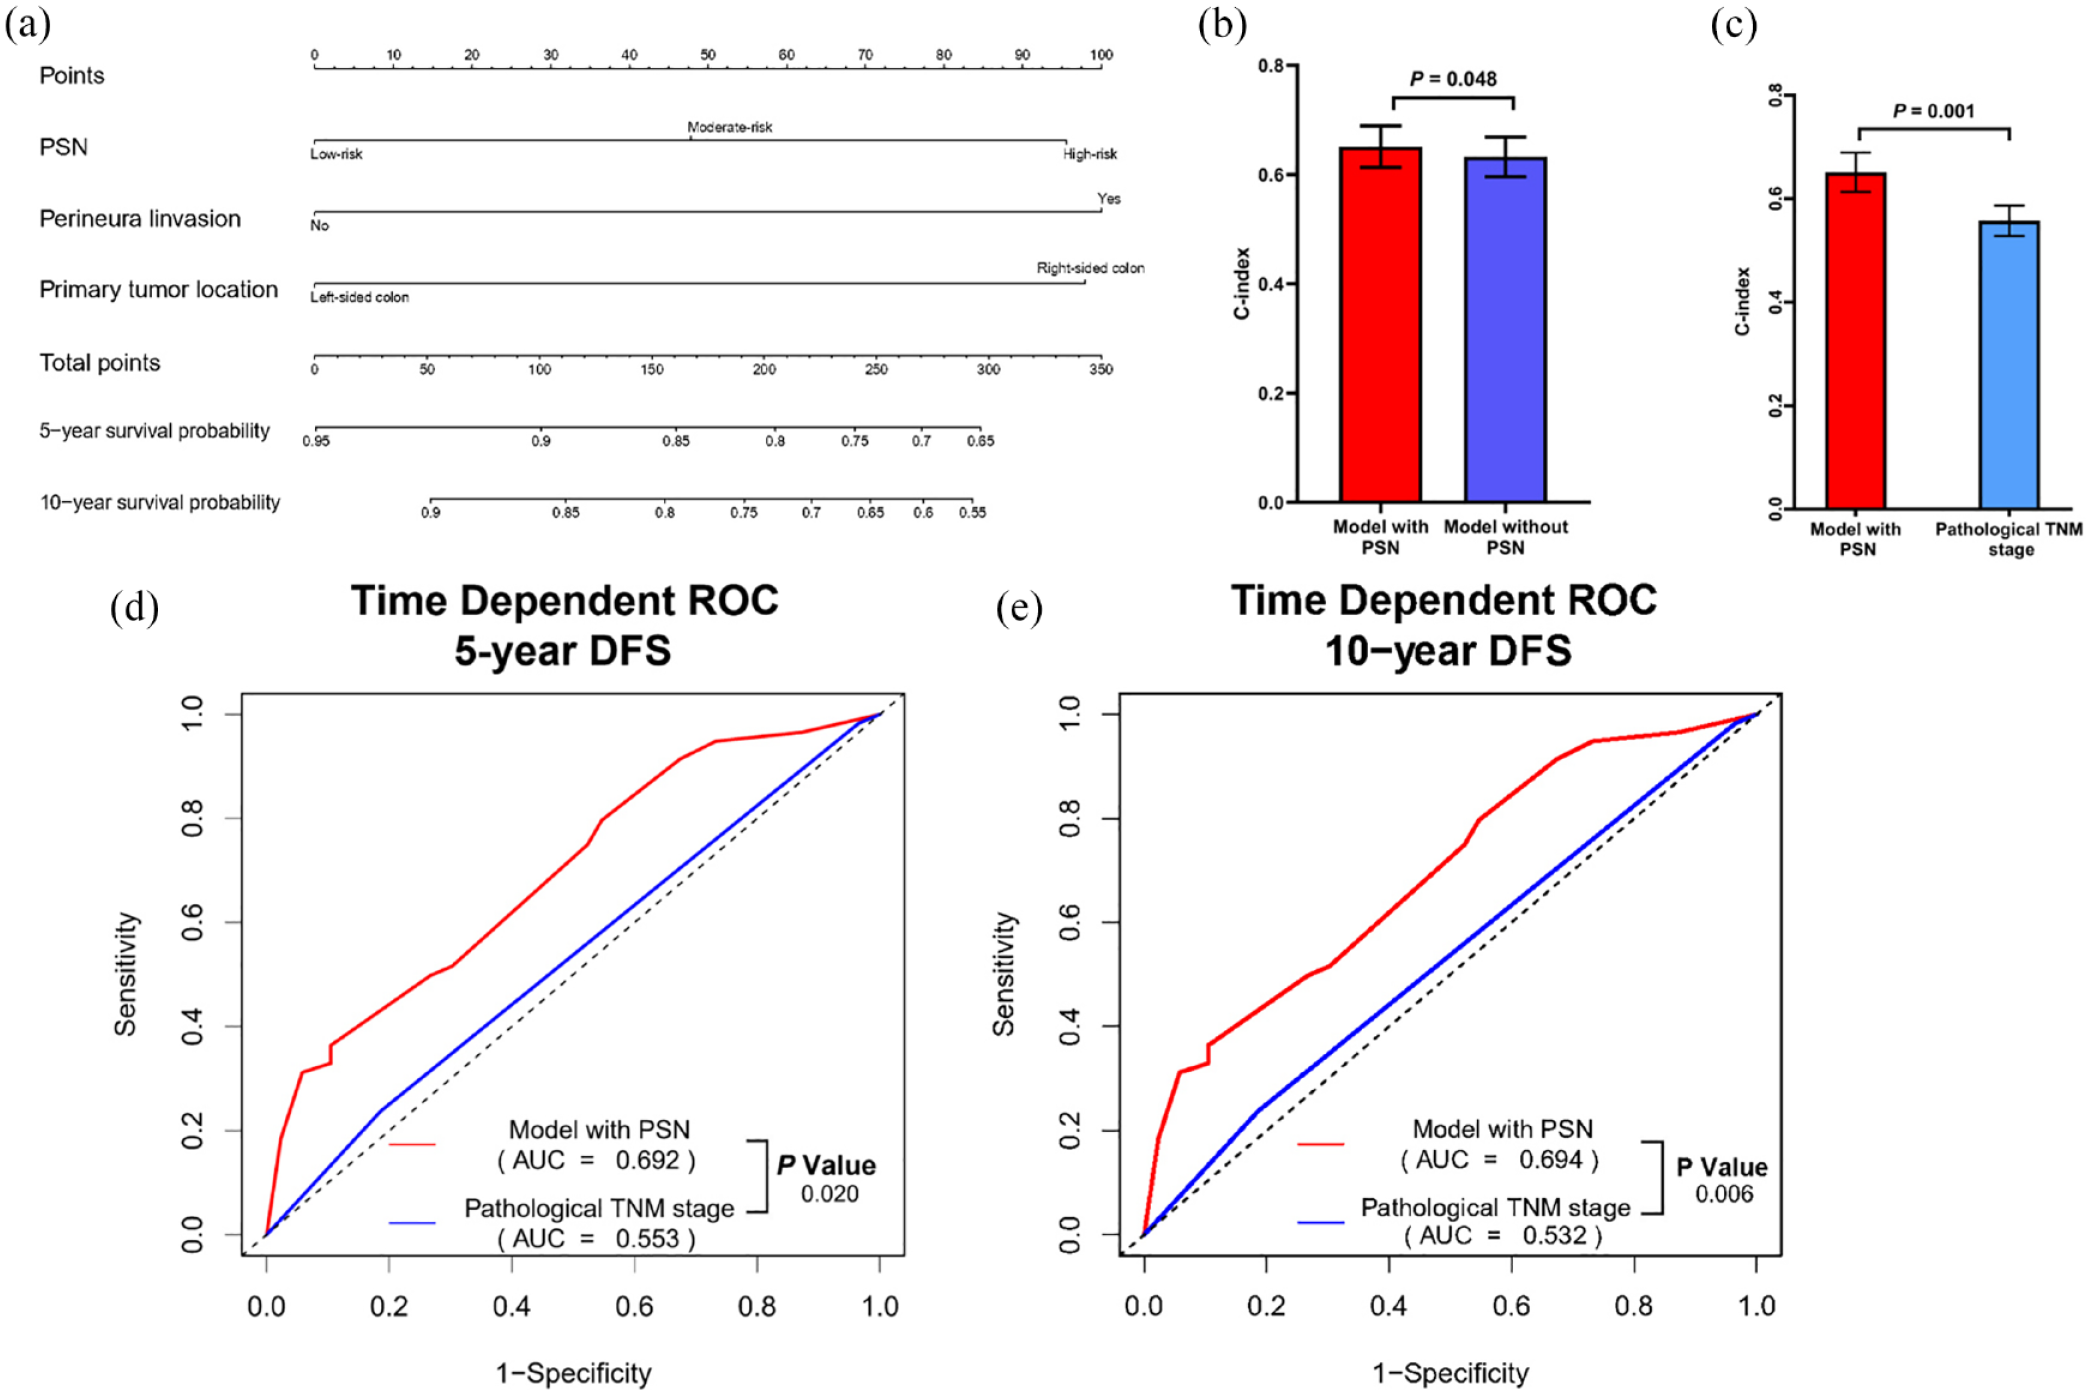
Model performance in DFS prediction by incorporating the PSN panel. (a) Nomogram model construction based on PSN panel, tumor location, and perineural invasion for predicting 5-year and 10-year DFS. (b) Comparison of C-index with 95% CI in predicting DFS in nomogram model with and without PSN. (c) Comparison of C-index with 95% CI in predicting DFS between the nomogram model with PSN and pathological TNM stage. (d) Comparison of time-dependent ROC curves for 5-year DFS prediction between model with PSN and pathological TNM stage. (e) Comparison of time-dependent ROC curves for 10-year DFS prediction between model with PSN and pathological TNM stage.
Prognostic analysis of different adjuvant chemotherapy duration with respect to PSN status
Among all patients, no significant difference was observed in the 5-year DFS rate between patients who received four to seven cycles of CapOX and those who completed eight cycles of CapOX [84.67% versus 85.52%, p = 0.278, Figure 3(a)], while 5-year OS rate was significantly lower in patients receiving four to seven cycles of CapOX than those with eight cycles of CapOX [93.36% versus 94.32%, p = 0.043, Figure 3(b)]. In PSN low-risk group, no significant differences were noted in 5-year DFS and OS rates between those receiving four to seven cycles of CapOX and those completing eight cycles of CapOX [DFS: 94.38% versus 89.05%, p = 0.461; OS: 97.78% versus 91.68%, p = 0.809, Figure 3(c) and (d)]. Similarly, the PSN moderate risk group also exhibited the comparable 5-year DFS and OS rates between those receiving four to seven cycles of CapOX and those completing eight cycles of CapOX (DFS: 86.27% versus 81.23%, p = 0.924; OS: 95.91% versus 92.20%, p = 0.998, Figure 3(e) and (f)]. However, in the PSN high-risk group, patients who completed eight cycles of CapOX adjuvant chemotherapy showed significantly better 5-year DFS and OS rates than those who received four to seven cycles [DFS: 89.43% versus 71.52%, p = 0.026; OS: 96.77% versus 85.46%, p = 0.007, Figure 3(g) and (h)]. Univariable and multivariable analyses were conducted to explore factors impacting DFS and OS in PSN high-risk group patients. Univariable analysis indicated that TMN stage IIIc (HR = 2.616, 95% CI: 1.120–6.106, p = 0.026), perineural invasion (HR = 3.045, 95% CI: 1.287–7.208, p = 0.011), and eight cycles of adjuvant chemotherapy (HR = 0.310, 95% CI: 0.104–0.926, p = 0.036) were significant factors for DFS in this group (Supplemental Table S1). Additionally, eight cycles of adjuvant chemotherapy (HR = 0.310, 95% CI: 0.104–0.926, p = 0.036) were identified as a risk factor for OS (Supplemental Table S2). Multivariable analyses suggested that perineural invasion (HR = 3.045, 95% CI: 1.287–7.208, p = 0.011) and eight cycles of adjuvant chemotherapy (HR = 0.253, 95% CI: 0.083–0.772, p = 0.016) were independent predictors of DFS in the PSN high-risk group.

Kaplan–Meier survival analysis of DFS and OS in stage III colon cancer patients between adjuvant chemotherapy four–seven cycle and eight cycle stratified by different PSN risk groups. (a) DFS for total patients. (b) OS for total patients. (c) DFS for PSN low-risk group. (d) DFS for PSN low-risk group. (e) DFS for PSN moderate risk group. (f) OS for PSN moderate risk group. (g) DFS for PSN high-risk group. (h) OS for PSN high-risk group.
Discussion
Beyond TNM staging, diagnosis complemented by specific pathological factors calls for a refinement of stage III colon cancer risk classifications. Herein, our study applied the PSN panel, assessed using a digital pathology imaging system, to confirm the prognostic classifications for stage III colon cancer. Furthermore, we determined the benefit of adequate adjuvant chemotherapy duration for different risk groups based on PSN panel. As the results, three significant findings from this study were noted: (1) PSN emerged as an effective prognostic tool for predicting 5-year DFS and OS in patients with stage III colon cancer, (2) prognostic model with incorporation of PSN demonstrated significantly superior DFS predictive efficiency by comparing with TNM stage, (3) PSN could serve as therapeutic indicator for the efficacy of sufficient duration of adjuvant chemotherapy for different risk patients.
A previous study demonstrated that the combination of DNA ploidy, stroma, and nucleotyping could predict prognosis in stage II CRC patients. 18 As recent study reported that the combination of DNA ploidy and stroma (PS) could predict the prognosis of stage III CRC patients with low-risk clinical characteristics. 25 Both studies included patients with rectal cancer and defective mismatch repair, while our current study only focuses on stage III colon cancer with pMMR. According to the classification of PSN panel, patients with diploidy, low stroma, and chromatin homogeneous tumors were classified as the low-risk group, patient with one high-risk factor (non-diploidy, high stroma, or CHE) were classified as the moderate risk group, patients with two or three high-risk factors were classified into the high-risk group. Similar to previous studies, 18 the PSN high-risk group presented had the worst 5-year DFS and OS rates among the three risk groups. This result was verified both in univariate or multivariable analyses. Based on the result, our study confirmed that combination of PSN could provide both objective and effective information to guide recurrence risk classification in stage III colon cancer.
It is noteworthy that in our continuous cohort, the clinical staging results derived from the TNM system revealed a lower proportion of stage IIIa (6%) and IIIc (15.7%) patients, while the major proportion of the patients were classified into IIIb (78.3%). This suggests that the current clinical staging may not effectively differentiate the risk levels among stage III colon cancer patients. TNM stage alone does not solely determine postoperative recurrence and metastasis in stage III colon cancer patients. Prior retrospective studies have demonstrated that in stage III colon cancer patients undergoing curative surgery and postoperative adjuvant chemotherapy, those with right colon cancer have demonstrated poorer DFS and OS.26–28 Moreover, factors including lymphovascular invasion, perineural invasion, and the presence of tumor deposits have been linked to a poor prognosis in stage III colon cancer.11,12 The current study identified perineural invasion, right-sided colon tumor location, and the PSN high-risk group as the independent risk factors associated with worse DFS. Integrating the PSN panel with readily accessible clinical and pathological indicators can enhance the predictive accuracy of DFS. Moreover, the prognostic model integrating PSN panel showed better accuracy in predicting both 5-year and 10-year DFS compared to TNM stage. Therefore, the risk model is suitable for stage III colon cancer through objective tumor pathological characteristics, which can refine the prognostic stratification of patients, further identify patients who were previously considered to be at low risk of recurrence as high-risk patients.
Since the year 2004, the combination of oxaliplatin with fluorouracil as a postoperative adjuvant chemotherapy regimen has been recognized as the standard treatment for stage III colon cancer patients. 29 According to current National Comprehensive Cancer Network (NCCN) and European Society for Medical Oncology (ESMO) guidelines, a 6-month duration of adjuvant chemotherapy is recommended for high-risk stage III colon cancer patients.4,5 However, our previous reports indicated that extended chemotherapy duration resulted in 70% of patients experiencing oxaliplatin-induced peripheral neuropathy, leading to 20–30% of patients being unable to finish the complete treatment course due to adverse effects.10,30 As a result, with the goal of minimizing side effects of chemotherapy without impairing their survival outcomes, the identification of appropriate biomarkers for stratifying the prognostic risk is crucial in developing individualized adjuvant chemotherapy strategies for stage III colon cancer patients. Li et al. 25 reported that DNA PS low-risk group that received more than 3 months of chemotherapy had a better 5-year OS rate than those received less than 3 months of chemotherapy in stage III CRC but not in PS high-risk group. On the contrary, our findings revealed that significant survival benefits from the eight cycles of CapOX adjuvant chemotherapy were only observed in PSN high-risk patients but not in low-risk and moderate-risk groups. The inconsistent results may be attributed that Li et al. study only enrolled the low-risk patients with stage IIIa–IIIb patients, which had a better prognosis and no significant benefit from more than 3 months of chemotherapy in the total cohort of patients. Our previous studies supported the hypothesis that excessive adjuvant chemotherapy fails to prolong the survival of stage III colon cancer patients with a low risk of recurrence. 10 Additionally, our study primarily enrolled the patients with stage IIIb–IIIc who receiving at least 3 months of adjuvant chemotherapy. The survival results in total cohort patients showed that 5-year OS rate was significantly better in patients receiving eight cycles of CapOX than those with four to seven cycles of CapOX, indicating that longer duration of adjuvant chemotherapy is the better way to achieve a survival benefit in high-risk patients. Based on the results of the current study, we suggested that four to seven cycles of CapOX might suffice for the PSN low-risk and moderate-risk group, while for PSN high-risk group, the eight cycles of CapOX should be warranted in order to minimize the risk of recurrence. Therefore, these findings suggest that a novel strategy based on PSN assessment could facilitate personalized management of adjuvant chemotherapy in stage III colon cancer.
Additionally, the prognostic value of DNA ploidy, nucleotyping, and stroma fraction were separately evaluated as biomarkers in stage III colon cancer. Our result revealed that patients with a high-stroma fraction had worse 5-year DFS and OS rates than those with a low stroma fraction. Previous findings also indicate that stroma fraction serves as a reliable predictor for both DFS and OS, consistent with prior studies.23,31 Comprising fibroblasts, myofibroblasts, endothelial cells, and cells implicated in inflammation and immune infiltration, the stroma fraction contributes growth factors, cytokines, and metabolites to the tumor, promoting angiogenesis and inducing epithelial–mesenchymal transition. 32 Consequently, a high-stroma fraction may represent a metastatic phenotype of tumor cells, elucidating the substantial predictive capacity of this biomarker in colon cancer with lymph node metastasis.
Our study has certain limitations. Primarily, this study is subject to the inherent limitations and biases typical of single-institution retrospective analyses by including a limited number of patients, which resulted in potential selection bias. Herein, the sample size needs to be expanded, and a validation cohort will be required to further confirm the prognostic value of PSN in guiding adjuvant chemotherapy in our future work. Secondly, the data on 5-year survival outcomes were unavailable for some patients due to an insufficient follow-up duration. This issue may have led to the underestimation or overestimation of the prognostic value of PSN. Furthermore, the lack of genetic mutation data will miss the critical information for prognosis, including crucial mutations like KRAS and BRAF V600E, which have been linked to different recurrence risks of stage III colon cancer.33,34 It is anticipated that future research will acquire such genetic information and integrate it with the PSN panel to improve predictive accuracy.
Conclusion
This study applied the PSN panel, combining DNA ploidy, stroma fraction, and nucleotyping, and successfully classified patients with stage III colon cancer into different prognostic risk groups. PSN panel could further provide precise information for guiding the duration of adjuvant chemotherapy for stage III colon cancer patients.
Supplemental Material
sj-docx-1-tam-10.1177_17588359241260575 – Supplemental material for Combination of DNA ploidy, stroma, and nucleotyping predicting prognosis and tailoring adjuvant chemotherapy duration in stage III colon cancer
Supplemental material, sj-docx-1-tam-10.1177_17588359241260575 for Combination of DNA ploidy, stroma, and nucleotyping predicting prognosis and tailoring adjuvant chemotherapy duration in stage III colon cancer by Jianhong Peng, Weili Zhang, Jiahua He, Weifeng Wang, Weihao Li, Lijun Mao, Yuejin Dong, Zhenhai Lu, Zhizhong Pan, Chi Zhou and Xiaojun Wu in Therapeutic Advances in Medical Oncology
Footnotes
Acknowledgements
We greatly appreciate the help from the pathologists Songran Liu and Shixun Lu from the Department of Pathology at Sun Yat-sen University Cancer Center for tumor block and tumor region selection.
Declarations
Supplemental material
Supplemental material for this article is available online.
References
Supplementary Material
Please find the following supplemental material available below.
For Open Access articles published under a Creative Commons License, all supplemental material carries the same license as the article it is associated with.
For non-Open Access articles published, all supplemental material carries a non-exclusive license, and permission requests for re-use of supplemental material or any part of supplemental material shall be sent directly to the copyright owner as specified in the copyright notice associated with the article.