
Abstract
Background:
All stage III colon cancer (CC) patients are recommended adjuvant chemotherapy (ACT) after surgery, while over half are already cured by surgery alone. The prognostic biomarker circulating tumor DNA (ctDNA) could potentially guide the decision on whom to withhold ACT.
Objective:
We assessed the cost-effectiveness of ctDNA-guided ACT de-escalation in stage III CC.
Design:
A decision model “PATTERN-stageIII” simulates CC from diagnosis till death in surgically treated stage III patients.
Methods:
We evaluated administering ACT in all patients (i.e., All ACT strategy), and three ACT de-escalation strategies by omitting ACT in patients who are (Strategy 1) both pT1-3N1 and ctDNA-negative, (Strategy 2) pT1-3N1, have no vascular invasion, and are ctDNA-negative, and (Strategy 3) pT1-2N1 and ctDNA-negative. For each strategy, costs, quality-adjusted life years (QALYs), and net monetary benefit were estimated. Sensitivity analyses assessed changes in ACT effectiveness and ctDNA-related parameters.
Results:
In de-escalation strategies 1, 2, and 3, respectively, 52%, 61%, and 88% of patients were predicted to receive ACT, thereby losing 0.322, 0.237, and 0.034 QALYs per person. The “All ACT strategy” was preferred in terms of cost-effectiveness. Sensitivity analyses demonstrated scenarios where ctDNA-guided de-escalation strategies were cost-effective compared to “All ACT,” including improved ACT treatment effect in ctDNA-positive patients, higher ctDNA positivity rates, enhanced ctDNA prognostic value, and/or reduced ctDNA testing costs.
Conclusion:
ctDNA-guided strategies for ACT de-escalation are currently not cost-effective compared to an “All ACT strategy.” One explanation is the non-negligible recurrence risk in ctDNA-negative patients. ctDNA-guided strategies could potentially become cost-effective if more than two ctDNA-related parameters improve simultaneously.
Introduction
In stage III colon cancer (CC), standard treatment in the Netherlands involves surgery and subsequent adjuvant chemotherapy (ACT) for all patients. However, approximately 55% of patients are already cured by the surgery alone and are unnecessarily exposed to the side effects of ACT.1,2 A personalized approach to identify patients who are already cured by surgery may reduce this overtreatment. 3
Post-surgery circulating tumor DNA (ctDNA) is a strong prognostic biomarker for recurrence in colorectal cancer, independent of other clinicopathological features.4 –6 Detectable ctDNA post-surgery indicates the presence of minimal residual disease (MRD) and a high risk of recurrence.7,8 Combining clinical risk factors with post-surgery ctDNA status could potentially improve the existing stratification of CC patients into high-risk and low-risk groups for recurrence. 4 Note that this existing classification is based on pT stage and pN stage, but it is not used in the Netherlands to inform ACT decisions, given their limited prognostic value.
Currently, many randomized clinical trials are collecting evidence on the clinical utility of ctDNA-guided strategies for ACT decisions in colorectal cancer. 9 Most of these studies focus on using ctDNA testing for MRD detection to guide treatment escalation, while only a few investigate the potential of ctDNA-guided de-escalation of treatment.10,11 Although patients with detectable ctDNA post-surgery are highly likely to experience a recurrence, it is not (yet) a perfect biomarker to identify patients cured by surgery alone, as the recurrence rate in ctDNA-negative patients is not negligible.4,12
While clinical trials are still ongoing, conducting early model-based cost-effectiveness analyses gives insight into the potential of ctDNA-guided strategies for ACT decisions. The results can help to guide product development, explore next steps for clinical research, and identify key factors influencing implementation. Two previous modeling studies have explored the potential cost-effectiveness of ctDNA-guided ACT decisions in CC in the Netherlands and in Australia, but they focused on stage II CC. The Australian study indicated that ctDNA-guided strategies could be more effective and less costly than the current standard of care in Australia. 13 In the Netherlands, a ctDNA-guided strategy for ACT selection was more effective only if it was combined with clinicopathological risk factors (pT4 and mismatch repair status), but such a strategy was too costly to be cost-effective. 14 The different outcomes of the studies stem from varying assumptions for crucial model parameters, including a substantially higher prognostic value of ctDNA in the Australian study, and the Dutch study focusing on treatment escalation, while in the Australian study, ACT delivery was reduced in ctDNA-based strategies.
No study has evaluated the cost-effectiveness of ctDNA-guided de-escalation of ACT in surgically treated stage III CC. We performed an early model-based evaluation to evaluate the potential of ctDNA-guided de-escalation for it in the Netherlands, exploring the impact of major uncertainties as well as the conditions for a safe and cost-effective ctDNA-guided strategy in extensive sensitivity analyses.
Materials and methods
The PATTERN-stage III model
The PATTERN-stage III model is an adaptation of the PATTERN model, previously developed to evaluate personalized treatment with ACT in stage II CC. 15 In brief, the PATTERN-stage III model is a Markov cohort model and describes the treatment and progression of CC from diagnosis to death, taking into account clinical, pathological, and biomarker features of the patient population. The model has a lifelong time horizon, a 1-month cycle length, and has five health states: “diagnosis,” “90-day mortality after surgery,” “recurrence,” “death due to CC,” and “death due to other causes” (Figure 1). The monthly probability to transit from “diagnosis” to “90-day mortality after surgery” is assumed to be constant, while all other transitions are quantified using parametric time-to-event distributions.

The PATTERN-stage III model for ACT-treated stage III CC patients.
For this study, we re-parametrized the model to simulate a cohort of 1000 stage III CC patients treated with curative surgery and ACT using data obtained from the Netherlands Cancer Registry (NCR). 16 This dataset contained 2654 stage II and stage III CC patients diagnosed between July 1 and December 31, 2015, with complete resection of the tumor, of whom 799 had stage III disease and received ACT (Table 1). The dataset included information on patient and tumor characteristics, treatment, recurrence, and vital status. The median follow-up time was 73 months.
Patient characteristics of ACT-treated stage III CC patients from the NCR dataset and PROVENC3 study.
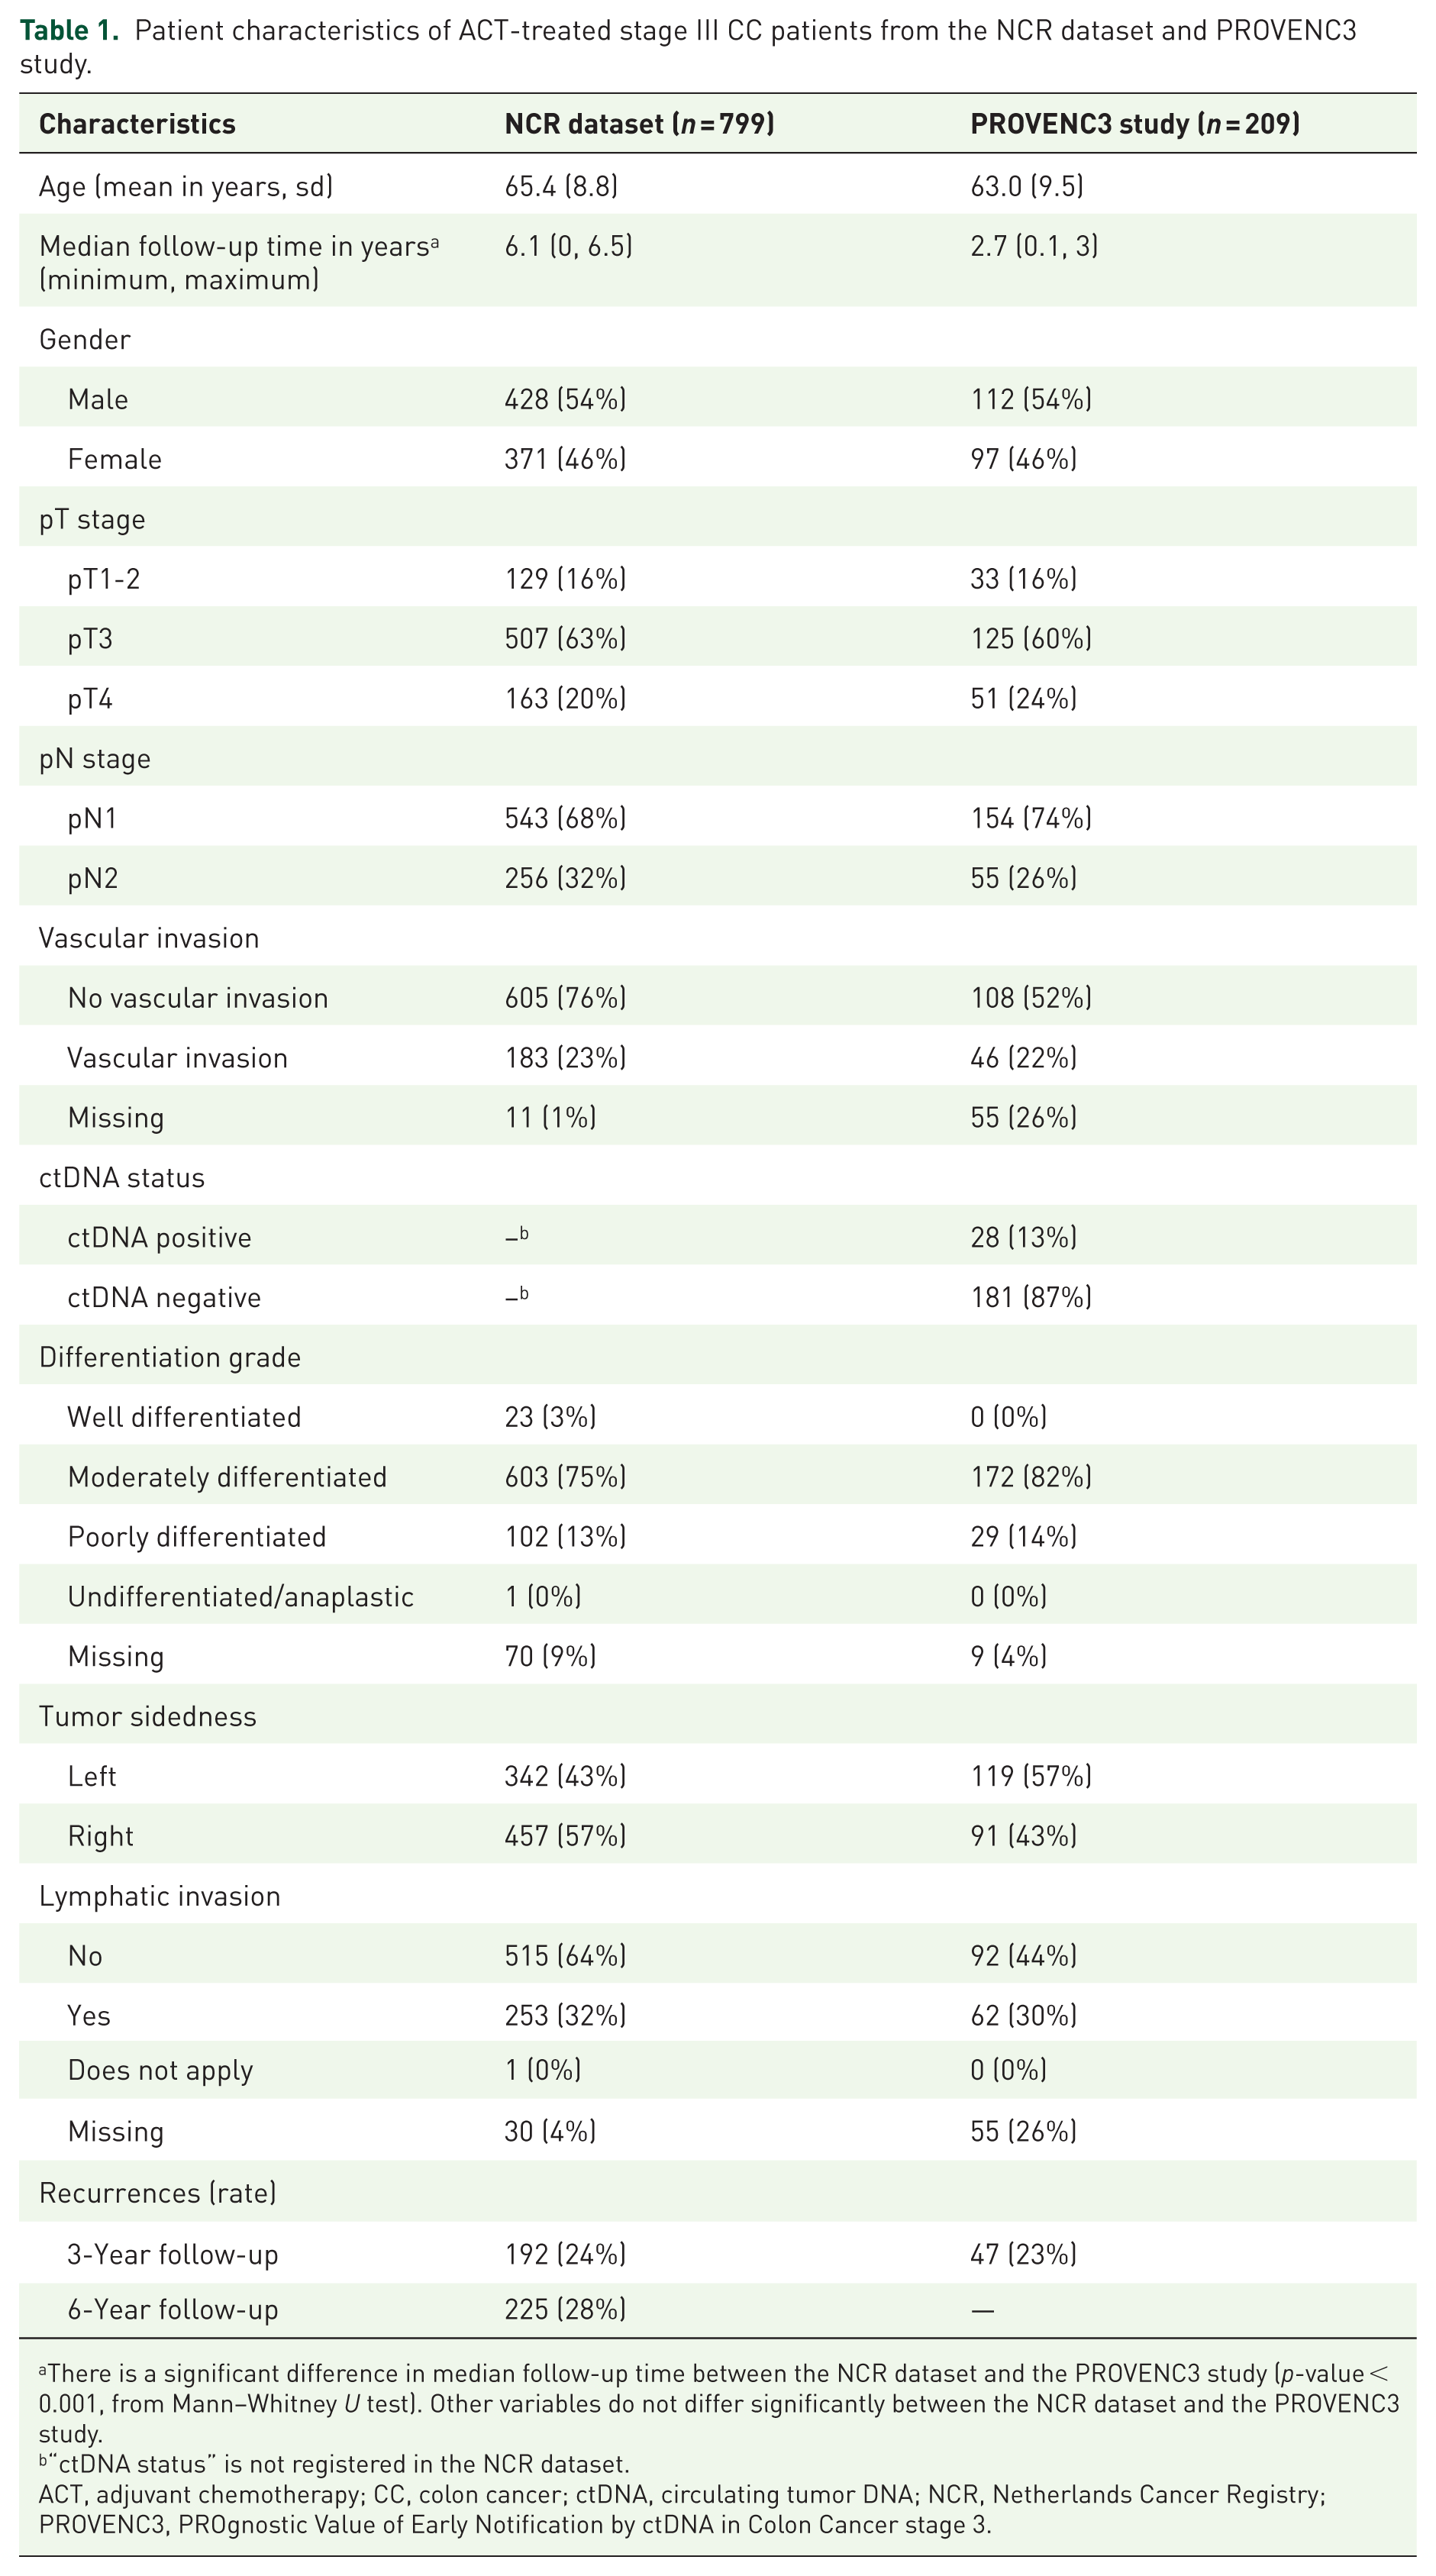
There is a significant difference in median follow-up time between the NCR dataset and the PROVENC3 study (p-value < 0.001, from Mann–Whitney U test). Other variables do not differ significantly between the NCR dataset and the PROVENC3 study.
“ctDNA status” is not registered in the NCR dataset.
ACT, adjuvant chemotherapy; CC, colon cancer; ctDNA, circulating tumor DNA; NCR, Netherlands Cancer Registry; PROVENC3, PROgnostic Value of Early Notification by ctDNA in Colon Cancer stage 3.
All model transitions were re-parametrized as follows: For transition 1 (“diagnosis” to “90-day mortality after surgery”), the time-independent probability to die within 90 days after surgery was re-estimated based on the combined population of ACT-treated and untreated stage II and III CC patients (n = 2654). The two stages were combined as similar surgical mortality is expected, and because of the overall low event rate. This transition includes the covariate age. Patients who died after a recurrence within 90 days were excluded from the estimation.
For all other transitions, parametric survival models were re-fitted, including the relevant stage III covariates, based on subpopulations with stage III CC patients who received ACT. Note that this implies that the adapted PATTERN-stage III model simulates ACT-treated stage III CC patients. Distributions of the parametric survival models were based on visual inspection and the lowest Akaike Information Criterion.
Transition 2 (“diagnosis” to “death due to other causes”) includes the covariate age and follows a Gompertz distribution. It was estimated using ACT-treated stage III CC patients (n = 792). This transition is only possible as of cycle 4, following 90-day mortality, thereby excluding patients who died within 3 months of surgery. Patients who had a recurrence before death were censored at the time of recurrence.
For transition 3 (“diagnosis” to “recurrence”), the prognostic value of the following covariates was tested: age, pT stage, pN stage, differentiation grade, vascular invasion (VI), tumor sidedness, and lymphatic invasion, based on clinical relevance and data availability. Based on a forward selection procedure and expert discussion, this transition included the covariates pT stage, pN stage, and VI, and followed a Gompertz distribution. Although VI is not commonly used in clinical practice to guide treatment decisions in stage III CC, we included it in our model since it significantly improved prediction accuracy. Patients included in the subpopulation for estimating this transition were ACT-treated stage III patients (n = 786), excluding those with missing values for one of the covariates. Patients who died without a prior recurrence were censored.
For transition 4 (“recurrence” to “death due to other causes”) and 5 (“recurrence” to “death due to CC”), the first time to death after a recurrence (transition 4 + transition 5) was estimated since the cause of death was missing in the dataset. Age was included as a covariate, and a Weibull distribution was followed. Next, transition 4 and transition 5 were split by assuming that the transition rate of transition 4 is equal to that of transition 2 (“diagnosis” to “death due to other causes”). The remaining deaths were assumed to be due to CC. Patients included for estimating these two transitions were ACT-treated stage III patients who experienced a recurrence (n = 221).
The adapted PATTERN-stageIII model uses the covariates to define subgroups with distinct characteristics in the simulated cohort. These subgroups are separately simulated and subsequently weighted to reflect the Dutch stage III CC population treated with ACT (Table 1). Table S1 provides an overview of transition parameters in the adapted PATTERN-stageIII model.
The model was internally validated by comparing its predicted recurrence rates to those of the NCR data at 12, 36, and 78 months. The model passed this internal validation check when the predicted recurrence rates fell within the 95% confidence intervals of the NCR data (Table S2).
Inclusion of ctDNA status
We supplemented the PATTERN-stage III model with post-surgical ctDNA status data, derived from the prospective observational study “PROVENC3” (PROgnostic Value of Early Notification by ctDNA in Colon Cancer stage 3), performed within the Prospective Dutch ColoRectal Cancer (PLCRC) cohort.17,18 This study investigated the prognostic value of ctDNA based on a single post-surgery blood draw in 209 stage III CC patients treated with ACT. Using a tumor-informed whole genome sequencing (WGS) approach for ctDNA testing, thereby analyzing the whole genome of tumor tissue, white blood cells, and blood plasma to identify specific somatic single nucleotide variants within plasma-derived cell-free DNA. 19 Patient accrual was completed in 2021, and the median follow-up time was 40 months (IQR 29–48 months).
In the PROVENC3 study, the median time point for the blood draw was 13 days (IQR 4–20 days) after surgery, and in 28/209 patients (13.4%), ctDNA was detected (i.e., ctDNA-positive test result). In total, 47/209 patients (22.5%) developed a recurrence within the follow-up period. Of the 28 ctDNA-positive patients, 18 developed a recurrence (64.3%), while 29 of 181 ctDNA-negative patients (16.0%) developed a recurrence. The hazard ratio (HR) for recurrence within 3 years was 6.3 (95% confidence interval (CI): 3.5–11.3) for ctDNA-positive versus ctDNA-negative patients after surgery. The ctDNA data from the PROVENC3 study were incorporated into the PATTERN-stage III model by assuming that 13.4% of the simulated patients were ctDNA-positive after surgery, and by adjusting transition 3 (“diagnosis” to “recurrence”) for the prognostic value of ctDNA (based on the HR of 6.3 for recurrence in ctDNA-positive vs ctDNA-negative patients).
The simulation model incorporates increased risk in ctDNA-positive patients in transition 3 (“diagnosis” to “recurrence”), with an HR for recurrence of ctDNA-positive patients versus the general population. Likewise, the lowered risk in ctDNA-negative patients is implemented as an HR for recurrence of ctDNA-negative patients versus the general population. The resulting HR for recurrence of ctDNA-positive versus ctDNA-negative patients, calculated using the PATTERN-stage III model output with 6.5 years follow-up time, was 4.6. This is lower than the HR in the PROVENC3 data, which is likely due to the different follow-up times (Table 1). However, this HR still fell within the corresponding 95% confidence interval (3.3–10.7) from the PROVENC3 study, and we increased the HR in subsequent sensitivity analyses.
Strategies
Four strategies were evaluated assuming 100% adherence. We first evaluated a strategy based on the current guideline in which all patients receive ACT (All ACT strategy). Subsequently, we evaluated three ctDNA-guided de-escalation strategies following discussions with the clinical expert team:
ctDNA-guided de-escalation Strategy 1 (withhold ACT in pT1-3N1 and ctDNA-negative): ACT is withheld in patients who are both pT1-3N1 and ctDNA-negative.
ctDNA-guided de-escalation Strategy 2 (withhold ACT in pT1-3N1, no VI, and ctDNA-negative): ACT is withheld in patients who are pT1-3N1, without VI, and ctDNA-negative.
ctDNA-guided de-escalation Strategy 3 (withhold ACT in pT1-2N1 and ctDNA-negative): ACT is withheld in patients who are both pT1-2N1 and ctDNA-negative.
We did not simulate strategies that relied solely on clinical factors without considering ctDNA status, since this paper aims to explore the potential of ctDNA to de-escalate ACT, and the PROVENC3 study found ctDNA to be the strongest predictor of recurrence risk. 17
Treatment effect of (no) ACT
The original PATTERN model was parameterized using data from stage II CC patients who were not treated with ACT. The effect of ACT was included in transition 3 (“diagnosis” to “recurrence”) by incorporating the treatment effect HR of ACT for those subgroups receiving ACT in the simulations.
As the adapted model is parameterized using data from ACT-treated stage III CC patients, the treatment effect HR for ACT was subtracted from transition 3 (“diagnosis” to “recurrence”) to simulate strategies in which ACT is omitted in subgroups.
The recommended ACT for stage III patients in the Netherlands is 3 months of capecitabine plus oxaliplatin (CAPOX), with a treatment effect HR of 0.731 for treated versus untreated patients, assumed to apply to all patients.20,21 In the PATTERN-stage III model, we adjusted transition 3 (“diagnosis” to “recurrence”) by incorporating the inverse of the treatment effect HR (i.e., 1/0.731) in subgroups where ACT was withheld.
Costs and health utilities
Table 2 provides an overview of costs and health. Health utilities were derived from quality of life data from the SCOT trial and from patient-level data of 859 Dutch patients diagnosed with stage II or III CC between 2011 and 2019, as part of the PLCRC study.22 –24 EQ-5D-5L scores were converted into utility scores using the Dutch tariff. 25 Costs were determined from a societal perspective. The PATTERN model already included costs for initial surgery, ACT, adverse events, work absenteeism, patient travel to the hospital, surveillance, and treatment for disease recurrence, all of which were updated to 2023 Euros using the consumer price index.21,26 –33 CtDNA testing costs were set to €3200 based on the rounded median tariff for WGS (billing code 050545) times two (i.e., WGS in both plasma and tissue) from 17 Dutch hospitals (academic and non-academic). 34 Costs were discounted by 3% and health effects by 1.5%, according to the Dutch guidelines for economic evaluations. 35
Model inputs for costs and utilities.
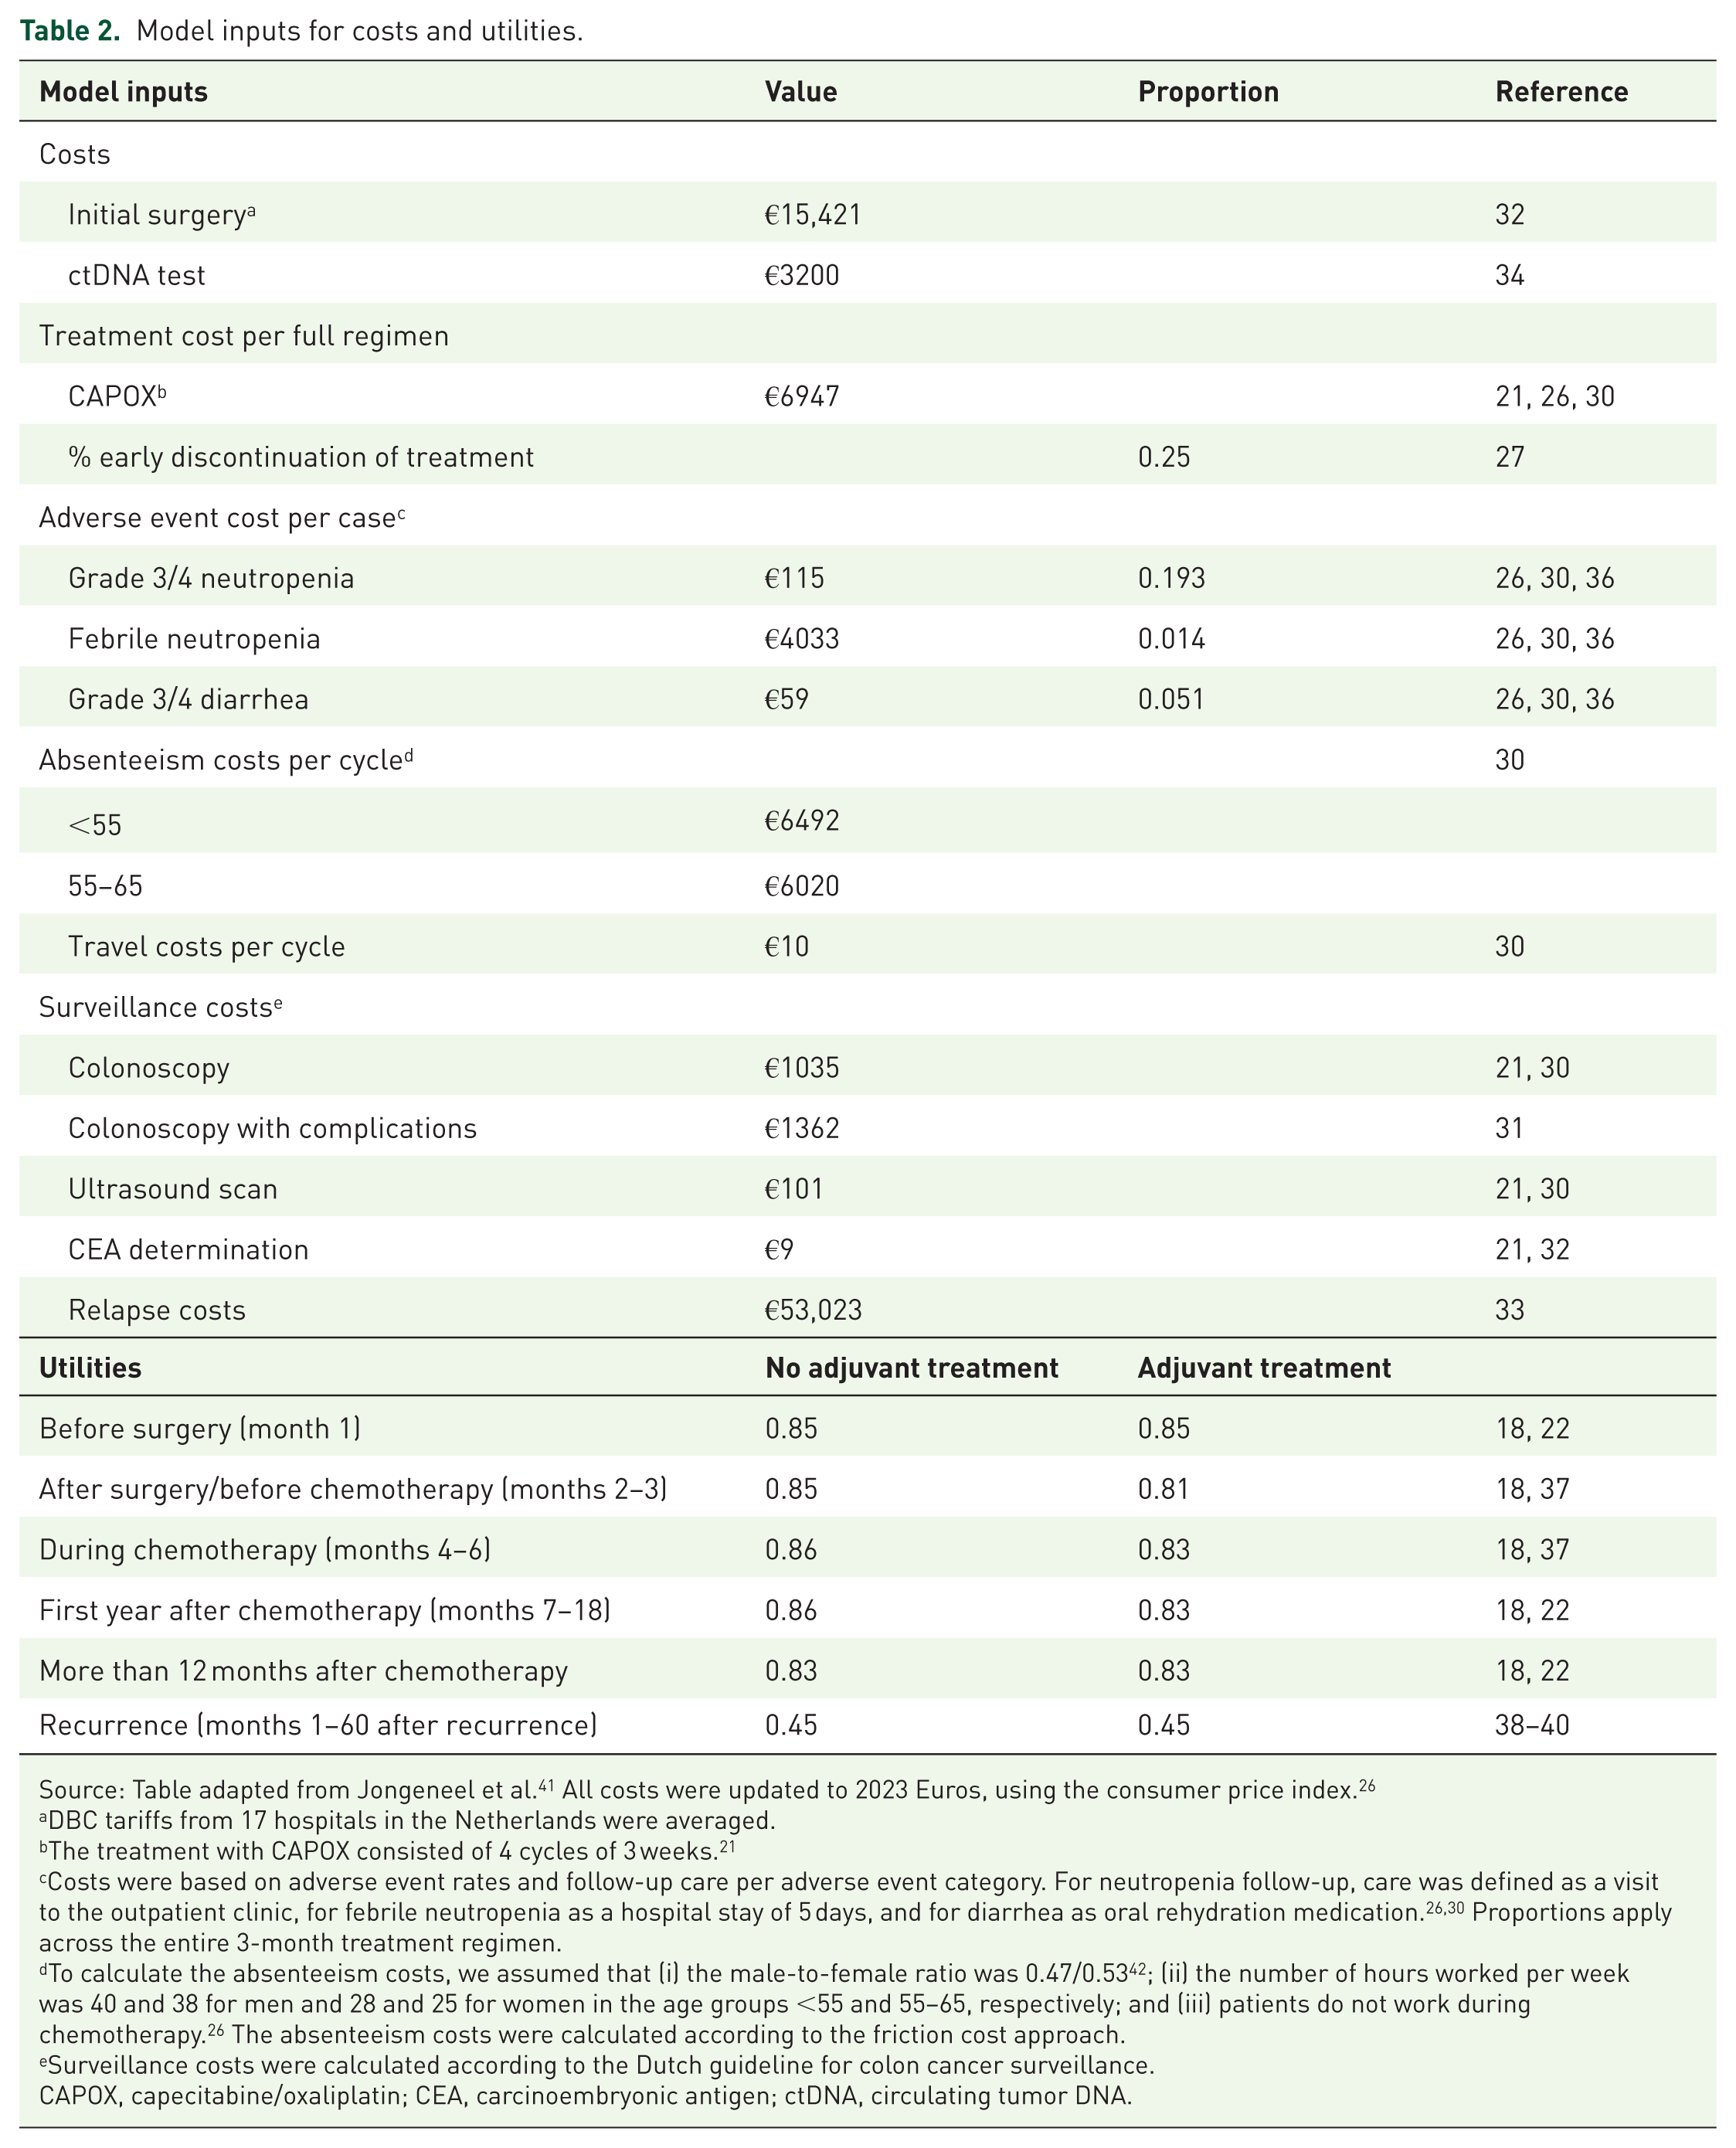
Source: Table adapted from Jongeneel et al. 41 All costs were updated to 2023 Euros, using the consumer price index. 26
DBC tariffs from 17 hospitals in the Netherlands were averaged.
The treatment with CAPOX consisted of 4 cycles of 3 weeks. 21
Costs were based on adverse event rates and follow-up care per adverse event category. For neutropenia follow-up, care was defined as a visit to the outpatient clinic, for febrile neutropenia as a hospital stay of 5 days, and for diarrhea as oral rehydration medication.26,30 Proportions apply across the entire 3-month treatment regimen.
To calculate the absenteeism costs, we assumed that (i) the male-to-female ratio was 0.47/0.53 42 ; (ii) the number of hours worked per week was 40 and 38 for men and 28 and 25 for women in the age groups <55 and 55–65, respectively; and (iii) patients do not work during chemotherapy. 26 The absenteeism costs were calculated according to the friction cost approach.
Surveillance costs were calculated according to the Dutch guideline for colon cancer surveillance.
CAPOX, capecitabine/oxaliplatin; CEA, carcinoembryonic antigen; ctDNA, circulating tumor DNA.
Outcomes
For each strategy, the number of recurrences and CC deaths per 1000 patients, as well as the number of life years, quality-adjusted life years (QALYs), and total lifetime costs per patient, were estimated. In an incremental analysis, incremental cost-effectiveness ratios (ICERs) were calculated for consecutive non-dominated strategies by dividing the difference in costs by the difference in QALYs to determine the cost per QALY gained. Strategies were considered dominated and excluded from further analysis if another strategy was less costly and equally or more effective. Strategies with a higher ICER than a more effective strategy were also excluded through extended dominance. A strategy was deemed cost-effective if its ICER did not exceed the willingness-to-pay (WTP) threshold, set at €50,000/QALY. 30 In addition, net monetary benefit (NMB) was determined for each strategy using the formula: total QALYs × WTP threshold − total costs.
One-way sensitivity analyses
One-way sensitivity analyses were performed to explore the impact of ctDNA-related parameters on (cost-)effectiveness results, and to explore conditions for cost-effective ctDNA-guided ACT de-escalation. In the sensitivity analyses, a wide range of hypothetical input values was explored, from realistic to extreme. Input values for each sensitivity analysis are shown in Table S3A.
The first one-way sensitivity analysis investigated the impact of varying ctDNA testing costs, because sequencing costs are expected to decrease in the (near) future. The costs of ctDNA testing were lowered from €2500 to €0 in steps of €500.
The second one-way sensitivity analysis investigated the impact of a higher ACT burden. For each strategy, it was assumed that the burden of ACT caused an additional utility decrement of 0.1, 0.2, and 0.3, respectively, during ACT and the first year after ACT.
The third one-way sensitivity analysis investigated the impact of differential ACT treatment effectiveness. In the base-case analysis, we assumed a uniform ACT treatment effect with an HR of 0.731 for all patients. The results of the GALAXY and BESPOKE-CRC studies suggest that ctDNA-negative patients derive little benefit from ACT, while ctDNA-positive patients benefit more.5,43 If that would be the case, withholding ACT in ctDNA-negative patients would have a limited impact. In this sensitivity analysis, the HR of 0.731 was decreased in ctDNA-positive patients in steps of 0.2 to 0.531, 0.331, and 0.131, simulating greater ACT benefit for ctDNA-positive patients. Consequently, the HR for the treatment effect in ctDNA-negative patients was calibrated to maintain the same average treatment effect in the whole cohort (resulting in HRs of 0.767, 0.809, and 0.847, respectively). This also indicated a higher predictive value for ctDNA.
The fourth and fifth sensitivity analyses jointly address the ctDNA test performance. There is currently a wide variation in ctDNA methods and panels for the analysis of post-surgery ctDNA in CC, leading to substantial variability in test performance. 4 Additionally, due to rapid developments in the field, ctDNA technologies may improve in the future. The literature reports different measures of test performance, including analytical sensitivity for recurrence detection, detection rates, and ctDNA positivity rates. In the PATTERN model, test performance depends on both ctDNA test positivity and the HR for recurrence in ctDNA-positive patients.
The fourth one-way sensitivity analysis focused on the impact of varying the ctDNA positivity rate (i.e., the percentage of patients with a positive test result). We evaluated scenarios with higher ctDNA positivity rates (20%, 25%, 30%, and 35% vs 13.4% in the base-case analysis) while assuming that the recurrence risk in ctDNA-positive patients remained the same as in the base-case analysis. As the size of the ctDNA-positive population increased in this scenario, the recurrence risk in ctDNA-negative patients was recalibrated to maintain the same total number of recurrences in the cohort (Table S3A).
The fifth one-way sensitivity analysis evaluated the impact of the prognostic value of ctDNA testing by increasing the recurrence risk in ctDNA-positive patients. In the base-case analysis, the HR for ctDNA-positive patients versus the general population was 4 (with an overall HR of 4.6 for ctDNA-positive vs ctDNA-negative patients), which was stepwise increased to 6, 8, and 10 (i.e., HRs 7.05, 9.25, and 11.20 of ctDNA-positive vs ctDNA-negative patients, respectively). The HR for recurrence in ctDNA-negative patients versus the general population was again recalibrated to maintain the same total number of recurrences in the cohort.
Two-way and three-way sensitivity analyses
To explore the joint impact of two parameters on (cost-)effectiveness outcomes, we performed two-way sensitivity analyses. Input values for the two-way sensitivity analyses are detailed in Table S3B.
In the first two-way sensitivity analysis, we adjusted the ACT treatment effect (HR of 0.531, 0.331 in ctDNA-positive patients) and the ctDNA positivity rate (20%, 25%, 30%) simultaneously. The HR for the treatment effect in ctDNA-negative patients was recalibrated for each of the six combinations to maintain the same average treatment effect in the whole cohort.
In the second two-way sensitivity analysis, we adjusted the ctDNA positivity rate (20%, 25%, 30%) and the ctDNA prognostic value (HR 7.05, HR 9.25, HR 11.20 for ctDNA-positive vs negative patients) simultaneously.
Furthermore, we supplemented both two-way sensitivity analyses with variation in ctDNA testing costs (€2000, €1000, €0), resulting in two three-way sensitivity analyses.
Threshold analyses
Threshold analyses were performed to determine the maximum costs of ctDNA testing for cost-effective de-escalation of ACT for all performed analyses, setting the WTP-threshold at €50,000/QALY. The maximum costs of ctDNA testing were only reported if it was a positive value.
Tools for analyses
Statistical analyses to inform the simulation model were performed using the “flexsurvreg” function of the “flexsurv” package in RStudio (R version 4.3.2). The PATTERN-stage III simulation model was implemented in Microsoft Excel (version 2021), and an Excel macro was developed specifically for this project to perform deterministic sensitivity analyses. Post-processing of simulation results and result visualization were done using the “ggsurvfit” and “ggplot2” packages in RStudio (R version 4.3.2) and GraphPad Prism 10. The reporting of this study conforms to the CHEERS statement 44 (see Supplemental File).
Results
Base-case analysis
Cancer burden
Table 3 and Table S4 show model outcomes for the base-case analysis.
Results of the base-case analysis.

Strategies are ordered according to increasing discounted QALYs.
Proportion of the cohort that received ACT.
Total number in a simulated cohort of 1000 patients.
Discounted mean per patient.
Based on a willingness-to-pay threshold of €50,000/QALY.
Through extended dominance.
ACT, adjuvant chemotherapy; CC, colon cancer; ctDNA, circulating tumor DNA; ICER, incremental cost-effectiveness ratio; LY, life years; NMB, net monetary benefit; QALYs, quality-adjusted life years; VI, vascular invasion.
The model predicted 298 recurrences and 278 CC deaths in the lifetime of 1000 patients if all patients received ACT. In the ctDNA-guided de-escalation strategies, only part of the population receives ACT. In strategy 1 (withhold ACT in pT1-3N1 and ctDNA-negative), Strategy 2 (withhold ACT in pT1-3N1, no VI, and ctDNA-negative), and Strategy 3 (withhold ACT in pT1-2N1 and ctDNA-negative), 52%, 61%, and 88% of patients receive ACT, respectively.
The de-escalation strategies resulted in more recurrences and CC deaths compared to the All ACT strategy, with an inverse relation between the proportion of patients receiving ACT and the number of recurrences and CC deaths. Among the de-escalation strategies, strategy 3 was the most effective (301 recurrences and 280 CC deaths per 1000 patients), while Strategy 1 was the least effective (321 recurrences and 299 CC deaths per 1000 patients). There was a difference between the All ACT strategy and strategy 3 of only three recurrences (respectively, 301 vs 298 recurrences per 1000 patients), and the recurrence rate in patients not receiving ACT was 8.6% (Table S4).
Cost-effectiveness
Figure 2 shows a cost-effectiveness plane depicting costs and QALYs of each strategy. Strategy 1 (withhold ACT in pT1-3N1 and ctDNA-negative) resulted in the lowest number of QALYs and the lowest costs (Table 3). The All ACT strategy resulted in the highest number of QALYs, closely followed by Strategy 3 (withhold ACT in pT1-2N1 and ctDNA-negative). However, Strategy 3 resulted in more costs and thus was dominated by the All ACT strategy. Strategy 2 (withhold ACT in pT1-3N1, no VI, and ctDNA-negative) resulted in lower costs and QALYs than All ACT. The ICER of Strategy 2 was higher than the All ACT strategy (i.e., the next best strategy); thus, Strategy 2 was extensively dominated. The All ACT strategy was considered cost-effective compared to Strategy 1, as the ICER (€7390 per QALY) was below the WTP-threshold of €50,000/QALY.

Results of the base-case analysis depicted on a cost-effectiveness plane.
One-way sensitivity analyses
Results of the one-way sensitivity analyses are shown in Tables S5–S9 and are presented in Figure 3 in terms of the difference in NMB (ΔNMB) compared to the All ACT strategy.
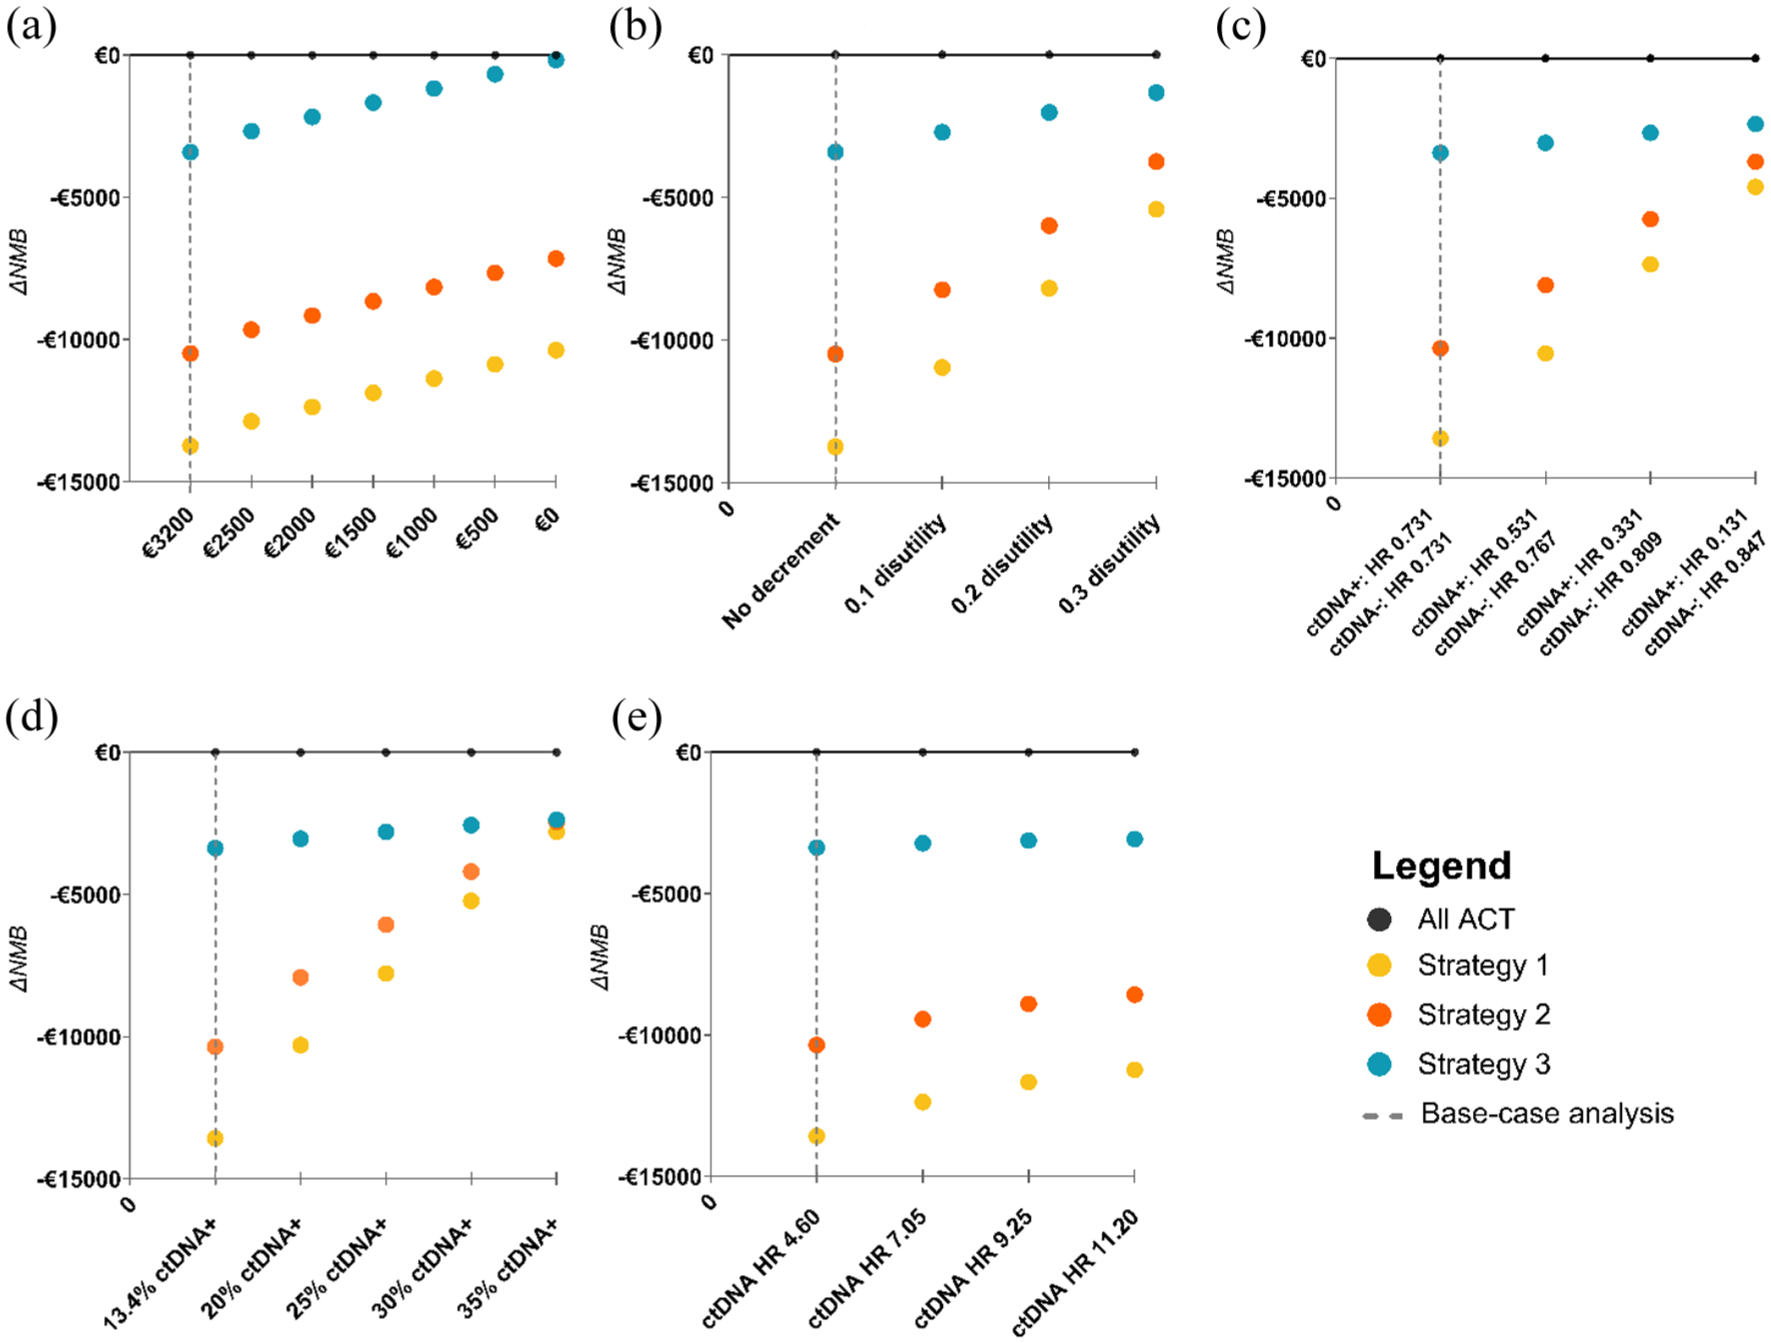
Results of one-way sensitivity analyses assessing the impact of changes in (a) ctDNA testing costs, (b) burden of ACT, (c) treatment effect of ACT, (d) ctDNA positivity rate, (e) ctDNA prognostic value.
In terms of cost-effectiveness, the All ACT strategy remained the preferred strategy in all one-way sensitivity analyses, even under extreme assumptions (Figure 3). In terms of effectiveness, Strategy 3 (withhold ACT in pT1-2N1 and ctDNA-negative) remained the most effective ctDNA-guided de-escalation strategy across all one-way sensitivity analyses. Moreover, when increasing ACT burden, Strategy 3 became more effective than All ACT in terms of QALYs under the most extreme assumption (i.e., 0.3 additional disutility; Table S6).
The one-way sensitivity analyses also demonstrated that varying the prognostic value of ctDNA testing had little impact on cost-effectiveness, while varying the extent to which treatment effect differed between ctDNA-positive and ctDNA-negative patients (i.e., predictive value for ctDNA), ACT burden, and increasing the ctDNA positivity rate had more impact on the NMB (Figure 3). Interestingly, when the ctDNA positivity rate was set at the most extreme value (i.e., 35% of patients are ctDNA positive), all de-escalation strategies reached similar effectiveness while substantially more ACT is withheld in Strategy 1 and 2 compared to strategy 3 (i.e., 64% and 71% vs 91% of the population receives ACT; Table S8).
Two-way and three-way sensitivity analyses
Tables S10 and S11 and Figure 4 show the results of the two-way and three-way sensitivity analyses, presented as differences in NMB (ΔNMB) compared to the All ACT strategy.

Results of two-way and three-way sensitivity analyses. “+” indicates the results of the two-way sensitivity analyses in which (panel (a)) the ctDNA positivity rate and treatment effect ACT, and (panel (b)) ctDNA positivity rate and ctDNA prognostic value are changed. “■,” “▲,” and “•” indicate the results of changing test costs simultaneously; the symbols enclosed within a black circle represent the results of the base-case analysis.
The first two-way and three-way sensitivity analyses showed that in all scenarios in which both the ctDNA positivity rate improved and ctDNA is predictive for ACT response, Strategy 3 (withhold ACT in pT1-2N1 and ctDNA-negative) was cost-effective compared to All ACT if the ctDNA test would be for free (Figure 4(a)). However, under extreme combinations, strategy 1 (withhold ACT in pT1-3N1 and ctDNA-negative) and Strategy 2 (withhold ACT in pT1-3N1, no VI, and ctDNA-negative) would be preferred over Strategy 3 in terms of NMB. Specifically, under the most extreme combination of 30% ctDNA positivity rate and ctDNA being highly predictive for ACT response (ACT treatment effect: HR 0.331 in ctDNA-positive patients), Strategy 1 and Strategy 2 were both more favorable than the All ACT strategy, even with €3200 ctDNA test cost. Moreover, in this combination, all three ctDNA-guided de-escalation strategies were more effective than All ACT in terms of QALYs (Table S10). In a less extreme combination with 25% ctDNA positivity rate and ctDNA being highly predictive for ACT response (HR 0.331 in ctDNA-positive patients), Strategy 1 with €3200 ctDNA testing cost would also be cost-effective compared to the All ACT Strategy. Overall, increasing the ctDNA positivity rate and assuming a higher predictive value for ctDNA substantially improved ΔNMB for ctDNA-guided de-escalation strategies.
For the second two-way and three-way sensitivity analyses, all strategies became more effective at extreme combinations. However, increasing the ctDNA prognostic value here did not improve ΔNMB as much as increasing the predictive value for ctDNA in the first two-way and three-way sensitivity analyses. Under the extreme combination of 30% ctDNA positivity rate and a substantial increase in ctDNA prognostic value (HR of recurrence of 11.20 for ctDNA-positive vs ctDNA-negative patients), strategy 1 was the most favorable strategy in terms of cost-effectiveness since it had a higher ΔNMB (Figure 4(b)). Note that in this scenario, the All ACT strategy was still the most effective in terms of QALYs (Table S11).
Threshold analyses
The threshold analyses for determining the maximum ctDNA test cost for cost-effective de-escalation showed that, under the base-case assumptions, the ctDNA de-escalation strategies would not become cost-effective, not even with a ctDNA test cost of zero (Table S12). After changing the base-case assumptions in one-way sensitivity analyses, the threshold analyses showed that Strategy 3 (withhold ACT in pT1-2N1 and ctDNA-negative) has the most potential to become cost-effective compared to the All ACT strategy, but only if the ctDNA test costs are substantially lower than €3200 (Table S12). For example, in the scenario with 25% ctDNA positivity rate, the maximum test costs are €402 for Strategy 3 to become cost-effective.
In two-way sensitivity analyses, the maximum ctDNA testing costs for Strategy 3 varied between €388 and €1486 to become cost-effective compared to All ACT, respectively, for the most extreme to the least extreme scenario (Table S13). The maximum ctDNA testing costs varied between €398 and €6160 for Strategy 1 and between €411 and €4976 for Strategy 2.
Discussion
This study presents the first early model-based evaluation for ctDNA-guided de-escalation of ACT in stage III CC patients. We showed that ctDNA-guided de-escalation strategies were less effective and not cost-effective compared to the current strategy, in which all patients receive ACT in the Dutch setting. When single ctDNA-related parameters were improved one by one, ctDNA-guided de-escalation strategies were still not cost-effective compared to all patients receiving ACT. However, ctDNA-guided de-escalation strategies could be cost-effective compared to giving all patients ACT if two or more of the following ctDNA-related parameters improved simultaneously (i.e., reduced ctDNA test costs, increased ctDNA positivity rate, improved ctDNA prognostic value, or better ACT treatment response for ctDNA-positive patients).
In all parameter settings for Strategy 3 (withhold ACT in pT1-2N1 and ctDNA-negatives), recurrence risk in the non-ACT group remained low and was comparable to that of stage I/low-risk stage II CC patients, in whom ACT is not recommended either according to current guidelines. 45 This relatively low recurrence risk explains why Strategy 3 was most likely to be cost-effective compared to treating all patients with ACT. The recurrence rate in the non-ACT group being the primary driver for cost-effectiveness is not surprising since recurrences are associated with high costs and lower quality of life.
In some one-way sensitivity analyses, Strategy 3 showed similar effectiveness as treating all patients with ACT, while ACT is withheld in 12% of patients. It is the most promising ctDNA-guided de-escalation strategy in terms of safety and effectiveness, but can only become cost-effective if ctDNA test costs are substantially lower. The maximum costs ctDNA test were between €74 (assuming a HR of recurrence of 9.25 for ctDNA-positive vs ctDNA-negative patients) and €1870 (assuming a 0.3 utility decrement). In two-way and three-way sensitivity analyses, Strategy 1 (withhold ACT in pT1-3N1 and ctDNA-negative) and Strategy 2 (withhold ACT in pT1-3N1, no VI, and ctDNA-negative) could also become cost-effective compared to everyone receiving ACT, with higher maximum ctDNA test costs than for Strategy 3 (maximum costs between €398–€6160 for Strategy 1 and €411–€4976 for Strategy 2), but only under exceedingly more extreme and likely unrealistic assumptions for improved ctDNA positivity rate and enhanced treatment effect in ctDNA-positive patients.
When interpreting our results, a few considerations must be made. First, in our study, it was nearly impossible to simulate de-escalation strategies that are more effective than treating all patients with ACT. This is due to a few key assumptions of our model: (1) every patient benefits from ACT in terms of recurrence risk, and (2) the impact of CAPOX on quality of life is limited. As a result, all de-escalation strategies resulted in lower effectiveness. These assumptions were explored in sensitivity analyses, but only under the most extreme assumption for ACT burden, where quality of life during CAPOX was almost the same as living with metastatic cancer, one de-escalation strategy became more effective than treating all patients with ACT. According to the cost-effectiveness framework, loss in effectiveness is only acceptable if it is offset by a sufficient reduction in costs. Two de-escalation strategies were cheaper in total cost than treating all patients with ACT, but this cost reduction was not sufficient to compensate for the decreased effectiveness, as the cost of treatment for additional recurrences and ctDNA testing was high. Therefore, these strategies were not considered cost-effective.
The second consideration is the substantial uncertainty in the available evidence for post-surgery ctDNA testing, including the ACT treatment effect.5,43 The GALAXY study, which focused on stage II–IV colorectal cancer patients, found that ACT was more effective for ctDNA-positive (recurrence HR = 6.59 for untreated vs treated patients) than for ctDNA-negative patients (recurrence HR = 1.7 for untreated vs treated patients). However, it has been observed that ctDNA-negative patients experience a recurrence later than ctDNA-positive patients, and the median follow-up time was only around 17 months, so longer follow-up time is needed to avoid selection bias in patients’ characteristics.5,46 If more studies with longer follow-up time confirm that ctDNA-negative patients derive less benefit from ACT, this will support ctDNA-guided de-escalation of ACT in stage III CC patients.
The third consideration is the imperfect sensitivity of the ctDNA test, leading to false-negative test results. Although there is room to improve the sensitivity of ctDNA testing, achieving perfect sensitivity might be unfeasible, as not all tumor locations shed equally high amounts of ctDNA. 47 Advancing ctDNA testing technology to improve sensitivity would provide greater support for ctDNA-guided de-escalation strategies. This was also demonstrated in our sensitivity analyses in which the NMB of all three ctDNA-guided de-escalation strategies increased with increasing percentage of ctDNA-positive patients.
The fourth consideration is generalizability. Our PATTERN model and the base-case analysis were derived from the Dutch setting, specifically regarding the cost of ctDNA testing, ctDNA positivity rate, and ctDNA prognostic value. As these factors may vary across countries and health settings, the conclusions regarding the cost-effectiveness of ctDNA-guided strategies may differ. For example, ctDNA testing costs are difficult to estimate due to workflow variations. A Dutch micro-costing study reported a wide range (€168–€7638 per sample), highlighting the need for local cost evaluation before implementation. 48 Although our sensitivity analyses partly addressed these uncertainties, local recurrence risk of CC and ctDNA testing availability should also be taken into consideration.
There are several limitations to our study. First, the ctDNA model parameters come from an external dataset (PROVENC3 study, n = 209) with a different median follow-up time from the dataset we fitted our survival models. Therefore, we found a lower HR of ctDNA-positive versus ctDNA-negative patients in our base-case analysis than in the “PROVENC3” study, but we increased this HR in subsequent sensitivity analyses to study the impact. Besides, a probabilistic sensitivity analysis was not performed because incorporating ctDNA-related parameters in the random sampling procedure would require intensive recalibration, making it computationally infeasible. Although it could provide additional insights, our conducted sensitivity analyses sufficiently demonstrated the impact of key parameters on the model outcomes. Furthermore, we assumed in our analyses that all patients receiving ACT were treated with CAPOX, while in clinical practice, some patients might receive FOLFOX (~5% of patients). 49 As CAPOX is less costly than FOLFOX, this led to a more conservative estimate of treatment costs, thereby causing the cost-effectiveness conclusions to be more supportive of the All ACT strategy.
Conclusion
In stage III CC in the Netherlands, ctDNA-guided strategies for ACT de-escalation are currently not cost-effective compared to the Dutch guideline to treat all patients with ACT, given base-case assumptions for ctDNA-related parameters. However, these ctDNA-guided strategies could become cost-effective if two or more of the following ctDNA-related parameters improve simultaneously: (1) treatment effectiveness in ctDNA-positive patients, with the HR decreasing to 0.531; (2) ctDNA test positivity rate, increasing to 20%; (3) ctDNA prognostic value, with the HR of ctDNA-positive compared to negative patients rising to 7.05; and (4) ctDNA testing costs, with maximum affordable costs ranging from €74 to €6160 depending on alignment with the other three factors.
Supplemental Material
sj-docx-1-tam-10.1177_17588359251384238 – Supplemental material for CtDNA-guided de-escalation of adjuvant chemotherapy in stage III colon cancer: early model-based evaluation of cost-effectiveness
Supplemental material, sj-docx-1-tam-10.1177_17588359251384238 for CtDNA-guided de-escalation of adjuvant chemotherapy in stage III colon cancer: early model-based evaluation of cost-effectiveness by Haoyue Wang, Astrid Kramer, Marjolein J. E. Greuter, Carmen Rubio-Alarcón, Birgit Lissenberg-Witte, Gerrit A. Meijer, Niels F. M. Kok, Daan van den Broek, Geraldine R. Vink, Jeanine M. L. Roodhart, Mark Sausen, Remond J. A. Fijneman and Veerle M. H. Coupé in Therapeutic Advances in Medical Oncology
Footnotes
Acknowledgements
None.
Declarations
ORCID iDs
Supplemental material
Supplemental material for this article is available online.
References
Supplementary Material
Please find the following supplemental material available below.
For Open Access articles published under a Creative Commons License, all supplemental material carries the same license as the article it is associated with.
For non-Open Access articles published, all supplemental material carries a non-exclusive license, and permission requests for re-use of supplemental material or any part of supplemental material shall be sent directly to the copyright owner as specified in the copyright notice associated with the article.