
Abstract
Background:
Programmed death-ligand (PD-L1) expression serves as a predictive biomarker for immune checkpoint inhibitor (ICI) sensitivity in non-small cell lung cancer (NSCLC). Nevertheless, the development of biomarkers that reliably predict ICI response remains an ongoing endeavor due to imperfections in existing methodologies.
Objectives:
ICIs have led to a new paradigm in the treatment of NSCLC. The current companion PD-L1 diagnostics are insufficient in predicting ICI response. Therefore, we sought whether the Olink platform could be applied to predict response to ICIs in NSCLC.
Design:
We collected blood samples from patients with NSCLC before ICI treatment and retrospectively analyzed proteomes based on their response to ICI.
Methods:
Overall, 76 NSCLC patients’ samples were analyzed. Proteomic plasma analysis was performed using the Olink platform. Intraplate reproducibility, validation, and statistical analyses using elastic net regression and generalized linear models with clinical parameters were evaluated.
Results:
Intraplate coefficient of variation (CV) assays ranged from 3% to 6%, and the interplate CV was 14%. In addition, the Pearson correlation coefficient of the Olink Normalized Protein eXpression data was validated. No statistical differences were observed in the analyses of progressive disease and response to ICIs. Furthermore, no single proteome showed prognostic value in terms of progression-free survival.
Conclusion:
In this study, the proximity extension assay-based approach of the Olink panel could not predict the patient’s response to ICIs. Our proteomic analysis failed to achieve predictive value in both response or progression to ICIs and progression-free survival (PFS).
Introduction
The incidence of non-small cell lung cancer (NSCLC) is continuously increasing, consisting of about 85% of Korean lung cancer patients population.1,2 For more than a decade, immune checkpoint inhibitors (ICIs) have proven to be highly effective against multiple solid tumors.3,4 Currently, programmed death-ligand 1 (PD-L1) expression serves as a predictive biomarker for ICI sensitivity and patient stratification; therefore, first-line treatment selection for NSCLC is largely dependent on PD-L1 expression in tumors. For patients with PD-L1 expression in ⩾50% of NSCLC tumor cells, pembrolizumab monotherapy is recommended. The overall response rate (ORR) of pembrolizumab monotherapy in these patients is 44.8%. 5 In patients with NSCLC tumor PD-L1 expression ⩾1%, pembrolizumab monotherapy is more effective than conventional chemotherapy. 6 For patients with PD-L1 expression in <50% of tumor cells, a combination of doublet chemotherapy with concurrent pembrolizumab is recommended for both squamous and non-squamous NSCLC.7,8 Atezolizumab monotherapy or a combination of Nivolumab and Ipilimumab is another feasible first-line therapy for NSCLC.9 –12
Even though PD-L1 expression serves as a predictive biomarker for ICI sensitivity, there remains an unmet need for the development of more precise biomarkers that can accurately predict ICI response. Tumor mutation burden,13,14 and tumor-infiltrating lymphocytes have been suggested as predictive biomarkers; however, their predictive power is limited.15 –17 In addition, different companion diagnostic kits are used for different cancer types, confirming that a unified diagnostic method does not exist.18,19
Proteomic analysis is a powerful tool for the global assessment of protein expression and has been extensively applied in cancer studies as it allows for the identification of potential biomarkers. 20 In addition, in NSCLC, proteomic analysis has been used to assess subtypes,21,22 disease stage, and the status of metastasis.23,24 We hypothesized that a high-throughput proteomics approach, using blood samples, could possibly predict the response to the use of ICIs.
Therefore, we aimed to investigate the clinical utility of a highly sensitive proteome analysis platform, Olink. Specifically, whether Olink could be used to predict ICI response in patients with NSCLC.
Materials and methods
Patient characteristics and plasma sample
This study had been designed before the reimbursement of the ICIs as a first-line therapy for lung cancer in combination with cytotoxic chemotherapy. Thus, this study enrolled patients who had received monotherapy of ICIs. The patients were evaluated with imaging according to RECIST 1.1 (Response Evaluation Criteria in Solid Tumors, Version 1.1). 25 Overall, 95 patients with stage IV lung cancer who received an ICI treatment (Nivolumab, Pembrolizumab, or Atezolizumab) at the Yonsei Cancer Center between December 2018 to November 2020 were enrolled. All patients provided written informed consent for the collection of blood samples (IRB: 4-2016-0678). The reporting of this study conforms to the STRAD 2015 statement (Supplemental Table 1).
Among the 95 samples, 8 patient samples were used as bridge samples, and 7 failed to pass the quality control (QC) test. Therefore, 80 samples were analyzed; however, samples from four patients were excluded due to missing or vague patient characteristics. Finally, 76 samples were included in the final cohort and were evaluated using correlation analysis. Before ICI treatment (baseline), whole blood was collected in BD Vacutainer CPT tubes (BD362753). Tubes were centrifuged for 30 min at room temperature (25°C) to obtain plasma (3 mL). Plasma was stored at −80°C for further use and thawed at the time of proteomic analysis. For better understanding, detailed figure for batch arrangement was shown in Supplemental Figure 1.
Following the RECIST criteria, the response to anticancer agents is categorized as complete response, partial response, stable disease (SD), and progressive disease (PD). In this study, the patient population was divided into two groups. Firstly, into progressors (P) and non-progressors (NP), where P includes patients whose best response to ICIs was PD, and NP includes those with other responses. Additionally, the subjects were classified as non-responders (NR) and responders (R), where R comprises patients with best responses of SD or PD to ICIs, while NR includes those with PD or SD. We have done these two separations of subjects because a single-agent immunotherapy may not always induce abrupt tumor shrinkage, but may induce long-term disease stabilization, which is linked to clinical benefit. Although seemingly overlapping, these separate categorizations were established to discern and confirm the clinical benefits associated with such outcomes.
Proteomic plasma analysis using the Olink Immuno-Oncology Panel
Plasma samples were analyzed at the Macrogen Precision Medicine Institute (Seoul, South Korea), where Normalized Protein eXpression (NPX) levels were measured. NPX values were obtained for 84 patients at baseline and post-anti-PD1/PD-L1 treatment. The Olink Immuno-Oncology Panel was used to detect the soluble proteins related to immunotherapy. This panel offers a multiplexed immunoassay for 92 protein biomarkers associated with various biological processes such as the promotion and inhibition of tumor activity. Full validation information about this panel was provided by the manufacturer, including the scalability, specificity, and analytical measurements of the testing samples. Briefly, dual proximity extension assay antibody probes, labeled with DNA nucleotides, bind to the target protein in plasma samples with high specificity, which encourages more specific reactions than traditional immune assays. The generated double-stranded DNA barcodes were amplified, and the amount of each barcode was measured using a real-time qPCR (Supplemental Figure 2).
Reproducibility of Olink panel results
Experimental replicates were performed to assess reproducibility. For each experimental replicate, all samples were included in the same order on each plate, and analyses were performed using the same version of the Immuno-Oncology Panels. Only difference was the additional freeze–thaw cycle in the newer plates. We compared the NPX values of each protein produced from distinct time points using Pearson correlation.
Protein measurements using Luminex
Serial dilutions of five plasma samples with 2-fold and 10-fold factors were quantified by the Human Immuno-Oncology Checkpoint Protein Panel 1&2 using a Luminex 200 system (Cosmo Genetech, Seoul, South Korea). The most significant proteins identified in this study, measured by Luminex, were arginase-1 (ARG1), galectin-1 (GAL1), MIC-A, MIC-B, PD-1, PD-L1, and PD-L2. Concentrations were measured in duplicate based on the antibody responses per sample.
Statistical analysis
This study aimed to analyze whether certain proteomic levels could possibly lead to prediction of ICI treatment. Therefore, primary endpoint of the study is to validate whether specific proteomic levels can accurately classify patients into categories of P versus NP or NR versus R.
Due to the limited number of events of progression or response compared to the analyzed number of the proteome, an initial exploration was conducted to identify significant variables. First, the samples were separated into train and test sets. The train set consisted of 70% of the original data set, chosen at random while preserving the proportions of the response classes initially available. Statistical significance was set at p < 0.05.
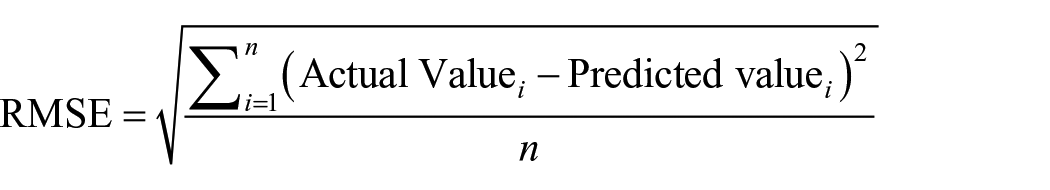
Then, logistic regression was performed for each proteome among the train set, assessing their significance in the context of P versus NP or R versus NR. Proteomes with p values < 0.05 in logistic regression were designated as significant. Subsequently, elastic net regression was carried out using the identified significant proteomes for each respective comparison. An elastic net regression model was employed to create a predictive model for distinguisihg both P versus NP, and R versus NR within the train set, using the ‘caret’ (v6.0-94) and ‘glmnet’ (v4.1-7) packages in R. Elastic net regression is a regularization technique developed by Zou and Hastie 26 to overcome the limitations of l1 (lasso) and l2 (ridge) regularization. It was designed to provide good classification performance while employing a minimal number of predictor variables. α and λ are the hyperparameters for this model, and help determining the mixture and weight of penalization, where setting α = 1 results in the elastic net penalty only contributing a penalty equivalent to the l1 regularization, and α = 0 results in the elastic net penalty only contributing a penalty equivalent to the l2 regularization. These penalties together are scaled by λ; the higher the value for λ, the higher the penalty accrued to the regression. The α and λ were set at the lowest root mean square error (RMSE). Herein, RMSE is defined as follows:
In this study, a sequence of 10 α values ranging from 0 to 1 was explored, and a sequence of 20 λ values ranging from 0.0001 to 1 was examined to investigate different combinations of l1 and l2 regularization strengths in elastic net regression. The range of λ values was determined based on the preliminary results from l1 and l2 regressions. After modeling a prediction model, validation with test set was analyzed.
Since both R versus NR and P versus NP are categorical variables with only two values each, we employed the logit link function in elastic net regression. After obtaining results for each variable, in the R versus NR model, we defined values below 0.5 as R and values equal to or above 0.5 as NR. Similarly, in the P versus NP model, values below 0.5 corresponded to NP, while values equal to or above 0.5 indicated P.
Receiver operating characteristic (ROC) curves for the two models: R versus NR and P versus NP, were plotted, both for train and test sets. Subsequently, area under curve (AUC) for each model were calculated. Ninety-five percent confidence intervals (CIs) for the AUC values were calculated by the bootstrap method.
Further explanatory analysis was done on relationship between PFS and proteomes. Since there is no evidence to suggest that the models for both R versus NR and P versus NP are associated with PFS, we conducted univariate regression analysis on individual proteomes with respect to PFS. Subsequently, we selected significant proteomes and performed multivariate Cox regression with clinical parameters to calculate hazard ratio of PFS. All statistical analyses were performed using R 4.3.0.
Results
Patient characteristics
A total of 76 samples of NSCLC patients were collected between December 2018 and November 2020 (Figure 1). Among 76 subjects, 58 subjects were analyzed as train set, and 18 subjects were analyzed as test set. There were no significant differences in sex, age, and ICI treatment agents between the two groups. However, patients receiving first-line ICI therapies were exclusively included in the train set. The baseline characteristics of patients are depicted in Table 1.

Patient enrollment and consort diagram.
Baseline characteristics of subjects.

p Value was calculated for patients who underwent immune histochemical study of EGFR, and ALK results. For ROS1, p value was not evaluated because no patients showed positive results.
ALK, anaplastic lymphoma kinase; EGFR, epidermal growth factor receptor; ICI therapy, immune checkpoint inhibitor therapy; NP, non-progressors; NR, non-responders; P, progressors; PD-L1, anti-programmed death-ligand 1; R, responders; ROS1, ROS proto-oncogene 1; SD, standard deviation; TPS, tumor proportion score.
Reproducibility
Four replicates were performed, and the obtained NPX values were compared to verify reproducibility of the result. The intraplate coefficient of variation (CV) for 92 protein assays between all plates ranged from 3% to 6%, and interplate CV in those plates was 14%. We normalized the NPX values from all replicates by adjusting the median values of all markers per plate to standardize plate variations. Pearson correlation analysis (Supplemental Figure 3) revealed that between replicates, 83 markers were highly correlated (r = 0.85–0.99). The six highest and least correlated proteins were presented in Figure 2 with the correlation scores. The proteins with highest correlation were PDGF subunit B, IL6, and C-X-C motif chemokine 5 (CXCL5) with r > 0.99. Notably, the NPX values of the nine proteins were below limit of detection: IL-1α (r = 0.63), IL2 (r = 0.048), IL33 (r = 0.26), IL5 (r = 0.68), IL4 (r = 0.35), IL13 (r = 0.44), Pleiotrophin (r = 0.55), CXCL12 (r = 0.65), CD28 (r = 0.75).

Six highest and lowest correlation coefficient in 92 protein assays. Complete correlation data are provided in Supplemental Figure 3.
Validation of Olink data based on antigen–antibody reaction assay
To validate the results obtained from the Olink platform, Pearson correlation tests were employed to analyze the correlation between the results obtained from Olink (NPX data on a log2 scale) and the results obtained from Luminex [concentrations in pictograms per milliliter (pg/mL)]. We have randomly selected five patients’ samples to compare the validation, results (NPX value and concentration) of seven different proteins were analyzed. The highest correlations were observed with PD-L1 (r ⩾ 0.92), followed by PD-L2 and PD-1 also showing high correlation coefficients (r ⩾ 0.91 and r ⩾ 0.85) in every intra-patient sample. Notably, ARG1 correlation for Patient B was replaced with not detectable, and the correlation with MIC-B for Patient A was quantified as negative 0.23 (r = −0.23) (Supplemental Table 2) in that the variables were associated with opposite directions. All other variables were highly correlated (Supplemental Table 2) except ARG1 from Patient A (r = 0.40), GAL1 from Patient D (r = 0.50), and MIC-B from Patient B (r = 0.54) (Figure 3). The linearity of PDCD1, PD-L1, and PD-L2 between the measured signal versus theoretical concentration by both Olink and Luminex in patients A and B is described in Supplemental Figure 4. Supplemental Figure 4 illustrates the disparity between the actual measured values and the theoretical values predicted of the PDCD1, PD-L1, and PD-L2 based on a dilution factor (2×) for Patients A and B. This comparison is depicted graphically using two different methods, Olink and Luminex. While statistical comparison may be challenging, the graphical representation suggests that both patients exhibit less discrepancy using the Olink method compared to Luminex. We also observed the normalized linearity for Patient A and visualized it for each platform (Figure 4). The measurements from Olink and Luminex were both associated with dilution factors, such as increased slopes. The weakest correlation was observed for ARG1 using Olink (r = 0.0872) and for MIC-B using Luminex (r = 0.0132). The other markers showed r > 0.7 in Olink measurements associated with dilutions. However, ARG1 and GAL1 of Patient A were weakly correlated. Besides the sensitivity of these multiplex platforms, better linearity was observed with the Olink datasets.

Results of correlation between Olink and Luminex assays. The x-axis shows the Pearson correlation coefficient, and the y-axis represents the selected assays for five patients arranged in ascending order.

Normalized measurements from Olink as dilutions (y-axis) on Patient E with coefficients of determination for all protein markers and normalized levels from Luminex (x-axis) as the same function.
Prediction of the response to ICI by proteomic level
To develop a predictive model for the relationship between protein levels and response to ICIs, the coefficients of the best-fit elastic net were evaluated for R versus NR and P versus NP. Initially, we have selected proteomes that are considered significant in comparison of R versus NR and P versus NP from train set. Logistic regression was employed to every proteome each comparison. In R versus NR regression, CD4, NOS3, CD70, TNFRSF12A, MMP7, ANGPT2, and PD-L2 were selected, and in P versus NP regression, MUC-16, CCL19, HO-1, and CCL23 were selected as significant proteomes.
Firstly, in the analysis of R versus NR created within train set, elastic net regression revealed the minimum RMSE at α = 0 and λ = 0.158 [Figure 5(a)]. The R2 value, determined using the train set on which this model was created, was found to be 0.0842. However, when validating this model with the test set, which consisted of 3 responders and 15 non-responders, the model predicted all subjects as non-responders (Supplemental Table 3). The variable importance analysis revealed specific predictors that significantly contribute to the predictive performance of the model. Among them, CD70 demonstrated the highest overall importance, receiving a score of 100.00, whereas PD-L2 scores 0 in this model. Plot of each variable’s importance is shown in Figure 5(b).

(a) Elastic net regression and hyperparameters for best fit (lowest RMSE) were presented for R versus NR model. (b) Proteomes were arranged in the order of importance in R versus NR model. (c) Elastic net regression and hyperparameters for best fit in P versus NP model. (d) Proteomes were arranged in the order of importance in P versus NP model.
In P versus NP analysis, elastic net regression was settled at α = 0, λ = 0.421 [Figure 5(c)]. Analysis of importance of variable reveals MUC-16 showing the highest overall importance, where CCL23 shows lowest importance [Figure 5(d)]. In this P versus NP analysis, R2 value equals 0.1739. Validation of this model by this model by test model shows sensitivity of 0.857, and specificity of 0.09 (Supplemental Table 3).
Considering the absence of a conclusive fit for both NR versus R and P versus NP in the analysis using elastic net regression, ROC curve and AUC values were assessed for both NR versus R and P versus NP models in both train and test sets. Firstly, in R versus NR model, AUC of train set was 0.81, with CI ranging from 0.656 to 0.965 [Figure 6(a)]. AUC of test set was 0.867 (0.592–1.00) [Figure 6(b)]. Similarly, P versus NP model yielded AUC of 0.81 (0.717–0.928) in train set [Figure 6(c)] and 0.494 (0.184–0.803) in test set [Figure 6(d)].

Receiver operating curve of (a) train set and (b) test set in R versus NR model, and (c) train set and (d) test set in P versus NP model.
Furthermore, in order to figure out each proteome’s prognostic value, we conducted a comparative analysis between PFS and individual proteomes. In this analysis, univariate analysis using generalized linear models was employed to examine the correlation between PFS and each proteome. Significant proteomes, which showed p < 0.05 in previous univariate analysis, were identified based on the outcomes of this analysis. Among the proteomes analyzed, only IL-2 and CXCL1 exhibited statistical significance in the univariate analysis. Subsequently, a multivariate Cox regression was performed, incorporating clinical parameters such as age, sex, tumor proportion score (TPS), smoking, and treatment lines, along with the two significant proteomes, to provide a comprehensive exploration of the factors influencing PFS. To categorize the clinical parameters, TPS score was divided into three groups: 0, 1–49%, and 50–100%, while treatment lines were categorized into 1, 2, 3, and 4 or more, representing the order of ICI treatment (Figure 7). However, the levels of IL-2 and CXCL1 did not exhibit statistically significant differences in association with PFS in this Cox regression analysis. The hazard ratios for the two proteomes were calculated as 0.62 (95% CI: 0.31–1.28) and 0.82 (95% CI: 0.62–1.10), respectively, as shown in the forest plot.

Hazard ratio forest plots. Data are based on multivariate Cox regression analysis for PFS with clinical parameters and proteomes that were significant in prior univariate analysis.
Discussion
In this study, we aimed to investigate the clinical utility of the Olink platform in NSCLC. First, we evaluated the reproducibility of results obtained using the Olink platform. Many markers showed strong intraplate correlations. Next, the Olink proteomic data was compared with the Luminex data. Strong correlations were observed between the obtained data, except for MIC-B and CAL1. Although only a few proteomes were available for analysis, Olink proteomics outperformed the Luminex system in terms of linearity since the graphical representation suggests that, in both patients, the Olink method exhibits less deviation between measured values and theoretical values compared to the Luminex method. However, a direct comparison between the two diagnostic tools needs to be further investigated because no single technique has been proven to be the gold standard. Our team had debated about the reason for the different correlations between patients. Our possible proposal was that the protein expression profiles could vary with the patient’s or sample’s traits or other environmental influences. Further investigations into protein sampling and variation in measurement might be needed.
We also sought to determine the relationship between the response to ICIs in NSCLC and proteomic analysis. However, the regression test results did not reveal any significant model. Our two elastic net regression models, R versus NR and P versus NP, showed α value of 0. This outcome suggests that the model is attempting to shrink the coefficients using only l2 regularization, leading to the model’s overfitting and may not effectively perform variable selection. We further investigated the model’s fitting using ROC curves and AUC, but the results were disappointing. The R versus NR model failed to identify patients corresponding to actual responders, with a sensitivity of 0. While the AUC of the ROC curve itself was high, its interpretation as a suitable predictor was challenging due to the absence of true positive predictions. Additionally, in the P versus NP model, the AUC was significantly lower in the test set compared to the training set, indicating overfitting of the model to the training data and rendering it unfit for prediction.
Our study is similar to that of Eltahir et al. 27 ; however, the proteins that significantly affect the overall parameters do not overlap. Previous research has emphasized the importance of the C-X-C motif chemokines, CXCL9 and CXCL10, in response to checkpoint inhibition. In our study, IL-2 and CXCL1 exhibited statistical significance concerning PFS among the proteomes. Both the cytokines are known to be related to unfavorable prognosis factors in various reports.28,29 However, when conducting Cox regression through multivariate analysis, including both two proteomes and clinical parameters, the statistical analysis revealed that the predictive value of the proteomes was not statistically significant.
This study had some limitations. Firstly, the sample cohort was smaller than the number of proteomic panels. Applying classical models of regression was challenging, so only regression by training and validation was available. Secondly, this study included about 18.4% of responders, which is almost identical to previously reported KEYNOTE-010 study, 30 where administration of pembrolizumab 2 mg/kg to previously treated NSCLC shows 18% of objective response rate. However, relatively small numbers of total responders seemed to lead to utilization of only l2 regularization without incorporating l1 regularization in both models. The elastic models might be prone to overfitting and may not effectively perform variable selection, resulting in low R 2 in regression model, and overestimation of non-responders, and progressors. Nonetheless, recent studies discussed various applications of the Olink platform. Studies by the LC3 consortium have shown promising prognostic value of proteomic analysis in diagnosis and risk stratification.31,32 In the future, imaging tests, and proteomic analyses may be prerequisites for tumor diagnosis. Although this study seems disappointing, it solely demonstrated its application in predicting the response to ICIs in NSCLC rather than the overall treatment effect. The Olink platform could potentially provide a new strategy for assessing the risk, diagnosis, and treatment of lung cancer; therefore, application of the Olink platform in clinical settings is highly anticipated.
Conclusion
In conclusion, our study showed good reproducibility and validation in intraplate analysis among NSCLC patients by Olink proteomics. However, our attempts to predict the response to ICIs through proteomic analysis were not statistically significant, both in terms of R versus NR, and P versus NP. Despite the negative results, this study emphasizes the need for future research to elucidate the relationship between proteomics and cancer treatment.
Supplemental Material
sj-docx-5-tam-10.1177_17588359241254218 – Supplemental material for Multiplex analysis for the identification of plasma protein biomarkers for predicting lung cancer immunotherapy response
Supplemental material, sj-docx-5-tam-10.1177_17588359241254218 for Multiplex analysis for the identification of plasma protein biomarkers for predicting lung cancer immunotherapy response by Moonki Hong, Sang Wook Lee, Byoung Chul Cho, Min Hee Hong, Sun Min Lim and Nak-Jung Kwon in Therapeutic Advances in Medical Oncology
Supplemental Material
sj-docx-6-tam-10.1177_17588359241254218 – Supplemental material for Multiplex analysis for the identification of plasma protein biomarkers for predicting lung cancer immunotherapy response
Supplemental material, sj-docx-6-tam-10.1177_17588359241254218 for Multiplex analysis for the identification of plasma protein biomarkers for predicting lung cancer immunotherapy response by Moonki Hong, Sang Wook Lee, Byoung Chul Cho, Min Hee Hong, Sun Min Lim and Nak-Jung Kwon in Therapeutic Advances in Medical Oncology
Supplemental Material
sj-docx-7-tam-10.1177_17588359241254218 – Supplemental material for Multiplex analysis for the identification of plasma protein biomarkers for predicting lung cancer immunotherapy response
Supplemental material, sj-docx-7-tam-10.1177_17588359241254218 for Multiplex analysis for the identification of plasma protein biomarkers for predicting lung cancer immunotherapy response by Moonki Hong, Sang Wook Lee, Byoung Chul Cho, Min Hee Hong, Sun Min Lim and Nak-Jung Kwon in Therapeutic Advances in Medical Oncology
Supplemental Material
sj-png-1-tam-10.1177_17588359241254218 – Supplemental material for Multiplex analysis for the identification of plasma protein biomarkers for predicting lung cancer immunotherapy response
Supplemental material, sj-png-1-tam-10.1177_17588359241254218 for Multiplex analysis for the identification of plasma protein biomarkers for predicting lung cancer immunotherapy response by Moonki Hong, Sang Wook Lee, Byoung Chul Cho, Min Hee Hong, Sun Min Lim and Nak-Jung Kwon in Therapeutic Advances in Medical Oncology
Supplemental Material
sj-png-2-tam-10.1177_17588359241254218 – Supplemental material for Multiplex analysis for the identification of plasma protein biomarkers for predicting lung cancer immunotherapy response
Supplemental material, sj-png-2-tam-10.1177_17588359241254218 for Multiplex analysis for the identification of plasma protein biomarkers for predicting lung cancer immunotherapy response by Moonki Hong, Sang Wook Lee, Byoung Chul Cho, Min Hee Hong, Sun Min Lim and Nak-Jung Kwon in Therapeutic Advances in Medical Oncology
Supplemental Material
sj-png-3-tam-10.1177_17588359241254218 – Supplemental material for Multiplex analysis for the identification of plasma protein biomarkers for predicting lung cancer immunotherapy response
Supplemental material, sj-png-3-tam-10.1177_17588359241254218 for Multiplex analysis for the identification of plasma protein biomarkers for predicting lung cancer immunotherapy response by Moonki Hong, Sang Wook Lee, Byoung Chul Cho, Min Hee Hong, Sun Min Lim and Nak-Jung Kwon in Therapeutic Advances in Medical Oncology
Supplemental Material
sj-png-4-tam-10.1177_17588359241254218 – Supplemental material for Multiplex analysis for the identification of plasma protein biomarkers for predicting lung cancer immunotherapy response
Supplemental material, sj-png-4-tam-10.1177_17588359241254218 for Multiplex analysis for the identification of plasma protein biomarkers for predicting lung cancer immunotherapy response by Moonki Hong, Sang Wook Lee, Byoung Chul Cho, Min Hee Hong, Sun Min Lim and Nak-Jung Kwon in Therapeutic Advances in Medical Oncology
Footnotes
Acknowledgements
We thank the patients and their families for their contribution to this study. We acknowledge the support from Macrogen (Seoul, South Korea) for proteogenomics core facility through the Olink platform.
Declarations
Supplemental material
Supplemental material for this article is available online.
References
Supplementary Material
Please find the following supplemental material available below.
For Open Access articles published under a Creative Commons License, all supplemental material carries the same license as the article it is associated with.
For non-Open Access articles published, all supplemental material carries a non-exclusive license, and permission requests for re-use of supplemental material or any part of supplemental material shall be sent directly to the copyright owner as specified in the copyright notice associated with the article.