
Abstract
Background:
Mesenchymal–epithelial transition (MET) amplification is a crucial oncogenic driver and a resistance mechanism to epidermal growth factor receptor tyrosine kinase inhibitors (TKIs) of non-small-cell lung cancer (NSCLC). Fluorescence in situ hybridization (FISH) is the gold standard for MET amplification detection. However, it is inapplicable when tissue samples are unavailable.
Objective:
This study assessed the performance of plasma droplet digital polymerase chain reaction (ddPCR) in MET amplification detection in NSCLC patients.
Design and methods:
A total of 87 NSCLC patients were enrolled, and 94 paired tissue and plasma samples were analyzed for the concordance between FISH and plasma ddPCR/tissue next-generation sequencing (NGS) in detecting MET amplification. In addition, the efficacy of patients with MET amplification using different detection methods who were treated with MET-TKIs was evaluated.
Results:
Plasma ddPCR showed substantial concordance with FISH (74.1% sensitivity, 92.5% specificity, and 87.2% accuracy with a kappa value of 0.68) and outperformed tissue NGS (kappa value of 0.64) in MET amplification detection. Combined plasma ddPCR and tissue NGS showed substantial concordance with FISH (92.3% sensitivity, 89.2% specificity, and an accuracy of 90.1% with a kappa value of 0.77). The efficacy is comparable in these NSCLC patients with MET amplification detected by FISH and plasma ddPCR who were treated with MET-TKIs.
Conclusion:
Plasma ddPCR is a potentially reliable method for detecting MET amplification in advanced NSCLC patients. Combined plasma ddPCR and tissue NGS might be an alternative or complementary method to MET amplification detection.
Keywords
Introduction
Non-small-cell lung cancer (NSCLC) represents the foremost cause of cancer-related mortality globally, with a significant proportion of cases diagnosed in the advanced stages. 1 Mesenchymal–epithelial transition (MET) amplification has recently been identified as a crucial oncogenic driver and a promising therapeutic target in NSCLC. 2 De novo MET amplification occurs in 1–6% of NSCLC patients, correlating with a poor prognosis, and acquired MET amplification occurs in approximately 15% of cases, associated with resistance to epidermal growth factor receptor (EGFR) tyrosine kinase inhibitors (TKIs).3–5 MET amplification predominantly maintains the activation of downstream signaling pathways via phosphatidylinositol-3-kinase (PI3K) signaling stimulation, resulting in EGFR TKI resistance. 6 The dual inhibition of upstream activating proteins (EGFR and MET) within the two PI3K pathways may produce synergistic therapeutic effects. MET-TKIs such as savolitinib,7,8 tepotinib, 9 and capmatinib 10 are employed alongside EGFR TKIs to overcome EGFR-mutated NSCLC in patients exhibiting acquired MET-amplified resistance. Notably, circulating tumor DNA (ctDNA) dynamics during treatment may predict clinical outcomes and provide valuable information for decision-making.11,12 Nonetheless, the efficacy of this treatment varies significantly, potentially due to insufficiently accurate predictive biomarkers. 13
Fluorescence in situ hybridization (FISH) is the current gold standard for detecting MET amplification and assessing the gene copy number (GCN) and MET to chromosome 7 centromere (MET/CEP7) ratio in tumor tissue samples. 14 Patients with MET GCN >6 or MET/CEP7 ratios ⩾2.0 demonstrate objective response rate (ORR) ranging from 16% to 67%. 13 However, this method is often limited by the availability and quality of tumor tissue, which is sometimes difficult to differentiate from different cluster amplification signals without the possibility of monitoring MET amplification.15–17 Other methods to detect MET amplification, including next-generation sequencing (NGS), are limited by their sequencing depth, range, and bioinformatic algorithm disparities between different platforms. Comparative studies of FISH have revealed its limitation in detecting MET amplification. 16
Accurate MET amplification detection is essential for guiding therapeutic decisions and predicting treatment responses. Given these limitations, a more sensitive, specific, and minimally invasive approach for detecting and quantifying MET amplification is warranted.
Droplet digital polymerase chain reaction (ddPCR) is an advanced technology for the absolute quantification of nucleic acid molecules without standard curves. Based on the conventional PCR system, this technique divides the reaction into thousands of microdroplets containing a single nucleic acid template molecule and detects gene mutations or expression abundance with 0.1% sensitivity, surpassing the conventional amplification-refractory mutation system method.17,18 Laura and colleagues performed linear regression analysis on data sets generated by FISH and ddPCR for the MET GCN in both cancer tissue and ctDNA, finding a high correlation between the data produced by the two methods. 19 Oscorbin et al. 20 developed a multiplex ddPCR assay for the simultaneous detection of MET and HER2 amplification and validated it in EGFR-wildtype NSCLC, suggesting potential for MET and HER2 amplification screening in NSCLC. Moreover, Ying Fan et al. found that MET amplification detection via tissue ddPCR aligned closely with FISH results (102/102, 100%), which highlighted the potential of ddPCR as an alternative method for MET amplification detection. 21 However, the direct comparison of tissue FISH and paired plasma ddPCR for MET amplification testing, as well as the clinical utility of ddPCR for MET amplification detection in NSCLC, have not been fully elucidated.
In this study, we aimed to evaluate the performance of plasma ddPCR and tissue NGS in detecting MET amplification in patients with locally advanced or metastatic NSCLC compared to FISH. In addition, we sought to explore the potential of plasma ddPCR for the longitudinal monitoring of MET copy number variations (CNVs) to predict the response to MET-targeted therapy during treatment.
Materials and methods
Patient enrollment and sample collection
Locally advanced or metastatic NSCLC patients treated at Guangdong Lung Cancer Institute were retrospectively enrolled from 1 September 2020 to 31 December 2022. All patients were subjected to MET amplification testing through tumor tissue biopsy using FISH, with paired plasma samples collected approximately 2 weeks before and after the biopsy. Tissue NGS was performed if tumor tissue was available. Furthermore, additional plasma samples were obtained from the patients treated with MET-TKIs at the time of the best response (about 8–12 weeks) after the initial treatment. In addition, peripheral blood samples were retrospectively obtained from 141 healthy individuals, and 49 lung cancer patients with 38 lung cancer tissue samples were used as references to set off the cutoff value.
The patient’s medical records were retrieved to collect baseline clinicopathological data, including patient characteristics and driver mutations. According to RECIST 1.1 (Response Evaluation Criteria in Solid Tumours 1.1), the tumor response was evaluated. Progression-free survival (PFS) was defined as the duration between the date of treatment initiation in the study and the date of disease progression or death from any cause. Kaplan–Meier method was used to present overall and subgroup (MET amplification detected by different methods) PFS data. The last follow-up date was 30 May 2023.
Fluorescence in situ hybridization
Dual-color FISH using a MET/CEP7 dual-color probe (Vysis; Abbott Laboratories, Chicago, United States) was performed on deparaffinized 4 μm thick sections, following the manufacturer’s protocol. A homogeneous distribution of MET signals was confirmed by reading random areas of the slides. In total, 100 nuclei were examined per slide. MET amplification by FISH was defined as a mean GCN greater than or equal to 5 (GCN ⩾ 5), a MET to centromere of chromosome 7 ratio of 2 or more (MET/CEP7 ⩾ 2), or clustered gene amplification that was evident in all nuclei.
Nucleic acid extraction
Nucleic acid was isolated from formalin-fixed and paraffin-embedded (FFPE) tissue using the QIAamp® DNA FFPE Tissue Kit (Qiagen, Hilden, Germany) following the manufacturer’s protocol. Peripheral blood samples (10 mL) from patients and healthy individuals were collected by direct venipuncture with EDTA (ethylenediaminetetraacetic acid) anticoagulant and cell-free DNA (cfDNA) protection reagent vacuum tubes and processed within 12 h. The sample tubes were centrifuged at 2000 rpm for 15 min at room temperature. The plasma was then transferred to 1.5 mL Eppendorf tubes and centrifuged at 12,000 rpm for 5 min. Subsequently, cfDNA was extracted from 3 to 4 mL of the plasma samples using the QIAmp Circulating Nucleic Acid Kit (Qiagen), following the manufacturer’s protocol. The extracted cfDNA was processed for downstream analysis.
Droplet digital PCR
To examine MET amplification, the cfDNA or DNA extracted from the plasma samples or reference tissue was used with the MET amplification ddPCR kit (Shanghai Yuanqi Biomedical Technology Co., Ltd, Shanghai, China), which consists of primers and probes from Yingjun Biotechnology Co., Ltd, Shanghai, China, and an amplicon of 104 bp. The ddPCR reaction measures MET on chromosome 7 and the reference gene EFTUD2 (elongation factor Tu GTP binding domain containing 2) on chromosome 17 (MET ddPCR ratio: MET copies/reference gene copies) (Figure 1). The QX200 ddPCR system was used to measure MET amplification, following the manufacturer’s instructions (Bio-Rad, California, United States). The ddPCR assay involved a 20 µL reaction system containing 10 µL ddPCR Supermix for Probes (Bio-Rad), 2 µL PrimePCR ddPCR CN assay for MET with a 6-carboxyfluorescein (FAM) fluorophore, 2 µL PrimePCR ddPCR CN assay for the reference gene with a 2’-chloro-7’phenyl-1,4-dichloro-6-carboxyfluorescein (VIC) fluorophore, and 6 µL DNA template and nuclease-free water. The gDNA from the tissue samples was approximately 12 ng, while the cfDNA from the peripheral blood samples was at least 1.2 ng. The ddPCR conditions included an initial step at 95°C for 10 min, followed by 40 cycles at 94°C for 15 s, 58°C for 60 s, 98°C for 10 min, and 4°C for 5 min. The Bio-Rad QX200 droplet reader (Bio-Rad) was used to read the plates, and the QuantaSoft software (Bio-Rad) was used for the analysis.
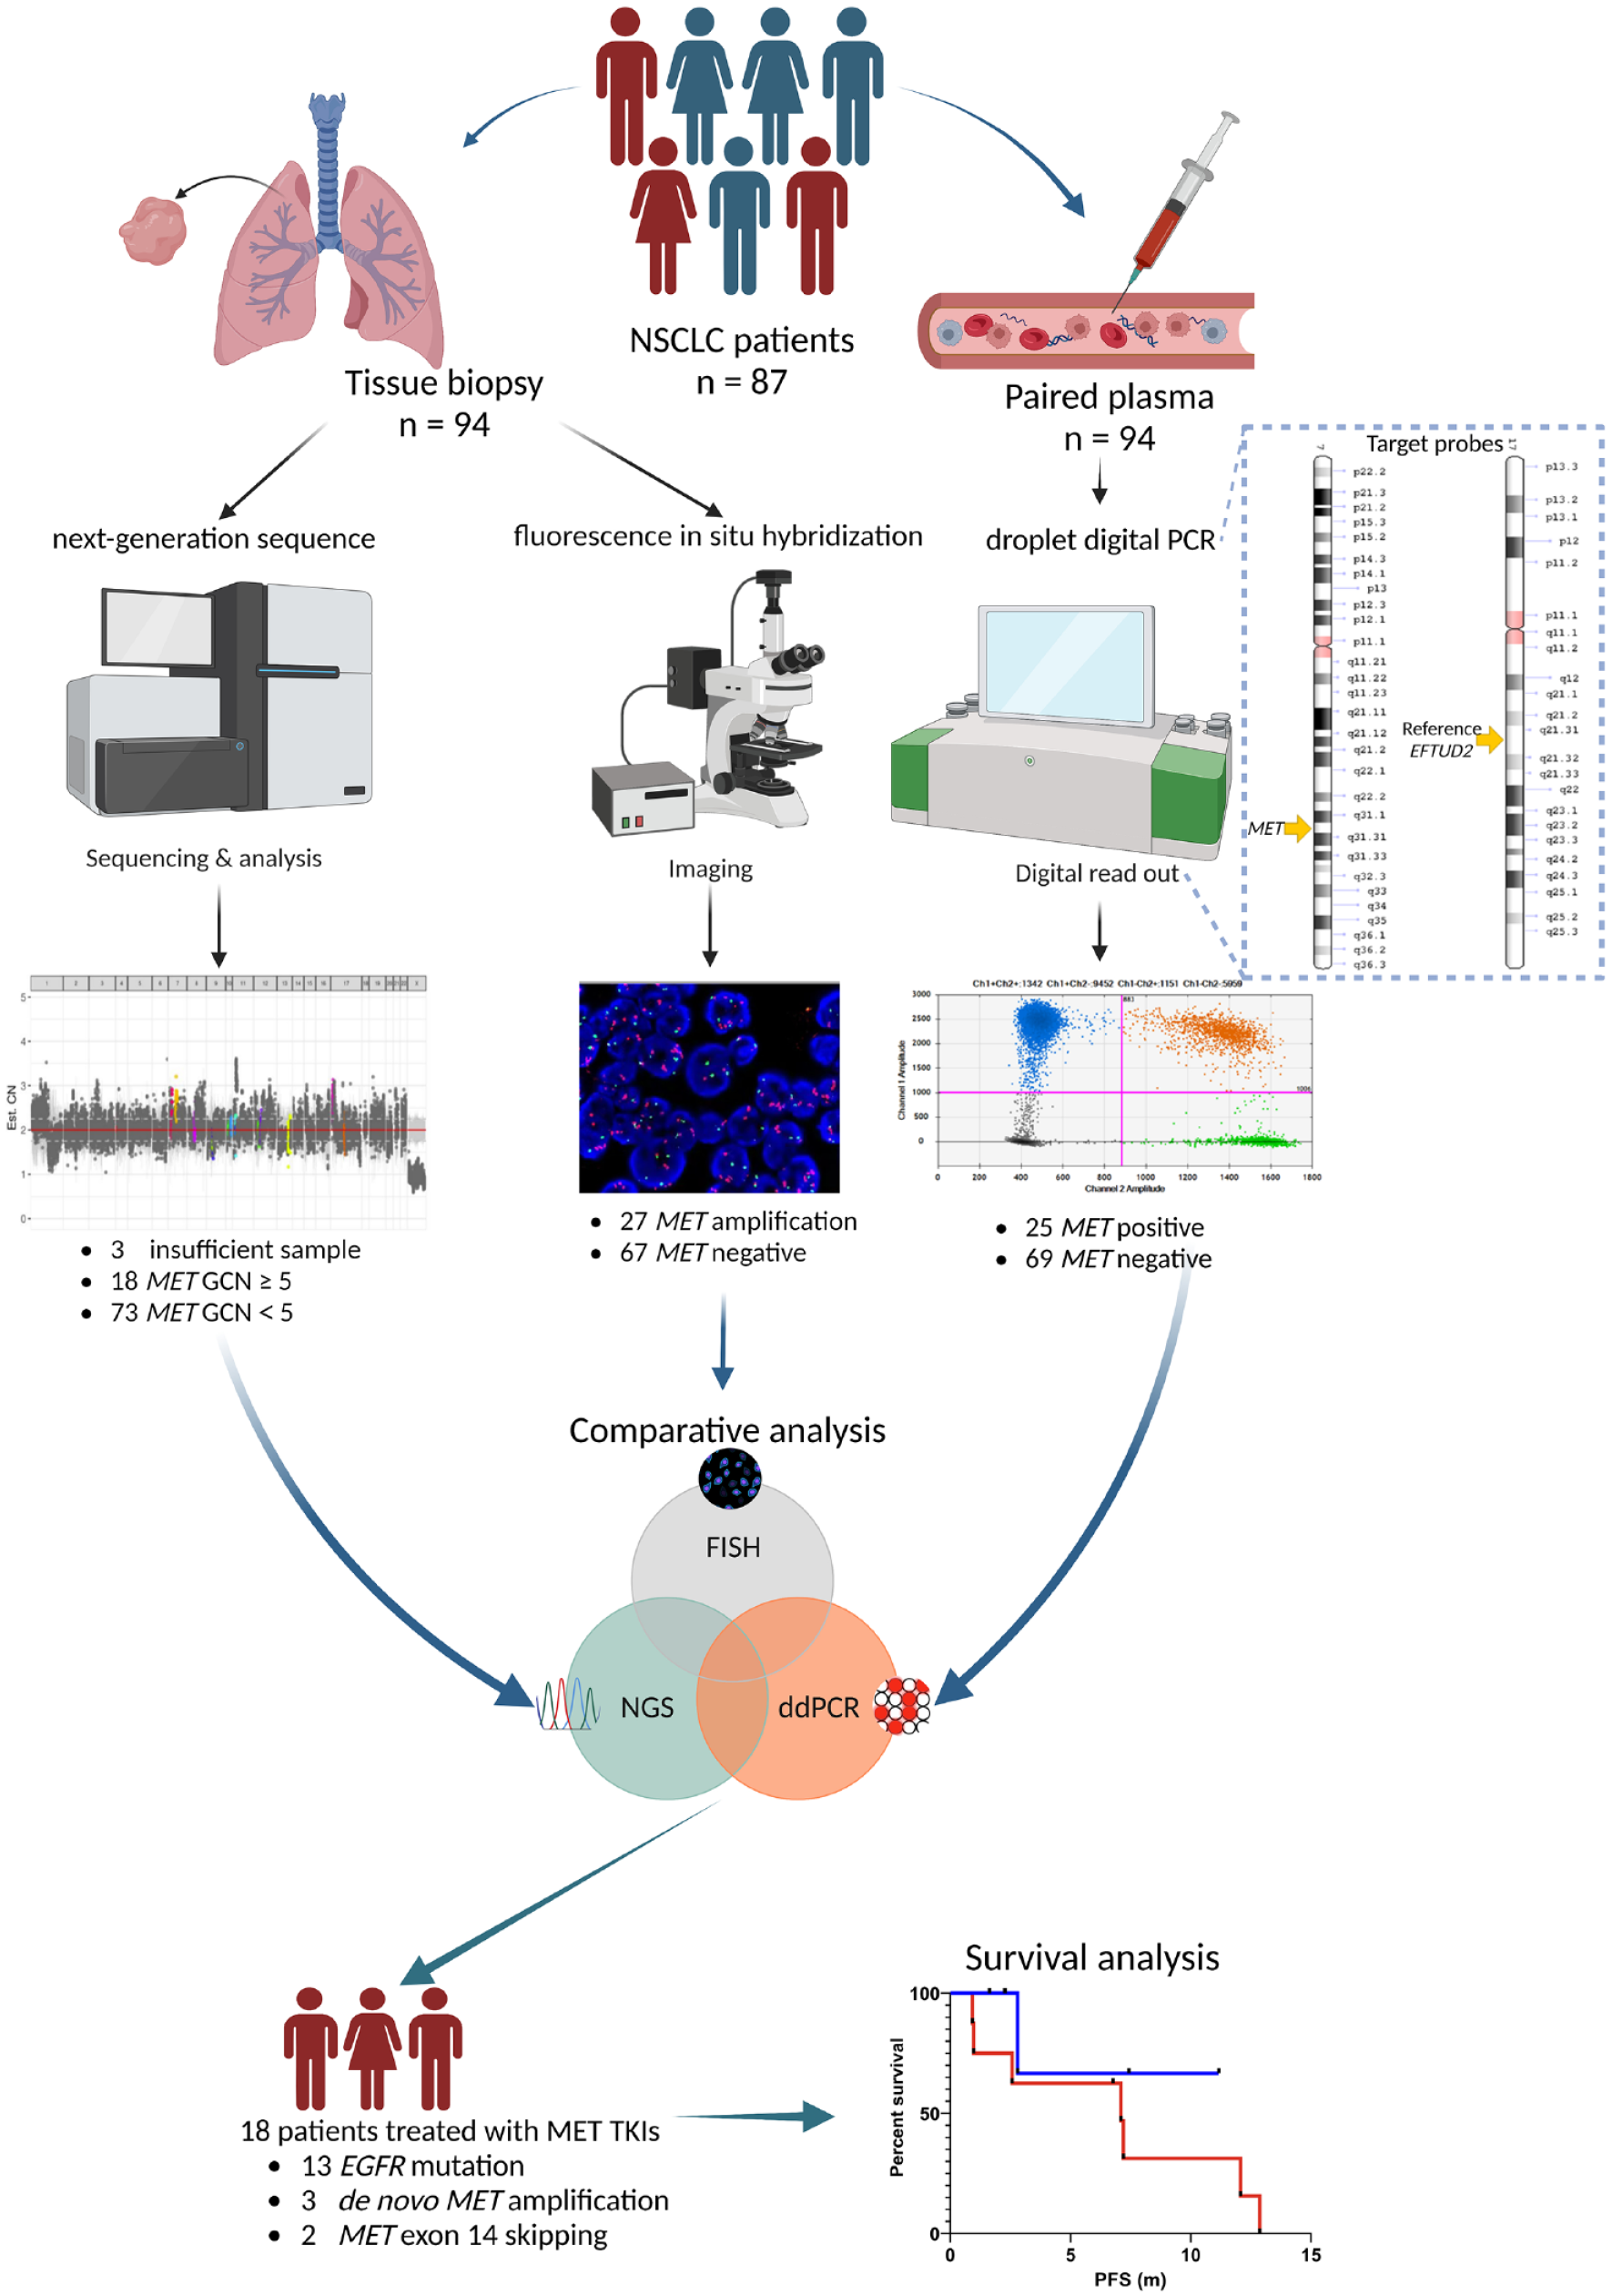
The study flow chart.
Next-generation sequencing
Tissue NGS was performed using either a HiSeq 4000 NGS platform or a NovaSeq 6000 NGS platform from Illumina. To evaluate MET amplification, the GCN ratio was calculated relative to a baseline established from a pool of samples with normal MET status. A GCN of ⩾5 was considered as the criterion for MET amplification, as defined in the TATTON trial. 11 Samples were included if they met the criteria of having ⩾10% tumor cells and a ⩾500× sequencing depth.
Statistical analysis
The statistical analyses in this study were performed using R software version 4.0.5 (R Foundation for Statistical Computing, Vienna, Austria) and GraphPad Prism 9.4 (GraphPad Software, LLC., California, United States). Student’s t-test was used to compare the ddPCR ratios in the plasma between the MET-FISH-positive and -negative groups, while Fisher’s exact test was used to compare the two categorical variables. The κ test was used to evaluate the consistency between plasma ddPCR/tissue NGS and FISH in detecting MET amplification. Receiver operating characteristic curve (ROC) analysis was used to evaluate the sensitivity and specificity of plasma ddPCR in detecting MET amplification. Kaplan–Meier plots were used for survival analysis, and the log-rank test p-value was calculated. The significance tests were two-sided, and a p value of less than 0.05 was considered statistically significant.
Results
Setting the cutoff values of ddPCR
To establish the cutoff values for plasma ddPCR, we first verified its consistency in healthy individuals. We analyzed 141 peripheral blood samples from volunteers who underwent routine medical examinations and found that the ddPCR ratios were evenly distributed between 1.0 and 1.2, averaging around 1. We then analyzed 38 lung cancer tissues and 49 lung cancer patients’ plasma with confirmed FISH results. And observed that both plasma and tissue ddPCR ratios for MET-positive tissues exceeded the value of 2, while those for MET-negative tissues were below 2. The resulting ROC curves had an area under the curve (AUC) of 0.998 and 1.00 for plasma and tissue, respectively (Supplemental Figure S1), enabling us to set the cutoff value for the detection of MET amplification by ddPCR as 2.0.
Patient characteristics and sample collection
A total of 87 patients with locally advanced or metastatic NSCLC with available tissue biopsies and paired peripheral plasma samples (n = 94) were enrolled. The clinicopathological characteristics of the enrolled patients are presented in Table 1. All patients were subjected to FISH testing for MET amplification, which revealed 23 FISH-positive patients (27 samples) and 64 FISH-negative patients (67 samples). Among the FISH-positive patients, 15 patients (65.2%) had acquired MET amplification following TKI treatment for EGFR mutations, 6 patients (26.1%) had de novo MET amplification only, and 2 patients (8.7%) had a combination of both MET exon 14 skipping (MET ex14m) and de novo MET amplification. Of the 23 FISH-positive patients, 17 (73.9%) were treated with MET-TKIs after biopsies. One patient with FISH negative was treated with savolitinib due to MET ex14m. Additional plasma (n = 9) was collected from these patients treated with MET-TKIs at the time of the best response, approximately 8–12 weeks after the initial MET-TKI treatment.
The clinicopathological characteristics of the enrolled patients.

KRAS (n = 3), ROS1 fusion (n = 2), ALK fusion (n = 1), and BRAF (n = 1).
EGFR, epidermal growth factor receptor; FISH, fluorescence in situ hybridization; MET, mesenchymal–epithelial transition; NOS, not otherwise specified; WT, wild type; IHC, immunohistochemistry; NA, not available.
Consistency of plasma ddPCR and FISH in detecting MET amplification
FISH is the standard method used to detect MET amplification. In this study, we evaluated the consistency of plasma ddPCR in detecting MET amplification in comparison with FISH based on 94 paired samples. No significant differences in MET amplification detection by plasma ddPCR across different clinical stages and tumor loads. Our analysis revealed a significant distinction between the plasma ddPCR ratios of the FISH-negative and -positive groups, with mean ratios of 1.59 and 2.82, respectively [Figure 2(a)]. Plasma ddPCR positivity (n = 25) and FISH positivity (n = 27) showed a 62% overlap [Figure 2(b)]. While five FISH-negative samples tested positive upon plasma ddPCR, seven FISH-positive samples tested negative upon plasma ddPCR, resulting in values of 74.1%, 92.5%, 87.2%, and 0.68 for sensitivity, specificity, accuracy, and the kappa value, respectively [Figure 2(c)]. Moreover, the ROC curve demonstrated an AUC of 0.861 for plasma ddPCR in detecting MET amplification [Figure 2(d)]. These findings suggest that plasma ddPCR and FISH have a substantial concordance in detecting MET amplification.

Diagnostic performance of MET FISH amplification based on ddPCR methods. (a) Violin plot of the ddPCR ratios of MET-FISH-positive and -negative groups. (b) Venn diagrams show the overlap between positive results for MET amplification from FISH and ddPCR. (c) The overall correlation between ddPCR-positive and FISH-positive samples. (d) ROC analysis of plasma ddPCR.
Consistency of tissue NGS and FISH in detecting MET amplification
Due to an insufficient amount of tumor tissue, NGS analysis could not be performed for three patients, one of whom was FISH positive, while the other two were FISH negative. For the remaining 91 cases (96.8%), both FISH and NGS results were obtained. Similar to the results of plasma ddPCR, tissue NGS positivity (n = 18) and FISH positivity (n = 26) were frequently observed (57%) [Supplemental Figure S2(A)]. Two FISH-negative cases were positive for tissue NGS, while 10 FISH-positive cases were negative for tissue NGS. Consequently, the sensitivity, specificity, accuracy, and kappa value for tissue NGS in detecting MET amplification were 61.5%, 96.9%, 86.8%, and 0.64, respectively [Supplemental Figure S2(B)]. While the concordance rate for MET amplification by tissue NGS compared to FISH was higher than the value previously reported by our center (62.5%), 22 the plasma ddPCR method demonstrated a numerically superior performance.
Consistency of combined tissue NGS with plasma ddPCR and FISH in detecting MET amplification
A high overlap (93%) was observed between combined tissue NGS with plasma ddPCR positivity and FISH positivity in detecting MET amplification. The relationship between FISH positivity, plasma ddPCR positivity, and tissue NGS positivity is presented in Supplemental Figure S2(C), showing only two cases where FISH positivity was not detected by plasma ddPCR or tissue NGS. Seven of the FISH-negative cases were detected as positive using the combined approach (either ddPCR or NGS is positive), resulting in a substantial concordance with FISH, with a sensitivity of 92.3%, specificity of 89.2%, accuracy of 90.1%, and kappa value of 0.77, as shown in Supplemental Figure S2(D).
Efficacy of MET-TKI treatment and longitudinal plasma ddPCR assessment
A total of 18 patients, including 17 FISH positive and 1 FISH negative with MET ex14m (P60), were treated with MET-TKIs after FISH testing. Most patients (77.8%, 14/18) received savolitinib, the rest patients received crizotinib (2 patients), tepotinib (1 patient), and bozitinib (1 patient). The percentage of maximum shrinkage of target lesions from baseline in all patients with MET-TKIs (three patients lack the data of shrinkage of target lesions because of death) [Figure 3(a)]. Of these, an ORR of 50.0% and disease control rate of 55.6% were determined for all the patients, with a median PFS (mPFS) of 6.1 months [Table 2 and Figure 3(c)]. The ORRs for the MET amplification detected by FISH, plasma ddPCR, tissue NGS, and combined plasma ddPCR with tissue NGS were 47.1%, 50.0%, 54.5%, and 53.3%, respectively, and the differences were not statistically significant. The mPFS is comparable in these patients with MET amplification detected by FISH, plasma ddPCR, and combined plasma ddPCR with tissue NGS who had received MET-TKI treatment.

Exploration of the efficacy and survival of patients treated with MET-TKIs. (a) Percentage of maximum shrinkage of target lesions from baseline in patients with MET-TKIs. (b) PFS hazard ratio for different methods or subgroups. (c) Swimmer plot of PFS with characteristics of patients with MET-TKIs.
ORR and DCR of patients with MET-TKIs.

CI, confidence interval; DCR, disease control rate; ddPCR, droplet digital polymerase chain reaction; EGFR, epidermal growth factor receptor; FISH, fluorescence in situ hybridization; MET-TKI, mesenchymal–epithelial transition tyrosine kinase inhibitor; mPFS, median progression-free survival; NGS, next-generation sequencing; ORR, objective response rate.
Among 13 patients with EGFR mutations who acquired MET amplification after resistance to EGFR TKIs, all of them received EGFR TKI combined with MET-TKI treatment. The ORRs were similar between different assays, with mPFS of 7.1 months. The mPFS is comparable numerically in these patients with MET amplification detected by FISH, plasma ddPCR, and combined plasma ddPCR with tissue NGS who had received MET-TKI treatment [Figure 3(b)]. However, the ORR of patients with prior third-generation EGFR TKI treatment (22.2%, 2/9) was numerically lower than that of patients without this treatment (100%, 4/4), and the PFS was also numerically lower (2.6 versus 12.9 m).
A longitudinal plasma ddPCR assessment was performed on six patients with MET-TKIs [Figure 3(c)]. Most patients (5/6) had a decrease in their plasma ddPCR ratios at the initial response but the difference was not statistically significant (p = 0.105). The remaining patient’s (P42) plasma sample was obtained after 3 months of treatment and was severely hemolyzed. After an additional 3 months, the plasma ddPCR ratio increased to 3.9, while the patient continued partial response (PR). However, the baseline plasma NGS did not detect MET CNV or EGFR T790M in P42, with an insufficient amount of tumor tissue for tissue NGS, which was consistent with the plasma ddPCR result but contrary to the FISH result.
An increase in the plasma ddPCR ratio appeared to be associated with progressive disease (PD) for the treatment of MET-TKIs but the difference was not statistically significant (Supplemental Figure S3). P29 progressed twice after savolitinib treatment, and both biopsies followed by PD confirmed MET amplification by FISH, while the paired plasma ddPCR ratio increased. The same MET FISH positivity was detected in P2 and P12, who underwent tissue biopsies after EGFR/MET dual-target therapy progression. The plasma ddPCR ratio continued to drop but remained positive for P2 and increased but remained negative for P12.
Discussion
While several previous studies have explored ddPCR for MET amplification detection, our study provides a unique comparison in detecting MET amplification between plasma ddPCR and FISH in a real-world setting. Our results demonstrated that plasma ddPCR has substantial concordance with FISH in detecting MET amplification, with an accuracy of 87.2%, kappa = 0.68, and AUC = 0.861. These results are similar to those obtained in previous studies, which indicated that plasma ddPCR has high feasibility for the detection of MET amplification and consistency with the gold standard FISH,19,21,23 suggesting that it may act as an alternative MET amplification detection method when tissue biopsy is not feasible or inadequate tissue.
However, some studies also reported lower consistency between ddPCR and FISH for MET amplification detection. A comparative study suggested that the consistency of ddPCR in detecting tissue MET amplification (using EIF2C1 as the internal reference gene) was only 56%, with a kappa value of 0.25, with the researchers considering that this might be related to factors such as the tumor cell content, signal patterns, and sample quality. 24 Another study suggested that the consistency of plasma ddPCR in detecting MET amplification using RNaseP (Human RiboNuclease P) as the internal reference gene was 55.9%. 25 In addition to the quality of the detected samples, an important reason for these differences is the choice of different internal reference genes. Therefore, ddPCR detection methods (or assays) using different detection probes need to be analyzed separately.
Another inevitable issue with using peripheral blood ctDNA detection is the tumor’s intrinsic barrier. Some tumors do not release tumor DNA into the peripheral blood (such as P42 in this study). One characteristic of ddPCR is its ultra-high sensitivity, rendering it capable of detecting extremely low levels of ctDNA, while with conventional NGS, it is difficult to achieve such a high sequencing depth. One study compared the consistency of ddPCR in detecting MET amplification in tissue and plasma and found an overall consistency of 94.17%, with a kappa value of 0.75, suggesting that the ddPCR assay has good concordance between tissue and plasma samples. 21 Previous studies focused on the exploration of the detection performance of plasma ddPCR for MET amplification testing and a lack of the exploration of clinical efficacy in patients with MET amplification using plasma ddPCR detection. Our study first explored plasma ddPCR for MET amplification testing in a clinical setting.
Our study indicates that tissue NGS achieved an 86.8% concordance rate with FISH for detecting MET amplification. While FISH visualizes chromosomal amplification directly, NGS quantifies DNA fragments, which can lead to variations, especially in marginal cases. Factors such as tumor sample quality and ctDNA quantity also may impact NGS accuracy. Recent technological advancements in NGS, including enhanced molecular identification and error correction, have improved its throughput, sequencing depth, and processing speed.26,27 Consequently, the concordance rate at our center has risen from 62.5% to 86.8%, with a kappa value of 0.64, indicating a significant improvement in performance for detecting MET amplification by tissue NGS.
We also compared the performance of plasma ddPCR with tissue NGS in detecting MET amplification. Our results showed that plasma ddPCR had a slightly higher sensitivity and accuracy than tissue NGS. Moreover, the combination of tissue NGS and plasma ddPCR demonstrated high concordance with FISH, with a sensitivity of 92.3%, specificity of 89.2%, accuracy of 90.1%, and kappa value of 0.77. This combination also represents an optimized method that is more in line with clinical practice. Therefore, the simple addition of a plasma ddPCR test when performing tissue NGS testing on patients with advanced lung cancer can better identify MET amplification in these patients.
Our study showed no significant difference in MET overexpression between the MET-FISH-negative group and -positive group, with some discordance observed even among the MET-FISH-positive group. Previous studies indicate that MET protein overexpression and MET gene amplification may not always coincide, which may impact the efficacy of MET-TKI treatment. The results of MET overexpression testing are influenced by even many factors, including IHC antibody choice, scoring variability, and tumor sample heterogeneity. Given that MET FISH and MET IHC measure different aspects (gene-level alterations versus protein expression), it is crucial to understand that overexpression and amplification could independently predict MET-TKI efficacy. Future exploration should be done to further investigate the relationship between MET amplification and MET overexpression.
Finally, we evaluated the efficacy of MET-TKI treatment and longitudinal plasma ddPCR assessment in these advanced NSCLC patients with MET amplification. Most patients in the MET-TKI subgroup received savolitinib, the only high-selective MET-TKI approved in China. 28 Most patients were FISH positive (only one FISH-negative patient with concurrent MET ex14m was identified), as previous studies have shown that MET amplification and MET ex14m may be effective biomarkers for MET-TKI treatment. Therefore, differences in efficacy between FISH-negative and -positive patients were not evaluated. Among these patients, the ORRs of patients treated by different methods for the detection of MET-TKIs were similar and consistent with the data reported in the TATTON study. This further demonstrates the consistency of plasma ddPCR with FISH in the detection of MET amplification. Plasma ddPCR was found comparable with FISH between the determined MET amplification status and survival benefit of MET-TKI treatment. One possible reason for this is that neither could determine the polysomy in FISH-positive patients. It is considered that MET polysomy has limited sensitivity to MET-TKIs,29,30 but in the TATTON study, amplification and polysomy had similar efficacy in the same cohort. Another factor affecting the efficacy of MET-TKI is whether or not the patients have received third-generation EGFR TKI. We found that in EGFR-mutated and MET-amplified patients, those receiving third-generation EGFR TKI treatment had lower ORR and PFS results than those who were not. This result is also similar to the results observed for B1 and B2 cohorts in the TATTON study. However, caution is required in the interpretation of this result due to the small sample sizes and higher rate of brain metastases.
The longitudinal ddPCR analysis suggested that patients experienced varying degrees of decline in their plasma MET amplification levels after receiving MET-TKIs, although the differences were not statistically significant. In addition, at the time of resistance, the amplification levels increased. This suggests that plasma ddPCR may be a potential tool for the dynamic monitoring of these patients’ treatment response and disease progression. Overall, further exploration of biomarkers for predicting the clinical efficacy of MET-TKIs in patients with MET amplification is still needed.
This study had some limitations. One limitation was the small sample size of MET-positive patients, which might affect the diagnostic performance of these methods. In addition, the relatively small sample size of patients treated with MET-TKIs was a limiting factor. The continuous collection of plasma samples and long-term follow-up of these patients is also challenging. Another limitation is that we did not further investigate the relationship between MET overexpression and MET amplification.
Conclusion
In conclusion, our study supported the utility and feasibility of plasma ddPCR in detecting MET amplification in advanced NSCLC patients. Plasma ddPCR alone or combined with tissue NGS may be a valuable alternative or complementary method to FISH for detecting MET amplification. Potential longitudinal MET CNV assessment by plasma ddPCR may also have clinical implications for treatment decision-making among advanced NSCLC patients with MET amplification. Prospective clinical trials are needed to further validate our findings.
Supplemental Material
sj-pdf-1-tam-10.1177_17588359241229435 – Supplemental material for Plasma ddPCR for the detection of MET amplification in advanced NSCLC patients: a comparative real-world study
Supplemental material, sj-pdf-1-tam-10.1177_17588359241229435 for Plasma ddPCR for the detection of MET amplification in advanced NSCLC patients: a comparative real-world study by Jun-Wei Su, Cheng-Di Weng, Xiao-Cheng Lin, Mei-Mei Fang, Xiao Xiao, Yi-Chen Zhang, Xu-Chao Zhang, Jian Su, Chong-Rui Xu, Hong-Hong Yan, Hua-Jun Chen, Yi-Long Wu and Jin-Ji Yang in Therapeutic Advances in Medical Oncology
Supplemental Material
sj-pdf-2-tam-10.1177_17588359241229435 – Supplemental material for Plasma ddPCR for the detection of MET amplification in advanced NSCLC patients: a comparative real-world study
Supplemental material, sj-pdf-2-tam-10.1177_17588359241229435 for Plasma ddPCR for the detection of MET amplification in advanced NSCLC patients: a comparative real-world study by Jun-Wei Su, Cheng-Di Weng, Xiao-Cheng Lin, Mei-Mei Fang, Xiao Xiao, Yi-Chen Zhang, Xu-Chao Zhang, Jian Su, Chong-Rui Xu, Hong-Hong Yan, Hua-Jun Chen, Yi-Long Wu and Jin-Ji Yang in Therapeutic Advances in Medical Oncology
Supplemental Material
sj-pdf-3-tam-10.1177_17588359241229435 – Supplemental material for Plasma ddPCR for the detection of MET amplification in advanced NSCLC patients: a comparative real-world study
Supplemental material, sj-pdf-3-tam-10.1177_17588359241229435 for Plasma ddPCR for the detection of MET amplification in advanced NSCLC patients: a comparative real-world study by Jun-Wei Su, Cheng-Di Weng, Xiao-Cheng Lin, Mei-Mei Fang, Xiao Xiao, Yi-Chen Zhang, Xu-Chao Zhang, Jian Su, Chong-Rui Xu, Hong-Hong Yan, Hua-Jun Chen, Yi-Long Wu and Jin-Ji Yang in Therapeutic Advances in Medical Oncology
Footnotes
Acknowledgements
We thank all the patients and their families for participating in this study and Yuanqi Biomedical Technology Co., Shanghai, China, for supporting sequencing services.
Declarations
Supplemental material
Supplemental material for this article is available online.
References
Supplementary Material
Please find the following supplemental material available below.
For Open Access articles published under a Creative Commons License, all supplemental material carries the same license as the article it is associated with.
For non-Open Access articles published, all supplemental material carries a non-exclusive license, and permission requests for re-use of supplemental material or any part of supplemental material shall be sent directly to the copyright owner as specified in the copyright notice associated with the article.