
Abstract
Background:
Deeper depth of response (DpR) after induction therapy, especially gain of negative minimal residual disease (MRD), has been linked to prolonged survival in multiple myeloma (MM). However, flow-MRD examination focuses on the numbers but not on the biological characteristics of residual plasma cells (PCs).
Objectives:
To explore whether the genetic features of residual tumor cells affect the survival time of patients with MM.
Design:
A retrospective cohort study.
Methods:
We investigated the clonality of cytogenetic abnormalities (CAs) of the residual PCs using interphase fluorescence in situ hybridization (iFISH) in the National Longitudinal Cohort of Hematological Diseases in China (NCT04645199). Here, a longitudinal cohort of 269 patients with patient-paired diagnostic and post-induction iFISH results was analyzed.
Results:
Persistent CAs after induction therapy were detected in about half of the patients (118/269, 43%), and patients with undetectable CAs showed significantly improved survival compared with those with genetically detectable MRD [median progression-free survival (mPFS): 59.7 versus 35.7 months, p < 0.001; median overall survival (mOS): 97.1 versus 68.8 months, p = 0.011]. In addition, different patterns of therapy-induced clonal evolution were observed by comparing the clonal structure of residual PCs with paired baseline samples. Patients who maintained at a high risk during follow-up had the worst survival (mPFS: 30.5 months; mOS: 54.4 months), while those who returned to lower risk or had iFISH− at both time points had the best survival (mPFS: 62.0 months, mOS: not reached).
Conclusion:
These findings highlighted the prognostic value of genetic testing in residual tumor cells, which may provide a deep understanding of clonal evolution and guide clinical therapeutic strategies.
Plain language summary
Gain of negative minimal residual disease (MRD) has been linked to prolonged survival in cancer treatment. However, in multiple myeloma (MM), detection of MRD-negativity (MRD-) using multiparameter flow cytometry (MFC) only reflects the quantitative characteristics of residual plasma cells (PCs), while the biological and genetic features of MRD are neglected. To address this gap, our study has employed interphase fluorescence in situ hybridization (iFISH) to evaluate the clonality of cytogenetic abnormalities (CAs) of the bone marrow residual PCs after induction therapy, in combined with MRD detection by MFC to predict the prognosis of MM patients. A total of 396 patients from the database of National Longitudinal Cohort of Hematological Diseases in China (ClinicalTrials.gov identifiers: NCT04645199) were enrolled. Persistent CAs after induction therapy were detected in about half of the patients (118/269, 43%), and patients with undetectable CAs showed significantly improved survival compared with those without genetically detectable MRD. In addition, different patterns of therapy-induced clonal evolution were observed by comparing the clonal structure of residual PCs with paired baseline samples. And therapy-induced clonal evolution exerted a significant impact on patient outcomes. These findings highlighted the importance of genetic testing of residual tumor cells after induction therapy, which may represent a reliable complementary technique for flow-MRD detection and provide a further understanding of clonal evolution.
Introduction
A growing body of evidence has indicated a strong correlation between the depth of response (DpR) after induction therapy, especially gain of negative minimal residual disease (MRD), and prolonged survival in multiple myeloma (MM).1–7 As such, MRD status is used as a surrogate endpoint for progression-free survival (PFS) and overall survival (OS) in MM, and persistent MRD negativity (MRD−) was associated with improved long-term outcomes.1,4,8,9 However, a population of patients who acquired MRD− after induction therapy, especially those with high-risk cytogenetics, could still experience a rapid relapse following a transient response.5,10 By contrast, a small proportion of patients with positive MRD (MRD+) after remission may be at lower risk for relapse due to the monoclonal gammopathy of the undetermined significance-like indolent phenotype of residual plasma cells (PCs) than MRD+ patients with resistant clones.11,12 MRD detection by multiparameter flow cytometry (MFC) has been widely accepted in MM, 13 flow-MRD only reflects the quantitative characteristics of residual PCs, while the biological and genetic features of MRD have been ignored.4,5
Both the DpR and genetic profile of residual PCs play important roles in the prognosis of MM patients.6,14 For patients with MRD+ after induction therapy, survival is significantly inferior in those with high-risk cytogenetic abnormalities (CAs) than those without high-risk CAs. 15 In addition, there has been substantial evidence that therapy-induced clonal evolution occurs in MM early after induction therapy.4,5 Furthermore, recent studies exploring MRD dynamics have highlighted that only a subset of patients experience a transition from detectable MRD to undetectable MRD, for those who have undergone autologous stem-cell transplant (ASCT) or received continuous maintenance treatment.16,17 This underscores the urgency of characterizing the biological properties of persistent MRD tumor cells. Characterization of bone marrow (BM) residual PCs can help identify chemo-resistant subclones and guide better-tailored therapy based on the biological features of residual PCs. As a reliable tool to detect CAs in tumor cells, interphase fluorescence in situ hybridization (iFISH) assays have served as the cornerstone for MM risk stratification at diagnosis. 18 However, while iFISH assays are generally performed in newly diagnosed (ND) and relapsed patients with MM, CAs after induction therapy are less commonly detected. The low application of iFISH to detect the CAs after remission is attributed to the low numbers of PCs and the limitation of techniques. 19 To overcome this, our center has employed magnetic assisted cell sorting approach which can isolate at least 2 × 10⁵ CD138+ residual PCs to elevate iFISH detection efficiency.
In this study, we first investigated the potential utility of iFISH in MM patients after induction therapy to evaluate the clonality of CAs of the BM residual PCs. Then, we explored the clonal evolution patterns by comparing the clonal structure of residual PCs with paired baseline samples and assessed the prognostic value of therapy-induced clonal evolution.
Methods
Data source and study population
The present study was based on the National Longitudinal Cohort of Hematological Diseases in China (NCT04645199). A total of 396 patients diagnosed with newly diagnosed MM (NDMM) between January 2014 and March 2020 were included in this study. Inclusion criteria included the following: (1) MM defined by the International Myeloma Working Group (IMWG) consensus, 13 (2) underwent iFISH examination at diagnosis and within 6 months post-induction. Exclusion criteria included the following: (1) received less than four cycles of induction therapy, (2) achieved less than partial response (PR) after induction therapy, and (3) obtained an insufficient number of PCs using CD138+ magnetic beads. Patients received proteasome inhibitor- (PI), immunomodulatory drug- (IMiD), or PI plus IMiD-based induction, as previously reported. 20 DpR was assessed according to the IMWG consensus, 13 and the maximal DpR during induction therapy was recorded. PFS was defined as the time interval from the start of induction therapy to the date of death, progression, or last follow-up. OS was calculated from the start of induction therapy to the date of death or last follow-up. This study was approved by the local institutional ethics committees led by the Institute of Hematology and Blood Diseases Hospital, Chinese Academy of Medical Science, and Peking Union Medical College. All patients provided informed consent prior to enrollment in accordance with the declaration of Helsinki.
iFISH examination at diagnosis and post-induction
Ethylenediaminetetraacetic acid-anticoagulated BM aspirate samples were collected at diagnosis for all 396 patients included in this study, and clonal PCs were enriched by CD138+ magnetic beads purchased from Miltenyi Biotec (Paris, France) as previously described. 5 iFISH was then performed on the enriched CD138+ PCs, and a total of 200 interphase nuclei were analyzed. DNA probes specific for 13q14, 17p13, dual color, dual fusion probes for t(4;14)(p16;q32), t(11;14)(q13;q32), and t(14;16)(q32;q23), and IgH dual color break-a-part rearrangement probe were purchased from Abbott Molecular (Des Plaines, IL, USA).5,6,21 While DNA probes specific for 1q21 were purchased from BAC/PAC Resources (Redmond, WA, USA). 22 High-risk CAs were defined as the presence of del(17p), gain/amp(1q), t(4;14), and/or t(14;16). 18 After induction therapy, 20–30 mL of BM was collected for clonal PC enrichment and iFISH examination, and at least 2 × 10⁵ CD138+ PCs were enriched at a purity of more than 95% from 269 patients who underwent the same iFISH examination procedure as at diagnosis. Considering that CD138 is expressed both on the surface of clonal PCs and by normal and reactive PCs.23,24 The clonal size of unique CAs (ρ) was adjusted to the percentage of normal PCs using the following formula: ρ = fca × (nc + nn)/nn, where fca was the clonal size of specific CAs identified by iFISH. nc and nn were the fractions of clonal or normal PCs by MFC, respectively. The cutoff level of CAs in post-induction was set at 10% based on the results of previous studies.5,25,26
Assessment of MRD
BM aspirate samples were collected and immunophenotyped by MFC using 2 combinations of an 8-color panel for 13 different markers (CD38, CD138, CD45, CD19, CD20, CD27, CD28, CD56, CD81, CD117, CD200, cKappa, and cLamda). 5 To reduce the effect of peripheral blood dilution on MRD detection, the first tube of BM was used for MRD assessment. At least 500,000 nucleated cells were acquired, and the cutoff for MRD− was set at less than 50 clonal PCs out of the total nucleated cells at a 10−4 to 10−5 sensitivity level. Clonal PCs were identified based on the expressions of CD38, CD138, CD45, and light scatter features following recommendations based on clinical consensus.13,27 Post-induction flow-MRD status was assessed in 259 patients with at least PR after four to six cycles of induction therapy. Patients were stratified based on post-induction iFISH and flow-MRD examination into four clusters: (1) iFISH− and MRD−, (2) iFISH+ and MRD−, (3) iFISH− and MRD+, and (4) iFISH+ and MRD+. The regular flow-MRD examination was then performed after ASCT/consolidation treatment every 3 months during maintenance and at first relapse for patients who progressed.
Statistical analysis
Statistical analyses were performed using SPSS (version 26.0; IBM, Chicago, IL, USA) and R (version 4.2.2; R Foundation, Vienna, Austria). Continuous variables were compared using Student’s t-test or Mann–Whitney U test based on the variables’ distributional statistics. Statistical significance between different groups was calculated using the χ2 test or Fisher’s exact test. The Kaplan–Meier method was used to plot survival curves and the survival curves were compared using the two-sided log-rank test. A multivariable Cox proportional hazard regression was used to assess the impact of variables on PFS and OS. Two-sided p < 0.05 was considered statistically significant.
Results
Characteristics of the study population and study design
The baseline demographic and treatment characteristics of the 396 patients with NDMM between January 2014 and March 2020 who were included in this study are summarized in Supplemental Table S1. The median age was 57 years, and 55% were males; 28% of the participants had a revised international staging system (R-ISS) stage of III, 51% had high-risk CAs at baseline, and 52% underwent first-line ASCT. Patients in the PI-based (n = 252), IMiD-based (n = 35), and PI + IMiD-based (n = 112) groups had comparable clinical and treatment characteristics in terms of hemoglobin, β2-microglobulin, lactate dehydrogenase (LDH), serum M-component, and first-line ASCT rate, and 61 (24%), 10 (30%), and 29 (26%) of patients with PI-based, IMiD-based, and PI + IMiD-based induction, respectively, had high-risk cytogenetics detected by iFISH at diagnosis.
Details of the study design are depicted in Figure 1(a). The cohorts included 396 NDMM patients, patients received four to six cycles of induction therapy and achieved at least PR were then screened for post-induction iFISH analysis. A total of 60 patients who achieved DpR below PR or received fewer than four cycles of induction therapy were excluded. The remaining 336 patients underwent post-induction iFISH examination, and 269 patients had sufficient CD138+ PCs purified from BM for successful examination by iFISH. The median follow-up time was 41.5 months (25th/75th, 26.5/61.4 months) for 269 patients who underwent post-induction iFISH analyses.

Prognostic value of genetically detectable MRD. (a) Flow diagram of patient inclusion in subanalyses with clinical questions answered by each analysis denoted. Study profile: NICHE, National Longitudinal Cohort of Hematological Diseases in China. (b) Comparison of PFS for two groups of patients according to post-induction iFISH status. (c) Comparison of OS for two groups of patients according to post-induction iFISH status.
In terms of DpR, PR, very good PR (VGPR), complete response (CR), and stringent complete response (sCR) were achieved in 40 (15%), 56 (21%), 97 (36%), and 76 (28%) patients, respectively, after induction therapy (Table 1). Both the median serum M-component and the percentage of PCs by conventional morphology decreased as the DpR deepened. Moreover, 243 (90%) patients were observed with at least one CA at diagnosis, and persistent CAs were detected by iFISH in post-induction PCs for patients achieving PR (27/40, 68%), VGPR (30/56, 54%), and CR or sCR (61/173, 35%). The proportion of patients with high-risk CAs post-induction, such as del(17p), decreased significantly with the deepening of response, with 15% at PR, 7% at VGPR, and 5% at CR or sCR (Table 1).
Biological characteristics of clonal PCs in 269 paired samples: at diagnosis and post-induction.

t(14; undefined): patients with an undefined abnormality of the 14q32 loci not corresponding to one of the above three described common translocations.
High-risk CA: presence of t(4;14), t(14;16), gain/amp(1q), and/or del(17p).
CA, cytogenetic abnormalities; CR, complete response; Del, deletion; MFC, multiparameter flow cytometry; MRD, minimal residual disease; PC, plasma cell; PR, partial response; sCR, stringent complete response; VGPR, very good partial response.
Genetically detectable MRD is associated with poor prognosis in MM
Patients with post-induction iFISH results were categorized into four groups according to the fractions of residual PCs involved: (1) 0–10%, (2) 10.5–20%, (3) 20.5–50%, and (4) >50%. The clonal size of unique CAs in most patients ranged between 0% and 10%, and OS decreased as the proportion of clonal PCs harboring high-risk CAs increased. High frequencies of IgH translocation in post-induction clonal PCs were persistently observed (Supplemental Figure S1).
The survival of patients with the presence of high-risk CAs (i.e. >10%) was significantly inferior to those with undetectable high-risk CAs (i.e. 0–10%; Supplemental Figure S2). Patients with del(17p) experienced significantly inferior survival compared to those without del(17p) [median PFS (mPFS): 27.3 versus 52.2 months, Supplemental Figure S2(a); median OS (mOS): 54.4 versus 92.7 months, Supplemental Figure S2(b)]. For standard-risk CAs, such as del(13q), the absence of CAs in residual PCs was associated with prolonged PFS [mOS: 53.3 versus 40.5 months, Supplemental Figure S2(i)]. Patients were then categorized into two groups according to the cell fractions of post-induction CAs, including the iFISH-positive (iFISH+) group with 118 (44%) patients whose clonal size was more than 10%, and the iFISH-negative (iFISH−) group with 151 (56%) patients whose clonal size less than 10%. Significantly inferior outcomes were observed in the iFISH+ group [mPFS: 35.7 versus 59.7 months, Figure 1(b); mOS: 68.8 versus 97.1 months, Figure 1(c)].
To further evaluate the features between patients with iFISH+ and iFISH− after induction therapy, we collected the basic characteristics of patients, no significant differences were observed at baseline in terms of age, sex, karyotype abnormality, extramedullary infiltration, and high-risk CAs. A higher frequency of high-risk CAs was seen in the iFISH− group at baseline compared with those in the iFISH+ group, although the difference was not statistically significant (63% versus 59%, p = 0.615). Besides, a slightly higher proportion of patients in the iFISH− group were found with elevated serum LDH levels (18% versus 14%, p = 0.077) (Table 2).
Baseline characteristics of patients with different post-induction iFISH status.

Cutoff of elevated serum LDH level: 248 U/l.
High-risk CA: presence of t(4;14), t(14;16), gain/amp(1q), and/or del(17p).
CAs, cytogenetic abnormalities; iFISH, interphase fluorescence in situ hybridization; IMiD, immunomodulatory drug; LDH, lactate dehydrogenase; MFC, multiparameter flow cytometry; MRD, minimal residual disease; PI, proteasome inhibitors.
iFISH in combination with flow-MRD provides a comprehensive evaluation of the quantitative and biological characteristics of residual PCs
In the analysis of the impact of flow-MRD on survival, PFS and OS were observed to be significantly inferior for MRD+ patients (110/259, 42%) compared with MRD− (149/259, 58%) after induction therapy [mPFS: 32.56 versus 59.66 months, Figure 2(a); mOS: 68.17 versus 89.33 months, Figure 2(b)]. While flow-MRD only provides quantitative information on residual PCs, post-induction iFISH explores the biological and genetic features of residual PCs. The combination of post-induction flow-MRD with iFISH, however, leverages common tests and clinical practice. Therefore, we further stratified patients based on post-induction iFISH and flow-MRD examination into four clusters: (1) iFISH− and MRD− was observed in 101 (39%) patients with clonal size less than 10% and flow-MRD analysis was negative, (2) iFISH+ and MRD− was observed in 48 (19%) patients with clonal size more than 10% and flow-MRD analysis negative, (3) iFISH− and MRD+ in 45 (17%) patients who achieved iFISH− though flow-MRD results were positive, and (4) iFISH+ and MRD+ was observed in 65 (25%) patients in whom the fraction of PCs with any unique CA was more than 10% and flow-MRD was positive. Table 2 summarizes the baseline characteristics of the four patient clusters.

iFISH in combination with flow-MRD. (a) Kaplan–Meier curve of PFS according to post-induction MRD status. (b) Kaplan–Meier curve of OS according to post-induction MRD status. (c) Comparison of PFS for four groups of patients according to post-induction iFISH and MRD status. (d) Comparison of OS for four groups of patients according to post-induction iFISH and MRD status.
iFISH− and MRD− patients had better PFS and OS outcomes compared with iFISH+ and MRD+ patients [mPFS: 70.74 versus 26.97 months, Figure 2(c); mOS: not reached versus 61.63 months, Figure 2(d)]. Notably, patients with iFISH+ and MRD− and iFISH− and MRD+ experienced similar survival outcomes [mPFS: 46.98 versus 39.36 months, Figure 2(c); mOS: 72.44 versus 68.17 months, Figure 2(d)]. Further analyses revealed that patients with high-risk CAs experienced significantly worse survival than those without CAs after induction therapy, regardless of MRD status (Supplemental Figure S3). The differences in outcomes experienced by patients with flow-MRD negativity supported the clinical value and complementarity of exploring the CA in residual PCs by iFISH examination. The DpR was significantly better for patients with iFISH− than iFISH+ and MRD− than MRD+ regardless of the similar treatment option [Supplemental Figure S4(a)], which suggested that deeper DpR may help in eliminating residual PCs, both in quantity and in clonality.
Post-induction iFISH remains a prognostic indicator across disease stage, MRD status, and treatment regimens
We then investigated whether post-induction iFISH status affects the prognosis of MM patients in the subgroup analyses. Our data revealed that patients with iFISH− experienced better survival in almost all subgroups, both for PFS (Table 3) and OS (Supplemental Table S2). In addition, iFISH+ patients were observed with inferior outcomes, even after receiving first-line ASCT [mPFS: 39.0 versus NR months, hazard ratio (HR) = 3.67; mOS: 72.3 versus NR months, HR = 3.83]. Besides, similar outcomes were observed between patients with post-induction iFISH− and iFISH+ in the IMiD-based induction subgroup [HR for mPFS, 1.06 (95% CI, 0.39–2.84) and HR for mOS, 0.64 (95% CI, 0.19–2.12)]. Multiple parameters including age, post-induction DpR, R-ISS stage, post-induction iFISH, induction therapy regimens, and first-line transplantation were used to execute the multivariate analysis, and the result showed that iFISH+ exerted a negative impact on both PFS and OS [HR for mPFS, 1.48 (95% CI, 0.98–2.22) and HR for mOS, 1.61 (95% CI, 0.92–2.79), Supplemental Table S3].
Forest plots of HRs for mPFS according to post-induction iFISH+ and iFISH− for 269 patients who underwent post-induction iFISH analyses.

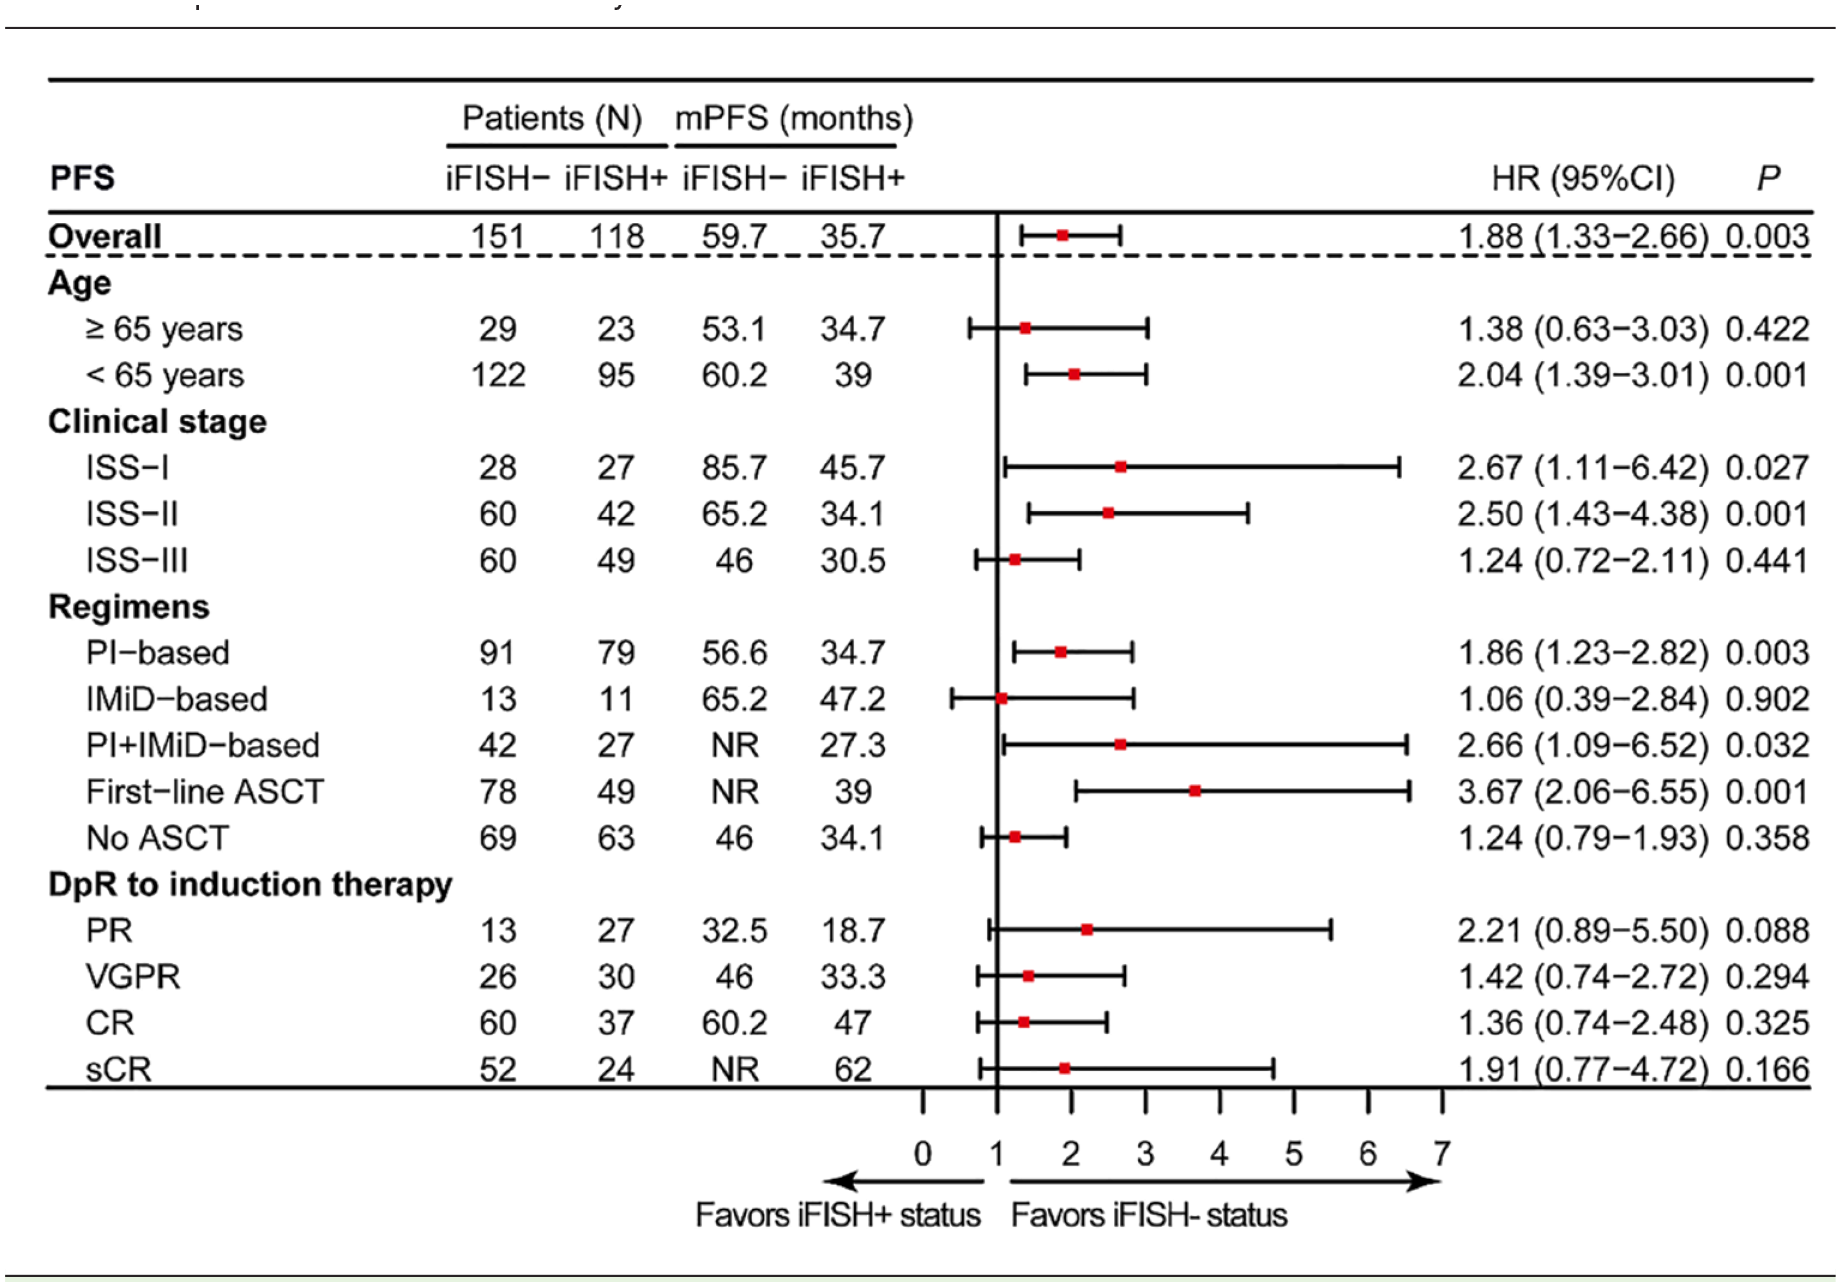
ASCT, autologous stem cell transplantation; CI, confidence interval; HR, hazard ratio; iFISH, interphase fluorescence in situ hybridization; ISS, international staging system; mPFS, median progression-free survival; NR, not reached.
Therapy-induced clonal evolution confers a poor prognosis in MM
By comparing the CAs detected by iFISH at diagnosis, we observed significant inter-tumor heterogeneity. The most recurrent CAs at diagnosis were del(13q) in combination with gain/amp(1q) (46/269, 17%), followed by gain/amp(1q) alone (39/269, 14%) and del(13q) alone (39/269, 14%) [Figure 3(a)]. Surprisingly, relatively more patients (45/269, 17%) were found with combinations of gain/amp(1q) and other CAs or gain/amp(1q) alone after induction therapy [Figure 3(b) and (c)]. Moreover, our result suggested that for the majority of patients with persistent translocation after induction therapy, the clonal size did not change significantly relative to the baseline [Figure 3(d)]. Taken together, the heterogeneous composition and changes in clonal structure reflected the clonal evolution induced by induction therapy, which resulted in the relatively increasing frequency from diagnosis to post-induction of gain/amp(1q).

The CAs profiles between two time points. Upset plot of patients’ baseline (a) and post-induction (b) CAs detected by iFISH. (c) Number of specific CAs detected by iFISH at diagnosis and after induction therapy. (d) Comparison of the clonal size of translocations at diagnosis and after induction therapy for patients with IgH translocations at baseline.
Surprisingly, a significantly smaller proportion of patients were detected with standard-risk or high-risk CAs after induction therapy than those at diagnosis [standard risk: 15% versus 30%; high risk: 60% versus 29%; Figure 4(a)]. Our result showed that the residual high-risk CAs after treatment come, on the one hand, from high-risk clones at diagnosis that were resistant to induction therapy and, on the other hand, from high-risk clones that were screened in patients with only standard-risk CAs at diagnosis [Figure 4(b)]. Patients with post-induction high-risk CAs experienced significantly inferior outcomes compared with those without CAs or only with standard-risk CAs [Supplemental Figure S5(a) and(b)].

The prognostic significance of therapy-induced clonal evolution. (a) iFISH status at diagnosis and after induction therapy. Two-sided Fisher’s exact test (*p < 0.05; NS). (b) Distribution and migration of patients’ iFISH status at diagnosis and remission. Group A, patients with iFISH− at both time points. Group B, patients with standard risk at both time points. Group C, patients with standard risk at diagnosis and returned to iFISH− after induction therapy. Group D, patients with standard risk at both time points. Group E, patients with standard risk at diagnosis and evolved to high risk after induction therapy. Group F, with high risk at both time points. PFS (c) and OS (d) among patients with different risk status evolutionary patterns, the color of each group corresponds to (b) (*p < 0.05; **p < 0.01, ***p < 0.001). (e, f) Six evolutionary patterns are merged into three groups according to the survival curves in (b) and (c). Kaplan–Meier curves for PFS (e) and OS (f) are presented. *p < 0.05, **p < 0.01, ***p < 0.001, by two-sided log-rank test.
We thus investigated the prognostic value of evolution in risk status during induction treatment. Patients were grouped into six clusters according to the evolutionary patterns of risk status between the two time points [Figure 4(b)]. Our results indicated that patients returned to standard risk or iFISH− after induction therapy or had iFISH− at both time points (Groups A–C) had the best survival (mPFS: 62.0 months; mOS: not reached), while patients maintained at standard risk or with standard risk at diagnosis and evolved to high risk after induction therapy (Groups D and E) had the intermediate survival (mPFS: 52.2 months; mOS: 92.7 months), and patients in Group F (maintain at high risk during follow-up) experienced the worst survival among all patients (mPFS: 30.5 months; mOS: 54.4 months) [Figure 4(c)–(f)]. Furthermore, our results indicated no correlation between treatment regimens and patterns of risk status evolution (data not shown). Taken together, these results suggested that the clearance of CAs after induction therapy was associated with improved outcomes, whereas the persistence of minor chemo-resistant clones after induction therapy might contribute to patients’ poor prognosis.
Discussion
Our study showed that persistent CAs after induction therapy were detected in about half of the patients (118/269, 43%), and patients with undetectable CAs showed significantly improved survival compared with those without genetically detectable MRD. Furthermore, different patterns of therapy-induced clonal evolution were observed by comparing the clonal structure of residual PCs with paired baseline samples. And therapy-induced clonal evolution exerted a significant impact on patient outcomes. These findings suggested the following: (1) both the DpR and the biological profile of residual PCs most likely played equally crucial roles in the outcome of MM patients15,28,29; (2) risk stratification should be re-evaluated after induction therapy; (3) consolidation and maintenance regimens should be optimized according to post-induction iFISH.
Since the prognostic significance of baseline high-risk CAs is most pronounced at diagnosis, and the presence of baseline high-risk CAs was no longer associated with OS in patients who survived 3 years, 30 the prognostic significance of iFISH examination warrants reevaluation. Although it was considered to be a challenge to isolate rare residual PCs from BM of MM after induction therapy, 19 sufficient numbers of residual PCs were purified for iFISH by CD138+ magnetic bead sorting in most patients (269/336, 80%) in this study, and our methodological approach provided the feasibility to explore the biological characteristics of residual PCs.
An MRD− response may be transient for high-risk patients since the CA clones are not completely eliminated during induction therapy, and rapid regrowth occurs during relapse. 31 In fact, for post-induction iFISH+ patients, only the sensitive clones were eradicated during therapy, and the aggressive clones were selected under systemic treatment.32,33 The application of iFISH examination after induction therapy provided biological characteristics of the primary chemo-resistant clonal PCs that persist at the MRD level. 4 Several factors may contribute to the presence of CAs in MRD− patients. First, previous studies have shown that flow MRD results may underestimate the number of MRD tumor cells remaining after induction therapy, especially when an insufficient number of cells are analyzed or when the proportion of MRD tumor cells remaining is too low. 34 Therefore, it was possible to obtain sufficient numbers of PCs using CD138+ magnetic beads in MRD − patients after induction therapy and to perform iFISH examination. Second, single-cell RNA sequencing of enriched CD138+ residual PCs also indicated the presence of PCs with Cas even in achieved MRD – after induction therapy (our group’s unpublished data).
With regard to clonal evolution, we explored the prognostic value of evolution in risk status during treatment. Likewise, there were no differences in PFS and OS for patients who had high-risk Cas at both time points compared with those who developed higher-risk Cas after induction therapy. We explored six evolutionary patterns of risk status between diagnosis and post-induction. Our results showed that patients returned to lower risk or iFISH – after induction therapy or had iFISH – at both time points (Groups A–C) had the best survival, while those maintained at high risk experienced the worst survival among all patients. These results suggested that the persistence of minor chemo-resistant clones might had a notable adverse impact on patient outcomes.
Several potential criticisms need to be addressed in the future. First of all, despite the profound tumor cytoreduction, we were able to purify enough residual PCs for the iFISH examination. However, compared with flow MRD, iFISH, with its requirement for enough number of PC and its relatively insufficient sensitivity, makes it less applicable in clinical practice. In addition, although patients were enrolled in a prospective study, the treatment cycles were slightly different, which may have exerted different selection pressures and resulted in different iFISH statuses after therapy. This weakness could be overcome by future studies with unified treatment regimens and pre-planned sampling time.
Conclusion
In summary, our study underscores the importance of tumor cell biological characteristics examinations post-induction among patients with NDMM. We demonstrated that patients continued to have high frequencies of CAs after therapy. iFISH examination after induction therapy not only provided a complementary tool to flow-MRD but also deciphered the cytogenetic profiles of residual PCs based on the quantification of these residual PCs. This comprehensive approach of combining flow-MRD and iFISH examination leverages common tests. Therefore, it may be practical to adapt in clinical practice to help identify the resistant clones and guide risk-adapted treatment strategies.
Supplemental Material
sj-docx-1-tam-10.1177_17588359231221340 – Supplemental material for Longitudinal genetically detectable minimal residual disease by fluorescence in situ hybridization confers a poor prognosis in myeloma
Supplemental material, sj-docx-1-tam-10.1177_17588359231221340 for Longitudinal genetically detectable minimal residual disease by fluorescence in situ hybridization confers a poor prognosis in myeloma by Jian Cui, Tengteng Yu, Rui Lv, Jiahui Liu, Huishou Fan, Wenqiang Yan, Jingyu Xu, Chenxing Du, Shuhui Deng, Weiwei Sui, Matthew Ho, Yan Xu, Kenneth C. Anderson, Xifeng Dong, Lugui Qiu and Gang An in Therapeutic Advances in Medical Oncology
Footnotes
References
Supplementary Material
Please find the following supplemental material available below.
For Open Access articles published under a Creative Commons License, all supplemental material carries the same license as the article it is associated with.
For non-Open Access articles published, all supplemental material carries a non-exclusive license, and permission requests for re-use of supplemental material or any part of supplemental material shall be sent directly to the copyright owner as specified in the copyright notice associated with the article.