
Abstract
Objective:
Long non-coding RNAs have been demonstrated to be involved in the progression of a variety of cancers, including glioma. Through microarray analyses, long intergenic non-protein coding RNA 00475 (LINC00475) was identified in the glioma development. However, its potential role remains incompletely understood. This study aimed to elucidate the effect of LINC00475 on the development of glioma under hypoxic conditions.
Methods:
Glioma cells underwent hypoxic treatment and were collected. The functional role of LINC00475 and AGAP2 in glioma was determined using ectopic expression, depletion, and reporter assay experiments. Then, the expression of LINC00475, microRNA (miR)-449b-5p, AGAP2, FAK, and HIF-1α was determined. In addition, cell migration and invasion were examined. Finally, a tumor xenograft was carried out in nude mice to explore the role of LINC00475 on oxidation in vivo.
Results:
LINC00475 was identified to be overexpressed in hypoxic glioma samples, which was further observed to bind to and down-regulate miR-449b-5p, and negatively targeted AGAP2. Moreover, we also revealed a positive correlation between LINC00475 and AGAP2 expression in glioma. In addition, silencing of LINC00475 decreased the extent of FAK phosphorylation and reduced the expression of HIF-1α and AGAP2. It was also observed that LINC00475 silencing suppressed glioma cell proliferation, migration, and invasion, and promoted cell apoptosis. Moreover, oxidation of nude mice was promoted by LINC00475 silencing.
Conclusion:
Taken together, LINC00475 silencing exerted an inhibitory effect on glioma under hypoxic conditions by down-regulating AGAP2 via up-regulation of miR-449b-5p.
Introduction
Malignant glioma is one of the most prevalent tumors of the central nervous system, accounting for 10% of all cancers, while the 5-year survival rate of glioblastoma (GBM), the most invasive subtype, is less than 5%. 1 The occurrence of glioma is attributed to numerous risk factors, such as excessive use of cellular phone, occupational exposure, and exposure to ionizing radiation. 2 Hypoxia is a condition which unavoidably occurs in rapid-growing tumors, including glioma, even with invasive angiogenesis. 3 Currently, gliomas are primarily treated with surgical resection and a combination of radiotherapy and chemotherapy. 4 However, the survival rate of glioma remains low, owing to the complex gene interactions and molecular modulations. 5 Thus, it is trivial to investigate functional molecular targets and therapeutic strategies for glioma treatment. 6 Long non-coding RNAs (lncRNAs), a group of more than 200 nucleotides in length, have limited or no protein-coding capacity and participate in various biological processes, such as cell growth and transcriptional regulation as well as tumorigenesis.7,8 It has been demonstrated that long intergenic non-protein coding RNA 00475 (LINC00475) can be activated by p53, which is up-regulated in glioma tissues,9,10 suggesting the potential up-regulation of LINC00475 expression in glioma tissues. Furthermore, LINC00475 has been identified to be significantly associated with the prognosis of patients with glioblastoma multiforme (GBM; grade IV glioma). 11 According to the biological prediction website available at https://cm.jefferson.edu/rna22/Interactive/, a binding site existed between LINC00475 and microRNA (miR)-449b-5p. A few binding sites of miR-449b-5p and Arf GTPase-activating protein 2 (AGAP2) were obtained from the website available at http://www.mirbase.org/. More intriguingly, miR-449b has been demonstrated to serve as an antioncogene in various cancers, such as colon cancer and prostate cancer. 12 Moreover, a previous study reported that miR-449b-5p is down-regulated in glioma tissues relative to non-cancerous brain tissues and its overexpression reduces glioma cell proliferation, invasion, and migration. 13 AGAP2, also known as phosphatidylinositol 3-kinase enhancer A (PIKE-A), is also distributed in several tissues. It possesses the ability to regulate cancer cell invasion and apoptosis by interacting with Akt and up-regulating its activity in a GTP-dependent manner.14,15 Furthermore, Liu et al. have identified the increased extent of AGAP2 phosphorylation in glioma tissues. 16 On the basis of aforementioned evidence, we hypothesize that LINC00475 might be involved in the development of glioma via interaction with miR-449b-5p and AGAP2. In the current study, we aimed to investigate the possible function of LINC00475/miR-449b-5p/AGAP2 crosstalk in modulating glioma under hypoxic conditions.
Materials and methods
Ethics statement
The current study was approved by the Ethics Committee of Nanfang Hospital, Southern Medical University (NFEC-201312-K2). Signed informed consents were obtained from all participating patients or from the families of deceased individuals prior to tissue collection. The animal experimental processes were carried out under the approval of the Ethnic Committee of Nanfang Hospital, Southern Medical University and in strict accordance with the recommendations in the Guide for the Care and Use of Laboratory Animals in this study (2014-A07).
Gene expression analysis
The Gene Expression Profiling Interactive Analysis (GEPIA; http://gepia.cancer-pku.cn/index.html) database was employed in order to analyze the expression of LINC00475 in The Cancer Genome Atlas (TCGA) and the Genotype-Tissue Expression (GTEx) database, which contains gene expression data in normal samples of human tissues. GEPIA is known as a newly developed interactive web server to analyze the RNA sequencing expression data of 9736 tumor and 8587 normal samples from the TCGA and the GTEx projects, using a standard processing pipeline. In addition, GEPIA provides customizable functions, such as tumor/normal differential expression analysis, profiling according to cancer types or pathological stages, patient survival analysis, similar gene detection, correlation analysis, and dimensionality reduction analysis. This tool was developed by Zefang Tang, Chenwei Li, and Boxi Kang of Zhang Lab, Peking University 17 (access date: 2018-10-12; Version: 1.0). The lncLocator database 18 (http://www.csbio.sjtu.edu.cn/bioinf/lncLocator/; access date: 12 October 2018) was applied to predict the location of LINC00475. The downstream miRs of LINC00475 were forecasted using the RAID database 19 (http://www.rna-society.org/raid/search.html; access date: 12 October 2018; Version 2.0) and RNA22 database 20 (https://cm.jefferson.edu/rna22/; Version 2.0). Expression dataset of glioma was retrieved from the Gene Expression Omnibus (GEO; https://www.ncbi.nlm.nih.gov/geo/) database, and the “limma” package of the R Language Programming was employed for differential expression analysis. Subsequently, the target genes of miR-449b-5p were predicted using the mirDIP database21,22 (http://ophid.utoronto.ca/mirDIP/index.jsp#r; access date: 12 October 2018; Version 4.1) and TargetScan 22 (http://www.targetscan.org/vert_71/; access date: 12 October 2018; Version 7.1).
Sample collection and cell culture
A total of 62 cases of fresh frozen glioma tissue specimens were collected from patients who underwent operation from February 2014 to July 2017 at Nanfang Hospital, Southern Medical University, and 32 cases of normal brain tissue specimens by dead persons in traffic accidents and confirmed to have not received any pathological examination before. A total of five glioma cell lines, including SHG-44, KNS-42, U251, A172, and LN229 cells, and human normal glial cells HA cell line were obtained from the American Type Culture Collection (Manassas, VA, USA). All glioma cell lines were cultured with Dulbecco’s Modified Eagle Medium (DMEM)/F12 supplemented with 10% fetal bovine serum (FBS, Gibco, Carlsbad, CA, USA), while the HA cell line was incubated with astrocyte-conditioned medium (ACM). All cells were cultured in a 5% CO2 incubator with 95% saturation humidity at 37°C. Once cell confluence reached about 90%, cell passage was carried out. Reverse transcription quantitative polymerase chain reaction (RT-qPCR) was conducted to determine the expression of LINC00475 in glioma cell lines to select the cell line with the lowest LINC00475 expression for subsequent experimentation.
Hypoxic culture of cells was conducted in a modular incubator (Billups-Rothenberg Inc., Del Mar, CA, USA) containing 1% O2, 5% CO2, and 94% N2, while the control cells were cultured in a humidified air incubator with 20% O2 and 5% CO2. After a 48-h incubation, the cells were harvested for follow-up experiments.
Cell transfection
Cells were transfected with short hairpin-negative control (sh-NC), sh-LINC00475, over-expression (oe)-NC + sh-NC, oe-LINC00475 + sh-NC and oe-LINC00475 + sh-AGAP2. All target plasmids were purchased from the Dharmacon Company (Lafayette, CO, USA). According to the cell growth rate, cell density was adjusted and the cells were inoculated in a 6-well plate until cell confluence reached 80–90% on the following day. Transfection was performed with the lipofectamine 2000 kit (Invitrogen, Carlsbad, CA, USA), and the medium was replaced with fresh medium after an 8-h period of transfection, followed by a series of detection after 48 h.
RNA isolation and quantification
The RNeasy Mini Kit (Qiagen, Valencia, CA, USA) was employed to extract the total RNA content from the glioma tissues. The obtained RNA was then reverse transcribed into complementary DNA (cDNA) using a reverse transcription kit (RR047A, Takara Bio Inc., Otsu, Shiga, Japan) with a 20 µl reaction system. Reaction conditions were at 37°C for 15 min and at 85°C for 5 s. The cDNA samples were loaded using a SYBR Premix EX Taq Kit (RR420A, Takara Bio Inc., Otsu, Shiga, Japan), and RT-qPCR was performed using a real time fluorescence qPCR apparatus (ABI7500, ABI, Foster City, CA, USA) with the following reaction conditions: pre-denaturation at 95°C for 10 min, 40 cycles of denaturation at 95°C for 15 s, and annealing followed by extension at 60°C for 1 min. Each sample was set with three duplicate wells. The primer sequences (Table 1) were synthetized by the Shanghai Sangon Biotechnology Co., Ltd. (Shanghai, China). With glyceraldehyde-3-phosphate dehydrogenase (GAPDH) and U6 serving as the internal reference, fold changes were calculated by means of relative quantification (the 2–ΔΔCt method).
Primer sequences for reverse transcription quantitative polymerase chain reaction.

AGAP2, Arf GTPase-activating protein 2; GAPDH, glyceraldehyde-3-phosphate dehydrogenase; F, forward; miR-449b-5p, microRNA-449b-5p; R, reverse.
Fluorescence in situ hybridization
The subcellular localization of LINC00475 was identified using a fluorescence in situ hybridization (FISH) assay. According to the instructions of the RiboTM lncRNA FISH Probe Mix (Red) (C10920, RiboBio Co., Ltd., Guangzhou, China), the following steps were conducted: the cell slides were placed in a 24-well culture plate and the cells were inoculated with 6 × 10⁴ cells per well to ensure 60–70% cell confluence. Then, the cells were fixed with 1 ml of 4% polyformaldehyde for 10 min at room temperature and rinsed. Next, each well had 1 ml of pre-cooled permeable solution added [phosphate buffered saline (PBS) containing 0.5% Triton X-100] and was allowed to stand at 4°C for 5 min. Afterwards, each well had 200 μl of pre-hybridization solution added and was sealed at 37°C for 30 min. After the removal of the pre-hybridization solution, a probe hybridization solution containing the anti-LINC00475 nucleotide probe (Wuhan Genecreate Bioengineering Co., Ltd., Wuhan, Hubei, China) was added and left overnight at 37°C in dark conditions. The following steps were also carried out in the dark. The cells were successively cleaned with lotion I (4 × SSC, 0.1% Tween-20), lotion II (2 × SSC), lotion III (1 × SSC), and 1 × PBS three times for 5 min each time. The cells were stained with 4’,6-diamidino-2-phenylindole staining solution (dilution ratio of 1:800) for 10 min and sealed with nail polish. Finally, five different views were selected, observed, and photographed under a fluorescence microscope (Olympus Optical Co., Ltd., Tokyo, Japan).
RNA binding protein immunoprecipitation assay
The LN229 cells were rinsed twice with cold PBS, had 10 ml PBS added, and were collected into centrifuge tubes using a cell scrape. The cells were then centrifuged at 1500 rpm at 4°C for 5 min, with the supernatant discarded. Then, the cells were lysed with 100 ml of RNA binding protein immunoprecipitation (RIP) lysis buffer (N653, Shanghai Haoran Biological Technology Co., Ltd., Shanghai, China) on ice for 5 min to prepare cell lysate. Each tube had 50 μl of magnetic beads added and was inverted to completely mix the magnetic beads. Then, each tube had 0.5 ml of RIP Wash Buffer (EHJ-BVIS08102, Xiamen Hujia Biotechnology Co., Ltd., Xiamen, China) added, and then placed on a magnetic separator after a short vortex to wait for the accumulation of the magnetic beads. After that, the supernatant was removed, and magnetic beads were collected. The beads were washed, resuspended with 100 μl of RIP Wash Buffer, and incubated at room temperature with 5 μg of argonaute 2 (Ago2) antibodies (P10502500, Otwo Biotech Inc., Shenzhen, Guangdong, China) for 30 min, in which normal mice immunoglobulin G (IgG) served as the NC. After the supernatant was removed, the magnetic beads were washed twice with 0.5 ml of RIP washing buffer. Magnetic bead-antibody complex was added with 900 μl of RIP immunoprecipitation Buffer (P10403138, Otwo Biotech Inc., Shenzhen, Guangdong, China). After centrifugation at 14,000 rpm at 4°C for 10 min, the supernatant was obtained and transferred into a new centrifuge tube. Afterwards, magnetic bead-antibody complex was added with 100 μl of supernatant, with 1 ml as the final volume of the immunoprecipitation reaction. The magnetic bead-antibody complex was incubated at 4°C overnight, and the magnetic beads were washed six times with 0.5 ml RIP Wash Buffer and incubated with 150 μl of proteinase K buffer at 55°C for 30 min for RNA purification. Finally, the purified RNA was extracted from the magnetic beads using the Trizol method, followed by RT-qPCR.
Western blot analysis
With the use of a radio immunoprecipitation assay lysis buffer containing phenylmethylsulfonyl, total protein content was extracted from the cells or tissues, incubated on ice for 30 min, and then centrifuged at 8000g for 10 min at 4°C. After protein concentration was measured using a bicinchoninic acid kit, 50 μg of proteins were dissolved in 2× sodium dodecyl sulfate (SDS) loading buffer and boiled at 100°C for 5 min, followed by separation using SDS-polyacrylamide gel electrophoresis. Next, the proteins were transferred onto a polyvinylidene fluoride membrane with the wet-transfer method. The membrane was then blocked with 5% skimmed milk at room temperature for 1 h, and incubated at 4°C overnight with the following primary antibodies purchased from Abcam Inc. (Cambridge, MA, USA): rabbit anti-human epithelium cadherin (E-cadherin; ab15148, dilution ratio of 1:500), matrix metalloproteinase (MMP)-2 (ab37150, dilution ratio of 1:1000), focal adhesion kinase (FAK; ab40794, dilution ratio of 1:1000), p-FAK (ab81298, dilution ratio of 1:1000), hypoxia-inducible factor-1alpha (HIF-1α, ab51608, dilution ratio of 1:1000), and GAPDH (internal reference; ab9485, dilution ratio of 1:2500). After three Tris-buffered saline Tween-20 rinses (10 min each time), the membrane was incubated with the secondary antibody, horseradish peroxidase (HRP)-conjugated goat anti-rabbit IgG (ab97051, dilution ratio of 1:2000, Abcam Inc., Cambridge, MA, USA) for 1 h. The immunocomplexes on the membrane were visualized using an enhanced chemiluminescence reagent (BB-3501, Amersham, UK) and band intensities were quantified using the Bio-Rad image analysis system (Bio-Rad Inc., Hercules, CA, USA) and Quantity One v4.6.2 software. The ratio of the gray value of the target band to GAPDH was representative of the relative protein expression.
Dual-luciferase reporter gene assay
The wild-type (wt) and mutant (mut) reporter plasmids of LINC00475 and AGAP2 were designed and provided by the GenePharma Co., Ltd. (Shanghai, China), namely, wt-LINC00475, mut-LINC00475, wt-AGAP2, and mut-AGAP2. The NC mimic and miR-449b-5p mimic were respectively co-transfected with wt-LINC00475, mut-LINC00475, wt-AGAP2, and mut-AGAP2 into LN229 cells for 48-h incubation. The luciferase activity in the cells was measured using a Glomax20/20 luminometer (GeneCopoeia, Rockville, MD, USA) based on the instructions of the luciferase detection kit (RG005, Promega Corp., Madison, Wisconsin, USA).
Cell counting kit-8 assay
Cells at the logarithmic phase of growth were transfected and were collected 48 h later. Then the cells were inoculated in a 96-well plate at a density of 1 × 10⁴ cells/well. After 48 h, 10% cell counting kit-8 (CCK-8) solution was added to the plate and incubated for 2 h avoiding exposure to light. The absorbance at 450 nm was measured using a microplate reader, and 50% inhibitory concentration (IC50) of each group was calculated. All investigations involved 5 wells and control wells without medium, each repeated in triplicate. IC50 represents the measured half-inhibitory concentration of antagonists, which in turn can indicate the tolerance of certain cells to drugs.
Flow cytometry
An Annexin V-fluorescein isothiocyanate (FITC)/propidium iodide (PI) double-staining kit (556547, Shanghai Shuojia Biotechnology Co., Ltd., Shanghai, China) was employed to detect the apoptosis of HepG-2 cells after a 48-hour period of transfection. Briefly, deionized water 10× binding buffer was diluted to 1× binding buffer, and HepG-2 cells were centrifuged at room temperature at 2000 rpm for 5 min, after which the cells were collected. Subsequently, the cells were re-suspended using pre-cooled 1× PBS and centrifuged at 200 rpm for 5–10 min. After that, the cells were suspended with 300 µl of binding buffer. Next, 5 µl of Annexin V-FITC was added and uniformly mixed, followed by 15 min of incubation at room temperature avoiding exposure to light. Next, 5 µl of PI was added 5 min prior to performing flow cytometry (Cube 6, Partec, Germany), and incubated in an ice bath for 5 min without light exposure. FITC was detected at an excitation wavelength of 480 nm and 530 nm, and PI was detected at more than 575 nm.
Transwell assay for migration and invasion
The pre-cooled Matrigel (40111ES08, Shanghai Yeasen Biotechnology Co., Ltd., Shanghai, China) diluted with serum-free DMEM (Matrigel:DMEM = 1:8) was used to coat the Transwell apical chamber (3413, Beijing Unique Biotech Co., Ltd., Beijing, China) (this step was skipped in migration experiments), and was incubated in a 37°C incubator for 4–5 h. The transfected cells were diluted with 100 μl of serum-free medium to prepare a cell suspension, and the concentration was approximately 1 × 10⁶ cells/ml. Next, 500 μl of DMEM containing 20% FBS was added to the basolateral chamber, followed by a 24-h period of incubation at 37°C with 5% CO2. Three duplicate wells were set for each group. The Transwell chamber was then fixed with 5% glutaraldehyde at 4°C and stained with 0.1% crystal violet for 5 min. Then, the surface cells were wiped off using cotton balls. After that, the cells were observed under an inverted fluorescence microscope (TE2000, Nikon Imaging Sales Co., Ltd, Shanghai, China). Five fields (200×) were randomly selected for photographing, and the mean value was taken as the number of cells passing through the chamber in each group.
Tumor xenograft in nude mice
A total of 30 BALA/C nude mice (without sex limitation, aged 4 weeks, weighing 18–25 g) were obtained from the Guangdong Medical Laboratory Animal Center (Guangdong, China) (http://www.gdmlac.com.cn/). The mice were raised in a specific pathogen-free environment and subcutaneously injected with LN229 cells at a concentration of 1 × 10⁶ cells/mouse. When the tumor size reached about 200–300 mm3, the mice were randomly assigned into two groups. Then, the mice in one group were injected with lentiviral vector (LV)-sh-NC, and mice in the other group were injected with LV-sh-LINC00475. All aforementioned lentiviral vectors were purchased from the Dharmacon Company (Lafayette, CO, USA). After 5 days, the mice were injected intraperitoneally with piperidazole at a dosage of 60 mg/kg. After 30 min, carbon dioxide suffocation was applied to euthanize the nude mice. Then, the transplanted tumor was collected, photographed, and frozen immediately.
Immunofluorescence staining
The frozen sections (5 μm) of transplanted tumor were settled in polylysine-coated slides, fixed with 4% paraformaldehyde for 1 h, and rinsed. The sections were penetrated with 0.3% TritonX-100 for 20 min and blocked with 10% goat serum for 1 h. After the surrounding liquid was wiped off, the hypoxic zone of the transplanted tumor was detected using a Hypoxyprobe-1 TM Kit (HPI, Burlington, MA, USA). Cells in the hypoxic region were labeled with a hypoxic probe (FITC-conjugated anti-piperonidazole mouse monoclonal antibody) and the sections were mounted using anti-fluorescence quenching agent Vectashield (Vector Laboratories Inc., Burlingame, CA, USA). A laser scanning confocal microscope (Olympus Optical Co., Ltd, Tokyo, Japan) was used for observation and photography.
Immunohistochemistry
Tissue sections were baked in a 60°C incubator for 1 h, conventionally dewaxed with xylene, hydrated with gradient ethanol, and incubated for 20 min with PBS containing 0.5% Triton at room temperature. Next, antigen retrieval was carried out under high-pressure for 2 min. The sections were boiled in 0.01 M citric acid buffer (pH = 6.0) at 95°C for 20 min, and immersed in 3% H2O2 for 15 min to block exogenous peroxidase activity. The sections were then blocked with 3% bovine serum albumin and incubated with the primary antibody, rabbit anti-human HIF-1α (ab51608, dilution ratio of 1:100), at 37°C for 2 h. The PBS was aspirated and the sections were incubated with the secondary antibody, HRP-labeled goat anti-rabbit IgG (ab6721, dilution ratio of 1:1000), at 37°C for 30 min in a wet box. All aforementioned antibodies were purchased from Abcam Inc. (Cambridge, MA, USA). Then, the sections were counterstained with hematoxylin (Shanghai Fusheng Industrial Co., Ltd., Shanghai, China) at room temperature for 4 min. Afterwards, the sections were mounted with 10% glycerol/PBS and observed under a microscope. The results of immunohistochemistry were scored independently by two individuals using the double-blinded method. The experiment was repeated three times to obtain the mean value.
Statistical analysis
Statistical analyses were performed using the SPSS 21.0 software (IBM Corp. Armonk, NY, USA). Measurement data were expressed as mean ± standard deviation. Data with normal distribution between two groups were compared using Student’s t-test. If data exhibited skewed distribution, comparisons between two groups were analyzed by the Mann–Whitney U test (expressed as quartile range), multi-group comparisons were carried out by one-way analysis of variance (ANOVA), followed by the Tukey’s post-hoc test. Pearson’s correlation coefficient was used for correlation analysis. A value of p < 0.05 indicated statistical significance.
Results
LINC00475 is over-expressed in glioma under hypoxic condition
First, the expression of lncRNA related to glioma was analyzed using the TCGA database. The results revealed that LINC00475 was significantly enriched in gliomas. Furthermore, the LINC00475 expression in glioma and normal samples of TCGA and GTEx databases was analyzed, the results of which demonstrated that the expression of LINC00475 was much higher in glioma samples relative to that in normal samples (Figure 1A). In order to confirm the results of gene expression analysis, RT-qPCR was adopted to measure the LINC00475 expression in glioma tissues, cell lines and 62 patients with glioma, including 27 patients at grade II, 21 patients at grade III, and 14 patients at grade IV. The expression of LINC00475 of samples at grade IV was found to be higher relative to that of samples at grade II and grade III (one-way ANOVA; p < 0.05; Figure 1B).

LINC00475 is observed to be up-regulated in glioma under hypoxic condition.
Moreover, glioma cells, U251, A172, and LN229 cells presented with higher LINC00475 expression versus the normal glial HA cells (one-way ANOVA; p < 0.05; Figure 1C), with LN229 cells exhibiting the highest LINC00475 expression. Hence, the LN229 cells were selected for further experiments. Intratumoral hypoxia is well-documented to be an important contributor of tumor metastasis. 23 Therefore, we explored the expression of LINC00475, a lncRNA with abnormally high expression in glioma under hypoxic condition. The results of RT-qPCR showed that the expression of LINC00475 was up-regulated in LN229 cells under hypoxic condition as compared with the LN229 cells under normoxic condition (t-test; p < 0.05; Figure 1D). The previously mentioned results revealed that the expression of LINC00475 was increased in glioma under hypoxic condition.
LINC00475 silencing induces inhibition of hypoxic glioma cell proliferation, migration and invasion and promotion of cell apoptosis
Following the results revealing the high expression of LINC00475 in hypoxic glioma cells, we silenced LINC00475 in hypoxic LN229 cells to explore the effect of LINC00475 on glioma cell migration and invasion. RT-qPCR was carried out to detect plasmid transfection efficiency in LN229 cells with sh-LINC00475. The results showed that LINC00475 expression was decreased after the treatment of sh-LINC00475 compared with sh-NC treatment (t-test; p < 0.05; Figure 2A). This finding confirmed that sufficient transfection efficiency was achieved for further experimentation. Next, Transwell assay was applied to determine migration and invasion after silencing LINC00475, which demonstrated that after treatment of sh-LINC00475, cell migration and invasion were repressed in hypoxic glioma cells (t-test; Figure 2B, C). Western blot analysis results showed that LN229 cells treated with sh-LINC00475 presented with decreased expression of matrix MMP-2, yet increased E-cadherin expression compared with those treated with sh-NC (t-test; p < 0.05; Figure 2D). Subsequent results obtained from CCK-8 assay (Figure 2E) showed that the proliferation ability of sh-LINC00475-treated cells was much lower relative to that in sh-NC-treated cells (t-test; all p < 0.05). Flow cytometry data revealed that the apoptotic rate of cell upon treatment of sh-LINC00475 was increased when compared with sh-NC treatment (t-test; all p < 0.05; Figure 2F).

LINC00475 silencing suppresses glioma cell proliferation, migration and invasion while promotes cell apoptosis under hypoxic conditions.
In conclusion, silencing of LINC00475 inhibited glioma cell proliferation, migration and invasion while accelerated cell apoptosis under hypoxic condition.
LINC00475 up-regulates AGAP2 expression by competitively binding to miR-449b-5p
After uncovering that LINC00475 silencing inhibited glioma cell migration and invasion under hypoxic conditions, the focus of the experiment shifted to explore the effect of LINC00475 on AGAP2 and miR-449b-5p. First, the subcellular localization of LINC00475 in LN229 cells was detected using FISH assay. As shown in Figure 3A, LINC00475 was found to be primarily distributed in the cytoplasm and nucleus in LN229 cells, suggesting a potential regulatory function of LINC00475 in glioma cells. Subsequently, RAID and RNA22 databases were utilized to predict the downstream regulatory miRNAs of LINC00475. The RAID database predicated the presence of 26 potential regulatory miRNAs, while more miRNAs were predicted in the RNA22 database. In order to improve upon the accuracy of the prediction results, we obtained the intersections of the predicted miRNAs from the RAID database and the first 350 miRNAs from the RNA22 database (Figure 3B), which revealed the existence of nine miRNAs. To screen out the downstream miRNAs which were most likely implicated in the progression of glioma, we overexpressed LINC00475 in LN229 cells and determined the expression of these nine miRNAs using RT-qPCR. As illustrated in Figure 3C, when LN229 cells were transfected with oe-LINC00475, miR-449b-5p expression was found to be decreased in glioma cells (t-test; p < 0.05), with the expression of miR-449b-5p exhibiting the biggest changes in glioma cells among the nine miRNAs. Therefore, it was hypothesized that LINC00475 might play a regulatory role in glioma via miR-449b-5p. Next, we analyzed the correlation between LINC00475 and miR-449b-5p expression in tissue specimens. The results showed that there was a negative correlation between the expression of LINC00475 and miR-449b-5p (Figure 3D). In order to further elucidate their downstream mechanisms, we predicted the downstream target genes of miR-449b-5p. Thousands of potential target genes of miR-449b-5p were predicted in both mirDIP and TargetScan databases. In addition, we retrieved and obtained a glioma-related gene expression dataset GSE79097 using the GEO database. A differential analysis was performed in the dataset, and 500 up-regulated genes in glioma were selected to intersect the predicted results (Figure 3E). It was revealed that there were 29 differentially expressed genes in the intersection of mirDIP, TargetScan prediction results. and GSE79097 dataset analysis results. These genes were not only highly expressed in glioma, but also might be downstream target genes of miR-449b-5p. Among these genes, AGAP2 was observed to be highly expressed in glioma when compared with the normal samples (Figure 3F). There were few studies on the function of AGAP2 gene in tumors, so AGAP2 gene was selected for the follow-up experiments. Subsequently, the expression of miR-449b-5p and AGAP2 was assessed in glioma tissues and cells using RT-qPCR, which displayed that miR-449b-5p expression was diminished in both glioma cells and tissues (t-test; p < 0.05), which was negatively associated with AGAP2 expression (Figure 3G). There was a negative correlation between miR-449b-5p and LINC00475, and between miR-449b-5p and AGAP2 (Figure 3H). Then the correlation analysis of LINC00475 and AGAP2 expression in glioma tissues showed that there was positive correlation between them (Figure 3I). The binding sites between LINC00475 and miR-449b-5p were predicted using a biological prediction website (https://cm.jefferson.edu/rna22/Interactive/). In addition, the miRbase website (http://www.mirbase.org/) was employed to obtain the possible binding sites between miR-449b-5p and AGAP2 (Figure 3J). Dual-luciferase reporter gene assay results depicted that the luciferase activities of wt-LINC00475 or wt-AGAP2 were decreased after treatment with miR-449b-5p mimic (t-test; p < 0.05), while the luciferase activities of mut-LINC00475 or mut-AGAP2 remained unaffected (t-test; p > 0.05;) after treatment of miR-449b-5p mimic (Figure 3K). Next, a RIP assay was employed to detect the possible binding of miR-449b-5p to LINC00475 or AGAP2. As illustrated in Figure 3L, the binding of miR-449b-5p to LINC00475 or AGAP2 in the anti-Ago2 group was higher than that in the anti-IgG group (t-test; p < 0.05).

LINC00475 inhibits miR-449b-5p to increase AGAP2 expression.
The previously mentioned results provided evidence suggesting that LINC00475 increased AGAP2 expression by down-regulating miR-449b-5p.
LINC00475 activates FAK to increase HIF-1α expression by up-regulating AGAP2 in glioma cells under hypoxic condition
After establishing that LINC00475 up-regulated AGAP2 expression by inhibiting miR-449b-5p, the focus of the experiment was then shifted to uncover how LINC00475 affects FAK and HIF-1α expression in glioma cells. It has been reported that AGAP2 increases the activity of FAK, 24 and FAK can regulate the expression of HIF-1A. 25 In order to investigate the regulatory mechanism of LINC00475 in glioma cells under hypoxic condition, LN229 cells were introduced with oe-NC + sh-NC, oe-LINC00475 + sh-NC and oe-LINC00475 + sh-AGAP2, and then treated with hypoxia treatment. Initially, evaluation of the transfection efficiency in LN229 cells was conducted using RT-qPCR. The results showed that the transfection efficiency met the requirements for further experimentation (Figure 4A). The contents of FAK phosphorylation and HIF-1α expression in hypoxic cells transfected with oe-LINC00475, sh-AGAP2 or both were detected by means of Western blot analysis. As showed in Figure 4B, when compared with the treatment of oe-NC + sh-NC, oe-LINC00475 + sh-NC treatment increased the content of FAK phosphorylation and HIF-1α expression, while the treatment of oe-NC + sh-AGAP2 and oe-LINC00475 + sh-AGAP2 decreased the content of FAK phosphorylation and HIF-1α expression (one-way ANOVA; all p < 0.05).
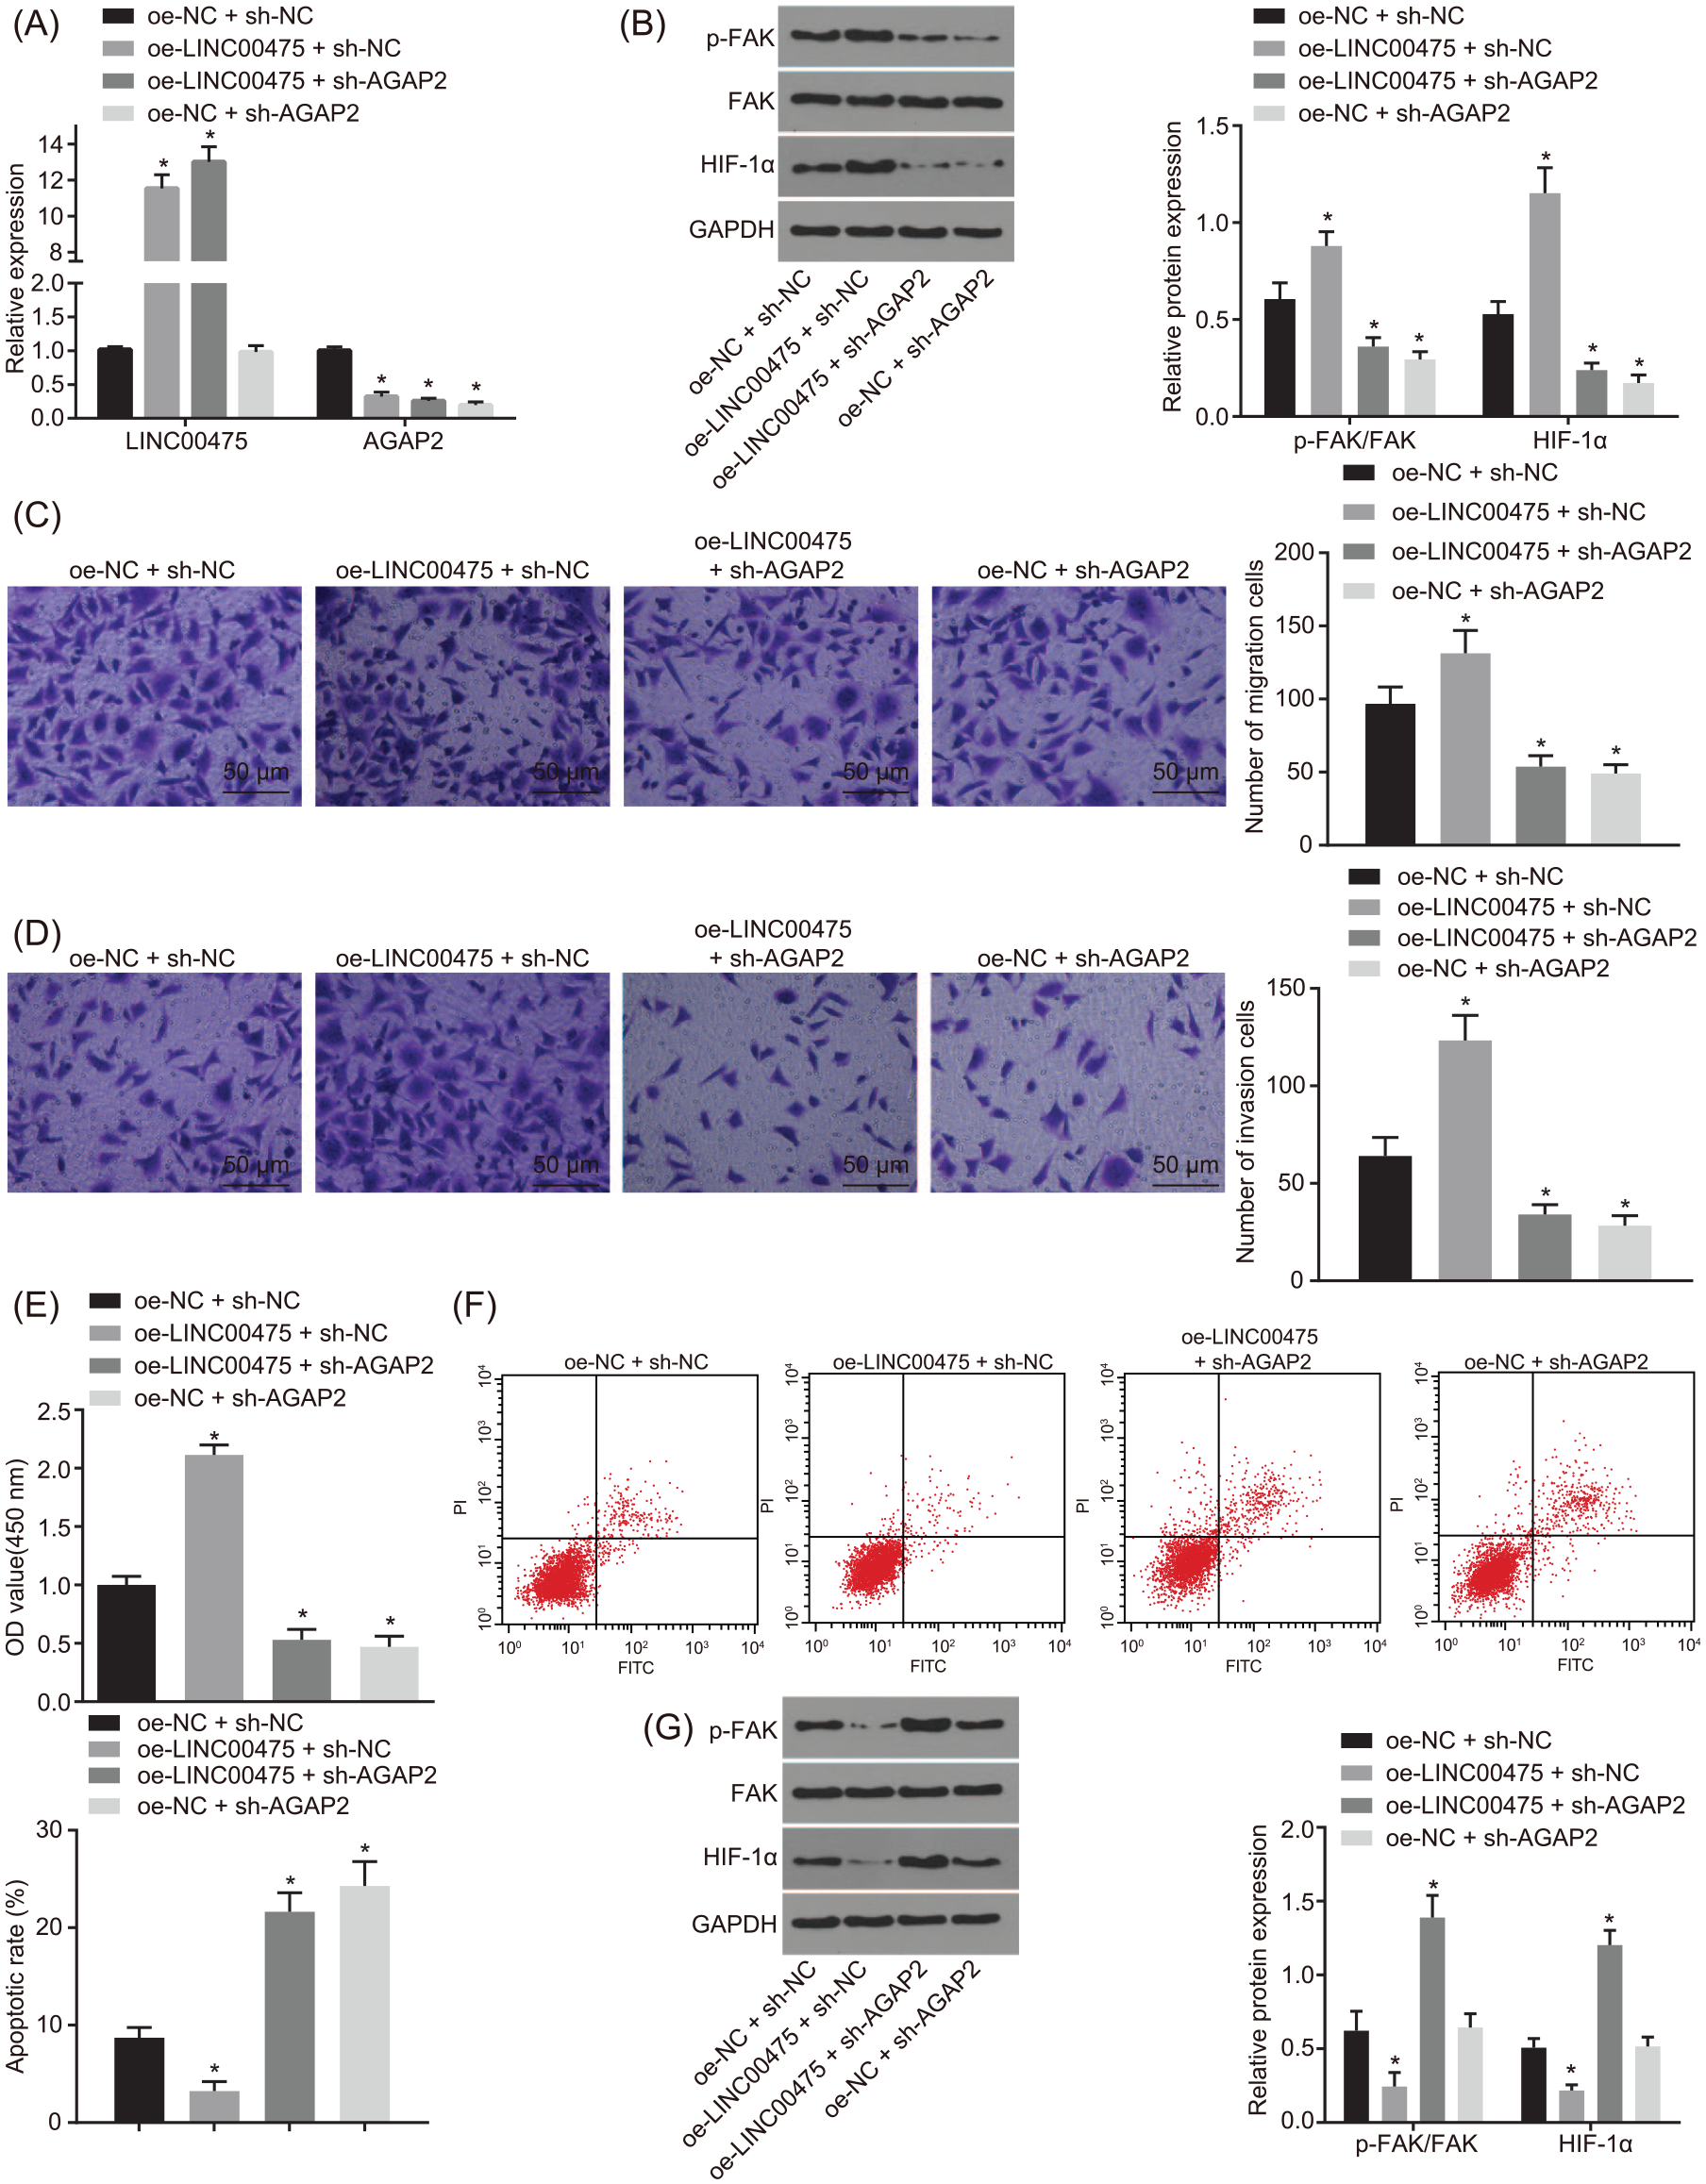
LINC00475 promotes malignant phenotype of glioma by activating FAK-regulated HIF-1α via an increase of AGAP2.
Hypoxia-inducible factor HIF-1α was demonstrated to be involved in tumor migration and invasion, 26 so we detected the migration and invasion of LN229 cells transfected with oe-LINC00475, sh-AGAP2, or both under hypoxic conditions using the Transwell assay. As depicted in Figure 4C and D, compared with the treatment of oe-NC + sh-NC, migration and invasion of hypoxic LN229 cells were increased after the treatment of oe-LINC00475 + sh-NC but were decreased after treatment of oe-NC + sh-AGAP2 and oe-LINC00475 + sh-AGAP2 (one-way ANOVA; all p < 0.05).
In addition, CCK-8 assay was performed in order to measure hypoxic LN229 cell proliferation in response to transfection with oe-LINC00475, sh-AGAP2 or both. The results in Figure 4E showed that cell proliferation was accelerated in the presence of oe-LINC00475 (one-way ANOVA; all p < 0.05). Cell proliferation was found to be reduced upon oe-NC + sh-AGAP2 and oe-LINC00475 + sh-AGAP2 transfection (all p < 0.05). Subsequent results obtained from flow cytometry showed that cell apoptosis was decreased in response to oe-LINC00475 transfection (all p < 0.05), while that was increased upon transfection with oe-NC + sh-AGAP2 and oe-LINC00475 + sh-AGAP2 (one-way ANOVA; all p < 0.05; Figure 4F).
Moreover, Western blot analysis was applied to determine the content of FAK phosphorylation and HIF-1α expression in hypoxic cells, which revealed oe-FAK transfection increased FAK phosphorylation and HIF-1α expression (p < 0.05), while those after oe-NC + sh-AGAP2 and sh-AGAP2 + oe-FAK transfection were decreased (one-way ANOVA; all p < 0.05; Figure 4G).
Taken together, LINC00475 exerted a promoting role in FAK activation by up-regulating AGAP2 under hypoxic conditions, thereby elevating the expression of HIF-1α, which accelerated the proliferation, migration and invasion of glioma cells.
LINC00475 silencing promotes oxidation and inhibits the growth of transplanted tumors in nude mice
After discovering that LINC00475 silencing could activate FAK to increase the HIF-1α expression by up-regulating AGAP2 in hypoxic glioma cells, we aimed to study the role of LINC00475 in the occurrence and progression of glioma in vivo upon sh-LINC00475 treatment in mice. First, we compared the size of subcutaneous tumors in mice treated with sh-LINC00475 and sh-NC and found that the tumor size in sh-LINC00475-treated mice was much lower than that in sh-NC-treated mice (Figure 5A, B). Next, RT-qPCR was performed to detect the interference efficiency of LINC00475 in transplanted tumors. As displayed in Figure 5C, the interference efficiency met the requirements for further experimentation (t-test; p < 0.05). Immunofluorescence staining analysis showed that the number of hypoxic cells stained with tumor hypoxia marker EF5 was decreased when LINC00475 was interfered (t-test; p < 0.05; Figure 5D). Then, immunohistochemistry was adopted to the determine the positive expression of HIF-1α. The results revealed that sh-LINC00475 treatment reduced the positive expression rate of the HIF-1α protein (t-test; p < 0.05; Figure 5E). The content of FAK phosphorylation and expression of HIF-1α, MMP-2, and E-cadherin proteins in transplanted tumors were subsequently measured by means of Western blot analysis. The content of FAK phosphorylation and protein expression of HIF-1α and MMP-2 were found to be decreased, while E-cadherin protein expression was increased in transplanted tumors in mice treated with sh-LINC00475 (Figure 5F).

Silencing of LINC00475 induces oxidation and represses the growth of transplanted tumors in nude mice.
Taken together, we reached a conclusion that silencing of LINC00475 induced oxidation and prevented the growth of transplanted tumors in nude mice.
Discussion
Despite great advancements in the field of cancer treatment in recent years, the survival rate of patients suffering from glioma still remains unfavorable with an average survival of only 16 months. 4 Growing evidence has implicated the aberrant expression of lncRNAs in the progression of glioma. 5 Herein, via means of the current study, we aimed to elucidate the possible roles of LINC00475 in glioma via interaction with miR-449b-5p and AGAP2. Ultimately, our findings provided evidence that LINC00475 down-regulated miR-449b-5p to elevate the expression of AGAP2, consequently resulting in promoted hypoxic glioma cell proliferation, migration, and invasion, as well as inhibited cell apoptosis.
First, we discovered that LINC00475 was expressed at higher level in glioma tissues and cells under hypoxic conditions. It has been highlighted that LINC00475 is activated by p53, and silencing of LINC00475 can inhibit the p53-regulated cell cycle arrest by inactivating the cell cycle inhibitor p21. 10 In addition, the expression of p53 was higher in glioma tissues than that in normal brain and gliosis. 9 Furthermore, a recent study reported that lncRNA H19 is overexpressed in glioma tissues and cells. 27 Interestingly, hypoxia is well-known to serve as a promoter of migration potential in brain glioma stem cells. 28 Similarly, recent research has suggested that the transcript levels of lncRNA neighbor of BRCA1 gene 2 are increased under hypoxic conditions. 29 The aforementioned evidence and findings confirm that LINC00475 was up-regulated in hypoxic glioma cells.
Our results further identified that LINC00475 can competitively bind to miR-449b-5p to elevate the expression of AGAP2. In addition, Li Zhen et al. proved that lncRNA nuclear enriched abundant transcript 1 regulates miR-449b-5p to stimulate cell invasion and migration in glioma, which was in line with our findings. 13 Moreover, dual-luciferase reporter gene assay confirmed AGAP2 to be a putative target gene of miR-449b-5p. Recently, research discovered that miR-449b can possibly bind to and negatively regulate the leucine rich repeat containing G protein-coupled receptor 4 in non-small-cell lung carcinoma cells. 12 Similarly, LINC00319 is capable of binding to miR-450b-5p and reducing its expression, subsequently elevating the expression of EZH2, a target of miR-450b-5p in lung adenocarcinoma. 30 Therefore, we can conclude that LINC00475 overexpression can suppress miR-449b-5p expression to increase the expression of AGAP2 in hypoxic glioma cells.
Another significant finding of our study was that LINC00475 silencing inactivated FAK to decrease HIF-1α expression by inhibiting AGAP2, thereby suppressing hypoxic glioma cell proliferation, invasion, and migration while promoting apoptosis, which was also evidenced by down-regulated MMP-2 and increased E-cadherin levels after sh-LINC00475 treatment. In addition, we also observed that silencing of LINC00475 induced oxidation and inhibited the growth of transplanted tumors in nude mice. Furthermore, Delong et al. confirmed that knockdown of LINC00475 impedes cell proliferation, invasion, and migration, as well as accelerating cell apoptosis in glioma. 31 FAK overexpression has been documented in several human cancers, and can induce tumor progression and metastasis. 32 In addition, HIF-1α was previously demonstrated to be implicated in the process of in-tumor migration and invasion. 26 The FAK protein can mediate the expression of HIF-1α, 25 while FAK activity can be increased by AGAP2 modulation. 24 In addition, MMPs function as promoters for cancer cell invasion, and their overexpression is correlated with aggressive glioma behavior. 33 Likewise, MMP-2 and E-cadherin also serve as invasion-related genes. 34 More importantly, a previous study indicated that proliferation, invasion, and migration of glioma cells can be inhibited as a result of miR-449b-5p over-expression. 13 AGAP2 has been proven to accelerate cancer cell invasion via increasing Akt activity. 14 In addition, Liu et al. discovered that AGAP2 acts as an oncogene and promotes the migration and invasion of glioblastoma cells. 35 Interestingly, another study also found that cancer cell apoptosis was promoted while cell proliferation, migration, and invasion were blocked when AGAP2 was inhibited. 36 Also, when AGAP2 was depleted, the inhibitory effect of TNF-α on lipid oxidation was reversed. 37
Taken together, the current study indicated that LINC00475 was activated in hypoxic glioma tissues and cells, and LINC00475 up-regulated AGAP2 by interacting with miR-449b-5p in glioma cells. In addition, our findings demonstrated that LINC00475 silencing decreased the expression of FAK-regulated HIF-1α by inhibiting AGAP2, thereby suppressing invasion and migration in hypoxic glioma cells (Figure 6). These results highlight LINC00475 as a new promising therapeutic strategy for glioma treatment. However, the limitations of this study should not be overlooked. To begin with, the study population was not big enough for further validation of the great significance of the LINC00475/miR-449b-5p/AGAP2 axis in the progression of glioma. Besides, AGAP2 may be downstream of other miRNAs apart from miR-449b-5p in glioma. Similarly, miR-449b-5p might target other genes besides AGAP2 in glioma. Furthermore, there are also other possible lncRNAs linked to miR-449b-5p and AGAP2. Therefore, more details should be further studied to explain the specific underlying mechanism by which the LINC00475/miR-449b-5p/AGAP2 network influences glioma. Moreover, LN229 is a glioblastoma cell line that is used for all cell work, and thus further studies may be needed to confirm results in other glioma subtypes. Isocitrate dehydrogenase (IDH)-mut and IDH-mut with 1p19q codeletion are molecularly different subtypes and may not have the same behavior as an IDH-wt glioblastoma.
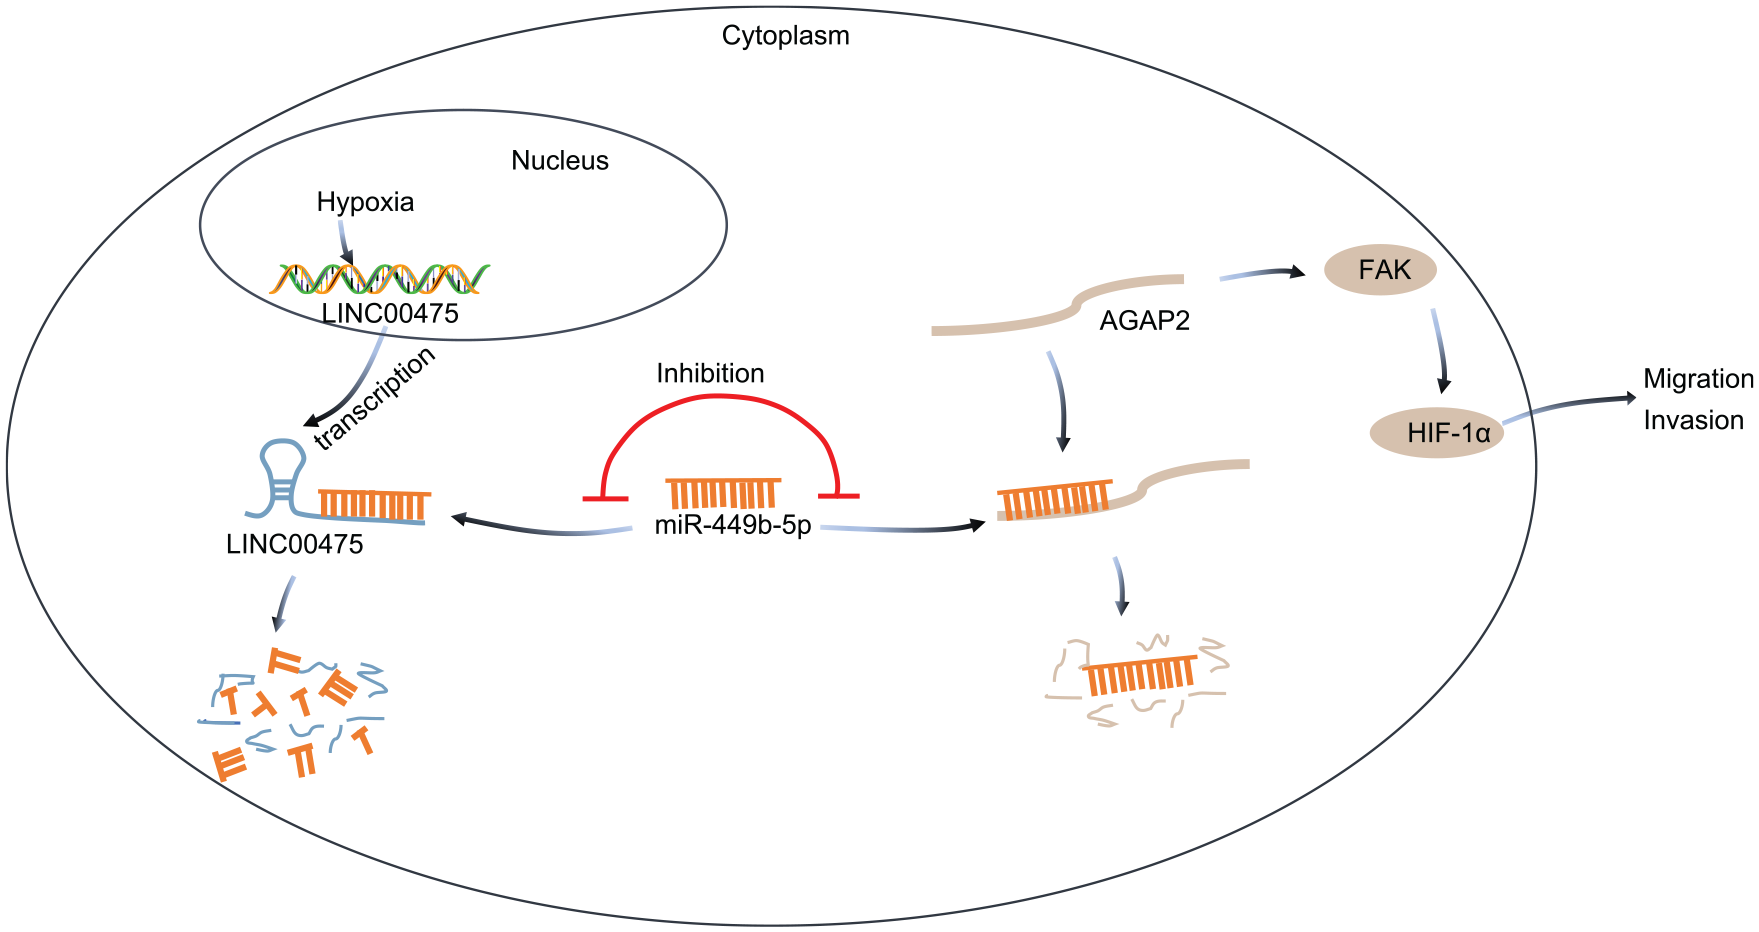
The molecular mechanism involving LINC00475 in regulating the progression of glioma under hypoxic condition. LINC00475 increases the AGAP2 expression by sponging miR-449b-5p to activate FAK expression, which increases HIF-1α expression and promotes the progression of glioma under hypoxic condition.
Footnotes
Acknowledgements
We acknowledge and appreciate our colleagues for their valuable efforts and comments on this paper.
Author contributions
Conception and design: Lei Yu, Yawei Liu, and Jun Fan.
Analysis and interpretation: Si Gui, Jun Pan, and Guozhong Zhang.
Data collection: Xiaoyu Qiu, Xi’an Zhang, and Jun Fan.
Writing the article: Binghui Qiu and Songtao Qi.
Critical revision of the article: Lei Yu, Si Gui, Xi’an Zhang, and Jun Pan.
Statistical analysis: Si Gui, Xiaoyu Qiu, Songtao Qi, and Guozhong Zhang.
Final approval of the article: Lei Yu, Si Gui, Yawei Liu, Xiaoyu Qiu, Binghui Qiu, Xi’an Zhang, Jun Pan, Jun Fan, Songtao Qi, and Guozhong Zhang.
Conflict of interest statement
The authors declare that there is no conflict of interest.
Ethics statement
The current study was approved by the Ethics Committee of Nanfang Hospital, Southern Medical University (NFEC-201312-K2). Signed informed consents were obtained from all participating patients or from the families of deceased individuals prior to tissue collection. The animal experimental processes were carried out under the approval of the Ethnic Committee of Nanfang Hospital, Southern Medical University and in strict accordance with the recommendations in the Guide for the Care and Use of Laboratory Animals in this study (2014-A07).
Funding
The author(s) disclosed receipt of the following financial support for the research, authorship and/or publication of this article: This work was supported by Southern Hospital President Fund (No. 2019Z206).