
Abstract
Background:
It remains unknown which is the most effective regimen among the available therapies for advanced well-differentiated neuroendocrine tumors (NETs). We performed a network meta-analysis to address this important issue.
Methods:
PubMed, Embase, Web of Science, Cochrane Library, and major international scientific meetings were searched for relevant randomized controlled trials (RCTs). Progression-free survival (PFS) data was the primary outcome of interest, and overall survival (OS) and serious adverse events (SAEs) were the secondary outcomes of interests, reported as hazard ratio (HR), or odds ratio (OR) and 95% confidence intervals (CIs).
Results:
Included in the meta-analysis were 21 eligible articles reporting 15 RCTs with a total of 2922 patients randomized to receive 11 treatments. Peptide receptor radionuclide therapy (PRRT) showed significant PFS advantage over somatostatin analogs (SSA) (HR = 0.21, 95% CI: 0.11–0.41), everolimus (HR = 0.25, 95% CI: 0.11–0.53), sunitinib (HR = 0.29, 95% CI: 0.10–0.82), everolimus+SSA (HR = 0.26, 95% CI: 0.12–0.54), and everolimus+bevacizumab (HR = 0.31, 95% CI: 0.11–0.82). OS findings were not significantly different between treatments. In terms of treatment rankings of PFS, PRRT had the highest probability (96%) of being the most effective treatment, followed by SSA+bevacizumab (86%) and SSA+interferon-α (IFN-α) (78%). As for toxicity, risk of SAEs was similar between the three treatments. Based on the benefit–risk ratio, PRRT, SSA+bevacizumab, and SSA+IFN-α seemed to be the best, second-, and third-best treatment, respectively.
Conclusions:
PRRT is likely to be the most preferable treatment for patients with advanced well-differentiated NETs. SSA+bevacizumab and SSA+IFN-α also seem to be more effective regimens with limited risk of SAEs.
Keywords
Introduction
Neuroendocrine tumors (NETs) are a heterogeneous class of neoplasms arising from neuroendocrine cells that are scattered throughout the body. 1 Data from population-based registries indicate that the majority of NETs arise from the gastrointestinal tract, followed by lung and pancreas. 1 Although the incidence of these tumors is increasing, NETs have usually been considered a rare entity. The World Health Organization (WHO) 2010 classification systems for the gastroenteropancreatic NETs categorize tumors as well-differentiated NETs that can be divided into grade 1 (Ki67 < 3%) and grade 2 (Ki67 3–20%), and poorly differentiated neuroendocrine carcinomas (Ki-67 > 20%). 2 Radical surgery is the only curative treatment for NETs; however, only a low percentage of patients are suitable for surgery as more than 50% of patients have advanced disease at diagnosis. 3
In advanced well-differentiated NETs, traditional therapeutic options may include: systemic treatment with cytotoxic chemotherapy, 4 somatostatin analogs (SSA),5,6 and interferon-α (IFN-α). 7 In recent years, several novel approaches have been investigated in advanced NETs. Peptide receptor radionuclide therapy (PRRT) holds further promise as an effective treatment modality. 8 Preliminary results from clinical trials of VEGF pathway inhibitors 9 and inhibitors of mTOR10–12 have suggested that these agents have the potential to inhibit tumor growth. Nevertheless, treatment of advanced well-differentiated NETs remains controversial and a shared therapeutic sequence does not exist.
Network meta-analysis (NMA) is a technique for comparing multiple treatments simultaneously in a single analysis by combining direct and indirect evidence within a network of randomized controlled trials (RCTs). 13 When no head-to-head trial exists, NMA can be used to estimate the effect. 13 To date, direct comparison trials between treatments of advanced well-differentiated NETs are still lacking. Thus, we performed a NMA to evaluate the relative efficacy and tolerability of different treatments, attempting to identify the most effective treatment for this population.
Materials and methods
Literature search strategy
This meta-analysis was conducted in accordance with the Preferred Reporting Items for Systematic Reviews and Meta-analysis (PRISMA) criteria. 14 PubMed, Embase, Web of Science, Cochrane Library, and major international scientific meetings (International Gynecologic Cancer Society, American Society of Clinical Oncology, American Society of Radiation Oncology) were searched for the available studies published before August 1, 2018, using the following strategy: ‘neuroendocrine tumor’ or ‘neuroendocrine neoplasm’ or ‘carcinoid tumor’ AND ‘target therapy ‘ or ‘everolimus’ or ‘somatostatin analog’ or ‘interferon-α’ or ‘bevacizumab’ or ‘sunitinib’ or ‘peptide receptor radionuclide therapy’ or ‘chemotherapy’. Further details of the search strategy are shown in Appendix 1. The reference lists of retrieved studies were manually scanned for relevant additional studies missed by the electronic search.
Inclusion and exclusion criteria
Studies were included if they met the following criteria:
(1) Types of studies: RCTs.
(2) Types of participants: participants with a histopathological diagnosis of advanced well-differentiated NETs.
(3) Types of interventions: one or more treatment options for experimental arm, and the presence of a control for comparison.
(4) Outcome: reported progression-free survival (PFS) and/or overall survival (OS) data.
If multiple articles covered the same study population, the study with the most recent and complete survival data was used. Studies were excluded if any of the following criteria were applied: letters, editorials, case reports, and reviews; survival data could not be extracted from the literature.
Data extraction
The data were extracted by two investigators independently. The following data were extracted from each study: first author, year(s) of publication, duration of the study, tumor location, numbers of patients (experimental arm/control arm), data of time-to-event (OS and PFS), and data of serious adverse events (SAEs). Data on the overall numbers of patients with SAEs were directly extracted if they were reported in the published article. If only the numbers of individual SAEs were reported separately in articles, we pooled all numbers to represent the overall number of SAEs.
Quality assessment
The methodological quality of RCTs was assessed by the Cochrane risk of bias tool, 15 which consists of the following five domains: sequence generation, allocation concealment, blinding, incomplete data, and selective reporting. A RCT was finally rated as ‘low risk of bias’ (all key domains indicated as low risk), ‘high risk of bias’ (one or more key domains indicated as high risk), and ‘unclear risk of bias’.
Statistical analysis
The primary outcome was PFS, and the secondary outcomes were OS and SAEs. Hazard ratios (HRs) and their 95% confidence intervals (CIs) were used as summary statistics for PFS or OS. Crude HRs with 95% CIs were either extracted directly from the original reports or calculated using the Kaplan-Meier curves based on the methods of Parmer et al. 16 and Tierney et al. 17 As for dichotomous outcome SAE, the odds ratios (ORs) and 95% CIs were utilized for pooled effects size. For direct comparisons, standard pairwise meta-analysis (PWMA) was performed. A statistical test for heterogeneity was performed using the chi-square (χ2) and I-square (I2) tests with the significance set at p < 0.10. If significant heterogeneity existed, a random-effects analysis model was used; otherwise, a fixed-effects model was used. PWMA was performed using the software Review Manager 5.3 (Cochrane Collaboration, Oxford, UK).
The Bayesian NMA was performed in a random-effect model using Markov chain Monte Carlo methods18,19 in JAGS and the GeMTC package in R (https://drugis.org/software/r-packages/gemtc). For each outcome measure, four independent Markov chains were simultaneously run for 20,000 burn-ins and 100,000 inference iterations per chain to obtain the posterior distribution. The traces plot and Brooks-Gelman-Rubin method were used to assess the convergence of model. 20 Treatment effects were estimated by HR/OR and corresponding 95% CI.
Network consistency was assessed with node-split models by statistically testing between direct and indirect estimates within treatment loop. 21 To rank probabilities of all available treatments, the surfaces under the cumulative ranking curve (SUCRAs) were calculated. 22 For PFS, SUCRA equals one if the treatment is certain to be the best and zero if it is certain to be the worst. 22 To jointly compare the efficacy and tolerability of each treatment and to assess their benefit-risk ratios, we ranked them based simultaneously on the SUCRA value of PFS and tolerability (1-SUCRASAEs) in the ranking plot. Lastly, comparison-adjusted funnel plot was used to detect the presence of small-study effects or publication bias. 23
Results
Literature search results and characteristics of included studies
The literature search results and study selection process are shown in Figure 1. The initial search retrieved 2978 studies. After removing the duplicates, 2426 citations were identified, and 2378 of them were excluded through an abstract review. The remaining 48 studies were screened through a full-text review for further eligibility. Finally, 21 eligible articles reporting 15 RCTs with 2922 patients randomized to receive 11 treatments were included in the meta-analysis. Among them, three articles26–28 were exploratory subanalysis for the RADIANT-2 trial 10 ; one article 29 was an exploratory subanalysis for RADIANT-3 trial 11 ; one article 30 was an exploratory subanalysis for PROMID trial 5 ; and one article 31 was an exploratory subanalysis for the trial of Raymond and colleagues. 32 Most RCTs (13/15) were two-arm studies, and the other two were three-arm studies.24,25 All included patients were diagnosed with advanced (unresectable or metastatic), well-to-moderately differentiated NETs. With the exception of the trial of Kölby and colleagues, 7 all trials had PFS as the primary end point.5–6,8–12,24–36 The study characteristics of the publications included in the meta-analysis are shown in Table 1.

Literature search and selection.
Characteristics of included trials for network meta-analyses.

B: bevacizumab; CI: confidence interval; CT: chemotherapy; E: everolimus; Gas: gastrointestinal; GEP: gastroenteropancreatic; HR: hazard ratio; IFN-α: interferon-α; NR: not reported; OS: overall survival; PFS: progression-free survival; PRRT: peptide receptor radionuclide therapy; SAE: serious adverse events; SSA: somatostatin analog.
Assessment of included trials
The risk of bias in included RCTs was summarized in Figure 2. Four trials7,9,24,35 were judged to be ‘unclear’, as they had more than three rated with an unclear risk of bias. The remaining trials were rated with a low risk of bias. No trial was judged to be high risk of bias.

Assessment of risk of bias. (a) Methodological quality graph: authors’ judgment about each methodological quality item presented as percentages across all included studies. (b) Methodological quality summary: authors’ judgment about each methodological quality item for each included study, ‘+’ low risk of bias; ‘?’ unclear risk of bias; ‘–’ high risk of bias.
Funnel plot analysis in term of PFS did not indicate any evident risk of publication bias (Figure 3).
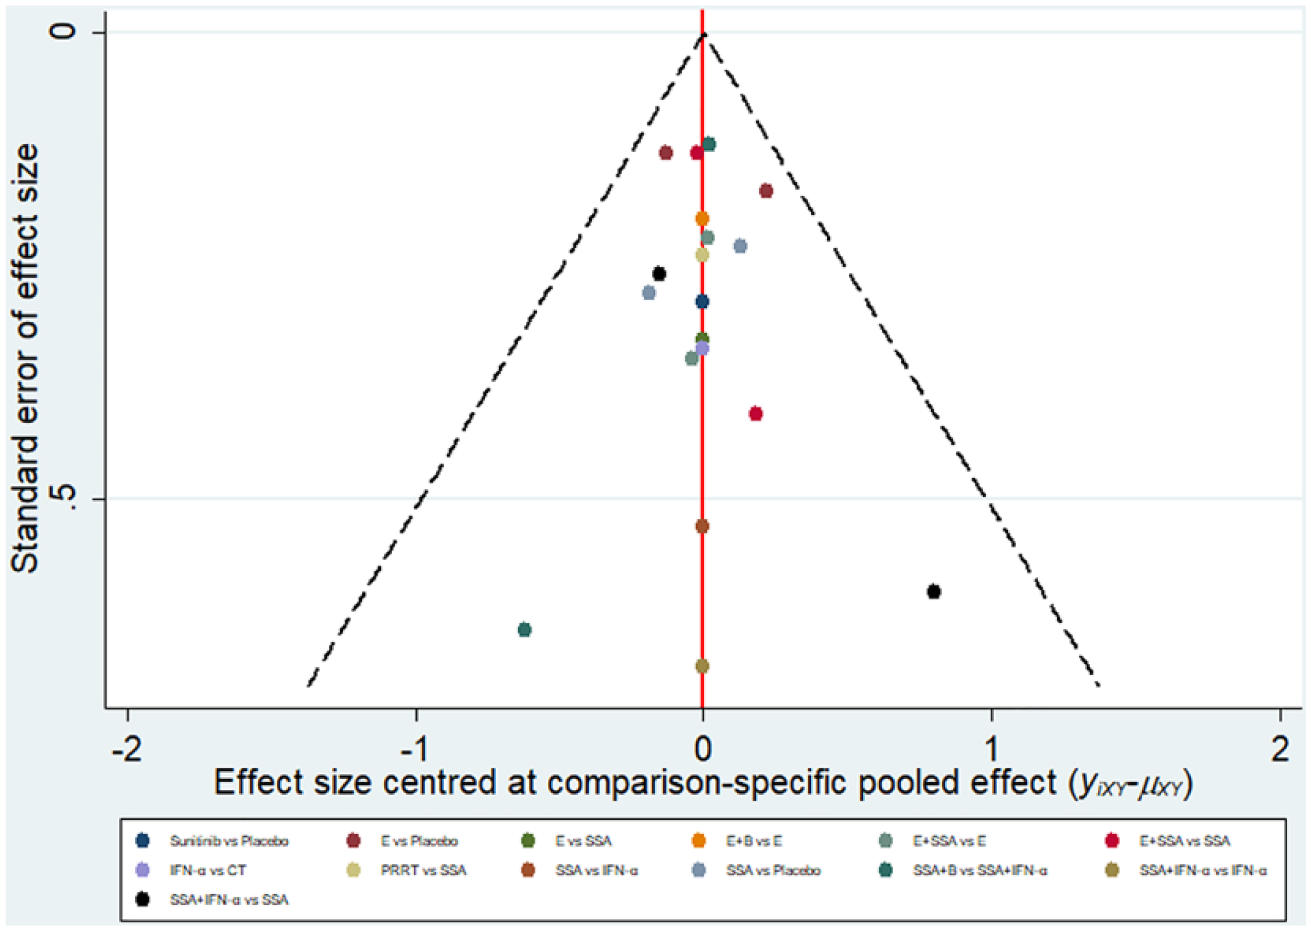
Comparison-adjusted funnel plots of publication bias test for progression-free survival. B: bevacizumab; CT: chemotherapy; E: everolimus; IFN-α: interferon-α; PRRT: peptide receptor radionuclide therapy; SSA: somatostatin analog.
Conventional pairwise meta-analysis
Results of PWMA are shown in Table 2. In terms of PFS, everolimus (HR = 0.39, 95% CI: 0.32–0.47, Pheterogeneity = 0.11) and SSA (HR = 0.41, 95% CI: 0.29-0.58, Pheterogeneity = 0.37) were more effective than placebo, and SSA+IFN-α was more effective than SSA alone (HR = 0.32, 95% CI: 0.21–0.50, Pheterogeneity = 0.14). Other comparisons resulted in a nonsignificant effect on PFS. With regard to OS, everolimus (HR = 0.92, 95% CI: 0.83–1.03, Pheterogeneity = 0.14) and SSA (HR = 0.81, 95% CI: 0.48–1.37, Pheterogeneity = 1.0) failed to show significant advantage over placebo. As for overall SAEs, everolimus, everolimus+SSA and SSA+IFN-α were more likely to cause SAEs than placebo (OR = 12.17, 95% CI: 7.06–20.97, Pheterogeneity = 0.87), SSA (OR = 7.73, 95% CI: 4.64–12.89, Pheterogeneity = 0.30), and SSA+bevacizumab (OR = 2.11, 95% CI: 1.34–3.32, Pheterogeneity = 0.75), respectively. No significant differences on risk of causing SAEs were observed between SSA and placebo (OR = 0.83, 95% CI: 0.50–1.40, Pheterogeneity = 0.43), and everolimus+SSA and everolimus (OR = 2.89, 95% CI: 0.75–11.16, Pheterogeneity = 0.12).
Results of direct comparisons.

B: bevacizumab; CI: confidence interval; E: everolimus; HR: hazard ratio; IFN-α: interferon-α; No.: number; OR: odds ratio; OS: overall survival; PFS: progression-free survival; SAE: serious adverse events; SSA: somatostatin analog.
Network meta-analysis
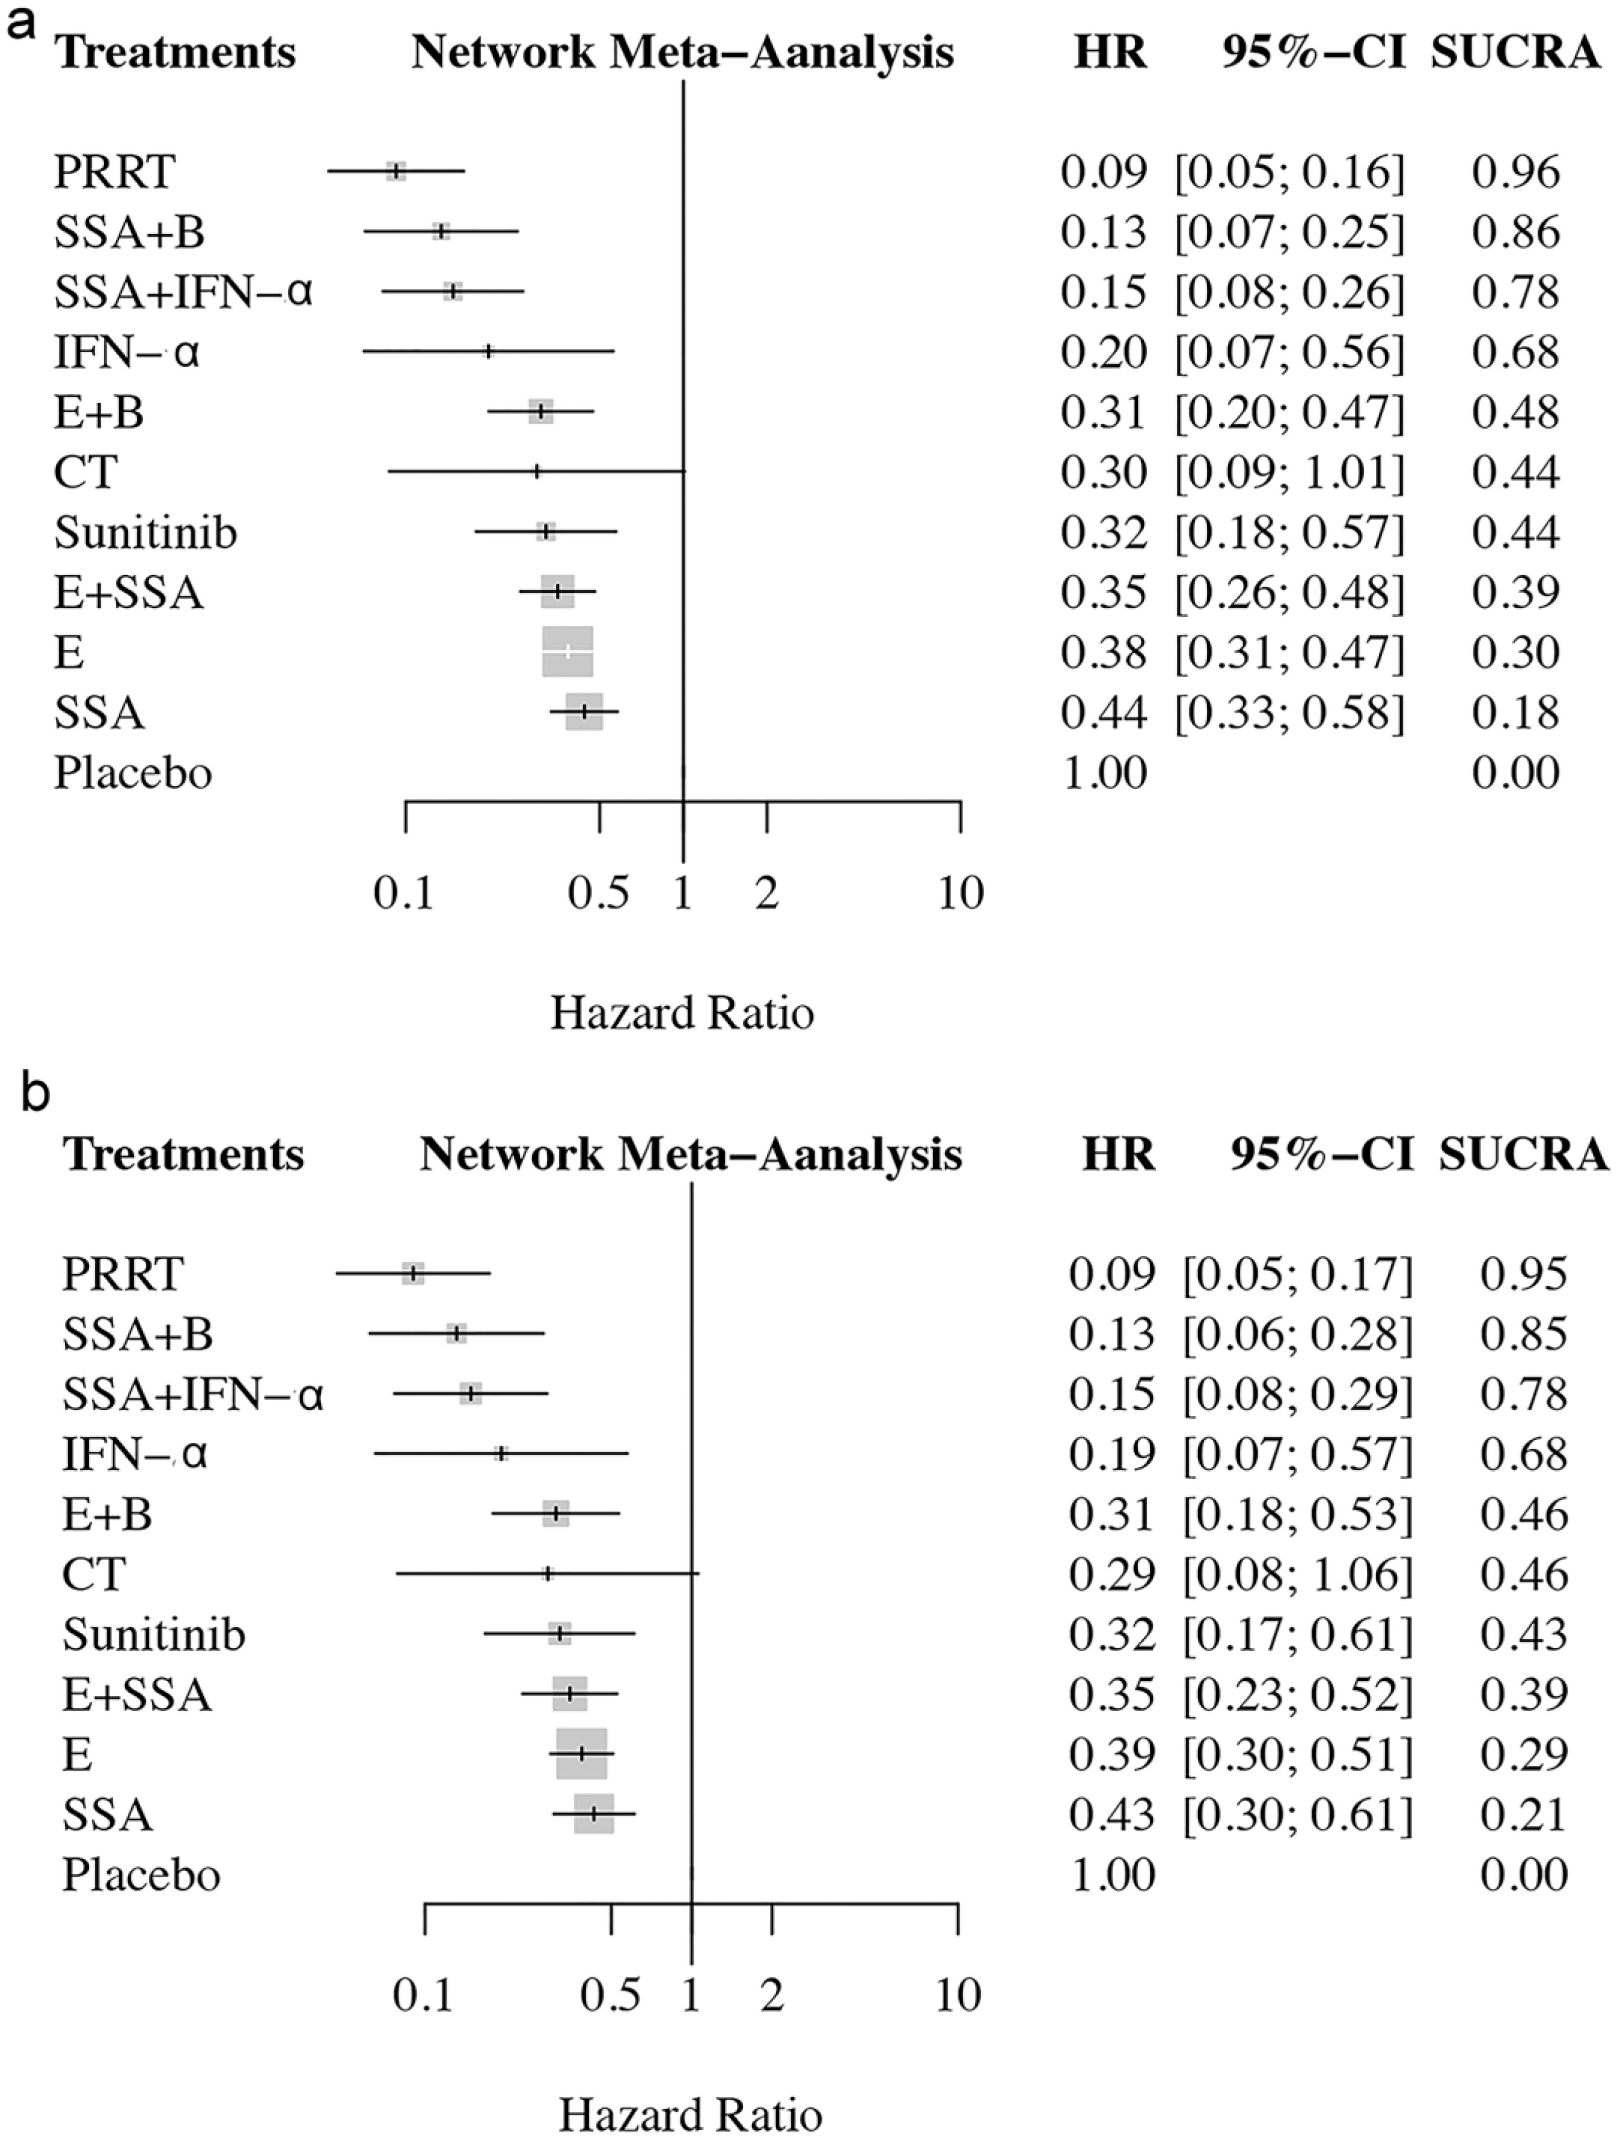
Figure 4 shows the network established for NMA for three outcomes. Results of the NMA were presented in Table 3. All 15 RCTs5–12,24–25,31,33–36 with 11 treatments were included in the analysis of PFS (Table 3a). PRRT showed significant advantage over SSA (HR = 0.21, 95% CI: 0.11–0.41), everolimus (HR = 0.25, 95% CI: 0.11–0.53), sunitinib (HR = 0.29, 95% CI: 0.10–0.82), everolimus+SSA (HR = 0.26, 95% CI: 0.12–0.54), and everolimus+bevacizumab (HR = 0.31, 95% CI: 0.11–0.82). Likewise, SSA+IFN-α and SSA+Bevacizumab were superior to SSA (HR = 0.34, 95% CI: 0.19–0.65 and HR = 0.30, 95% CI: 0.14–0.64), everolimus (HR = 0.39, 95% CI: 0.19–0.84 and HR = 0.34, 95% CI: 0.14–0.82), and everolimus+SSA (HR = 0.41, 95% CI: 0.20–0.86 and HR = 0.36, 95% CI: 0.15–0.83), but failed to show PFS advantages compared with sunitinib (HR = 0.46, 95% CI: 0.17–1.3 and HR = 0.41, 95% CI: 0.13–1.2), and everolimus+bevacizumab (HR = 0.49, 95% CI: 0.19–1.3 and HR = 0.43, 95% CI: 0.15–1.2). All treatments except chemotherapy (5-fluorouracil+streptozotocin) were more efficacious than placebo. Other regimen comparisons did not produce statistically significant differences.
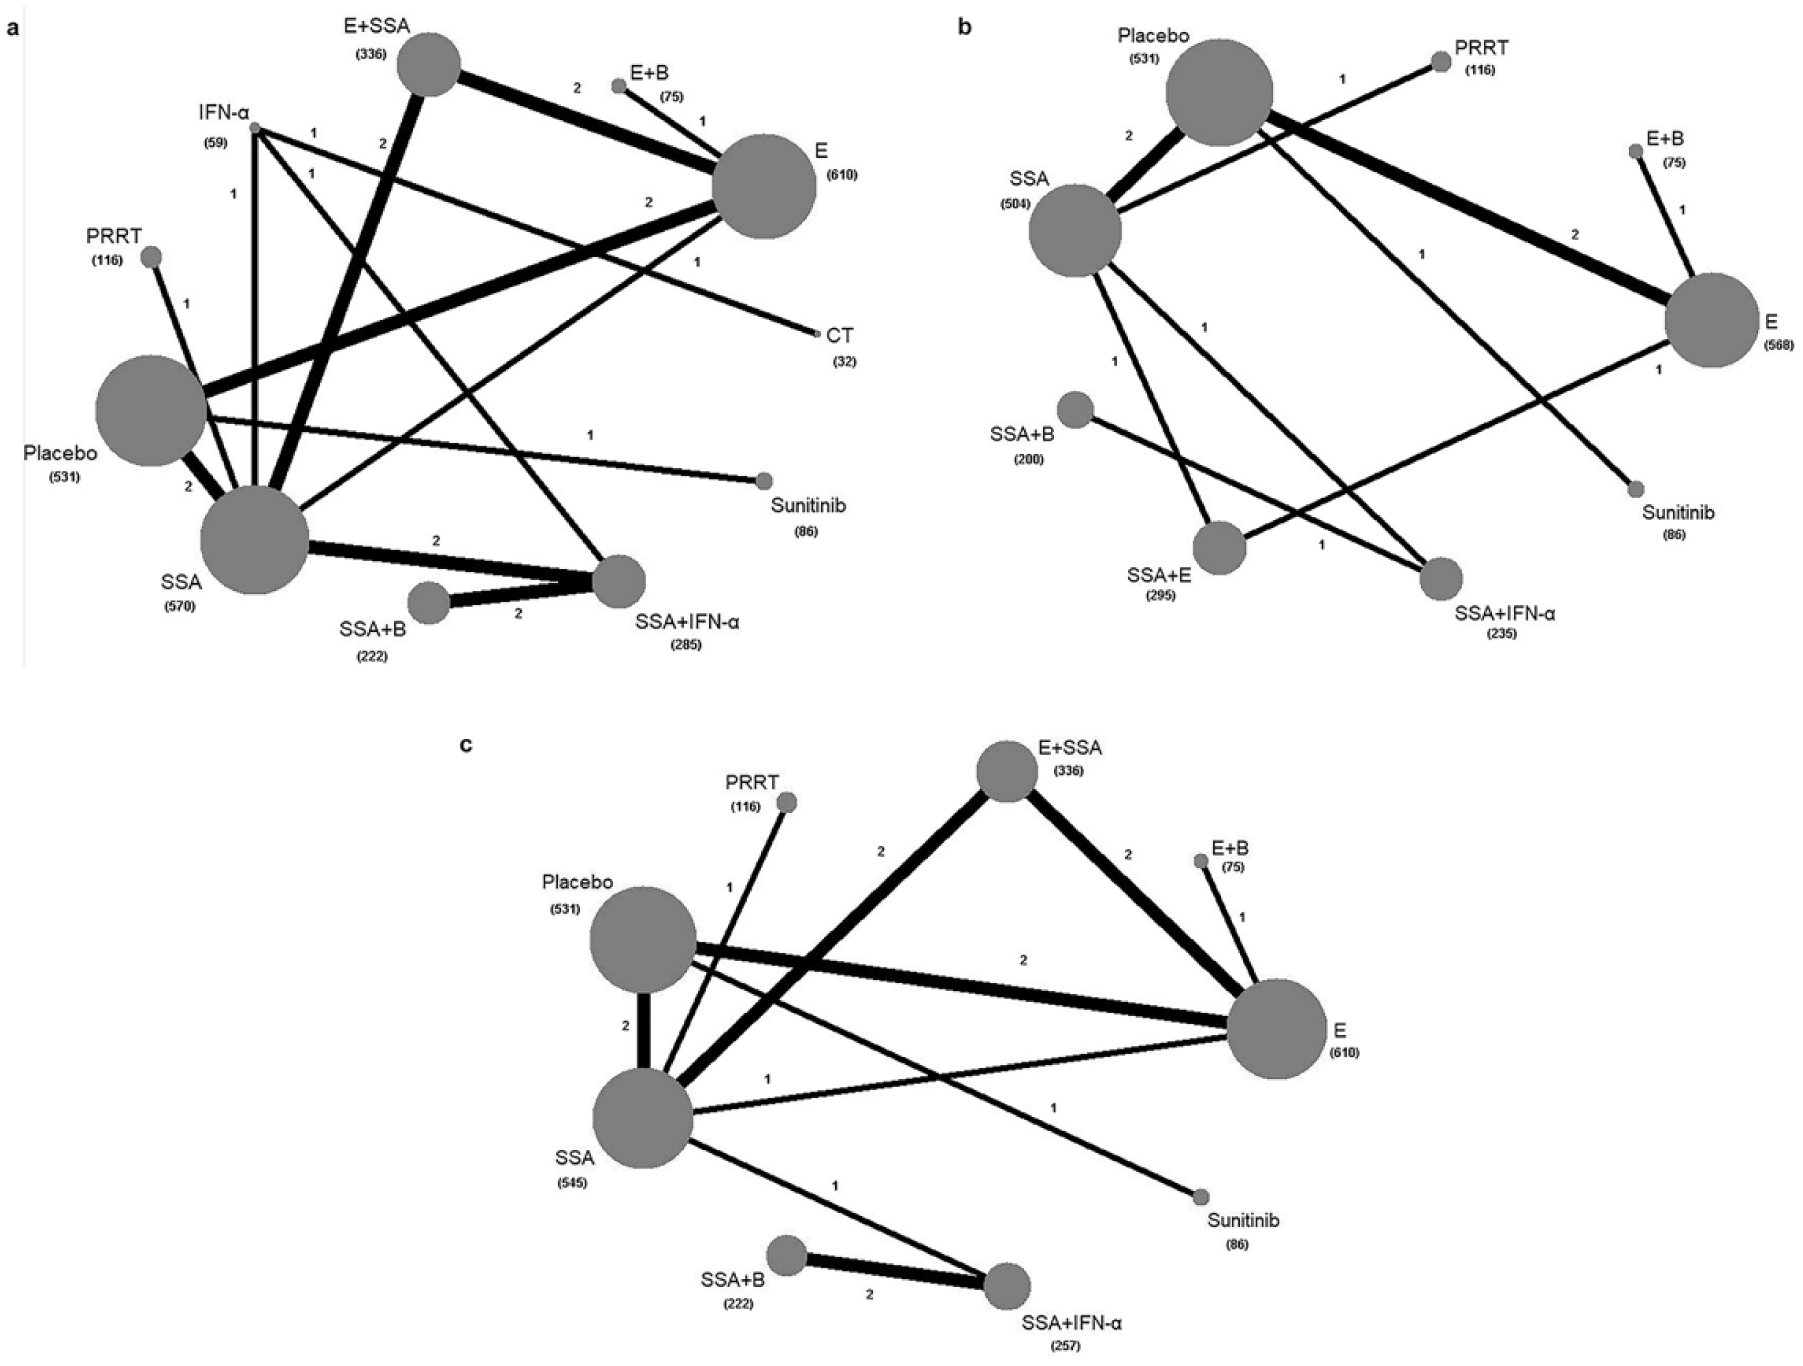
Network of eligible comparisons for the Bayesian network meta-analysis. (a) Progression-free survival; (b) overall survival; (c) serious adverse events. The size of the nodes is proportional to the number of patients (in parentheses) randomized to receive the treatment. The width of the lines is proportional to the number of trials (beside the line) comparing the connected treatments. B: bevacizumab; CT: chemotherapy; E: everolimus; IFN-α: interferon-α; PRRT: peptide receptor radionuclide therapy; SSA: somatostatin analog.
Results of network meta-analysis.

B: bevacizumab; CT: chemotherapy; E: everolimus; IFN-α: interferon-α; PRRT: peptide receptor radionuclide therapy; SSA: somatostatin analog.
Eleven RCTs6–9,12,28–31,31–34 with nine treatments were included in the analysis of OS (Table 3b). All regimen comparisons did not produce statistically significant differences.
Data on overall SAEs were available in 13 RCTs5–12,25,32–35 with nine treatments (Table 3c). Everolimus+bevacizumab showed significantly higher risk of SAEs in comparison to each regimen. Everolimus+SSA was more likely to cause SAEs than placebo, SSA, sunitinib, and PRRT. Everolimus resulted in higher SAEs than placebo and SSA. Other regimen comparisons did not produce statistically significant differences.
Inconsistency assessment and treatment ranking
There were two independent closed loops in the network for PFS: SSA-Placebo-Everolimus and SSA-Everolimus-Everolimus+SSA; one independent closed loop for OS: SSA-Placebo-Everolimus-Everolimus+SSA; and two independent closed loops for SAEs: SSA-Everolimus-Everolimus+SSA and SSA-Placebo-Everolimus. Analysis of inconsistency showed that the NMA results were similar to the PWMA results in terms of PFS, OS, and SAEs, which suggested the consistency between the direct and indirect evidence (Figure 5).

Inconsistency evaluation by node-splitting analyses. (a) Progression-free survival; (b) overall survival; (c) serious adverse events. E: everolimus; SSA: somatostatin analog.
The treatment rankings in terms of PFS based on SUCRA are shown in Figure 6. PRRT was the most effective treatment (96%), followed by SSA+ bevacizumab (86%) and SSA+ IFN-α (78%). In subgroup analysis of gastroenteropancreatic (GEP) tract, PRRT was still the most effective treatment (95%), followed by SSA+ bevacizumab (85%) and SSA+IFN-α (78%).
The treatment rankings in terms of improving progression-free survival based on SUCRA. (a) overall; (b) subgroup of gastroenteropancreatic tract. B: bevacizumab; CT: chemotherapy; E: everolimus; PRRT: peptide receptor radionuclide therapy; SSA: somatostatin analog; SUCRA: surface under the cumulative ranking curves.
To assess the efficacy and tolerability of the treatments comprehensively, we ranked them based on the SUCRA of PFS and SAEs in the ranking plot (Figure 7). PRRT was the best for improving PFS with low risk of causing SAEs; SSA+ bevacizumab was the second-best for improving PFS and with low risk of causing SAEs; SSA+ IFN-α was the third best for improving PFS and with a moderate risk of causing SAEs.

Ranking plot based simultaneously on efficacy (x-axis: SUCRA value of progression-free survival) and tolerability (y-axis: 1-SUCRA value of serious adverse events). B: bevacizumab; E: everolimus; IFN-α: interferon-α; PRRT: peptide receptor radionuclide therapy; SSA: somatostatin analog; SUCRA: surface under the cumulative ranking curves.
Discussion
To the best of the authors’ knowledge, this is the first network meta-analysis assessing the comparative efficacy and tolerability of all major treatments for patients with advanced well-differentiated NETs. It showed that PRRT was likely to be the best treatment in term of the benefit-risk ratio. Data from several individual nonrandomized trials of PPRT have consistently shown high response rates and long PFS in patient with gastroenteropancreatic NETs.37–40 In a more recent randomized phase III trial, PRRT plus best supportive care provided longer PFS than high-dose octreotide, and with limited SAEs in patients with advanced midgut NETs. 8 However, to date PPRT has not been compared directly with any other established regimens. In our NMA, PRRT provided a PFS advantage over SSA, everolimus, sunitinib, everolimus+SSA, and everolimus+bevacizumab. Based on cluster ranking, PRRT had the highest probability (96%) of being the most effective treatment in improving PFS and with a low risk of causing SAEs.
Based on our NMA results, SSA+bevacizumab and SSA+IFN-α were another two effective regimens in improving PFS. Efficacy and tolerability of the two regimens have been compared directly in a previous random assignment phase II study. 35 SSA+bevacizumab resulted in longer PFS than SSA+IFN-α treatment for patients with advanced carcinoid. In our NMA, both of the two regimens provided a PFS advantage over SSA, everolimus, and everolimus+SSA. Cluster ranking showed that SSA+bevacizumab had the second-highest probability (86%) of being the most effective treatment in improving PFS, and with a low risk of causing SAEs which similar to PRRT. SSA+IFN-α had the third-highest probability (78%) of being the most effective treatment in improving PFS, but with a moderate risk of causing SAEs. In term of the benefit-risk ratio, SSA+bevacizumab was likely to be relatively superior to SSA+IFN-α for the treatment of advanced well-differentiated NETs.
No significant difference in improving OS was observed among all treatments in our NMA. It should be noted that except the trial of Kölby and colleagues, 7 all included studies used PFS as the primary end point. Thus, the most preferable regimen in term of improving OS needs further well-designed, using OS as the primary end point, prospective studies to identify.
Seven other regimens, including SSA alone, everolimus alone, IFN-α alone, sunitinib, everolimus+SSA, everolimus+bevacizumab, and chemotherapy, were also reported to be effective for the treatment of advanced NETs. However, based on our NMA results, they were not superior to the aforementioned three regimens due to relatively poor efficacy or tolerability.
This NMA has a number of limitations. Firstly, in common with other meta-analyses, data were collected and analyzed in aggregate on the basis of results reported from trials, instead of individual patient data. Moreover, the indirect comparisons involved are not randomized comparisons, and may suffer the biases of observational studies, for example due to confounding. Secondly, due to the heterogeneity of the disease and the diversity of the compared studies in terms of the enrolled population (morphology and differentiation, ki-67 index, type and number of previous treatments, functioning and nonfunctioning forms, tumor burden, metastatic sites, etc.), we could not draw a definitive conclusion about which was the most effective treatment for advanced well-differentiated NETs. Thirdly, several included RCTs used different toxicity criteria to evaluate SAEs, however, no significant heterogeneity and inconsistency were observed in this study. Finally, some HRs of PFS or OS were calculated from the Kaplan–Meier curve due to that they were not directly reported in the articles. This may result in bias.
Conclusion
Based on efficacy and toxicity, PRRT is likely to be the best treatment for patients with advanced well-differentiated NETs. SSA+bevacizumab and SSA+IFN-α are also more effective regimens with limited risk of SAEs. Further direct head-to-head, well-designed clinical trials are needed to confirm these findings.
Supplemental Material
Appendix_1_1 – Supplemental material for Treatments for patients with advanced neuroendocrine tumors: a network meta-analysis
Supplemental material, Appendix_1_1 for Treatments for patients with advanced neuroendocrine tumors: a network meta-analysis by Tingting Liu, Jiehao Liao, Jun Dang and Guang Li in Therapeutic Advances in Medical Oncology
Footnotes
Authors’ contribution
Study concept and design: Jun Dang. Acquisition of data: Tingting Liu, Jiehao Liao. Analysis and interpretation of data: Jun Dang, Guang Li, Tingting Liu, Jiehao Liao. Drafting of the manuscript: All authors. Critical revision of the manuscript for important intellectual content: Jun Dang.
Funding
This research received no specific grant from any funding agency in the public, commercial, or not-for-profit sectors.
Conflict of interest statement
The authors declare that there is no conflict of interest.
Supplemental material
Supplemental material for this article is available online.
References
Supplementary Material
Please find the following supplemental material available below.
For Open Access articles published under a Creative Commons License, all supplemental material carries the same license as the article it is associated with.
For non-Open Access articles published, all supplemental material carries a non-exclusive license, and permission requests for re-use of supplemental material or any part of supplemental material shall be sent directly to the copyright owner as specified in the copyright notice associated with the article.