
Abstract
Background:
Limited information is available on the applicative value of liquid biopsy (LB) in rare tumors, including Ewing’s sarcoma (ES). The accepted precision diagnostics standards would greatly benefit from a non-invasive LB test monitoring pathognomonic gene rearrangements in the bloodstream.
Methods:
Tissue and blood samples were collected from six and four ES patients, respectively. Plasma was cleared by two successive rounds of centrifugation and stored frozen until RNA extraction by the QIAmp CNA kit. RNA was retro-transcribed and subjected to real-time quantitative polymerase chain reaction (RT-qPCR) and digital polymerase chain reaction (dPCR). Reactions were set up using two custom primer sets identifying types 1 and 2 EWS-FLI1 fusion transcripts.
Results:
The two prevalent types of EWS-FLI1 rearrangements could be identified using only two sets of polymerase chain reaction primers, regardless of patient-specific EWS-FLI1 DNA breakpoints. RT-qPCR and dPCR discriminated the two variants in five tumor tissue RNAs and in four circulating tumor RNAs (ctRNAs). Of note, EWS-FLI1 molecular diagnosis was possible using blood samples even when tumor tissue was not available. ctRNA levels correlated (p < 0.05) with volume-based positron emission tomography (PET) parameters (metabolic tumor volume and total lesion glycolysis), and allowed the fine tracking of disease course after surgery, during adjuvant as well as neoadjuvant chemotherapy, and at follow up in one patient.
Conclusions:
To our knowledge, this is one of the few single-marker LB assays in solid tumors specifically designed to detect rearranged RNAs in blood, and the first study describing EWS circulating tumor RNAs in ES patients. Altogether, our results support the idea that LB may have a considerable impact on ES patient monitoring and management.
Introduction
Ewing’s sarcomas (ESs) are extremely rare tumors of bone and soft tissues that mostly affect children and young adults. Incidence is one case in a million in the USA and 0.3 in 100,000 per year in White Europeans under the age of 25.1–3 The diagnostic offering is scanty. The standard circulating tumor markers routinely assessed in tumors occurring at high prevalence are not applicable to ES. Serum lactate dehydrogenase (LDH) has been most consistently associated with aggressive disease (see4,5 for extensive biomarker review and LDH meta-analysis), but lacks ES specificity. In contrast, a defined set of balanced chromosomal translocations are the recognized oncogenic drivers and molecular hallmarks of ES.6,7 These may represent an appealing source of circulating ES-specific analytes.
In the majority of patients (85%), these translocations involve fusion of the DNA binding domain of the ES breakpoint region 1 (EWSR1) with the transactivation domain of FLI1, a member of the E26 transformation-specific (ETS) family of transcription factors.8,9 EWS-FLI1 (11;22)(q24;q12) gene fusions exist in two known variant groups: type 1 fusions (60% of all EWS-FLI1 cases), in which EWS exons 1–7 are fused to FLI1 exons 6–9; and type 2 fusions, in which EWS exons 1–7 join FLI1 exons 5–9. Alternative translocations have also been described involving EWS and other ETS family members (ERG, FEV, ETV1, E1AF, etc.), but they are exceedingly rare, in that the next most common rearrangement accounts for less than 10% of all ES cases.10,11 EWS rearrangements give rise to chimeric proteins that mediate aberrant oncogenic transcriptional programs and interfere with pivotal signaling pathways involved in cell growth, differentiation and proliferation. 11
This quintessential role of EWS fusion transcripts makes it highly unlikely that they might be counter-selected, down-regulated or lost during tumor progression, strongly supporting their routine diagnostic assessment not only in genomic DNAs from ES tumor tissues,12,13 but also in a ‘liquid biopsy’ (LB) format, for example for the convenient, non-invasive, longitudinal monitoring of aberrant genomic traits in blood (reviewed by Siravegna and colleagues 14 ). Yet, to our knowledge there are only two published papers on LB in ES. In the first paper, Hayashi and colleagues designed a number of polymerase chain reaction (PCR) primers and probes to capture the complexity of EWS DNA breakpoint regions in circulating tumor DNA (ctDNA) from three patients. 15 In the second, very recent paper, one of us described the detection of EWS gene rearrangements in circulating tumor cells. 16
In the present study, we took a third, different approach involving chip-based digital PCR (dPCR) on plasma with the limited set of primers and probes recently shown by Benini and colleagues to detect circulating tumor cells. 16 These dPCR assays have been designed to directly identify fusion transcripts in tissues and circulating tumor RNA (ctRNA) regardless of patient-specific DNA breakpoints. We show herein that this simplified approach detects EWS-FLI1 translocations in patients whose clinical histories epitomize recurrent ES clinical queries. We show that, in combination with last-generation medical imaging [i.e. positron emission tomography (PET)], LB provides simple, integrative and informative readouts for non-invasive, longitudinal assessment of ES tumor burden.
Materials and methods
Patients characteristics and sampling
Biobanking and testing of biological materials were approved by the Central Ethical Review Board of the Italian National Cancer Institutes (CEC/707/15 dated 13 October 2015), and were conducted in compliance with the World Medical Association Declaration of Helsinki. Each participant signed a written informed consent authorizing the collection of genomic information (except germline, genome-wide data) from both tissues and blood, as well as anonymized data exchange/dissemination exclusively for scientific, nonprofit purposes. The clinical characteristics of the patients are presented in Table 1. Tumor tissue specimens were collected on the occasion of either surgery or diagnostic excisional biopsy. Upon histologic examination, all cases showed a typical ES phenotype with a small blue round cell morphology, an immunohistochemical intense membranous stain for CD99, nuclear positivity for FLI1, occasional staining for synaptophysin, and no detectable muscular, cytokeratin and lymphoid markers. Complementary DNAs (cDNAs) with and without known EWS rearrangement (from ES and non-ES specimens, respectively) were included as dPCR control templates. Blood specimens were collected in BD Vacutainer K2EDTA tubes (BD Biosciences, San Jose, CA, USA) at the indicated time points, and plasma was processed within 1 h by two successive rounds of centrifugation at 4°C (2000 × g for 20 min, and 16,000 × g for 10 min) to remove cells and residual debris, respectively. Cleared plasma samples were stored frozen at −80°C in 1.8 ml aliquots at the IRCCS Regina Elena National Cancer Institute Body Fluids Biobank (BBIRE-LB), and were thermally monitored until thawing and processing.
Patient characteristics.

NA: VAC/VID/VAC/EI, A: VAC/VID/IE. 2A: VAC/EI; 3NA: VAI, A: VAI/EI; 4NA: VAC/IE plus radiotherapy; 5NA: VAC/VID. 6NA: VAI, A: VAI/CE/EI/BuMel.
Post-chemotherapy necrosis was histologically evaluated on surgical samples; Tumor tissue RNAs were obtained from all patients except pt#4; ctRNAs were obtained from patients #1–4.
A, adjuvant chemotherapy; BuMel, busulphan, melphalan; CE, cyclophosphamide, etoposide; CH, chemotherapy; EI, etoposide, ifosfamide; F, female; M, male; NA, neoadjuvant chemotherapy; nd, not determined; VAC, vincristine, adriamycin, cyclophosphamide; VAI, vincristine, adriamycin, ifosfamide; VID, vincristine, ifosphamide, dactinomycin.
RNA extraction, quantification and retrotranscription
A total of four sections (5-µm thick) were cut from formalin-fixed, paraffin-embedded (FFPE) tissue blocks, macro-dissected for enrichment in neoplastic tissue, incubated in deparaffinization solution, and digested with proteinase K (Qiagen, Hilden, Germany). RNA was then extracted with the RNeasy FFPE Kit (Qiagen), and quantified with a NanoDrop 2000 Spectrophotometer (ThermoFisher Scientific, Waltham, USA). Total ctRNA was extracted from 1.8 ml of plasma using the QIAmp CNA kit (Qiagen), and eluted in a final volume of 30 μl. Eluates were treated by DNase, cleaned up with the RNeasy MinElute kit (Qiagen), and concentrated in a final volume of 14 μl. RNAs from both tissues and plasma were mixed with 4 μl of SuperScript VILO MasterMix and diethyl dicarbonate (DEPC)-treated water (ThermoFisher) in a final volume of 20 μl, and retro-transcribed by two successive incubations (25°C for 10 min and 42°C for 60 min). The reaction was stopped at 85°C for 5 min, and the resulting template cDNAs were subjected to either real-time quantitative polymerase chain reaction (RT-qPCR) or dPCR.
RT-qPCR and dPCR
EWS-FLI1 translocations were analyzed essentially as described 16 using the primers EWS7 (AGCTCCAAGTCAATATAGCCAACAG), FLI6 (AAGCTCCTCTTCTGACTGAGTCATAA), and FLI5 (AGGTTGTATTATAGGCCAGCAGTGA), and a single probe (FAM-CAGCAGCTACGGGCA) in both the 7500 Fast RT-PCR (Applied Biosystems, Foster City, CA, USA) and the QuantStudio 3D dPCR equipment (ThermoFisher). RT-qPCR reactions were set up in a final volume of 20 μl containing 10 μl of Universal Master Mix II with UNG 2x, 40 ng cDNA, 0.3 μM each of forward and reverse primers, and 0.2 μM Taqman® MGB probe (Applied Biosystems). Thermal cycling was as follows: 5 min at 50°C; 5 min at 95°C; and then 40 cycles, each involving 15 sec at 95°C and 60 s at 60°C. All samples were run in duplicate. RNA quality was assessed by amplifying the housekeeping β2-microglobulin gene. As to dPCR, matched tissue RNA and ctRNA from each patient were always run in parallel to insure consistency. dPCR reactions were set up in a final volume of 16 μl including 8 μl of 2x Master Mix, 0.9 nM each of forward and reverse primers, 0.25 nM of TaqMan® MGB probe, and 7.0 μl of template. The mix was loaded onto dPCR chips, and thermal cycling was as follows: an initial denaturation step of 10 min at 96.0°C, then 39 cycles for 2 min at 58.0°C and 30 sec at 98.0°C, followed by a final elongation step of 2 min at 60°C. Threshold values (positive versus negative; blue versus yellow spots) were automatically calculated by the ThermoFisher Cloud Analysis Suite in tissue RNA from each patient, manually reviewed, and then applied to ctRNA assays from the same patient with no additional data manipulation.
Integration of PET imaging and LB data
Volume-based PET parameters were calculated as described. 17 Overall, two semi-quantitative volumetric parameters of active 18F-fluorodeoxyglucose (FDG) uptake were obtained: (a) metabolic tumor volume (MTV) and (b) total lesion glycolysis (TLG). Briefly, MTV is bi-parametric: it incorporates metabolic activity (biological volume) and three-dimensional volumetric data. TLG incorporates MTV but also takes into account the mean standardized uptake volume (SUVmean), thus providing a closer estimate of metabolic tumor burden. MTV2 (absolute SUV cutoff = 2) and MTV40% (relative cutoff at 40% of the SUV max of the lesion) values were measured from FDG-PET images using a SUV-based automated contouring program (syngo.via, Siemens Healthcare, Germany). TLG was similarly measured by multiplying MTV values (calculated for each threshold) and the SUVmean of the lesion, to obtain the TLG2 and TLG40% values, respectively. MTV and TLG values for any specific lesion were paired with the corresponding numbers of copies/ml of EWS fusion transcripts detected by LB at the closest available time point. Regression coefficients and Pearson’s p-values of imaging versus LB data were then calculated in a Microsoft Excel spreadsheet.
Results
Assay validation on FFPE-derived RNAs
The technical aim of the present study was to develop a robust and sensitive dPCR assay to quantitate EWS-FLI1 fusion transcripts in the bloodstream. To this end, previously designed 16 primer/probe sets were initially validated on five available RNAs isolated from FFPE tumor tissues of representative ES patients. Positive and negative controls (the latter including cDNAs from non-ES and no cDNA samples) were included in each run. EWS types 1 and 2 rearrangements were detected and concordantly assigned by RT-qPCR [Figure 1(a)] and dPCR [Figure 1(b)] in all 5 patients. Marginal dPCR noise (mean 1.2%; range 0.0–2.4%) was almost invariably seen of type 2 rearrangements in type 1 EWS assays, and vice versa. Remarkably, noise was seen in tissues (presumably because input cDNA is high in these samples), but not in plasma samples that contain low levels of ctRNA (see below). Thus, noise ranged from negligible to absent and it did not affect variant assignment. It is concluded that EWS types 1 and 2 transcripts can be distinguished by dPCR with high signal to noise ratios. Unlike RT-qPCR, dPCR absolute quantification (copy number per ml) does not require internal normalization controls. As expected, this results in a simpler and more precise assay format. Thus, dPCR was selected for LB assessment on four representative ES patients.

Comparative analysis of EWS rearrangements by RT-qPCR and dPCR. Representative RT-qPCR (a) and dPCR (b) assays were carried out to detect EWS translocations on five ES tissue RNAs and the indicated controls. Tumor tissue from pt#4 was not available. One of two independent experiments is shown. RT-qPCR samples were run in duplicate. Threshold values for EWS translocations were optimized for both RT-qPCR and dPCR based on signals in positive controls.
Detection of EWS rearrangements in ctRNAs from plasma samples
As shown in Figure 2a–c, an EWS type 2 rearrangement was clearly detectable, after adjuvant chemotherapy, in matched tissue and plasma RNAs obtained from pt#2. Blood was taken on the day before surgery. The positive LB assay was in agreement with a PET/computed tomography (CT) scans obtained 30 days earlier, and confirmed tissue molecular diagnosis. In addition, the presence of ctRNA in the bloodstream suggested the persistence of residual tumor lesions after chemotherapy.
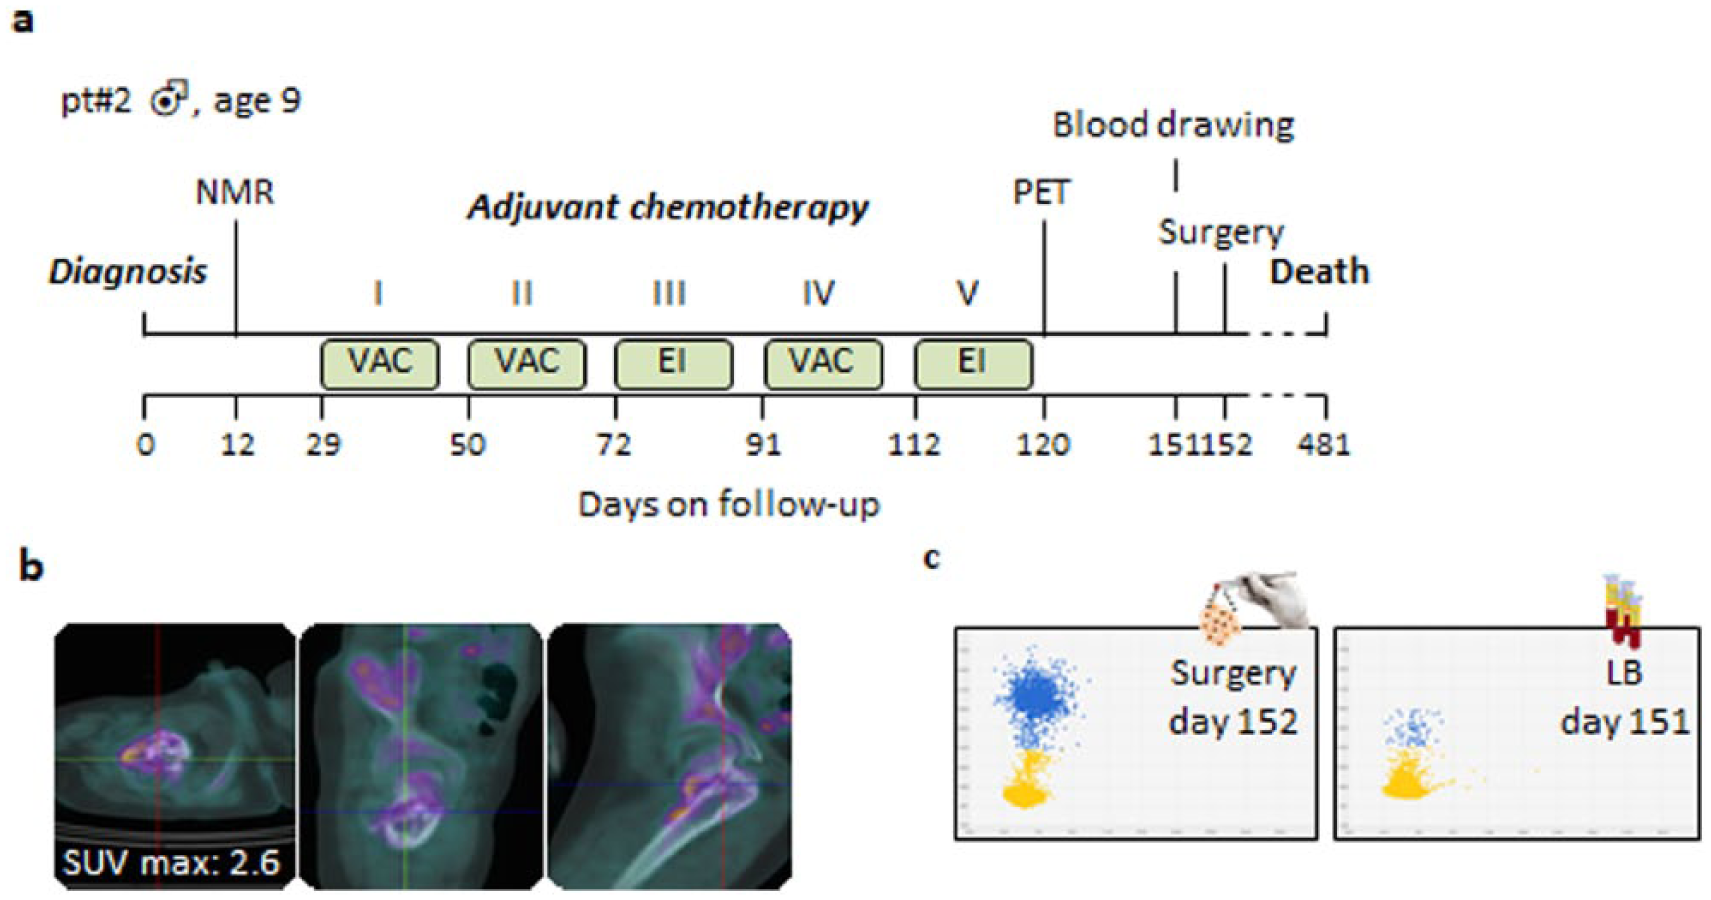
Detection of an EWS type 2 rearrangement in tumor tissue and blood. (a) Timeline of PET/NMR scans, blood collection, and treatment of pt#2. (b) 18F-FDG PET/CT scans performed at the end of adjuvant therapy on day 120. Axial, sagittal and coronal views are shown. A residual tumor activity was evident in the proximal meta-diaphysis of the right femur after the end of adjuvant therapy. (c) dPCR analysis of biopsy tissue, and plasma obtained after adjuvant chemotherapy. One of two independent experiments is shown.
In another case (pt#4, Figure 3), EWS typing was possible despite the tumor biopsy was not available to us. This outpatient was referred to the Regina Elena Surgery Unit with a bulky lesion [Figure 3(a) and (b)]. Remarkably, dPCR detected an EWS type 2 translocation [Figure 3(c)], indicating that EWS typing in an LB format may assign ES molecular diagnosis even in the absence of tumor tissue.

Molecular diagnosis of EWS type 2 in plasma in the absence of tumor biopsy. (a) Timeline of pt#4, as in Figure 2. (b) 18F-FDG PET/CT scans performed on day 5, at diagnosis. Axial, sagittal and coronal views are shown of a bulky lesion of the right sacrum involving soft tissues of the pelvis and the gluteus. (c) dPCR analysis of plasma obtained at diagnosis. One of two independent experiments is shown.
In pt#1 (Figure 4), neoadjuvant chemotherapy induced a considerable reduction in size of an ES lesion localized to the paravertebral area [Figure 4(b)]. In spite of its small size after chemotherapy, the lesion released sufficient EWS fusion transcripts to be seen by LB on the very day of surgery, few hours before removal [Figure 4(c)].

Persistence of EWS type 2 transcript in plasma following neo-adjuvant chemotherapy. (a) Timeline of pt#1, as above. (b) 18F-FDG PET/CT scans performed before neoadjuvant chemotherapy at day 24 (upper panels), and at the end of treatment at day 144 (lower panels). Axial, sagittal and coronal views are shown of a tumor lesion in the para-spinal soft tissues of the dorsal region (arrows). The reduction in SUV max indicates a partial metabolic response after neoadjuvant chemotherapy. (c) dPCR analysis of tissue RNA and ctRNA from tumor biopsy and a plasma sample obtained at surgery. One of two independent experiments is shown.
Finally, a cogent demonstration of the usefulness of LB in documenting progressive ES eradication could be obtained in pt#3, who could be serially monitored for 554 days by PET and LB, as shown by representative results in Figure 5. Also in this patient, PET/CT scans documented a small tumor lesion, displaying an evident response, upon imaging, at the end of four neoadjuvant chemotherapy (vincristine, adriamycin, ifosfamide; VAI) cycles [Figure 5(a) and (b)]. This objective response was paralleled by a decrease in ctRNA [Figure 5(c)]. Next, the patient underwent ablative surgery that apparently resulted in the complete removal of the lesion. Accordingly, little if any ctRNA could be seen immediately after surgery (day 133), and no ctRNA at all was detectable in three serial blood drawings during and after adjuvant chemotherapy, until day 554 [Figure 5(c)]. Thus, LB continuously supported the available clinical evidence for a progressive eradication of the ES lesion. This patient is the only one in our cohort who is still alive. At last follow up, he has neither clinical nor radiological evidence of disease, and no EWS ctRNA is detectable by dPCR.

Longitudinal monitoring of EWS type 1 transcript on plasma samples. (a) Timeline of pt#3, as above. (b) 18F-FDG PET/CT scans performed before (top panels) and after (bottom) neoadjuvant chemotherapy. Axial, sagittal and coronal views are shown of a tumor lesion in the proximal epiphysis of the left fibula (arrows), documenting a marked reduction in SUV max. (c) dPCR analysis of tumor RNA and ctRNA from tumor biopsy and serial plasma samples. One of two independent experiments is shown.
Altogether, these results demonstrate that ES patients can be monitored by LB in a variety of clinical situations, using just two sets of variant-specific dPCR primers detecting two prevalent EWS rearrangements.
Correlation between metabolic tumor uptake and ctRNA burden
Finally, we looked for possible correlations between conventional volumetric PET parameters on the one hand, and copy numbers of EWS fusion transcripts in blood, on the other. MTV and TLG values were calculated by two different thresholds (SUV = 2 and 40% of SUVmax), and were paired with copy numbers of EWS transcripts, estimated by dPCR at each of the five time points for which both sets of data were available in four patients. High (>0.85) and statistically significant (p < 0.05) regression coefficients were obtained for MTV2, MTV40% and TLG40%, whereas a nonsignificant correlation trend was obtained for TLG2 (Supplemental Figure S1). Thus, the available data, although limited, suggest a functional link between PET volumetric parameters and the release of driver oncogenic fusions into the bloodstream.
Discussion
ES is a very aggressive neoplasm that displays a marked propensity for local relapse and metastatic spread. It requires a variety of multimodal treatments and combinations, including intensive neoadjuvant and adjuvant chemotherapy, as well as surgery and radiotherapy. In the lack of tumor-specific, non-invasive diagnostic and prognostic tools, the detection of EWS fusions by LB during the clinical course of the disease may have a considerable value. LB is expected to: (a) place a molecular diagnosis at ES onset; (b) confirm molecular lesions upon progression; (c) rapidly assess clinical response to surgical and medical treatment; (d) correlate with, or even predict, relapse/response; and (e) objectively assess residual or progressive disease at follow up.
The present real-life study provides the first evidence that LB may gather information relevant to most of the above recurrent clinical queries.
Fusion transcripts carrying EWS rearrangements could be directly and concordantly identified by RT-qPCR and dPCR in tumor tissue RNAs and ctRNAs from ES plasma specimens. Of technical relevance, although largely expected, dPCR precisely enumerated specific amplimers with no need for internal PCR normalization controls, greatly simplifying the LB assay format. Assay conditions were selected that privilege sensitivity (since this is crucial for LB applications) at the cost of some negligible experimental noise: for example, for example, both types of EWS amplimers were seen, but only in tissue samples (not in blood). However, since the ‘wrong’ EWS type did not exceed 2.4% of the ‘right’ amplimer, noise was marginal and affected neither the molecular assignment nor the clinical interpretation of EWS rearrangements. This is important because patients with EWS type 1 fusion transcripts were shown to have an improved disease-free survival compared with those with other transcripts. 4
Based on the above technical background, LB could be applied to monitor ES patients. The levels of driver oncogenic fusions in the blood of four patients significantly correlated, at five time points, with PET volumetric parameters. These results are of potential relevance since ES patients, even when successfully treated for their localized disease, are at high risk of relapse, and must be monitored for years by periodical medical imaging examinations, often resulting in additional X-ray exposure. Although only one patient (pt#3) could be monitored for 554 days in the present study, one may foresee that the frequent administration of LB may help to reduce the frequency of medical imaging, sparing additional genotoxic damage to young patients recovering from chemotherapy with no evidence of disease. In summary, LB is potentially useful, but this remains to be conclusively proven by more extensive correlation studies with tumor burden and disease status over longer time courses and in more numerous patients.
ES tumors are characterized by ‘quiet’ genomes, with a restricted set of EWS rearrangements driving tumorigenesis and progression, and limited additional genomic aberrations/mutations as compared with most carcinomas. 15 Thus, minimal oncogenic requirements coincide with the index genomic aberrations monitored by us with LB throughout disease stages. This makes searching EWS translocations in blood particularly appealing, because they are unlikely to be lost during progression, as it often occurs for individual somatic mutations in many tumors. 14 Nevertheless, the simultaneous assessment of ES fusions and mutations may be instrumental to determine the dynamics of subclonal ES variants, if any, throughout clinical course. Additional studies are needed to also evaluate this aspect.
To date, two methods are available to identify EWS-ETS breakpoints in an LB setting. The elegant LB approach proposed by Hayashi and colleagues 15 is based on a highly customized, patient-specific, long-range droplet dPCR (ddPCR) assay. As also noted by the authors, its application to routine diagnosis bears two limitations. First, it requires next generation sequencing (NGS) from tumor tissues to grab the sequence information necessary to design ddPCR assays. Second, this NGS step works best with fresh tissue, since FFPE introduces some fragmentation in the long DNA templates necessary to capture heterogeneous translocation events. The approach by Benini and colleagues 16 and our own bypass the need to sequence patient-specific breakpoints, collect long tumor DNA fragments from fresh tissues, and design patient-specific primer sets. The assay described herein, in particular, takes advantage of plasma (and not circulating tumor cells), short ctRNA fragments as templates, and two sets of variant-specific primers. By these means, the identification of ES translocation is drastically simplified and becomes applicable even to outpatients (one example is described; pt#4) referred for therapy from other clinical centers with no molecular information, and no available pathological specimens. Along this line, one may foresee that our method will be ideal to retrospectively detect ES rearrangements in banked plasma collections. Most importantly, the use of a limited set of primer/probes for most ES patients renders our assay particularly valuable in the clinical pathological routine. Only side-by-side comparison may conclusively assess the relative merits and limitations of the approaches by Hayashi and colleagues, Benini and colleagues, and our own.
The major limitation of our own study (and other studies on rare ES tumors) is that we were not able to test large numbers of samples. In spite of this, we have shown that LB is clinically applicable to ES, and optimization efforts are warranted to yield a widely applicable and reliable assay to detect EWS ctRNAs and ctDNAs.
Supplemental Material
Fig_S1 – Supplemental material for Precision diagnostics of Ewing’s sarcoma by liquid biopsy: circulating EWS-FLI1 fusion transcripts
Supplemental material, Fig_S1 for Precision diagnostics of Ewing’s sarcoma by liquid biopsy: circulating EWS-FLI1 fusion transcripts by Matteo Allegretti, Beatrice Casini, Chiara Mandoj, Stefania Benini, Laurent Alberti, Mariangela Novello, Elisa Melucci, Laura Conti, Renato Covello, Edoardo Pescarmona, Giuseppe Maria Milano, Alessio Annovazzi, Vincenzo Anelli, Virginia Ferraresi, Roberto Biagini and Patrizio Giacomini in Therapeutic Advances in Medical Oncology
Footnotes
Acknowledgements
Rocco Fraioli and Adele Petricca are gratefully acknowledged for skilful technical assistance and secretarial support. Matteo Allegretti and Beatrice Casini contributed equally to this work.
Funding
This work was supported by Associazione Italiana per la Ricerca sul Cancro (AIRC, Nuvenia Fellowship id. 19503 to MA; IG id. 14204 and 19052 to PG), H2020 EU project ULTRAPLACAD (Grant Agreement no. 633937), and intramural funding by the IRE Scientific Direction.
Conflict of interest statement
The authors declare that there is no conflict of interest.
Supplementary material
Supplementary material for this article is available online.
References
Supplementary Material
Please find the following supplemental material available below.
For Open Access articles published under a Creative Commons License, all supplemental material carries the same license as the article it is associated with.
For non-Open Access articles published, all supplemental material carries a non-exclusive license, and permission requests for re-use of supplemental material or any part of supplemental material shall be sent directly to the copyright owner as specified in the copyright notice associated with the article.