
Abstract
In this work, a new fuel injection concept for non-premixed jet stabilized hydrogen combustion was analysed and compared to a conventional one in an atmospheric single-nozzle FLOX® combustor. In both cases, the fuel nozzle was installed concentrically inside the air nozzle with flush nozzle exits, so that no premixing takes place before both fluids, fuel and air, enter the combustion chamber. The first fuel nozzle was a metal tube with an inner diameter of ID = 1.5 mm. The second novel fuel injector consisted of a three-armed cross-section with three outlet orifices (ID = 0.5 mm) in each arm. The effective total outlet cross-section of the injectors was kept the same at 1.76 mm2. To compare their performances at typical conditions for jet-stabilized combustion systems, the global operating condition was fixed with a bulk air coflow at vexit = 115 m/s preheated to Tpre = 573 K, an equivalence ratio of ϕ = 0.66, corresponding to an adiabatic flame temperature of Tadiabat = 2100 K and a thermal power of Pth = 10.5 kW. The resulting flames were monitored using OH* chemiluminescence imaging, showing a significantly reduced flame lift-off height with the novel fuel injector. Major species concentrations and gas temperature downstream of the nozzle exit were measured using 1 dimensional laser Raman spectroscopy. The reconstructed 2 dimensional distribution of mixture fraction clearly demonstrated an enhanced fuel–air mixing and more distributed combustion with the novel injector. Additional evidence of such enhancement was found at the exhaust, with about 10% reduction in NOx emission using the novel injector.
Keywords
Introduction
The anticipated expansion of renewable electricity generation is expected to further improve the economic viability of large-scale hydrogen (H2) production. This development has substantial implications for the energy and aviation sectors, whose long-term decarbonization strategies align with the carbon-neutrality targets articulated under COP26. 1 Owing to the absence of direct carbon emissions from H2 combustion, the integration of H2 into advanced energy-conversion systems has gained significant momentum. A central objective is the realization of combustion systems originally designed for hydrocarbon fuels operating with up to 100% H2 – an ambition already demonstrated by several OEMs.2,3
A successful transition towards H2-fueled gas turbine technology requires a robust understanding of the associated combustion physics. 4 Two fundamental challenges govern H2 operation in practical combustors: (i) the high laminar flame speed, which substantially increases flashback propensity, and (ii) the elevated adiabatic flame temperature, which drives thermal NOx formation and can accelerate material degradation. In response, leading manufacturers have developed micro-mixing–based combustion concepts that promote rapid fuel–air mixing and reduce localized reaction intensities. Among these, the micro-mixing architecture introduced by Kawasaki Heavy Industries has been validated in industrial gas turbines operating with 100% H2,5,6 while Mitsubishi Hitachi Power Systems has demonstrated a low-NOx micro-mixing configuration with up to 30 vol.% hydrogen. 7
The FLOX® 8 combustor technologies have repeatedly shown excellent NOx performance and high fuel flexibility across broad operational regimes.9–11 Although not always operating in a strictly ‘flameless’ regime, these systems exhibit the principal characteristics of flameless oxidation, including substantial dilution with recirculated products, spatially extended reaction zones and markedly suppressed NOx emissions.8,12 The characteristic large recirculation zone stabilizes the reaction zone and contributes to reduced NOx formation by shortening residence times through high momentum jet injection. 13 Ensuring safe and effective fuel–air mixing is particularly critical at elevated preheat temperatures, where flashback susceptibility increases sharply. Consequently, advanced nozzle architectures are required to simultaneously achieve compact reaction zones, low NOx formation and stable operation at 100% H2 fuel loading.
The present study investigates turbulence–chemistry interactions downstream of a confined single-nozzle FLOX® combustor by comparing two fuel-injection configurations operated under identical air Reynolds numbers and thermal loads. OH* chemiluminescence (OH*) 9 and one-dimensional Raman laser spectroscopy12,14 were employed to quantify flame shape, lift-off height (LOH), major species concentrations and mixture fraction (MF) fields for both nozzle designs. Complementary exhaust-gas measurements were conducted to assess NOx formation and overall emissions performance. The resulting dataset provides high-fidelity experimental evidence suitable for the validation and further development of numerical models describing H2 combustion under highly turbulent, strongly diluted conditions.
Experimental setup
Combustor setup
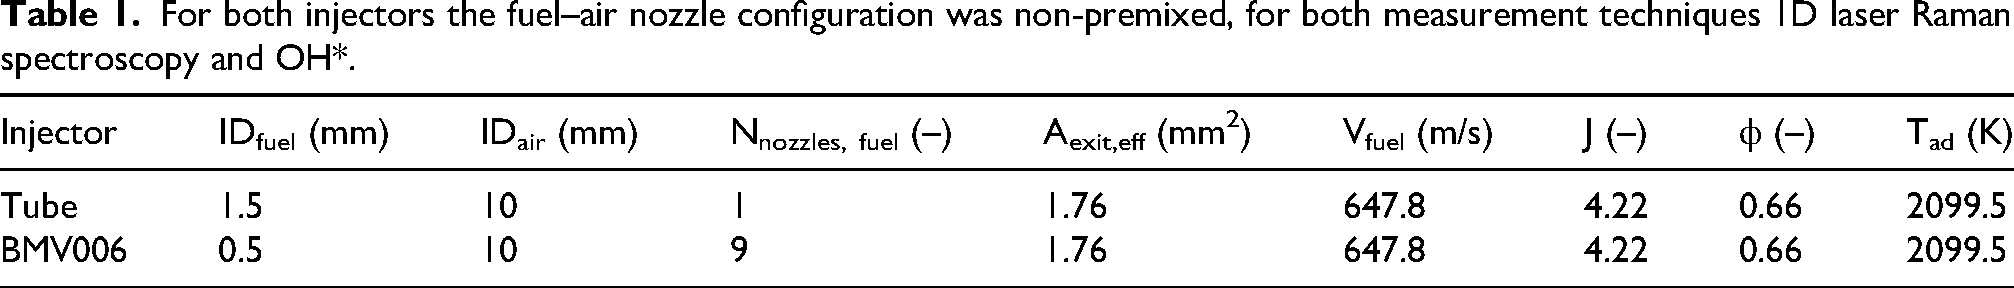
Figure 1 shows the comparison of the two fuel injectors investigated in this work, together with the optical accessible combustion chamber. The conventional fuel injector is shown in Figure 1(b), a stainless-steel tube with an outer diameter (OD) ODfuel = 3 mm and an ID, IDfuel = 1.5 mm, which results in an effective exit cross-section of Aexit,eff = 1.76 mm2. The effective cross-section Aexit,eff is kept constant as a design parameter for the development of new injectors. The latest injector version is called BMV006 and is shown in Figure 1(a). The injector geometry was developed through an iterative, five-stage design process. The initial modification involved reshaping the outer contour of the fuel tube into a lobed configuration to enhance turbulent mixing between the coflowing air and fuel streams. 15 In the subsequent step, the lobed outer contour was retained, but the outlet area was partially closed off, resulting in fuel injection through several small orifices with a diameter of 0.5 mm. This configuration led to a measurable reduction in flame LOH and NOx emissions. In the final stage, the injector design was refined to match the effective cross-sectional area of the conventional reference injector. Achieving this required reducing the number of lobes to three and redistributing the injection orifices uniformly among the remaining arms. The final three-armed shape facilitates the distribution of fuel in radial direction. Additionally, the integral distribution of fuel into nine orifices with a diameter of dinj = 0.5 mm enhances the total fuel jet surface and improves significantly the total turbulent entrainment. The effective cross-section of all orifices is exactly equal to the fuel tube. Therefore, the total bulk exit velocity vexit,fuel = 647.8 m/s of the fuel is equal for both injectors. Furthermore, the bulk air exit velocity is vair = 115 m/s, which results in a Reynolds number of Reair = 24,145 for all measurements. Table 1 delivers a overview of the geometrical and thermodynamic parameters for both injectors. Both fuel nozzles were concentrically mounted inside the air nozzle, and their outlet plane was aligned flush with the outlet of the coflowing air nozzle, as illustrated in Figure 1(c, top). Figure 1(c, bottom) shows a top view of the rectangular cross-section of the combustion chamber, with the air nozzle placed off centre to obtain a pronounced recirculation zone on one side of the air–fuel jet. In order to guarantee the same thermochemical condition, the adiabatic flame temperature (Tadiabatic = 2100 K) and thermal power (Pth = 10.5 kW) are constant for each injector.
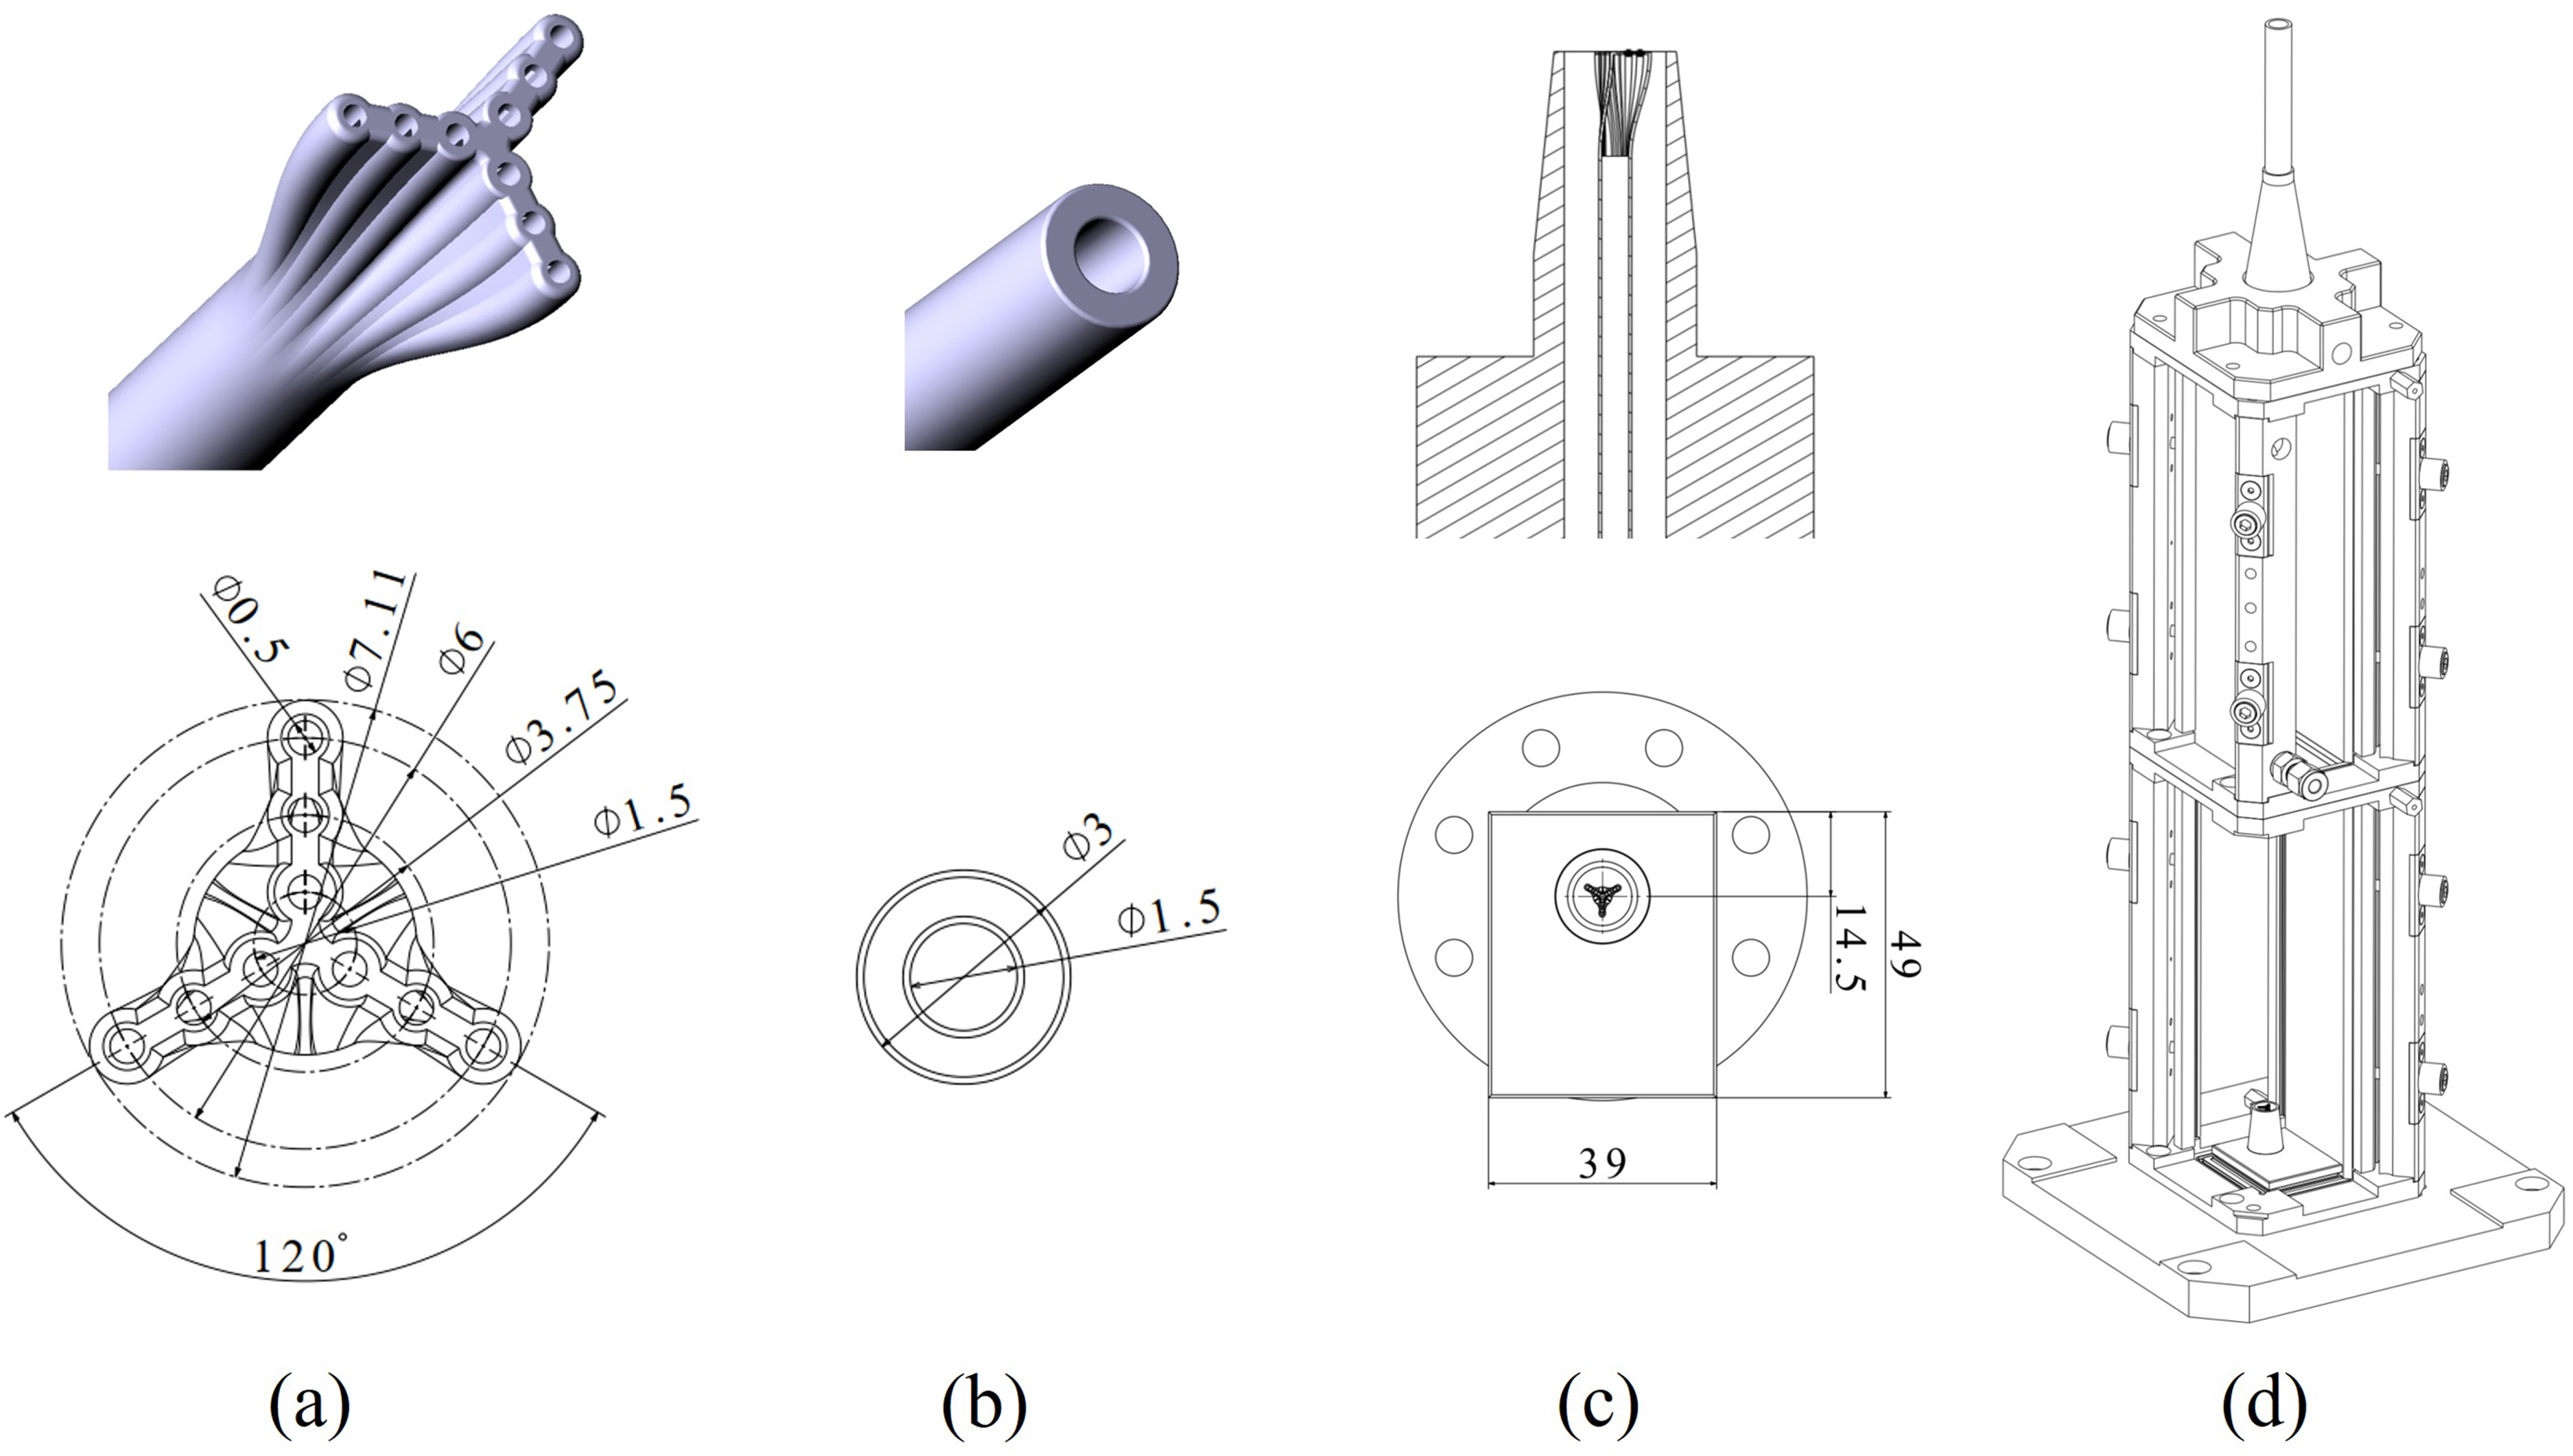
Schematic of the two fuel-nozzle configurations. (a) BMV006 novel injector; (b) fuel tube ID = 1.5 mm; (c) top view cross-section combustion chamber with non-premixed fuel–air nozzle configuration; (d) combustion chamber with exhaust outlet.
The combustion chamber, Figure 1(d), has already been used in previous works9,10 and features a four-sided optical access for optical measurement techniques with water-cooled posts. The combustor is mounted on a three-axis translation stage. This configuration facilitates the precise positioning of the experimental setup in relation to the stationary optical setup. The modular design of the chamber allows to vary the total length of the combustion chamber. To suppress recirculation of ambient air into the combustion chamber, a converging nozzle was attached to the outlet of the combustion chamber. The exhaust gas sample was extracted at the contraction outlet of the combustion chamber. At the same height, the exhaust gas temperature, Texhaust,avg = 1100 K, was measured by a B-type thermocouple. The exhaust gas temperature as well as the measured volumetric oxygen content in the flue gas, O2 = 6 vol.%, at ϕ = 0.66, is used as an indicator for a stable flame condition prior to the optical measurements. For evaluating the flue gas composition, the thermochemical properties of species involved were obtained from the thermochemical data of GRI 3.0.
For all examined flame types and their respective scenarios, air preheating was conducted using an inline heater, with the preheated air (Tpre = 573 K) then delivered to the air plenum for temperature measurement via a thermocouple. The air supply was insulated to minimize thermal losses between the heating cartridge and the burner.
Optical diagnostics
1 dimensional Raman laser spectroscopy
Laser Raman scattering was employed to conduct one-dimensional quantitative measurements of the concentration of burned and unburned major species (O2, H2, H2O and N2) as well as temperature. The excitation laser is a custom-made, Continuum Agilite, which consists of a modulated and amplified section of a Continuous Wave laser. The amplification of the modulated laser segment was achieved through three Nd:YAG amplifier stages (5 mm, 6 mm and 12 mm) with a flash lamp repetition rate of 10 Hz. Consequently, the modulated beam, with a pulse duration of τpulse = 1 µs, exhibited an energy of Epulse = 1.3 J/pulse at λ = 532 nm. The temporal energy distribution of the laser pulse resembled to a classical rectangular pulse shape. As illustrated in Figure 2, the beam underwent redirection via a periscope before being expanded through a Galilei telescope. Employing a planno-convex spherical lens (f = 175 mm), the beam waist has a diameter of 200 µm in its focus. Laser energy measurements were conducted using two pyroelectric detectors (Gentec-EO QE50LP-H-MB-QED-D0), one positioned in front of the combustion chamber and the other one behind it. Raman scattering from species within the 8 mm sample length was focused by an apochromatic lens system (feff = 600 mm, diameter = 150 mm; f/4) and directed into the entrance slit of a spectrograph (Acton Research SpectraPro 300i; f = 300 mm; f/4, 420 lines/mm, slit: 1 mm × 14 mm). A notch filter (λ = 532 nm) placed in front of the entrance slit removed the surface-scattered light. Additionally, a polarizer is mounted in front of the spectrograph to remove the unpolarized surface scattering from the detected signal. An ICCD camera (Princeton Instruments PI-Max; 1340 × 1300 pixels, 16 Bit/pixel, gate time = 1000 µs) was positioned at the exit aperture of the spectrograph. Pixel binning to superpixels significantly reduced noise, resulting in a final digital resolution of a single-shot image at 268 × 28 superpixels (spectral resolution: 0.294 mm per superpixel). For each measurement position, 300 single-shot spectra were recorded with a camera gain factor of 200. In this Raman setup, no optical or mechanical shutter was used; the gating was achieved solely through the gating of the camera's intensifier. To enhance the signal-to-noise ratio, each individual single-shot spectrum necessitates background correction. To achieve this, a λ/2 plate was employed to modify the polarization of the incident laser beam. This modification proves advantageous in diminishing the Raman signal present in the background image. During the background image recording, it was necessary to keep the laser light on because a strong broad-band green scattered light is always present in the Raman spectrum and cannot be suppressed by the notch filter. This background originates from laser light scattered by surface contamination on windows and metal posts, as well as from laser interference.
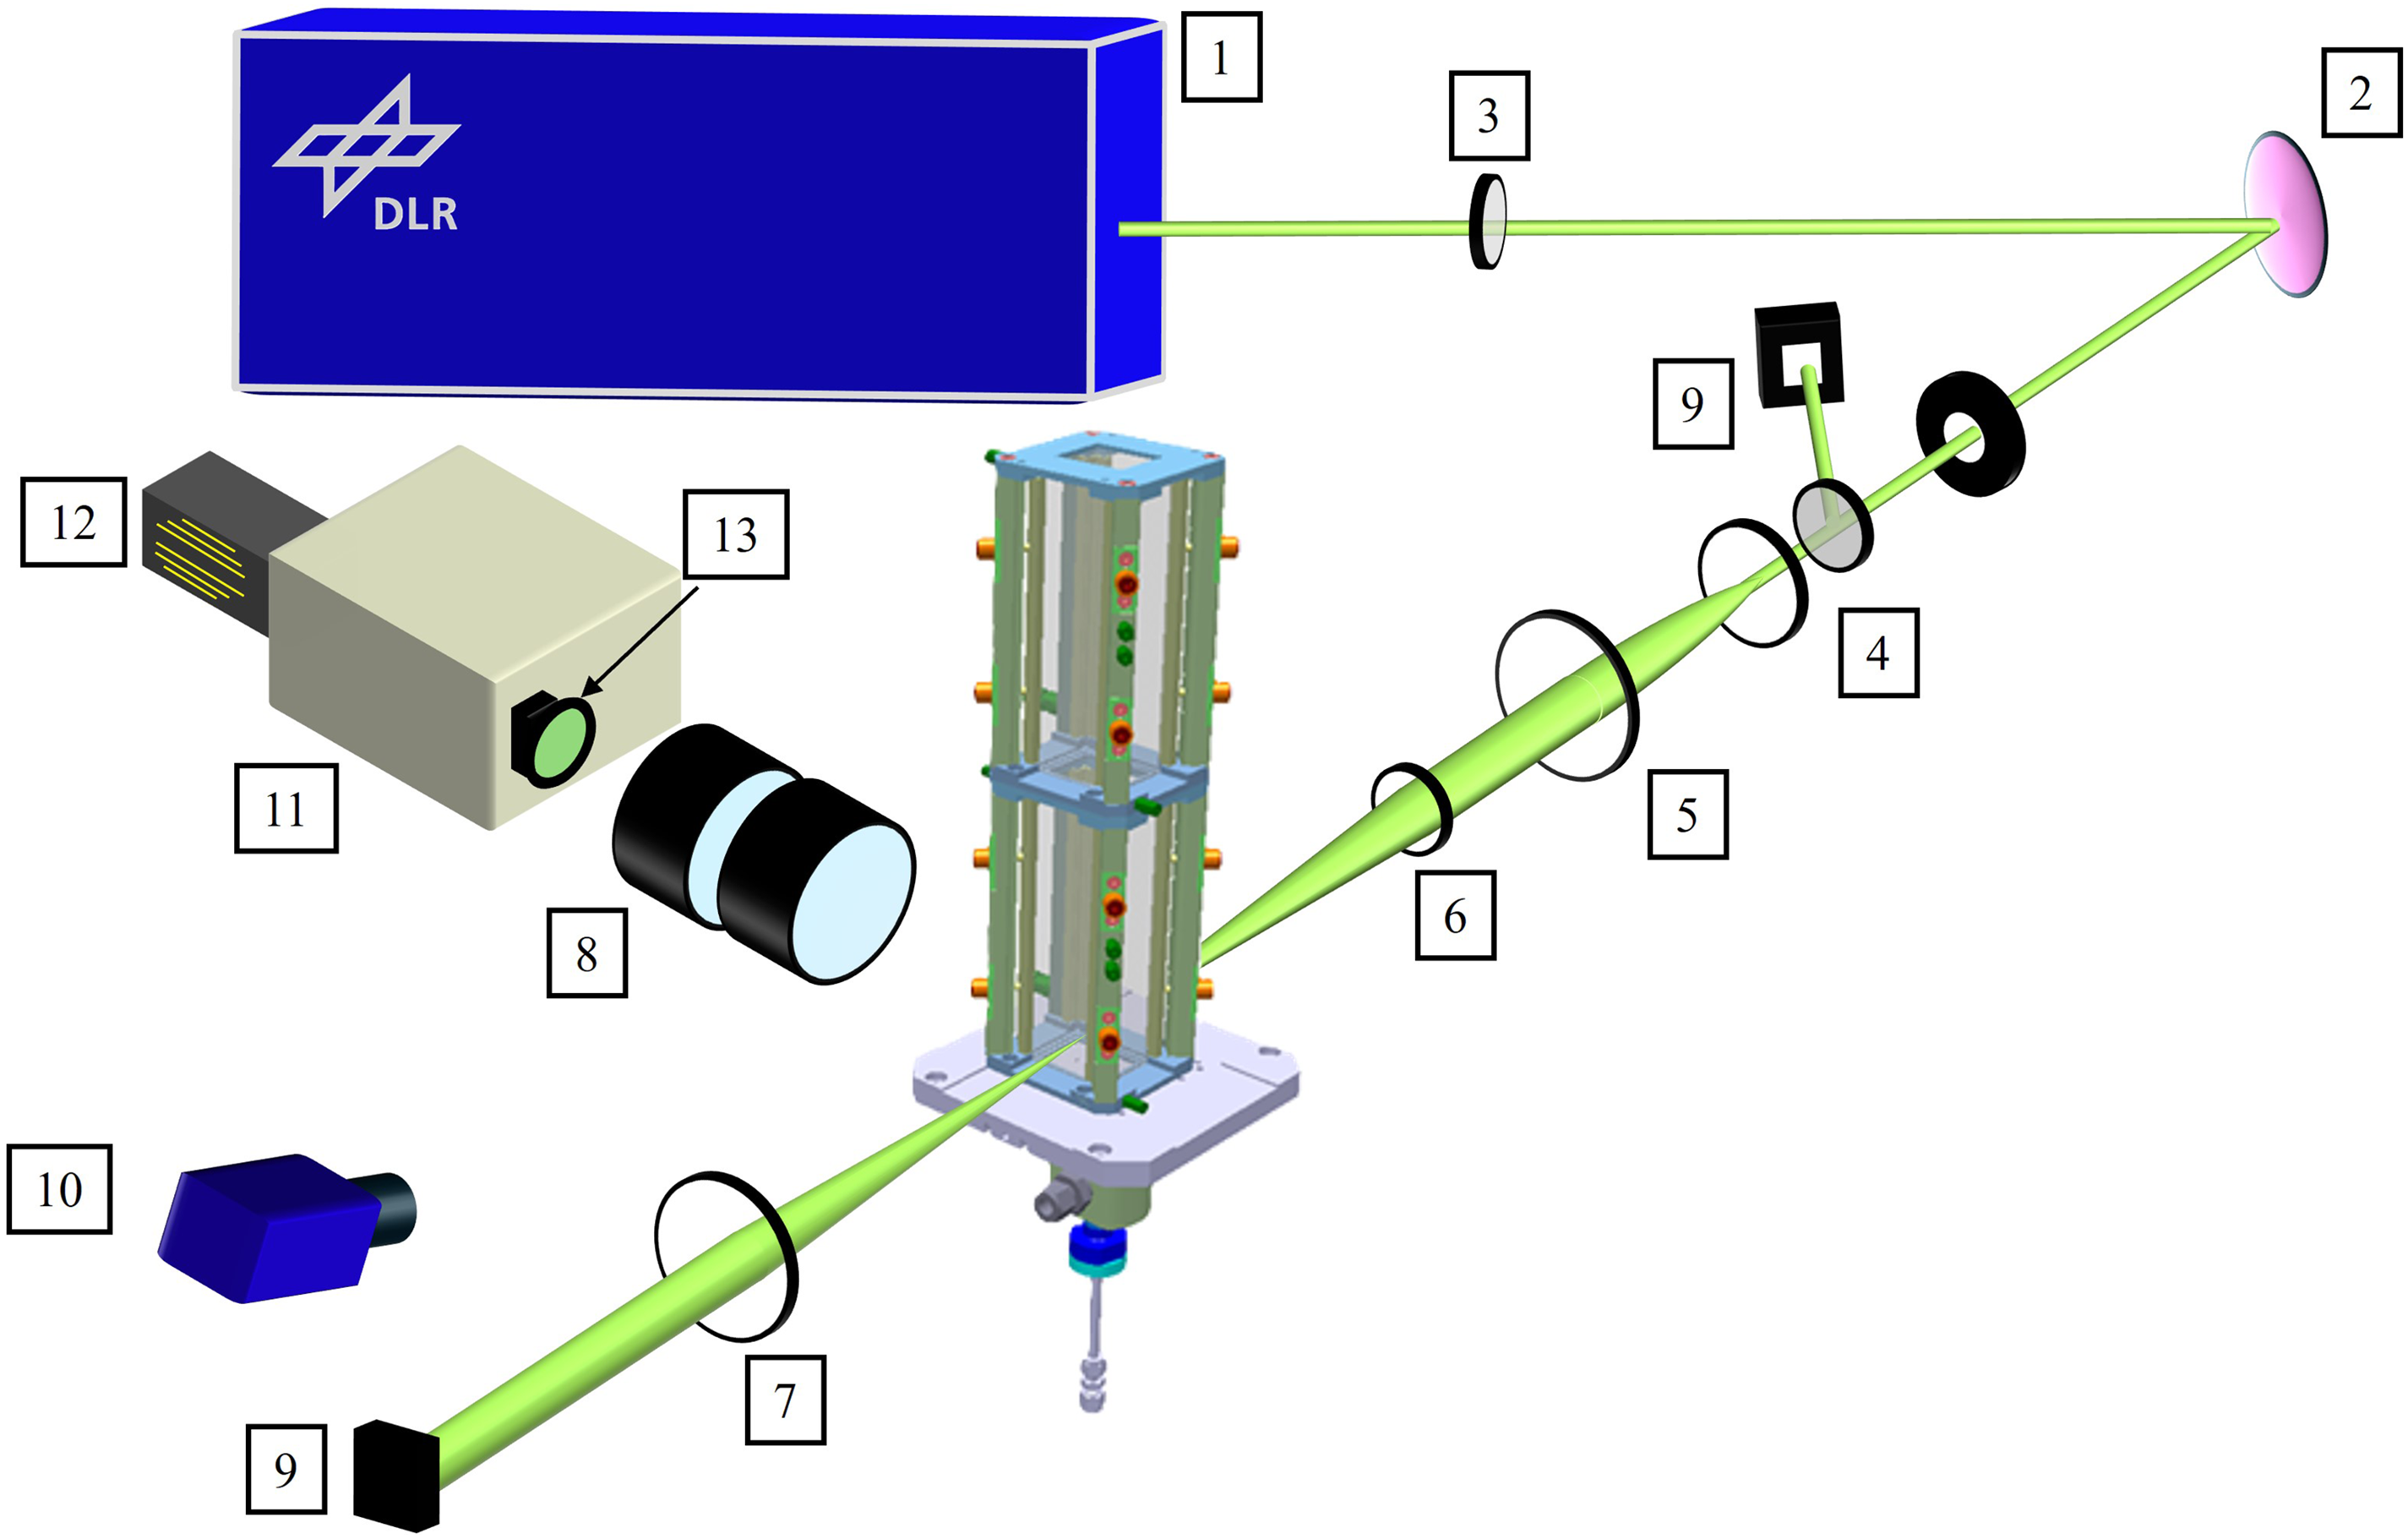
Experimental setup for the 1D Raman laser spectroscopy. 1 = Nd:YAG laser (λ = 532 nm); 2 = Mirror; 3 = λ/2 plate; 4 = plano concave lens; 5 = biconvex lens; 6 = plan convex lens; 7 = plan convex lens; 8 = achromatic lens; 9 = energy detector; 10 = OH* ICCD camera with bandpass filter (λ = 310 nm); 11 = spectrograph; 12 = ICCD camera; 13 = notch filter (λ = 532 nm).
OH* chemiluminescence
OH* chemiluminescence was employed as an imaging technique for both injectors to capture flame shape and LOH. The experimental configuration comprised an ICCD camera (LaVision Imager Intenser), an image relay optics device, a Cerco UV-lens (f = 45 mm with f/1.8) and a bandpass filter centred at λ = 310 nm. With a field of view measuring 384 × 290 mm2 and a resulting resolution of [3.8 and 4.3] px/mm, 300 images were acquired at an image rate of 10 Hz for each measurement series. The camera gain was maintained at a constant value of 70.
Methodology
1D laser Raman spectroscopy
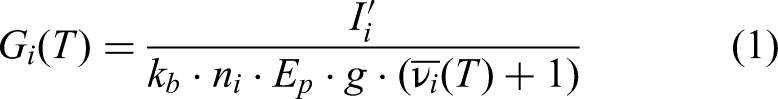
Temperature-dependent calibration coefficients, G
i
, see Eq. 1, for species signals were determined through two distinct methodologies. For temperatures up to 800 K, gases (air, CO, CO2, CH4, H2) were heated using a gas heater, and the corresponding spectra were measured. For the broader temperature range of 1200 K–2100 K, laminar methane/air and hydrogen/air flames at various equivalence ratios were utilized. The optical setup has not been changed between the calibration and measurements. Therefore, a McKenna burner was used; the predefined flames, regarding their major species compositions, have been measured beforehand with Coherent Anti-Stokes Raman spectroscopy to achieve information about temperature in a height of 10 mm above the burner.
16
The calibration accuracy for each species and temperature is given in Table 2. The reported accuracy is referenced to the theoretical values for each species at the measured temperature, as determined by CARS. For estimating the measurement precision, daily reference air measurements were considered. Since the preheated air was maintained at 573 K, it serves as a reliable daily reference for precision assessment. The resulting precision is approximately 7%.
For both injectors the fuel–air nozzle configuration was non-premixed, for both measurement techniques 1D laser Raman spectroscopy and OH*.
Relative standard deviations of each measured species; N2, O2, H2 and H2O and temperature and estimated systematic uncertainties for the calibration flames.
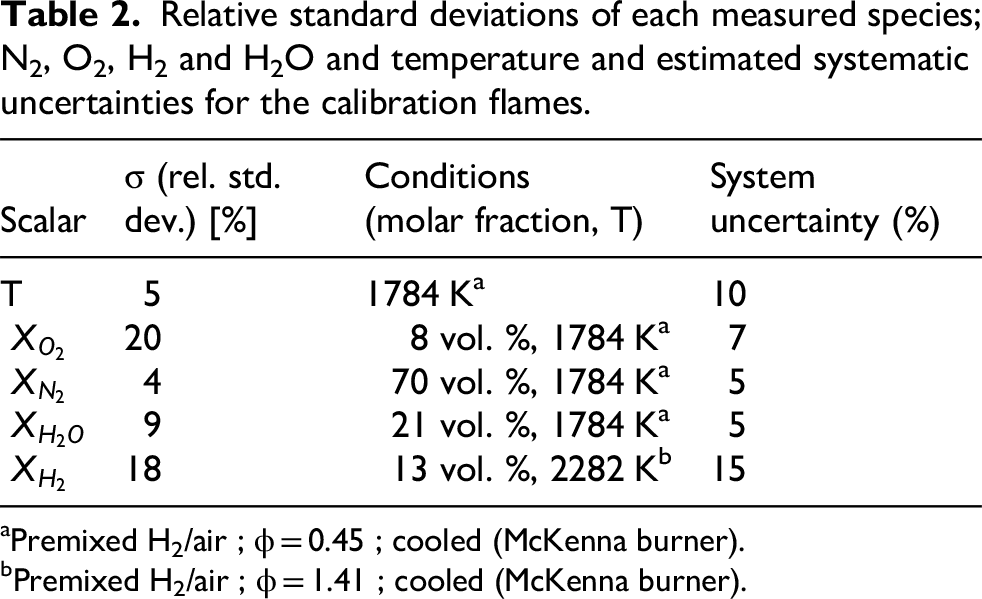
Premixed H2/air ; ϕ = 0.45 ; cooled (McKenna burner).
Premixed H2/air ; ϕ = 1.41 ; cooled (McKenna burner).
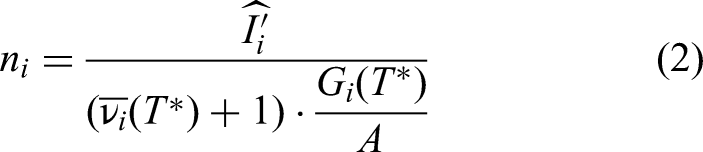
Here, I^
i
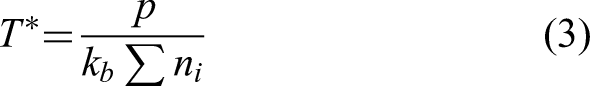
′ is the energy-normalized and integrated channel intensity of a species, and νi(T ∗) is the temperature-dependent average vibration quantum number. The temperature is estimated by using the ideal gas law, with p as ambient pressure, Σni the accumulated species number and the Boltzmann constant k
b
.
The convergence criterion for temperature iteration was set at a minimum deviation of dT = 1 K. Employing the corresponding calibration coefficients, species number densities, as well as the resulting MF within the combustion chamber, could be calculated. The MF is proposed by Bilger
17
and shown in eq. 4.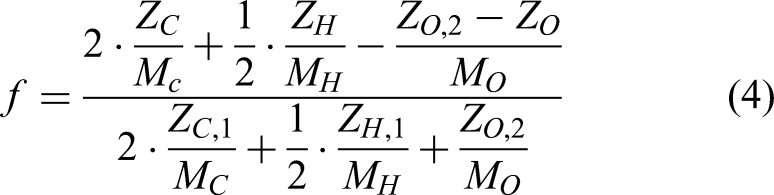
Using ZC/H/O to denote the element mass fraction (C = carbon, H = hydrogen, O = oxygen), with indices 2 representing the oxidizer and 1 representing the fuel. The data acquisition occurred at 18 positions along the z-direction downstream of the nozzle exit, encompassing a one-dimensional volume of 8 mm length. At each of these 18 positions, the measurement volume was traversed within the x-y plane from the nozzle centre towards ±3 mm in both directions. Figure 3 illustrates the measurement positions both across and downstream of the nozzle exit. The step width in the initial 10 mm of the z-direction approximates 1.32 mm, with subsequent increments of 2, 5 and 10 mm further downstream.
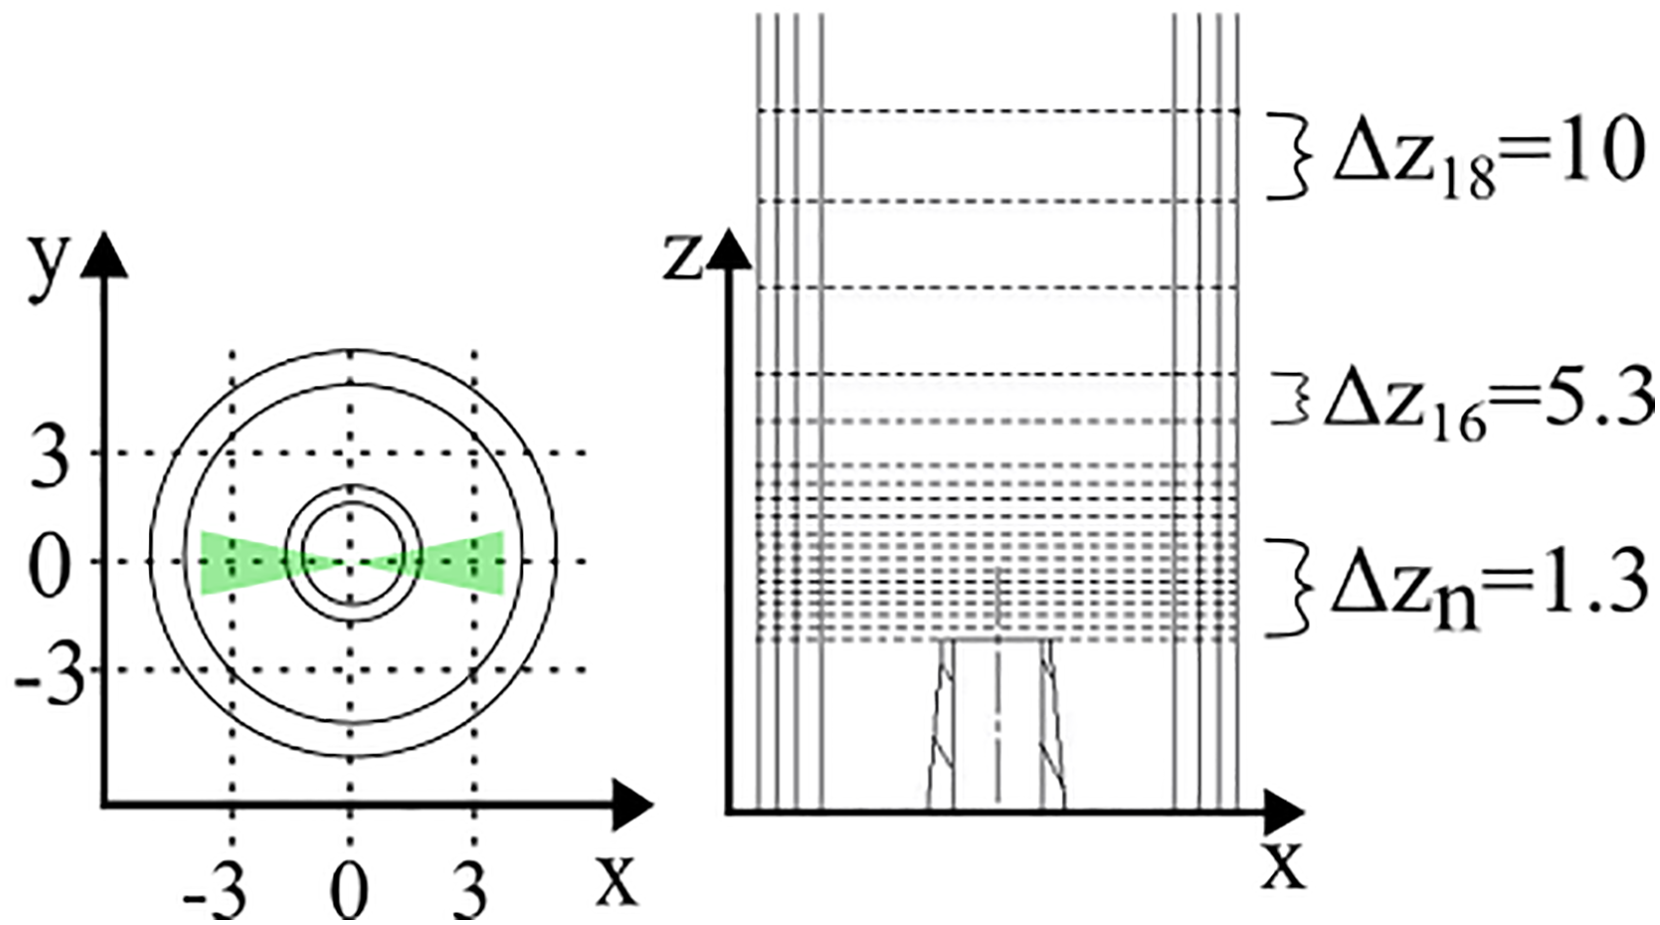
Measurement positions across the nozzle for 1D laser Raman spectroscopy.
The single-shot data underwent Reynolds and Favre averaging to prepare it for evaluation of Computational Fluid Dynamics simulations.
In the post-processing phase, both datasets, Reynolds and Favre averaged, were utilized for the two-dimensional reconstruction of the analysed data. As previously stated, the data was gathered along a one-dimensional volume traversing the nozzle. During the reconstruction process, each data point was assigned relative coordinates in the x-, y- and z-directions. The superpixel line 14, corresponding to the centre of the measurement volume, served as the reference for the relative position in the x-direction. Subsequently, the relative x-coordinates were computed using the spatial resolution and the deviation of each individual superpixel from the reference superpixel line 14. This process yielded a set of 28 data points in the x-direction for each measurement position. The data points for the three measurements in the x-direction were then sorted in ascending order based on their x-values, resulting in a total of 3 × 28 = 84 data points in the x-direction at a given z- and y-direction. This sorting procedure was applied for all measurement positions in the z- and y-directions. The 2 dimensional reconstruction was performed for the x-z plane, followed by interpolation onto a grid size of 240 × 240 pixels. The relative error stemming from the interpolation was found to be less than 4% of the absolute species mass fraction and was evaluated by a leave-one-out cross-validation approach. The mean concentration of each major species, N2, O2, H2 and H2O is shown in Figure 4 for both injector concepts. The standard deviation (SD) is based on the single-shot images as illustrated in Figure 5 for both injectors, respectively.
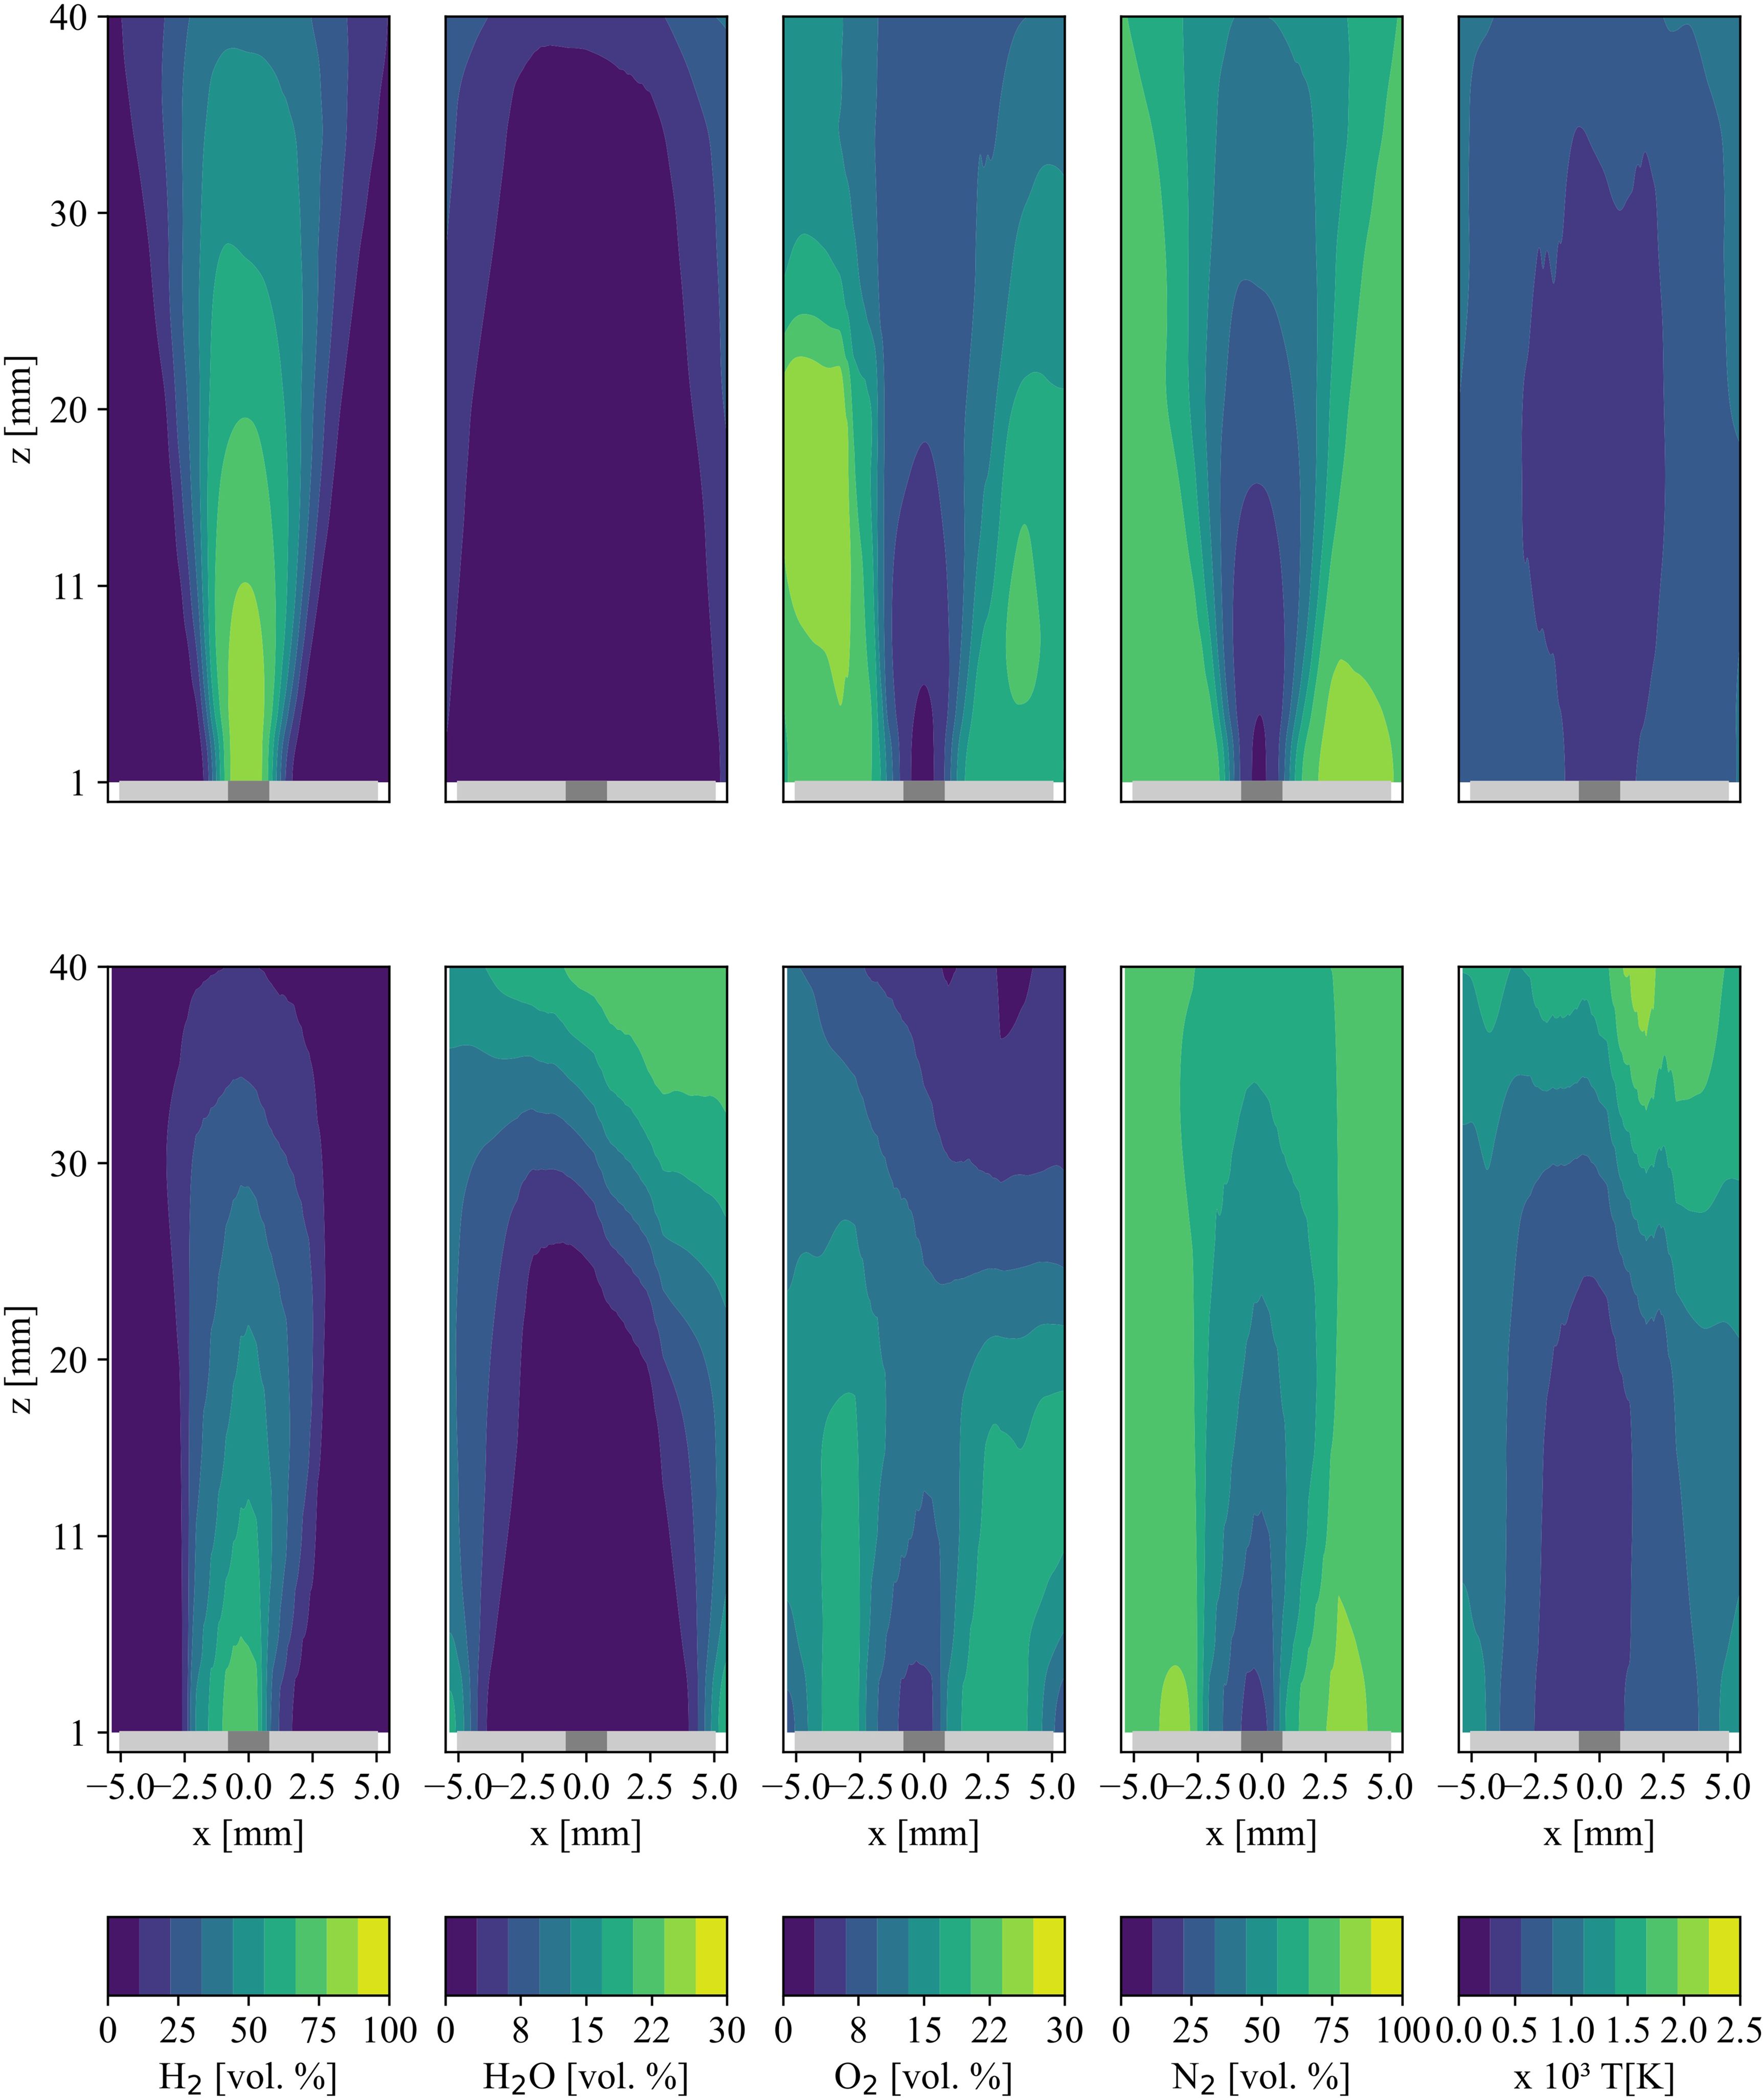
Reynolds averaged absolute concentration of the major species H2, N2, O2 and H2O based on single shot images. Top row: results from the fuel tube; bottom row: results from the novel injector BMV006.
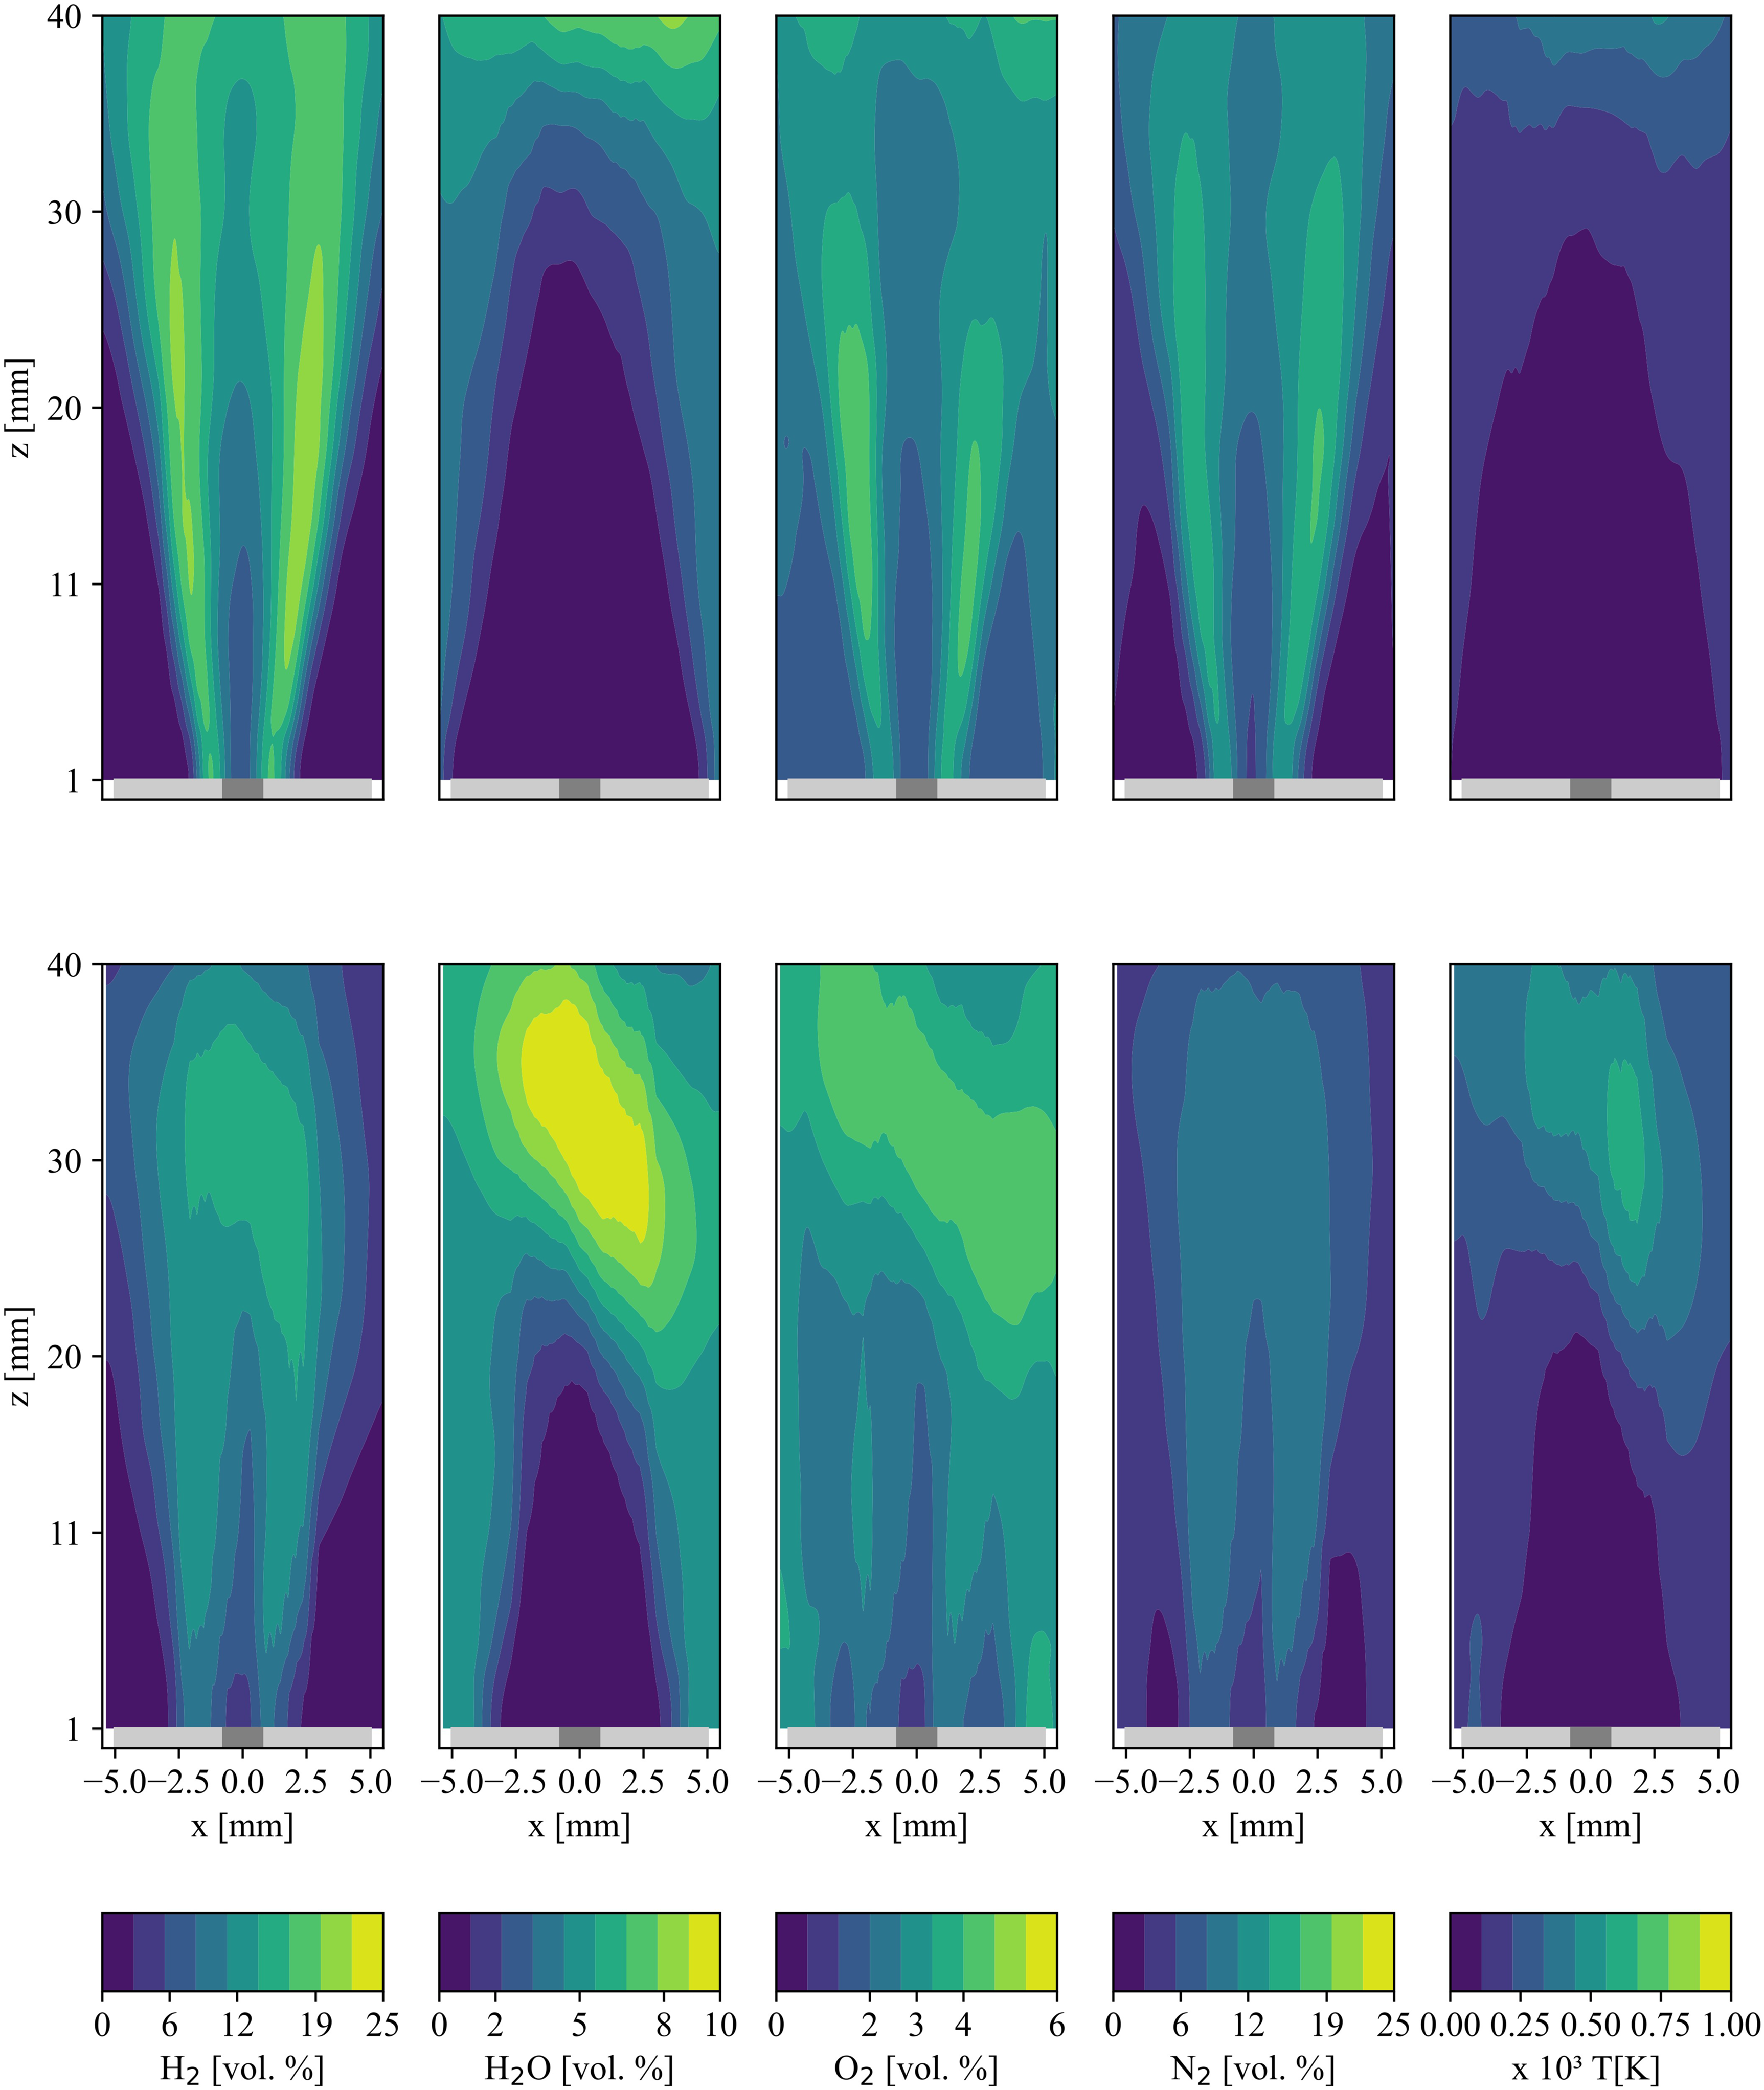
Standard deviation for concentration of the major species H2, N2, O2 and H2O based on single shot images. Top row: results from the fuel tube; bottom row: results from the novel injector BMV006.
OH* chemiluminescence
The raw images of the OH* emission for both injectors underwent post-processing procedures, including averaging and binarization for the determination of LOH. The individual images were cropped to a region of interest measuring 677 × 178 pixels and scaled using a factor of 3.83 pixels per millimetre for the conventional injector and 4.25 pixel per millimetre for the novel injector. Subsequently, background correction was performed using a Gaussian mixture-based segmentation algorithm, followed by normalization to the maximum value within each image. The resultant images were then averaged across the series and subjected to smoothing using a Gaussian median filter with a width parameter of σ = 5 pixels. The smoothed mean image was subsequently binarized using a threshold value equivalent to 40% of the normalized OH* mean intensity. The resulting flame region was delineated and stored in an array. In the final step of post-processing, the LOH was computed, defined as the distance between the nozzle exit and the lower flame edge. The uncertainty of the LOH was assessed through a two-parameter sensitivity analysis involving variations in pixel size (±10%) and threshold value (±20%). A two-dimensional heat map was generated to visualize the combined influence of both parameters. The analysis showed sensitivities of approximately 40% for pixel size and 26% for the threshold.
Results
1D laser Raman spectroscopy
Quantitative 1D laser Raman spectroscopy
The quantitative comparison between the two injector concepts was carried out by measuring major species concentrations in the flow field downstream of the nozzle exit. Figure 4 illustrates the 2D reconstructed average mole fraction distributions for H2, N2, O2 and H2O. The absolute mean volumetric values are plotted against the radial direction across the nozzle rim (inner diameter IDair nozzle = 10 mm, outer diameter ODair nozzle = 12 mm) and downstream of the nozzle exit. The upper row in Figure 4 visualizes the results for the conventional injector, the fuel tube. The lower row shows the results for the novel injector BMV006. Both injectors exhibit significantly different mixing behaviour. It is important to mention that flow conditions, like the momentum ratio between air and fuel flow, were kept constant over all measurements.
In the first column, the H2 concentration is depicted, considering the absolute volumetric value. The fuel jet exhibits a diameter of 1.5 mm right above the nozzle exit at z = 1 mm, which is equal to the ID of the conventional injector. The first measurement position had to be chosen 1 mm downstream, to prevent the beam of impinge upon the nozzle, resulting in light scattering phenomena. Consequently, this scattering effect creates pronounced noise within the Raman signal. For the novel injector, the H2 content is about 70 vol.%, indicating that the fuel jet has already mixed with the air coflow. Additionally, the H2 content decreases rapidly within a distance of 20 mm downstream the exit.
For the mean O2 concentration, it is evident that the mixing for the novel injector is significantly improved. The enhanced radial mixing between the oxidizer and fuel can be shown based on the O2 and N2 concentrations. Since O2 is already mixed with H2 at z = 11 mm, the concentrations downstream the nozzle are below the typical 21 vol.% of air. At a location of z = 30 mm and further downstream of that, O2 values are about 5%, which corresponds to the measured value of O2 in the flue gases at the given equivalence ratio of ϕ = 0.66. In general, the two streams of oxidizer and fuel mix quickly for the novel fuel injector. The O2 values for the fuel tube show a fuel–air interface until z = 20 mm. Obviously, the radial mixing of the two streams occurs considerably further downstream. Similarly, the same mixing behaviour can be observed with nitrogen.
The theoretical volumetric amount of water for a hydrogen-air flame at an equivalence ratio of ϕ = 0.66 is about 25 vol.%. The measured peak concentrations for H2O show similar values for both injectors. Notably, considerable concentrations (H2O = 15 vol.%) were measured for the new injector downstream of a height of z = 30 mm above the burner. This is an indication of the reduced flame LOH for the new injector. Whereas the H2O concentration for the fuel tube at this height is below 5% within the range of the fuel tube exit at x = ±0.75 mm. The observed asymmetry in the H2O distribution at x = 5 mm and z = 30–40 mm is primarily attributed to the inherent asymmetry in the novel injector design, the slight off-axis positioning of the fuel nozzle relative to the air nozzle and minor dimensional deviations arising from manufacturing tolerances. Downstream of the nozzle, the temperature distribution differs significantly between the conventional fuel tube and the novel BMV006 injector. Due to its reduced LOH, the BMV006 exhibits temperatures of approximately T = 2000 K at z = 35 mm.
Figure 5 illustrates the standard deviation for the novel injector (bottom row) and the regular fuel pipe (top row) regarding major species, namely H2, N2, O2 and H2O. The conventional fuel tube injector exhibits weak mixing close to the nozzle, which is indicated by a H2 SD value equal zero, at x = 0. Furthermore, the fuel–air mixing in the first 20 mm in z-direction is really weak. From the SD of H2, as shown in Figure 5, top row, a subtle mixing layer can be detected on both sides of the fuel jet at x = ±1 mm. The value of about 22 vol.% in the H2 SD and a strong radial gradient reveal a narrow mixing layer of fuel and oxidizer at 25 mm ≥ z ≥ 1 mm. At z locations z > 30 mm, the fuel jet shows a wider shear layer with an SD value of H2 equal to 19 vol.%. This is leading to the assumption that mixing of fuel and oxidizer has still not sufficiently occurred across the entire air nozzle.
The SD of H2 for the new injector depicts a homogeneous mixing of fuel and oxidizer in the proximity of the nozzle exit. In the region of z = 1 mm to 30 mm, the mixing layer extends across the entire diameter of the coflow air nozzle from x = −5 to x = 5 mm. In this region, the H2 SD shows a stronger and distributed mixing layer. The SD for H2 is almost equal to zero at the centre, which indicates a lack of mixing for fuel and oxidizer in this region. However, the values for SD are increasing in radial direction, which reveals an increasing fluctuation in the shot-to-shot H2 concentration and indicates the mixing layer of fuel and air. The low radial gradient of SD indicates homogeneous and distributed mixing behaviour for the novel injector. This is due to the enhanced radial distribution of H2 leaving the injector. At z locations greater than 30 mm, the area of an equal SD of 15 vol.% expands across the air nozzle diameter, which indicates the flame position. Eventually, the fuel jet core (x = ±1.5 mm), with almost zero values of SD, completely disappears at z = 20 mm. The SD for N2 displays a similar mixing pattern to that discussed for H2 for the conventional injector, indicative of the described mixing layer between fuel and oxidizer. The BMV006 injector displays SD values for N2, around 12 vol.%, inside the shear layer. Similar to the O2 SD of the novel injector, where no strong gradients in the radial direction are present. Whereas the fuel tube has strong gradients for O2 SD values in radial and axial direction compared to the BMV006 injector. Here, a secondary shear layer between the oxidizer jet and the hot burned gas inside the combustion chamber is discernible at x = ±5 mm. This becomes more significant in the SD for H2O at x = ±5 mm, where the interface of air jet and the surrounding exhaust gas is located.
Finally, the SD for H2O provides further insight into the flame LOH, see Figure 8, with fluctuations in H2O concentration corresponding to the lower flame tip position. For the BMV injector, an SD value of >10 vol.% correlates with the onset of the averaged value of H2O at z > 20 mm, while the fuel tube shows a less intense values of SD further downstream at z = 40 mm. These observations align well with the SD of the temperature. In the case of the BMV006 injector, regions exhibiting SD values of approximately 750 K coincide with the flame zone and the location of peak SD in H2O. Conversely, the conventional injector displays low SD values in the downstream region beyond the nozzle exit.
Evaluation of MF
In this section, the state of mixing is assessed using the MF as defined by Bilger. 17 The MF quantifies the fuel mass fraction in the mixture relative to the oxidizer (in this case, air), considering only the species participating in the combustion process. Inert gases such as N2, which do not take part in the reaction, are excluded from the calculation. A value of f = 1 corresponds to pure fuel, while f = 0 represents pure oxidizer. The stoichiometric mixture, which depends on the fuel composition, is achieved when the MF equals the stoichiometric MF – for hydrogen, this is defined as fst=0.0284.
For non-premixed hydrogen flames, the MF is a particularly useful variable because it accounts for both molecular diffusion and turbulent mixing.
Figure 6 shows the MF distribution for both injectors. The white contour indicates the stoichiometric MF; regions where MF exceeds fst are fuel-rich. In the right-hand plot, the MF distribution for the novel injector is shown, with a maximum value of fmax=0.30. Close to the nozzle exit, the hydrogen remains largely unmixed with the coflowing air, resulting in high MF values. Further downstream, the MF decreases, indicating rapid and efficient fuel-oxidizer mixing within the first 20 mm downstream of the nozzle. 17
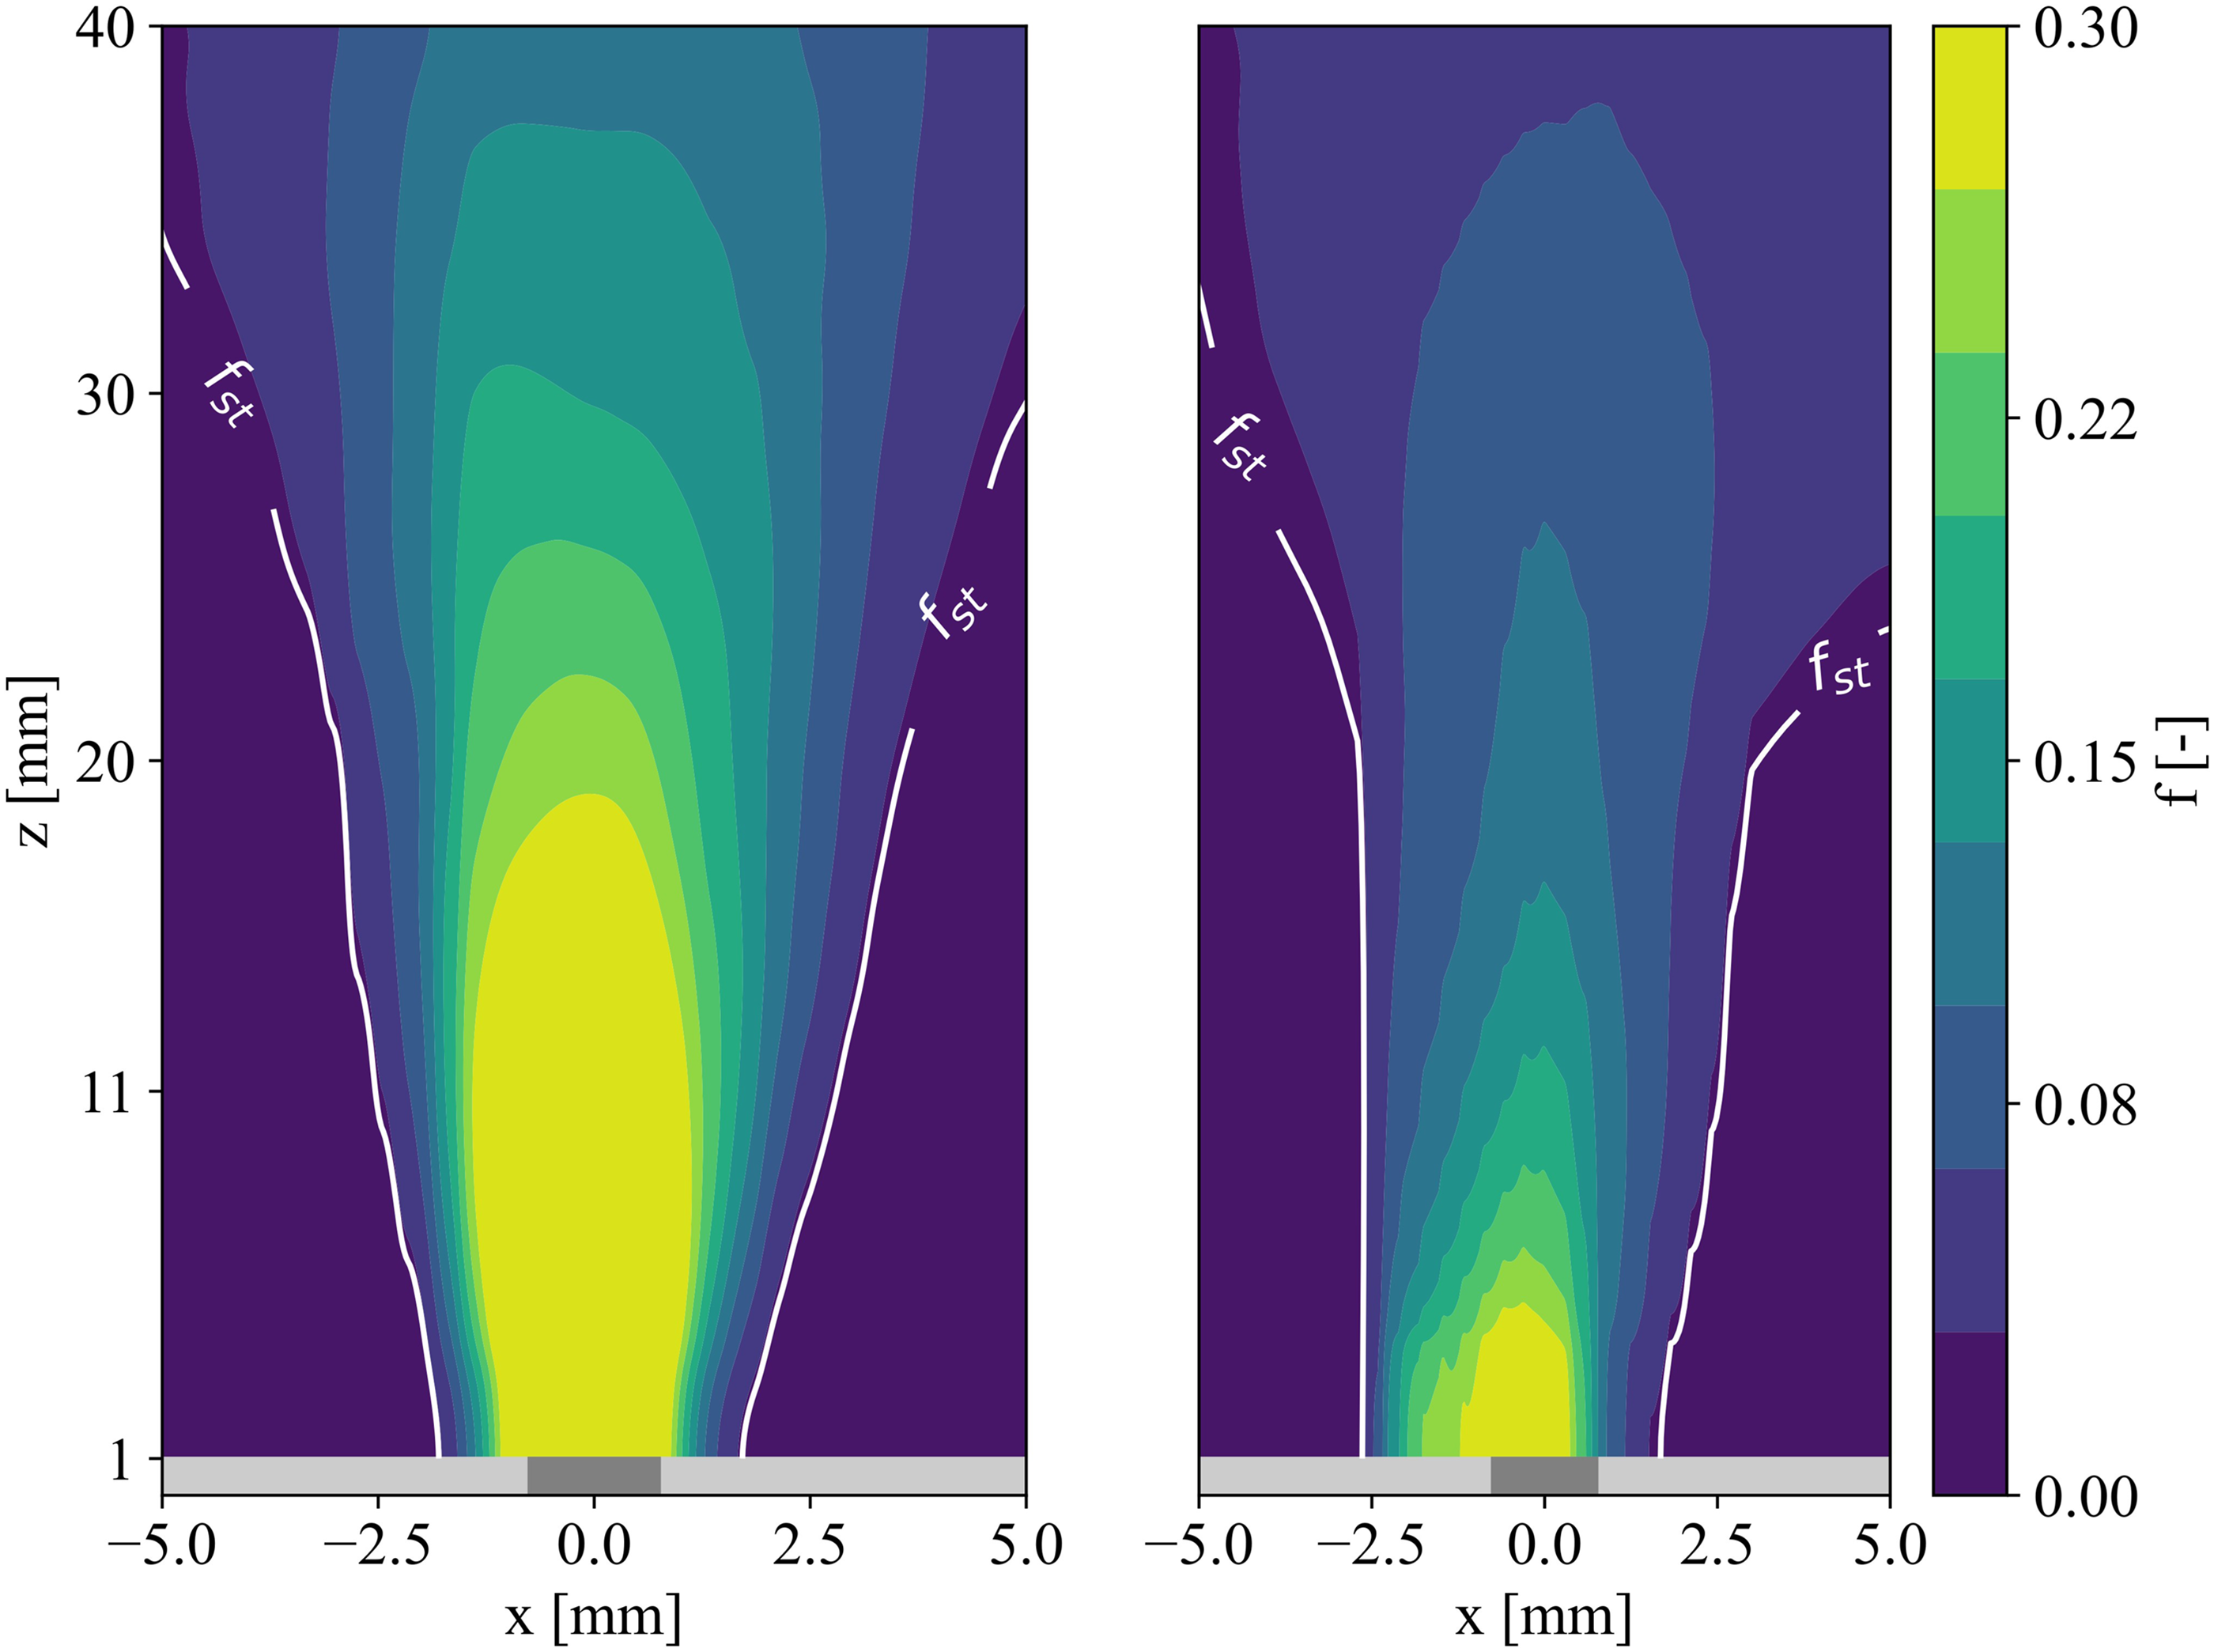
Visualization of the mixture fraction (MF) proposed by Bilger. The left plot shows the MF for the fuel tube. The right plot shows the MF for BMV006. The white contour visualizes the stoichiometric MF for hydrogen, fst = 0.0284.
The radial gradient of MF near the nozzle reveals a sharp separation between fuel and oxidizer. Beyond z = 11 mm, this gradient becomes more uniform in both the radial and axial directions. However, the stoichiometric contour begins to expand outwards asymmetrically, which is attributed to the orientation and outer geometry of the novel injector. At z > 30 mm, the contour diverges more rapidly, likely due to the flame's position.
Notably, the injector is not aligned coaxially within the air nozzle because of its star-shaped design. As a result, symmetry in the MF distribution is shifted from the nozzle centreline at x = 0 mm to approximately x = −1 mm.
In the left-hand plot of Figure 6, the MF distribution for the conventional fuel tube is presented. For better comparison, MF values exceeding f = 0.3 were clipped. The maximum MF value reaches approximately 1 near the nozzle exit, indicating a nearly unmixed fuel jet. The jet remains clearly distinguishable even at larger downstream positions (e.g. z = 30 mm) and exhibits a greater radial expansion compared to the novel injector.
At downstream locations beyond z = 25 mm, the expansion of the stoichiometric contour becomes more pronounced. Although divergence of the stoichiometric contour is already noticeable at lower positions, the MF remains relatively high. Remarkably, even at the furthest measured position (z = 40 mm), the MF is still approximately f = 0.22, highlighting the slower mixing behaviour of the conventional injector.
Investigation of turbulence–chemistry interaction
This section provides a more detailed insight into the mixing of fuel and oxidizer. For this purpose, scatter plots of the species H2 and O2 across the nozzle diameter at several downstream positions are illustrated in Figure 7. Each dot represents a single shot value at a specific location within the measurement volume. The bluish dots indicate the nozzle centre region, where the fuel jet develops, while the reddish and slightly purple dots mark the coflow area. This geometrical colour map supports interpreting the results and understanding the radial mixing composition at the respective downstream positions. In Figure 7, the top row shows the results for the novel fuel injector, whereas the bottom row depicts the compositions for the reference case. The black line represents the reference, calculated under equilibrium conditions using the commercial software GasEq. 18
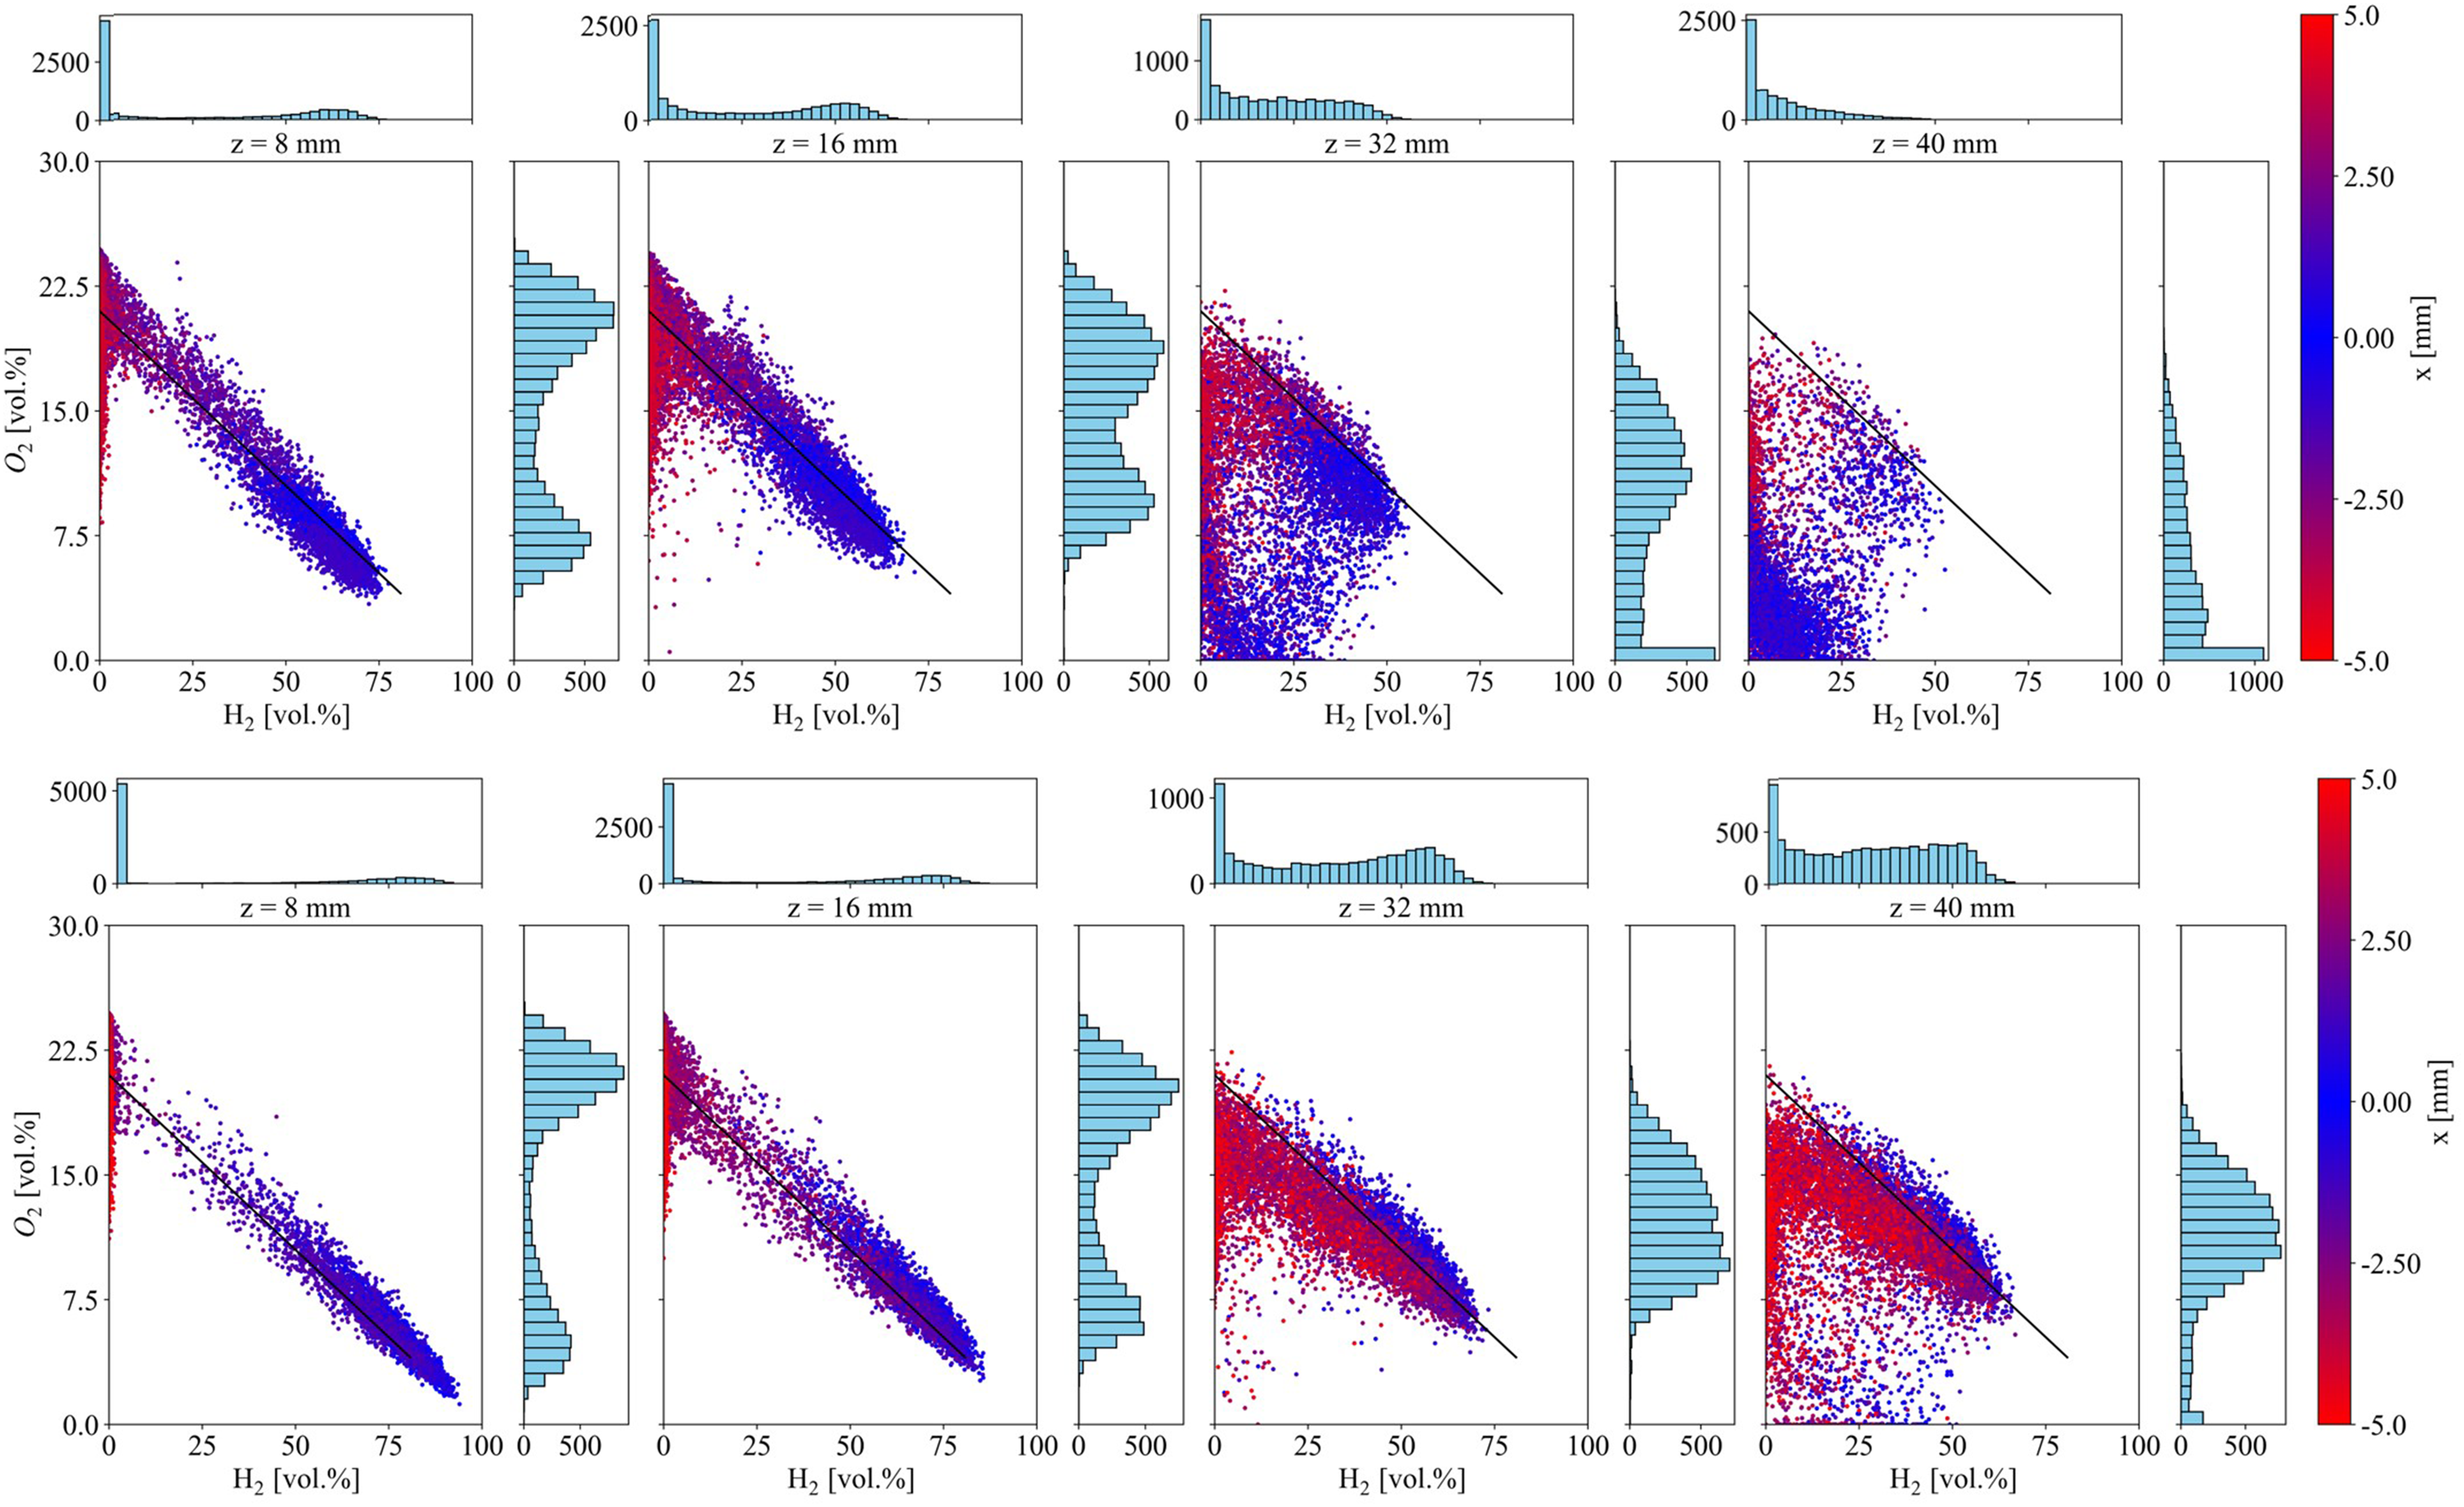
Scatter plots of H2 and O2 concentrations from single-shot measurements across the nozzle diameter at four downstream positions. The upper row shows data points for the novel BMV006 injector, while the bottom row displays results for the conventional injector. The black line illustrates the equilibrium distribution of both species.
At the first downstream position, z = 8 mm, both injectors exhibit a bimodal distribution in O2 concentration, as shown in the histogram. The BMV injector has slightly lower H2 concentrations in the fuel jet region (−1.5 < x < 1.5) at around 70 vol.%, with an O2 concentration of less than 7.5 vol.%. In contrast, the fuel tube injector shows less fuel–air mixing, as evidenced by the histograms for H2 and O2. The O2 histogram for the BMV injector shows a broader distribution between the two peaks, indicating a radial mixing of H2 and the entrainment of product H2O in the coflowing air. This is also reflected in the H2 histogram, where most values are at H2 = 0%, while O2 is below 20.8 vol.%. For the peak in the O2 histogram at 20.8 vol.%, values slightly exceed the theoretical oxygen content in air. This deviation, observed for both injectors, can be attributed to a systematic bias in the calibration data, as shown in Table 2.
It is evident that fuel and air mix more efficiently with the novel injector at this early downstream position. These findings are in good agreement with the 2D distributions shown in Figures 4 and 5. At the next downstream position, z = 16 mm, the enhanced radial mixing of fuel and air becomes even more apparent. The two peaks in the O2 histogram are less pronounced compared to the reference case, where the hydrogen content in the fuel jet area remains above 70 vol.%, and O2 concentrations are still below 7.5 vol.%. Additionally, the histogram for H2 shows a more homogeneous distribution for the novel injector. Even in the outer nozzle regions at x=±5 mm, significant amounts of H2 can be observed in the scatter plot.
At z = 32 mm, the scatter plot for the novel injector exhibits interesting behaviour. The scatter points show a transient distribution, with some bluish and purplish dots still lying on the black equilibrium line, indicating fresh mixture regions with high H2 and O2 concentrations. However, a noticeable portion of the scatter points deviates from the equilibrium line, corresponding to low H2 and O2 concentrations. The histograms of both species reflect this, with an overall peak at 0%, suggesting an unstable flame position above the nozzle, which is consistent with the SD plot in Figure 5. In contrast, the conventional injector shows no transient distribution; its values are more evenly distributed along the equilibrium line, with H2 content still around 60 vol.%. The bimodal distribution in the O2 histogram has disappeared, and the values are more evenly distributed. The low O2 values at H2 = 0% indicate sufficient mixing of recirculated H2O.
At the last measurement position downstream from the nozzle, z = 40 mm, the fuel is evenly distributed for the fuel tube injector, as seen in the H2 histogram. Only in the outer regions of the coflowing air does the hydrogen concentration approach zero. The scatter plot shows a slight transient distribution, with some points lying on the black equilibrium line at H2 > 50 vol.% and O2 > 7.5 vol.%, indicating fresh mixture regions. However, some points show burned conditions, with O2 concentrations approaching zero. The reduced O2 concentrations in the outer coflow area (represented by the reddish dots) suggest enhanced entrainment of water. For the novel injector, the transient distribution has nearly vanished, and the distribution of H2 and O2 in the histogram is shifted towards almost zero concentrations. The residual data points with O2 concentrations greater than 7.5 vol.% are primarily located in the outer coflow area, where combustion is not present.
OH* chemiluminescence measurements
Qualitative evaluation of flame shape
In this section, a qualitative analysis of the flame structure and position is presented via averaged OH* images captured from both injectors. Post-processing processes for the OH* images have been detailed in the methodology section. The case for the fuel tube is shown in Figure 8 on the left. Positioned at z = 52 mm above the nozzle exit, the flame exhibits an elongated and curved tail. The curvature of the flame towards the negative y-direction is attributed to the formation of an inner recirculation zone, resulting from the off-centred nozzle placement relative to the longer axis of the combustion chamber, shown with particle image velocimetry measurements in Petry et al. 9 The lower flame tip exhibits a region of low intensity, attributed to flame fluctuations. In the raw images, not shown here, the moving leading edge of the flame is visible. The red contour delineates the predefined flame region derived from the binarized image, measuring approximately Aflame = 122 mm2. In contrast, the novel injector, BMV006, exhibits a notably shorter LOH. The flame is stabilized at about 26 mm downstream of the nozzle exit, halving the LOH compared to the fuel tube. A qualitative examination of the flame shape reveals a shorter flame. Correspondingly, the binarized qualitative flame area measures Aflame = 140 mm2, surpassing that of the conventional injector. Finally, it is important to note that the results from the chemiluminescence measurements are in good agreement with those obtained from the Raman measurements.
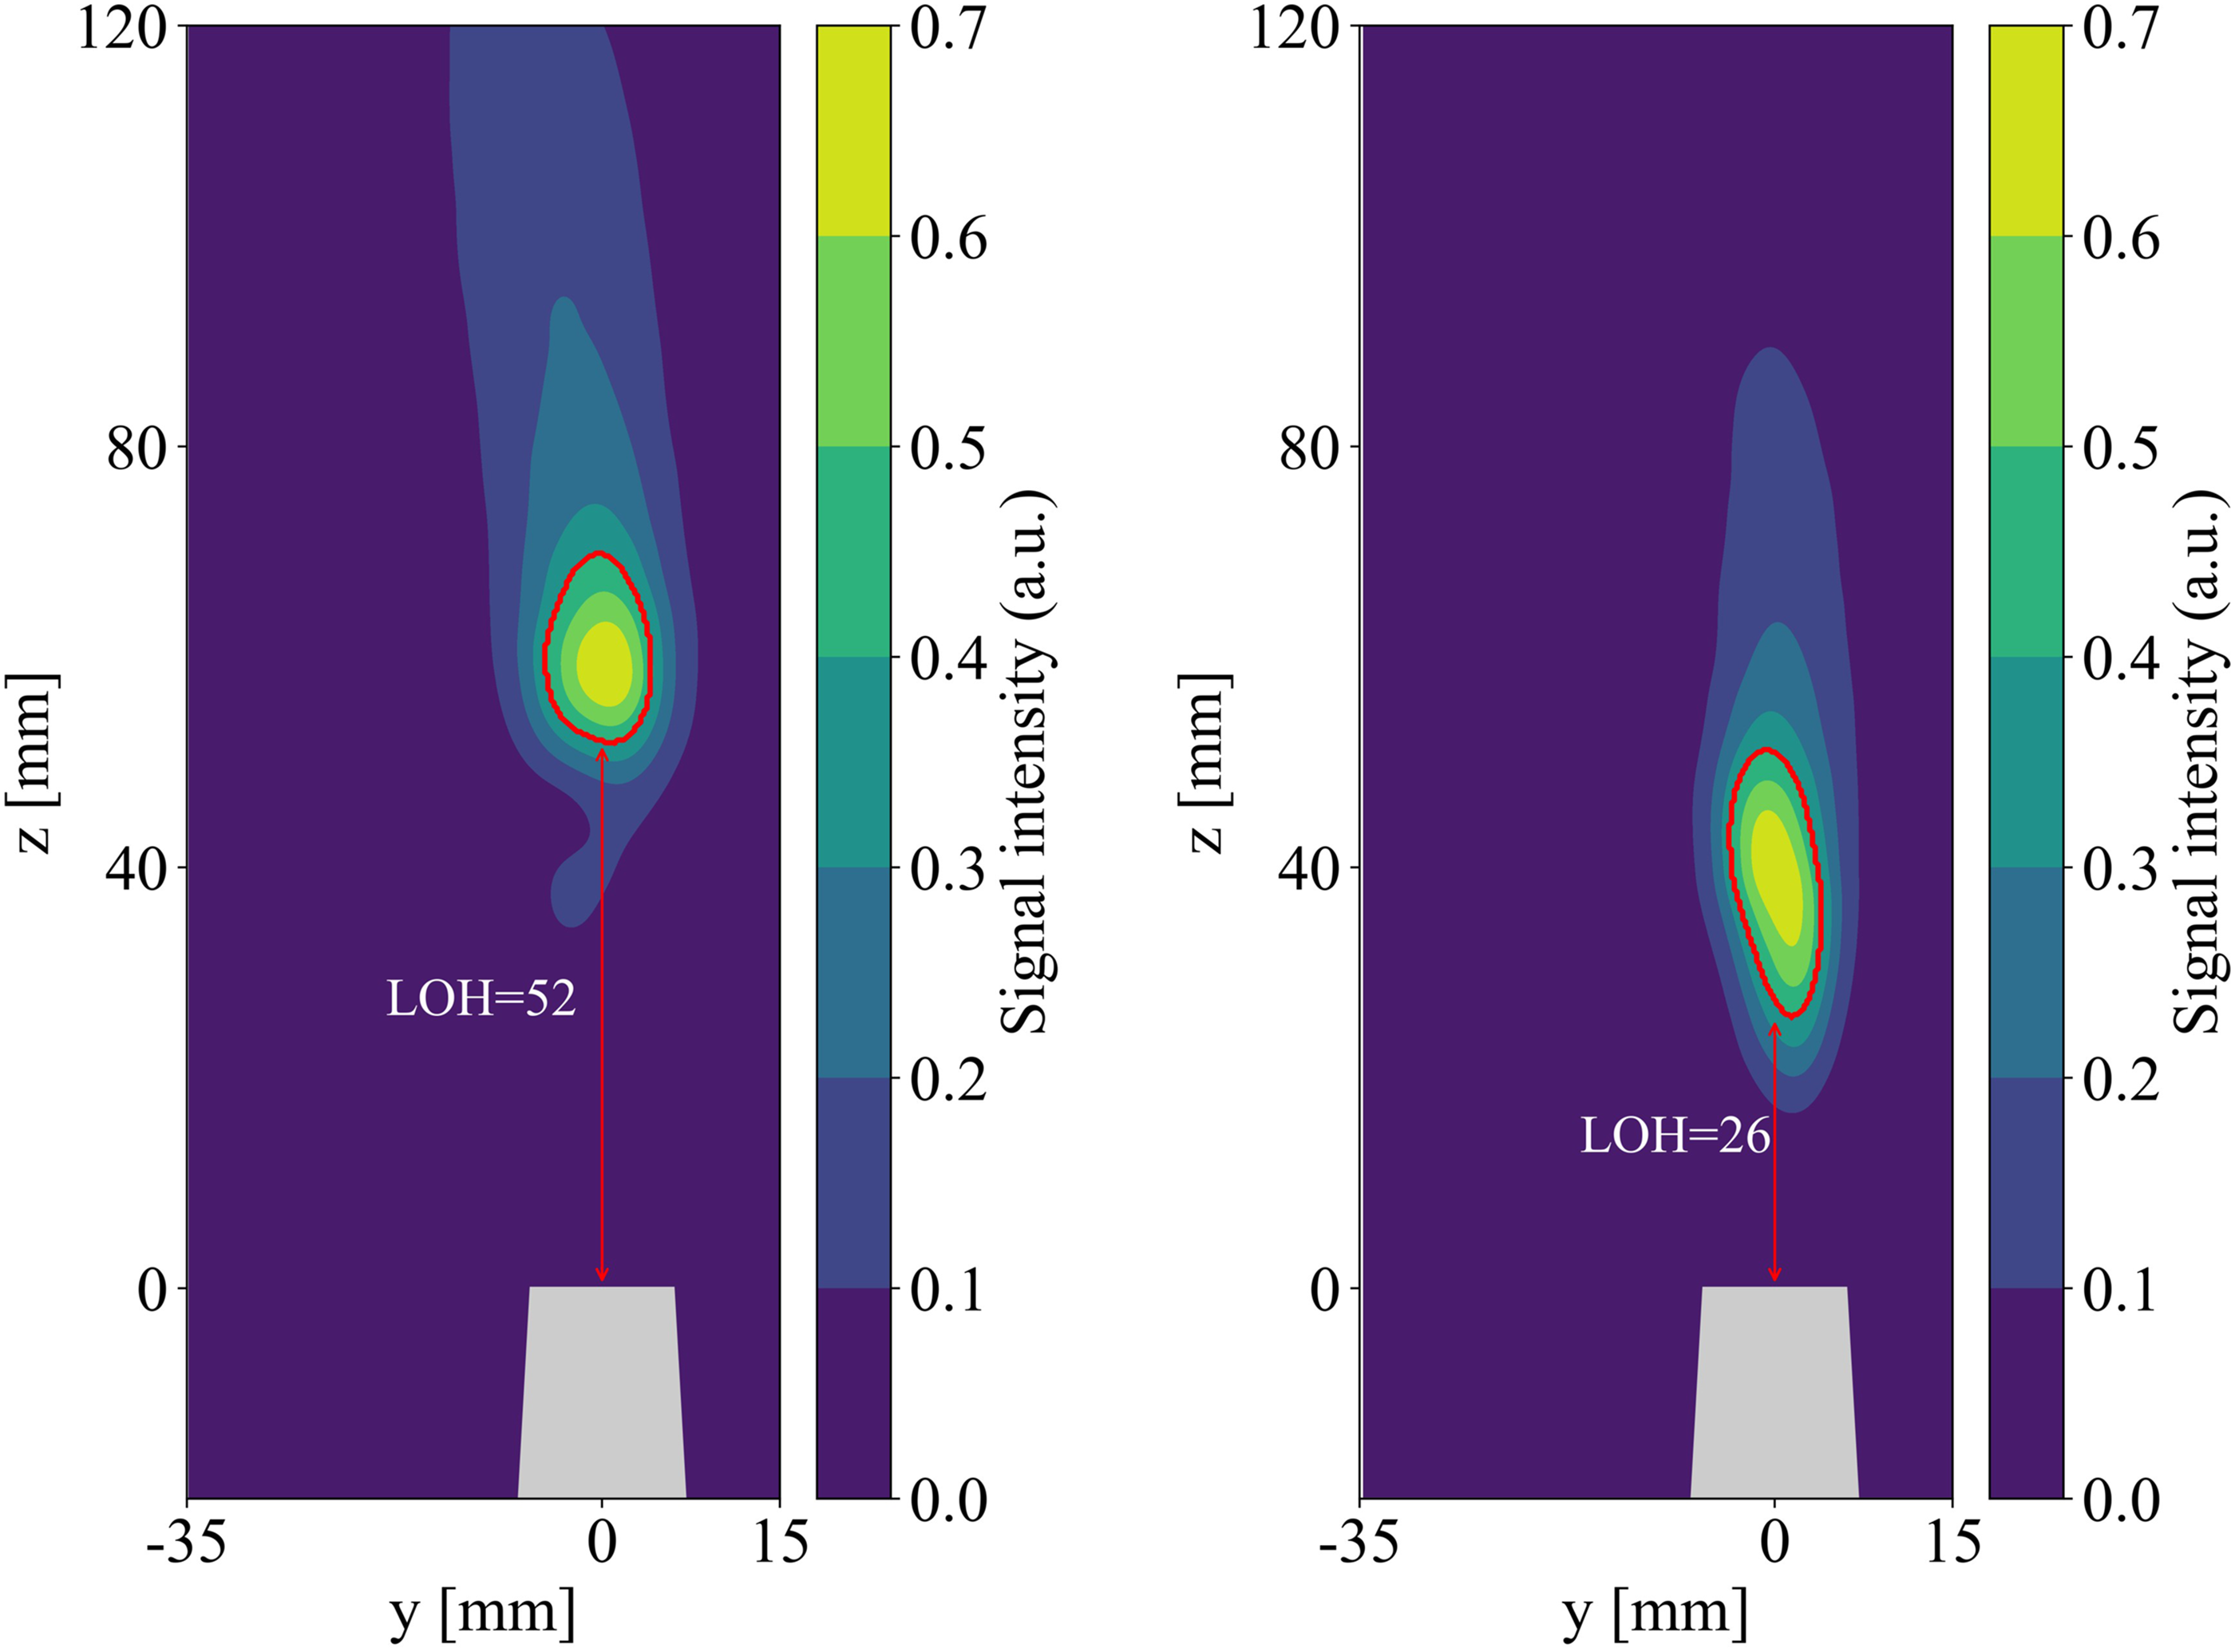
Direct comparison of OH* images for both injectors. Left: fuel tube, right: BMV006 injector. The red contour shows the flame shapes are considered for evaluation of the LOH. Threshold for binarization was 0.3 of the normalized mean OH*-intensity.
During the measurement, exhaust gas compositions are constantly recorded via a commercial gas analyser (MRU MAG prime). The measurement uncertainties of the device are ± 5 ppm for the electrochemical H2 sensor. For the paramagnetic O2 sensor, the inaccuracy is about ± 0.25 vol.%. The measurement error for the detection of NO
x
is estimated to be 2 to 5 ppm. The probe was positioned at the end of the combustion chamber and the flue gas was directed into the analyser via a heated hose with a temperature of Texhaustgas = 433 K. The measured values for NO
x
were normalized to a standard basis of 15 vol.% O2 according to Baukal et al.
19
:
The novel injector exhibits slightly lower NO x values of 22 ppm, which is most likely due to an enhancement in mixing and therefore lower local equivalence ratios compared to the fuel tube injector with NO x = 26 ppm. Furthermore, a more distributed flame without hot temperature strains reduces the NO x values, respectively. Secondly, the larger jet surface area, resulting from the distribution of a single jet into nine smaller jets, enhances turbulent mixing with recirculated combustion products. This, in turn, reduces the local equivalence ratio and adiabatic flame temperature, which positively impacts the thermal NO x mechanism, 20 leading to lower NO x emissions. It is worth to mention that the share of prompt NO x is negligible in this consideration.
Conclusion
This study explores a novel injector design to improve the mixing efficiency of fuel and oxidizer in a single-nozzle FLOX® combustor using 1D laser Raman spectroscopy. A reference injector from earlier studies 9 was used for comparison. Both injectors were integrated into a coaxial non-premixed fuel/air nozzle configuration. Experiments were conducted at atmospheric pressure with preheated air at 573 K, air exit velocities of 115 m/s and fuel velocities of 647.8 m/s. The study used 1D laser Raman spectroscopy and OH* chemiluminescence to analyse species concentrations, flame morphology and flame LOHs, complemented by exhaust measurements linking the development to technical requirements.
The novel injector showed enhanced mixing efficiency and more uniform radial fuel distribution compared to the reference, a straight fuel tube. The fuel distribution issued from the novel injector reached the inner air nozzle rim 11 mm from the exit, while the fuel tube injector required 40 mm. The standard deviation of major species showed broader mixing layers and more homogeneous fuel distribution for the novel injector. The fuel jet exhibited early breakup and mixing with air near the nozzle for the new injector, compared to the conventional injector, which requires more than four times the streamwise distance for sufficient mixing of fuel and air.
Mechanically, the smaller jets with a larger total jet surface promote more efficient turbulent mixing. At 40 mm downstream, the new injector achieves a near-stoichiometric mixture, while the reference injector remains fuel-rich. The flame's LOH was 26 mm for the novel injector, resulting in a more distributed reaction zone and lower NO x emissions.
Overall, this novel design improves fuel-oxidizer mixing, reduces LOH and reduces NO x emissions, which is promising for aviation gas turbines, where stable and eco-friendly combustion is crucial. The dataset also supports advancements in numerical combustion modelling.
Footnotes
Funding
The authors disclosed receipt of the following financial support for the research, authorship, and/or publication of this article: The authors received the financial support within the DLR e.V. (Deutsches Zentrum fur¨ Luft- und Raumfahrttechnik) internal project: ‘Hydrogen Utilization in Gas Turbines (H2GT)’.
Declaration of conflicting interests
The authors declared no potential conflicts of interest with respect to the research, authorship, and/or publication of this article.