
Abstract
The study of the flame under the acoustic excitation contributes to the study of flame self-excited thermoacoustic instability. Although non-premixed combustion is widely used in industry, research on its combustion instability characteristics is relatively few. This paper experimentally studies the response of a non-premixed swirl flame under excitation. The geometry modifications are the length of the inlet section which is set to be 0.245 m, 0.345 m and 0.445 m and the installation of separation plates. Through the analysis of flame response behavior at different excitation frequencies, combined with the calculation of acoustic mode, we find that for the 0.245 m and 0.345 m inlet length cases, the maximum flame heat release fluctuation responds near 144 Hz. This mode is due to the resonance of the fuel pipe. For the 0.445 m inlet length cases, the maximum flame heat release responds near 134 Hz. This mode is a mixed mode of fuel pipe and combustion chamber. The maximum flame response occurs at the point where the pressure fluctuation reaches the maximum in the inlet section. The image analysis shows the same mode distinction trend between short and long inlet length. Besides, the removing of separation plates leads to a more stable response of the flame in low inlet airflow rate. However, at high airflow rate, the flame tends to be more unstable. Moreover, the higher acoustic forcing frequency than quarter-wave mode will cause the quarter-wave resonant frequency to appear. The results of our work can benefit the implications of thermoacoustic instability in non-premixed flame.
Keywords
Introduction
In gas turbine combustors, combustion instability is more likely to occur due to the adoption of low-pollution combustion technologies such as lean-premixed swirl-stabilized combustion. 1 Recently, the research on combustion instability is mainly focused on the lean-premixed combustion.2–5 Although non-premixed flames are widely used in the industrial burners and boilers, combustion instabilities in those combustors are not well studied.
Unlike the premixed flame, jet diffusion flame can be hydrodynamically globally unstable and oscillates at its low natural frequency. 6 Flicker characteristics or buoyancy instabilities of jet-like diffusion flame are elucidated by their natural flame dynamics.7–9 External excitation of non-premixed flames by acoustic forcing has also been studied with the motivation of enhancing mixing 10 or decreasing pollutant emissions. 11 In non-premixed swirl combustion, Idahosa et al. 12 conducted that Strouhal number approximate unit and large velocity perturbation are necessary to initiate and sustain high flame response. Investigation of flame heat-release response to acoustic forcing can benefit the analysis of thermoacoustic instability in the combustor. Santhosh and Basu 13 studied changes of the non-premixed flame global structure that can couple heat-release oscillation with dynamic pressure and velocity fluctuations leading to unsteady combustion. Magina and Lieuwen 14 numerically and experimentally studied the spatiotemporal evolution of non-premixed laminar flames under acoustic forcing and reveals that flame wrinkles propagate axially at the mean flow velocity. Different fuel injection ways and premixing degrees on non-premixed flames-imposed oscillations were varied to study flame response by Hardalupas and Selbach 15 and Kypraiou et al. 16 The lock-in feature of hydrodynamically self-excited diffusion flames is also examined to evaluate its influence on thermoacoustic systems. 17 For low stochastic forcing amplitudes, quantitative differences between those predicted by “quasi-laminar” approach and harmonically excited turbulent flames existed, with the key qualitative features unchanged. 18 Under high amplitude-acoustic forcing, Schimek et al. 19 identified the saturation in the nonlinear swirl-stabilized flame response.
The geometry effects on flame response under acoustic excitation were studied by Birbaud et al. 20 The influence of confinement on the premixed flame under acoustic excitation was numerically and experimentally conducted by changing the diameters of the combustor. The swirler blade angle effect on flame transfer function (FTF) was obtained by Durox et al. 21 under harmonic acoustic excitation. The same group also evaluate the burner inlet length and combustor length effect on combustion instability by combining the Helmholtz solver with the FTF. 22 Fluctuations in the rate of heat release in a turbulent flame can also be the driven source of combustion instability. 23 The unsteady flame heat release generates pressure waves, which reflect at the boundaries of the combustor and the velocity or equivalence perturbation associated with these waves causes more unsteady combustion. Different flame geometries, stabilization configurations and flow interactions were explored for premixed methane-air flames to present the acoustic wave generated by flame interactions. 24
The methodology of using acoustic forcing are also applied to explore the nonlinear effects on thermoacoustic instability in the literature.25,26 Nonlinear flame responses play an important role in onset and evaluation of thermoacoustic systems. Balusamy et al. 27 studied the nonlinear interaction between self-excited oscillations and forced oscillations in a combustor and revealed that self-excited amplitude could be suppressed by synchronization of the self-excited mode with the forced mode. Kim and Hochgreb 28 analyzed fuel/air ratio inhomogeneities and fuel stratification on the forced flame response and concluded that self-excited combustion instability could be suppressed by proper design of the injector geometry and manipulation of fuel injection scheme. Bellows et al. 29 illustrated that driven frequencies above the instability frequency are hard to affect the self-excited mode in a premixed combustor. Besides the acoustic acting on co-flow air, forcing acoustic excitation can also impose on fuel pipe in non-premixed flame. A central fuel jet was acoustically excited 30 in swirling diffusion flame with a disk bluff-body and found that different excitation amplitudes cause four flame modes. Chen et al. 31 studied the flame response under acoustic excitation, showing oscillations in both the fuel jet flow and flame sheet position dependent upon the forcing frequency and amplitude. Besides, the use of photomultiplier tubes (PMT) centered at 430 nm or 310 nm to observe the chemiluminescence of CH* and OH* radicals in quantifying the flame heat-release rate under combustion instability were carried out.32,33 Phase-locked flame images under acoustic forcing were also used to observe the flame dynamics in oscillation cycles.34,35
While experimental and numerical studies of premixed flame response under acoustic forcing exist, there is significantly less literature on forced non-premixed flames. In this paper, we investigate the effects of burner geometry modification on non-premixed swirl flame response under acoustic forcing and nonlinear interaction between the resonant mode and forced acoustic modes. Then we numerically study the cause of different response mode of non-premixed swirl flame presented in the experiment by finite element method (FEM). The phase-locked direct flame images and phase-averaged CH* chemiluminescence images are also analyzed. This paper aims to explore the behavior of non-premixed swirl flame under acoustic forcing with different frequencies and burner geometries.
Methodology
Experimental set up
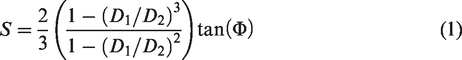
Experiments are performed on a laboratory-scale, swirl-stabilized burner with a central cylindrical fuel pipe and two axial swirlers (Figure 1). The combustor comprises a cylindrical air inlet section ended by inner and outer swirler with an air separation bluff body, an optically-accessible quartz square combustion section, two loudspeakers installed at the downstream of the combustor (Figure 2). Research-grade propane is delivered through the central fuel pipe of inner diameter 13 mm. Air is delivered through two diametrically opposed apertures at the upstream of inlet section and separated by an annular bluff body with inner diameter 76 mm and outer diameter 86 mm. The diameter of inlet section is 114 mm. Inner swirler has 28 swirl vanes of thickness 0.5 mm, aligned at 54° to the flow. Outer swirler has 32 swirl vanes of thickness 1 mm with 16° angle. For this geometry, the corresponding swirl number can be estimated using the expression1,36
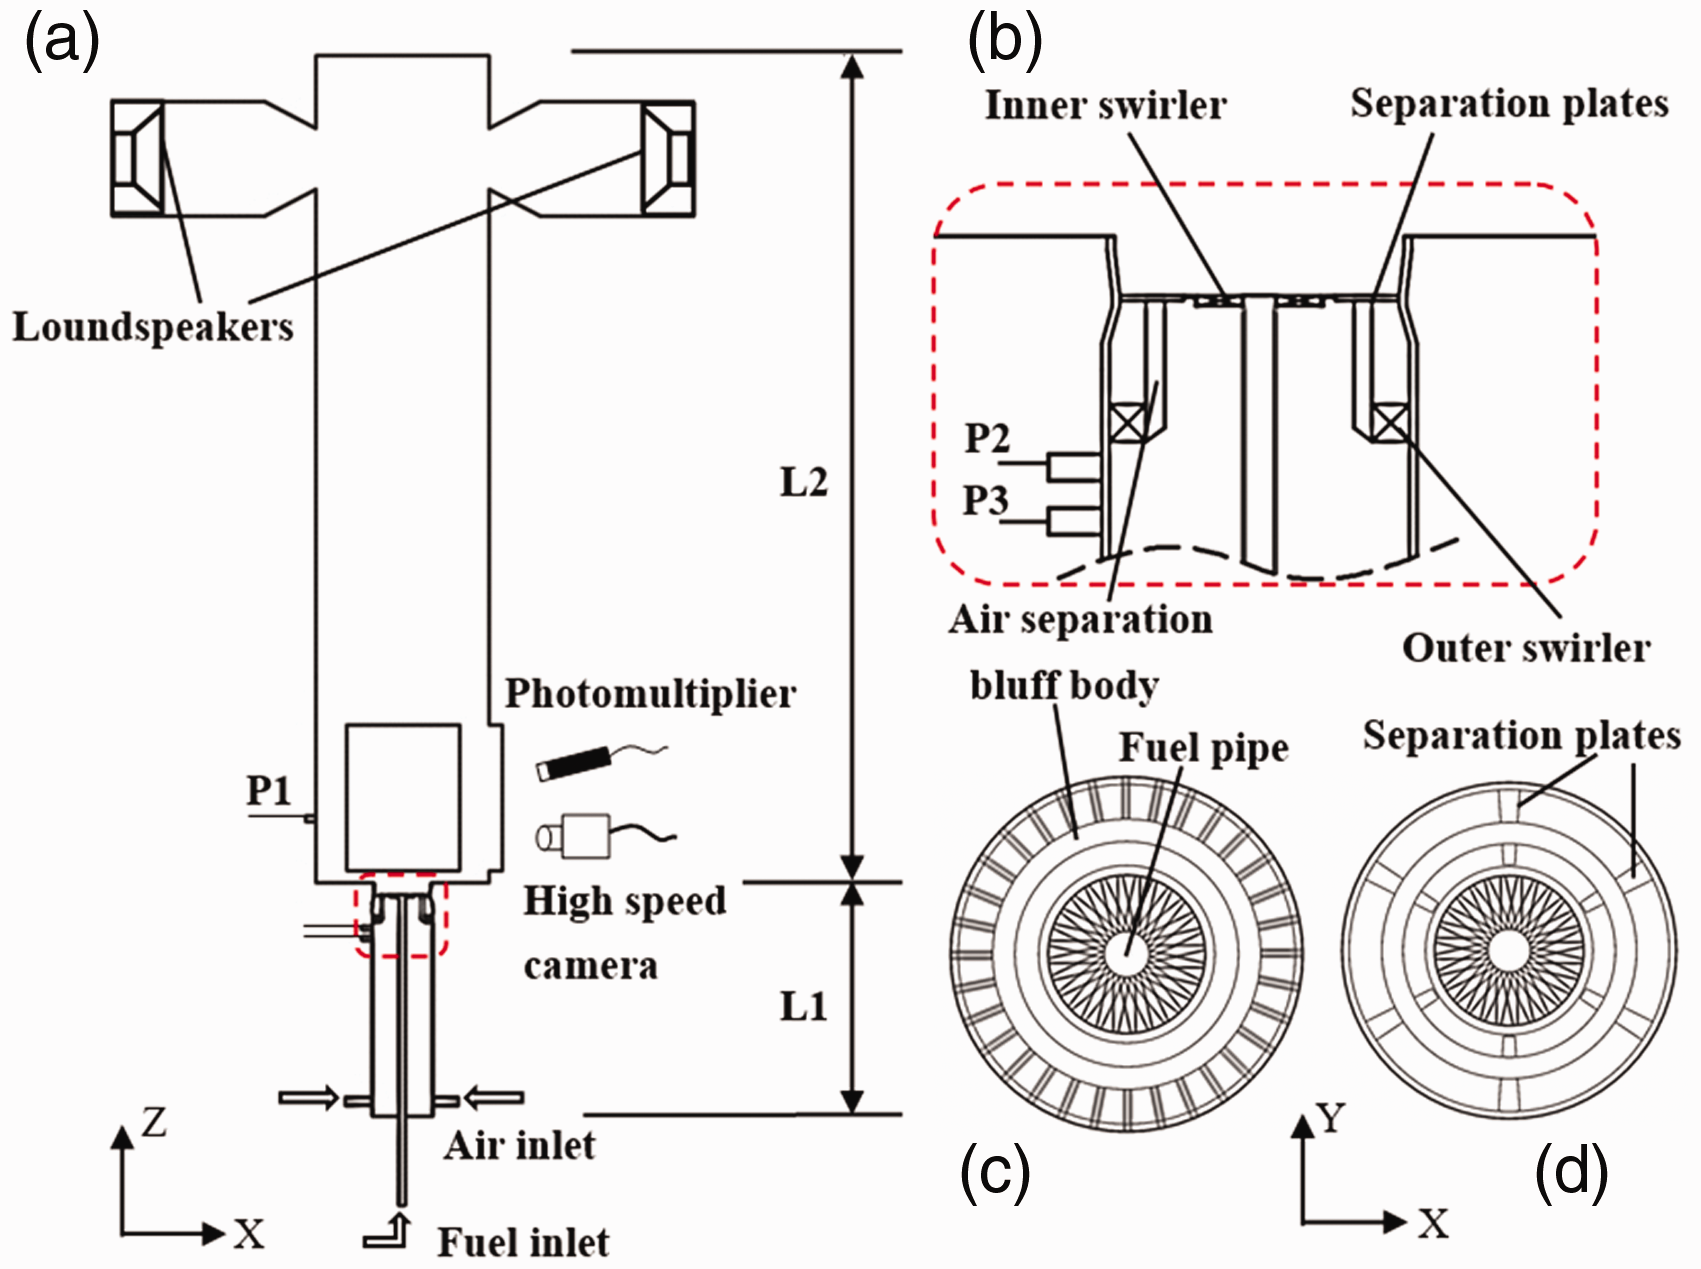
(a) Schematic of non-premixed swirl combustor. (b) The detailed configuration of burner outlet with separation plates. (c) The burner outlet section without separation plates. (d) The burner outlet section with separation plates.
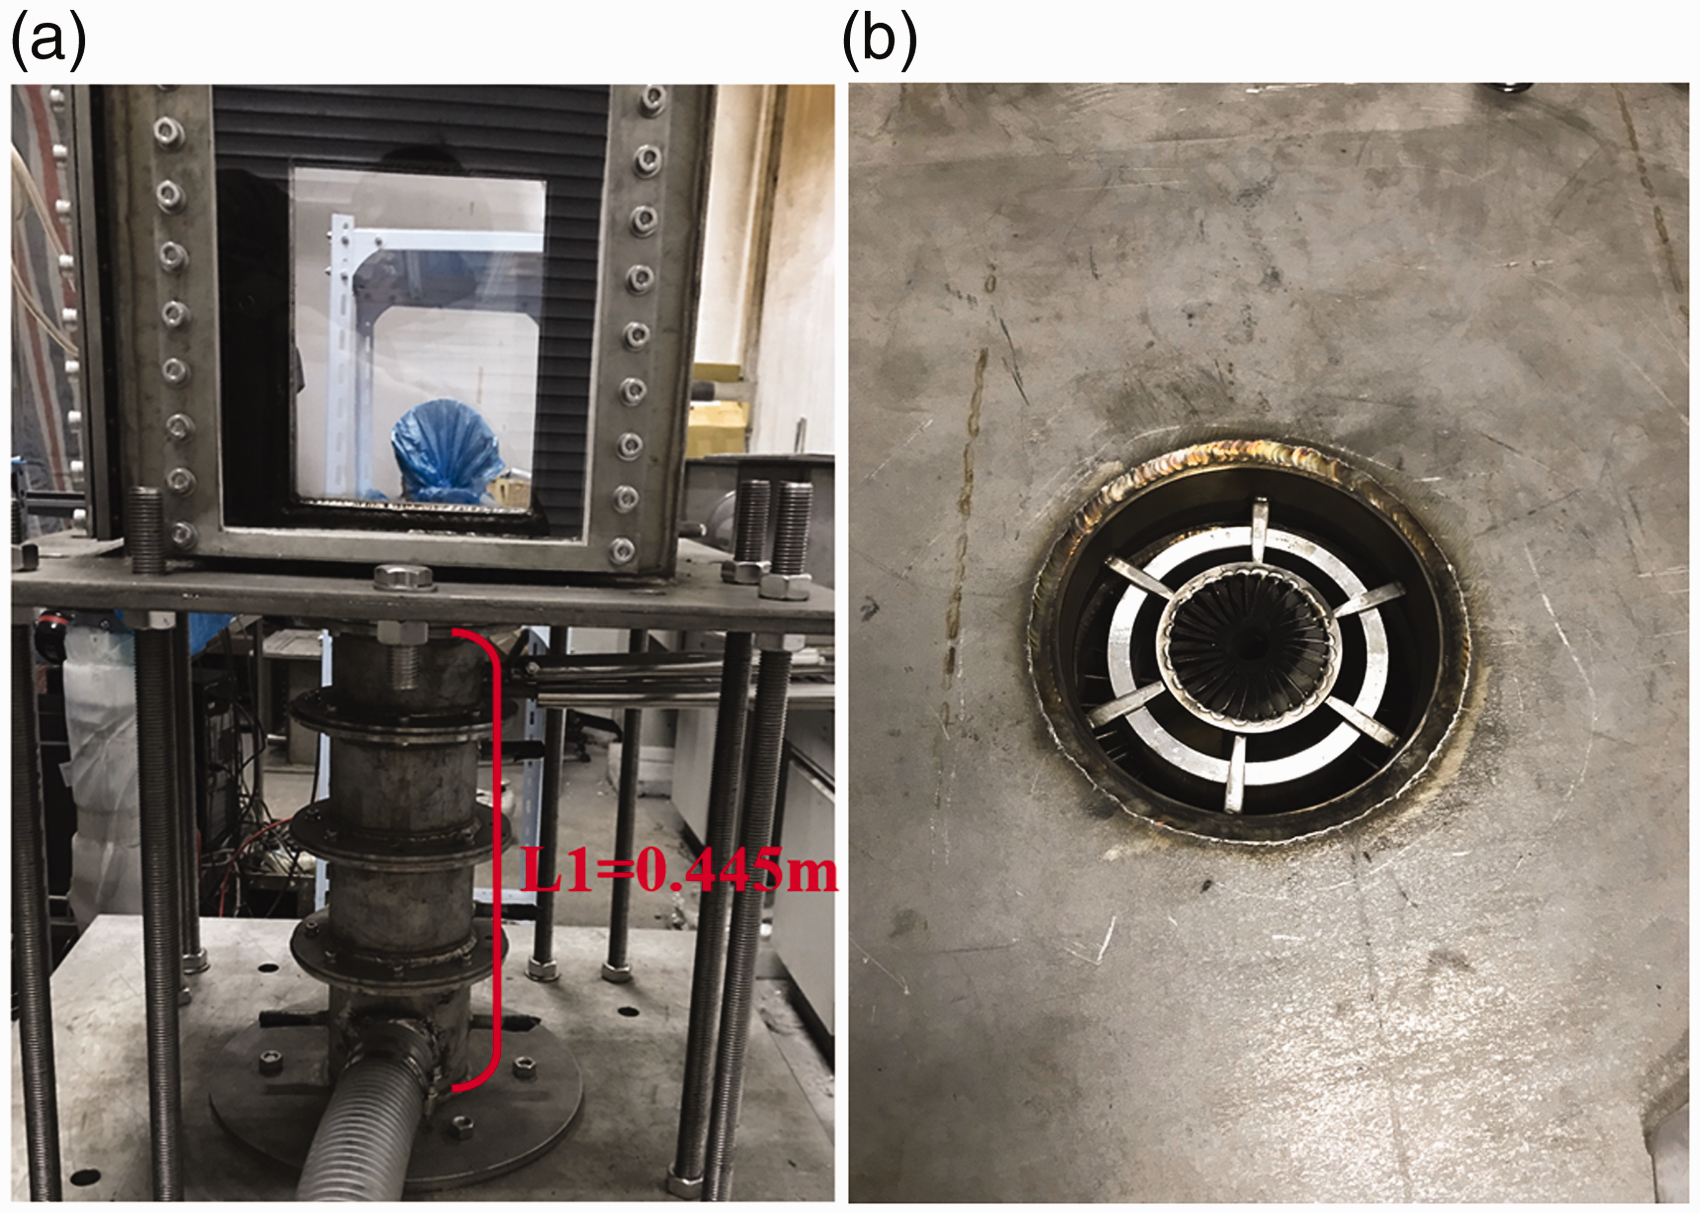
(a) Picture of the combustor with 0.445 m inlet length. (b) Picture of the swirler and the separation plates.
The global CH* (430 ± 10 nm) chemiluminescence from the flame is measured by using the photomultiplier tube (PMT, Hamamatsu H10722 series) as a heat-release-rate marker. The OH* or CH* measurements can be used as a heat-release indicator of non-premixed flame heat release fluctuations.12,16 In non-premixed systems, it is not clear to what extent the OH* or CH* chemiluminescence represents the heat-release rate. However, the experience gained with the current experiment suggests that it is applicable here 37 since it provides data that the flame heat release fluctuations are both a strong function of the acoustic perturbation frequency and amplitude. Along with the PMT, the direct flame images during the combustion process are simultaneously obtained using a CCD camera (AOS S-PRIplus) through a synchronizer (MODEL DG535). The dynamic pressure oscillations signal P1 in the combustion section is acquired from pressure transducers (Sensitivity is 1 mV/Pa and for 0 to 20 kHz bandwidth, the rise time is 5 μs) 150 mm above the burner outlet. P2 and P3 pressure signals are measured at 60 and 80 mm below the burner outlet in the air inlet section. CH* chemiluminescence signal and dynamic pressure data are simultaneously recorded using a multi-channel data recorder (National Instruments, USB-6210) at a 20 k Hz sampling rate and 4 s time duration. The forcing frequency and amplitude are independently controlled by the signal generator (GWINSTEK, AFG-2105).
The combustor is operated at atmospheric pressure and room temperature. The volume flow of propane is metered with mass flow controllers (Alicat MC series, 0.2% FS) and fixed at 9.6 L/min. The air flow rate is controlled by a rotameter (2% FS) and chosen at 760 L/min and 1270 L/min in the experiment, leading to the global equivalence ratio 0.3 and 0.18, respectively. The global equivalence ratio of flame blow-off limit is around 0.07. The flames are forced sinusoidally over a range of frequencies 30–400 Hz. The frequencies increment is 10 Hz, and 1 Hz increment is used in the specific range of 125–175 Hz. The combustion condition studied is summarized in Table 1.
Combustion condition studied in the experiment.
Image analysis
The direct Light high-speed image and CH* filtered image are both captured. The direct Light high-speed image, pressure and PMT signals are all phase-locked to the sinusoid acoustic pulsing signal of excited frequency. The exposure time of direct image (800 pixels × 600 pixels) is set to 50 μs. For each case, 2000 samples are stored. The field of view was 0.4 m × 0.3 m corresponding to a spatial resolution of 250 μm/pixel. The flame light intensity is recorded as a line-of-sight integration where the depth of field comprised the entire width of the combustor. Due to the low emission intensity of self-excited CH* signal (compared to the direct light), the exposure time of the CCD camera with 430 ± 10 nm bandpass filters is 10 ms, which are acquired at the rate of 50 images per second. Due to time-averaging over the instability cycle (for example, at 200 Hz, one cycle is 5 ms), the CH* chemiluminescence image cannot resolve the combustion instability. One alternative method is the application of proper orthogonal decomposition (POD) in phase average.38,39 The key idea is to use the time coefficients which contain information about the phase angle corresponding to a given snapshot. The POD is a procedure to decompose a given ensemble of data into a set of eigenfunctions.
40
Here, the ensemble of data is the CH* intensity distribution imaged under the acoustic forcing (500 images in this case). The two-dimensional arrays of an image are represented by the scalar function 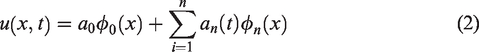
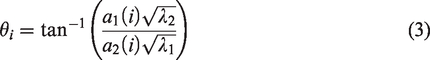
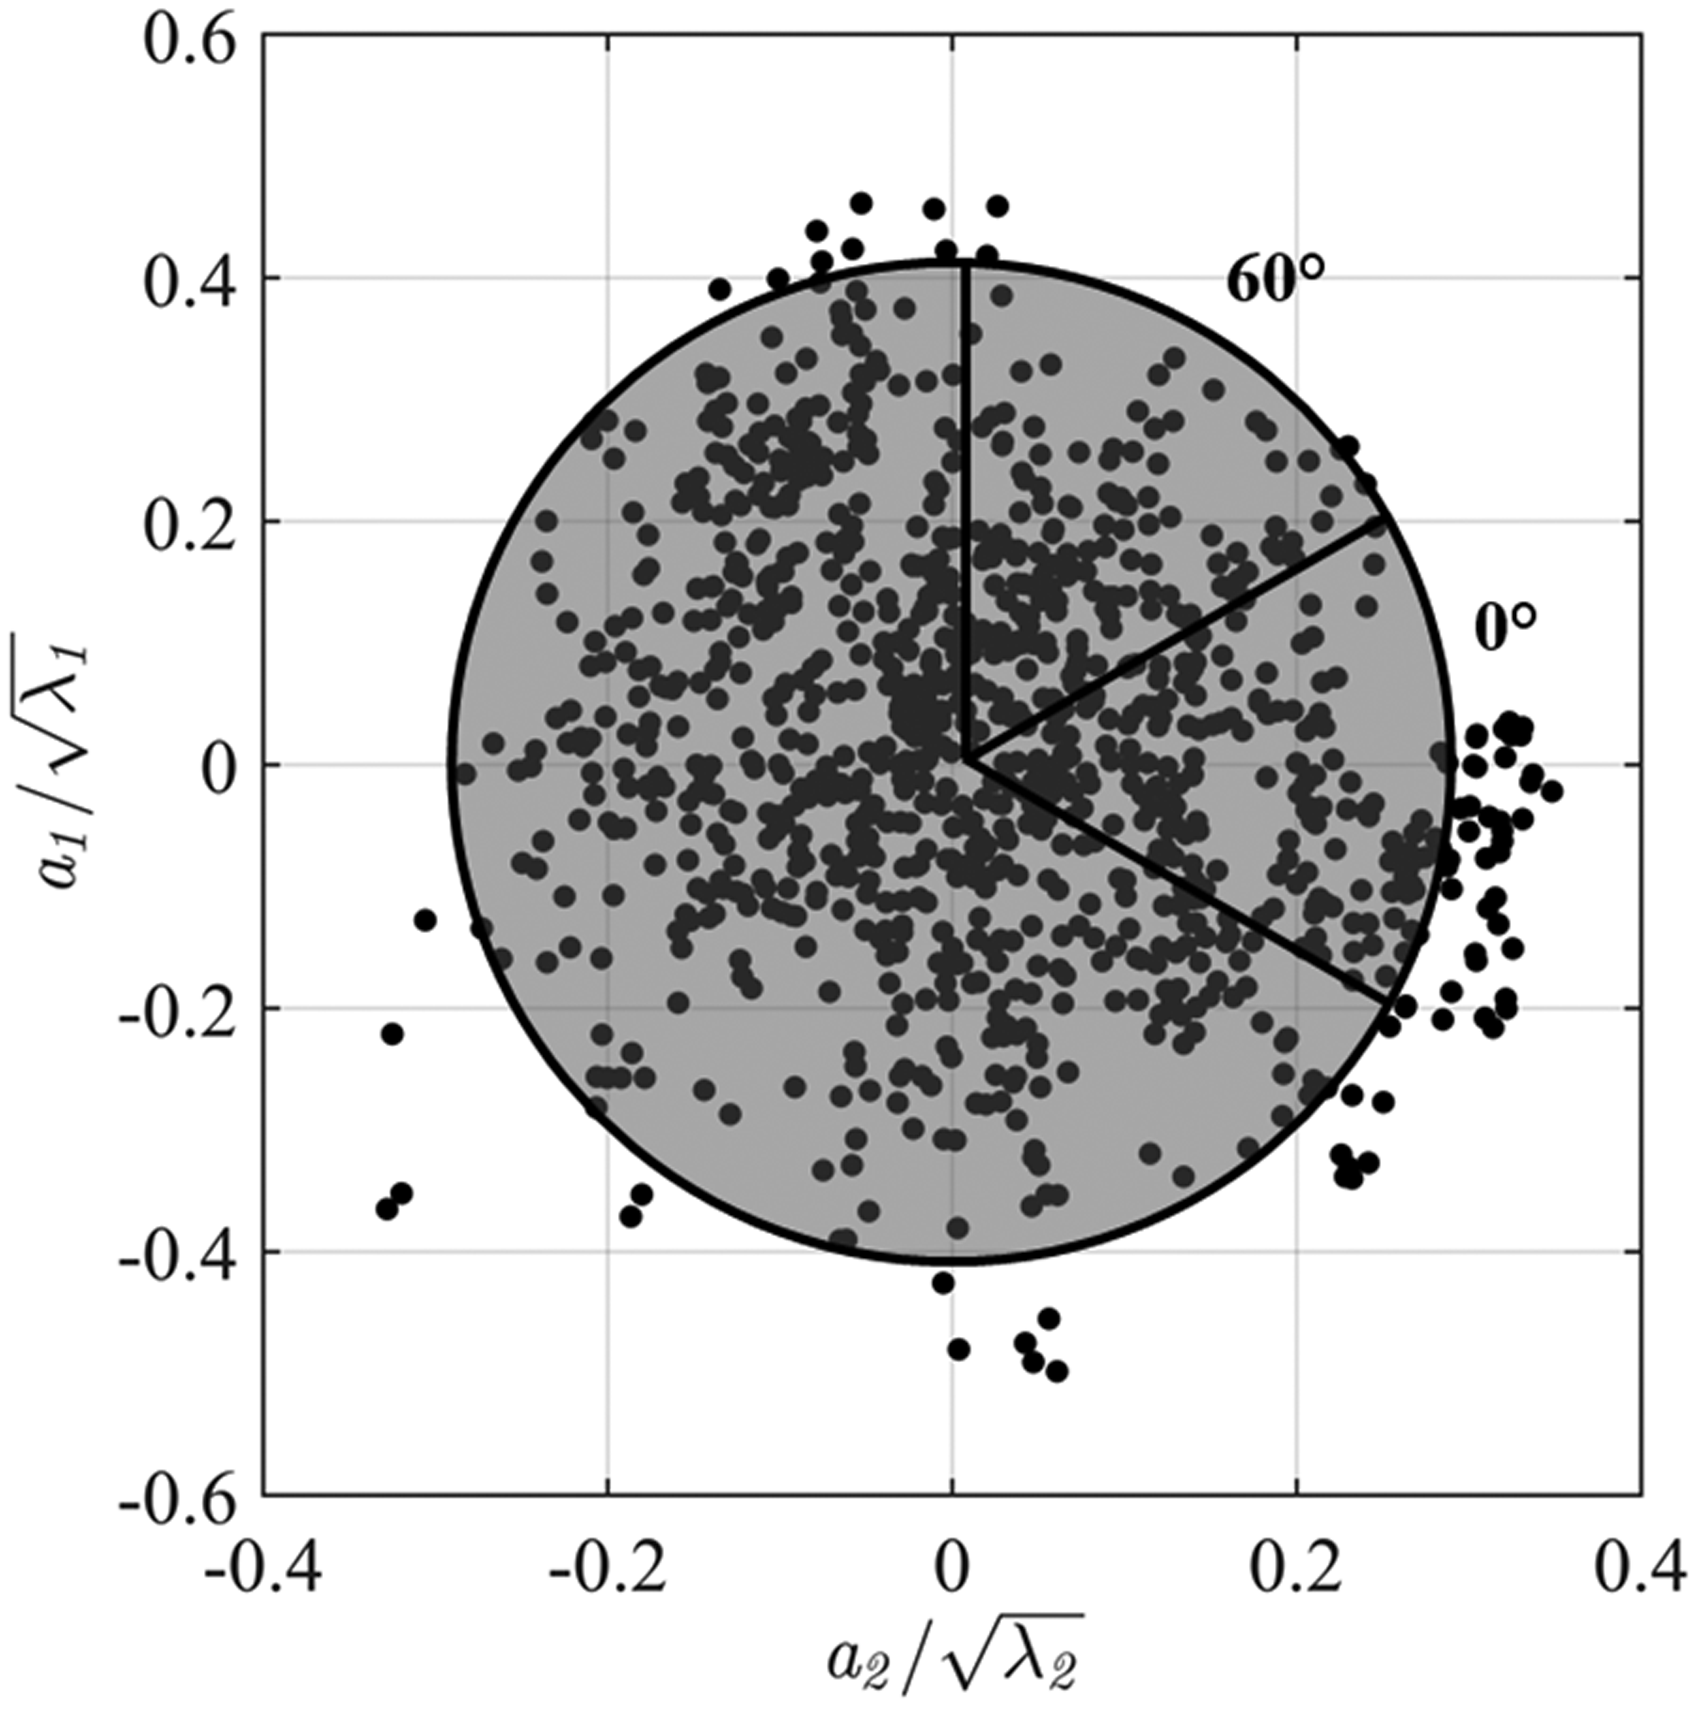
Scatter plot of normalized time coefficients under 134 Hz acoustic forcing with separation plates (L1 = 0.445 m, 760 L/min airflow rate).
One disadvantage of the POD phase-averaging procedure is that the pressure oscillation phase in the combustor and the phase-averaged images cannot be directly compared in time or phase angle. 35
Acoustic mode simulation
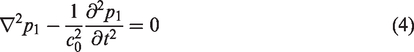
The acoustic modes of the combustor are simulated by FEM. The fluid is regarded as an ideal gas, and the mean flow is considered negligible (Mach number = 0). The general form of homogeneous wave equation as follows
44
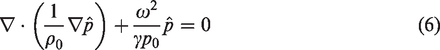
Then we introduce harmonic variations at the frequency 
Introducing equation (5) into equation (4) leads to the following non-react Helmholtz equation
45
The finite element code used in this work is COMSOL Multiphysics, which solves the eigenvalue problem using the implicit restarted Arnoldi method 46
Result and discussion
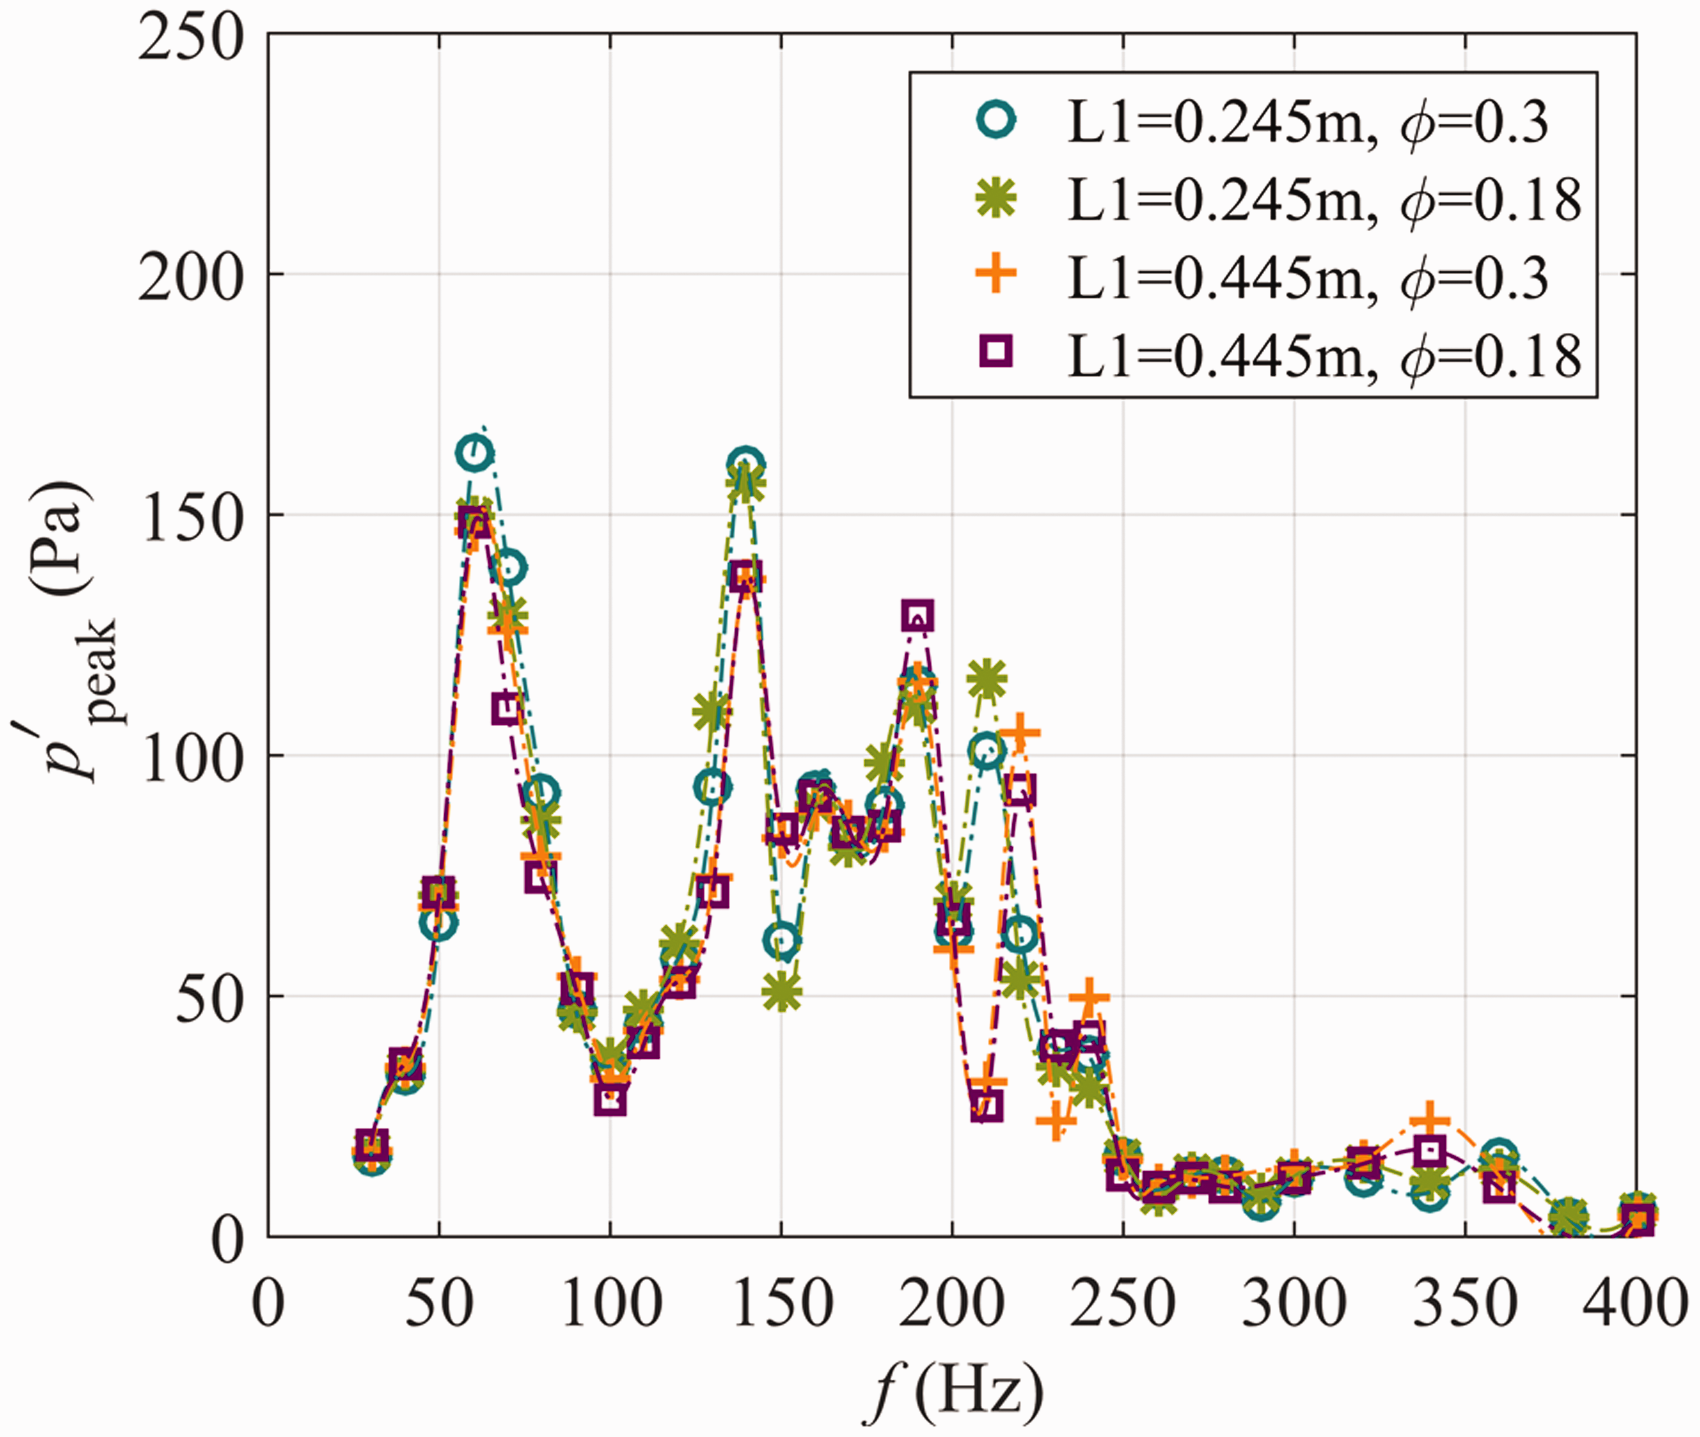
The peak pressure response in combustion section (P1) under acoustic forcing is shown in Figure 4. Figure 4 illustrates a low-pass filter behavior of flame response consistent with previous studies.47,48 The responsive flames become unpulsed beyond a specific forcing frequency of 250 Hz. The main resonance frequencies at combustion section are around 60, 140, 190, 210 (L1 = 0.245 m) and 220 Hz (L1 = 0.445 m). The flame heat release fluctuation under acoustic forcing is illustrated in Figure 5. The inlet length L1 is varied at 0.245, 0.345 and 0.445 m with the airflow rate 760 L/min and 1270 L/min. Moreover, the cases with and without separation plates are also compared. The distribution of flame heat release fluctuation is similar to the pressure response in combustion section. For 0.245 m inlet length cases, the maximum responses of flame appear at around 60, 140 and 210 Hz. For 0.445 m inlet length cases, the maximum responses of flame appear at around 60, 130 and 220 Hz. The maximum flame response behavior of 0.345 m inlet length case is the same as 0.245 m case at around 140 Hz (Figure 6(a)). The pressure response in the combustion section is also close to the results of 0.245 m case in the range of 125–175 Hz (Figure 7). Thus, 0.245 m and 0.445 m inlet length cases are mainly focused in this study.
Pressure response in the combustion section under 30–400 Hz acoustic forcing.
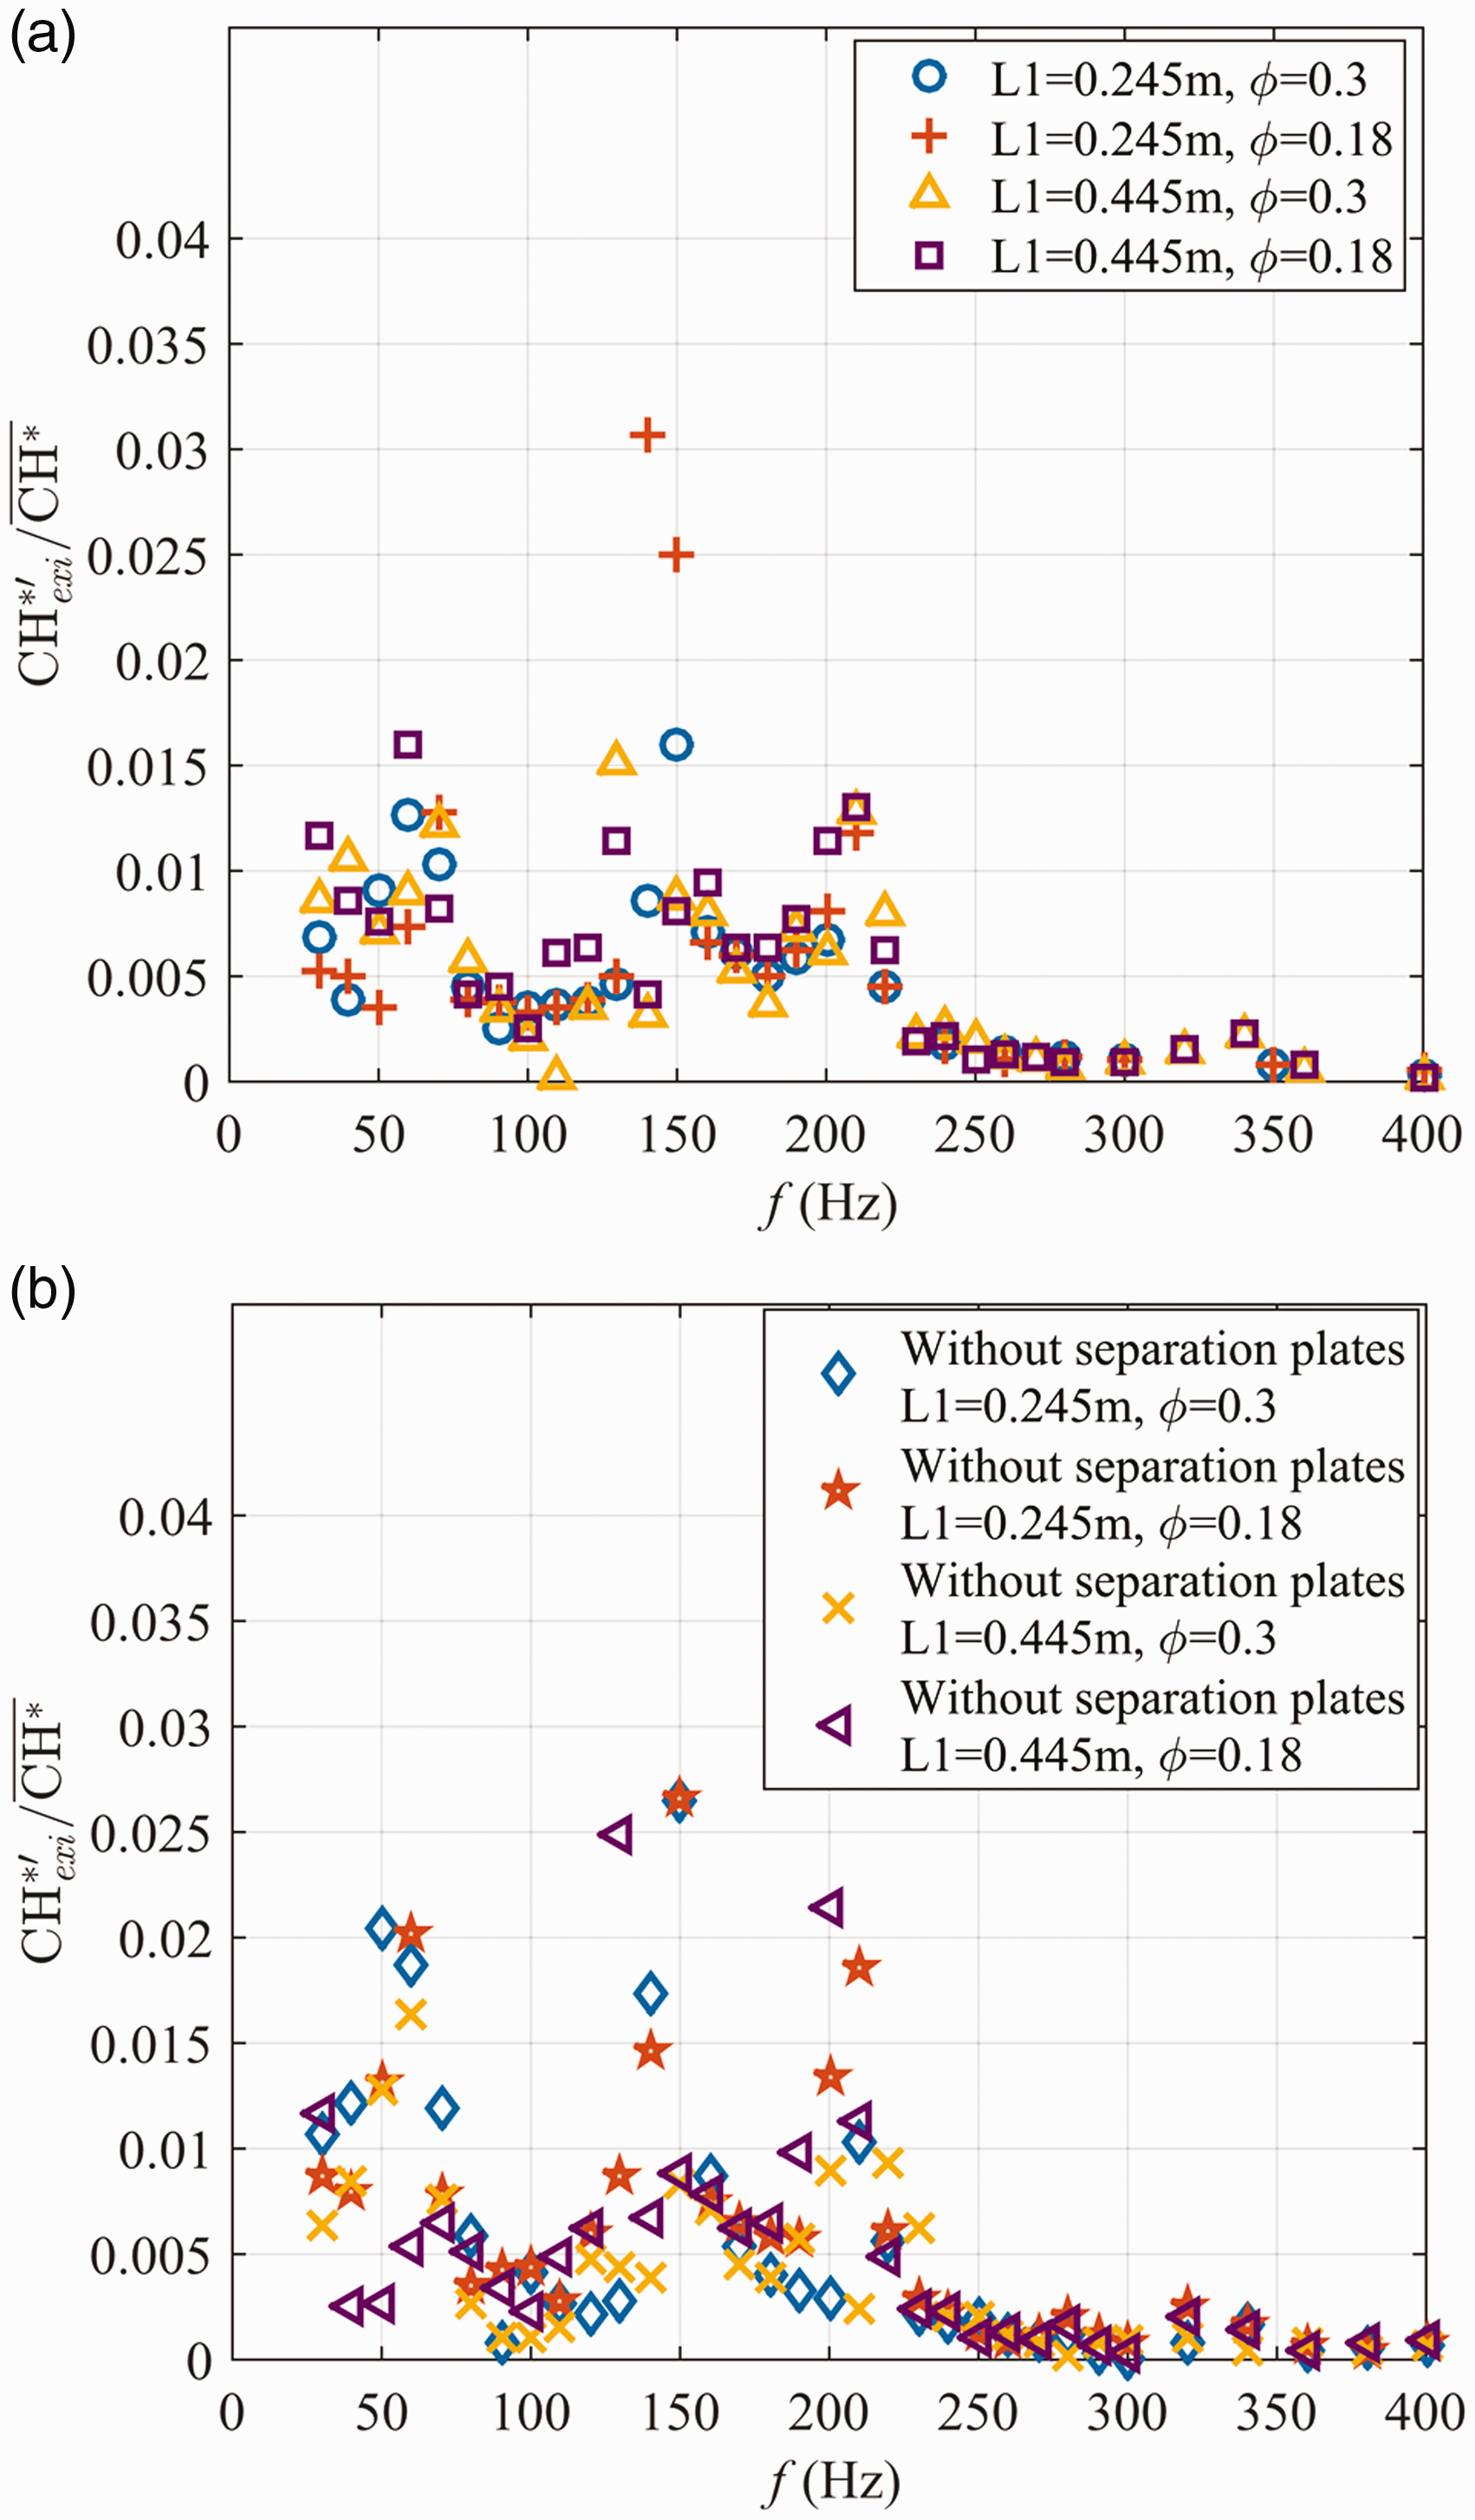
Flame heat release response under 30–400 Hz acoustic forcing: (a) cases with separation plates installed and (b) cases without separation plates installed.
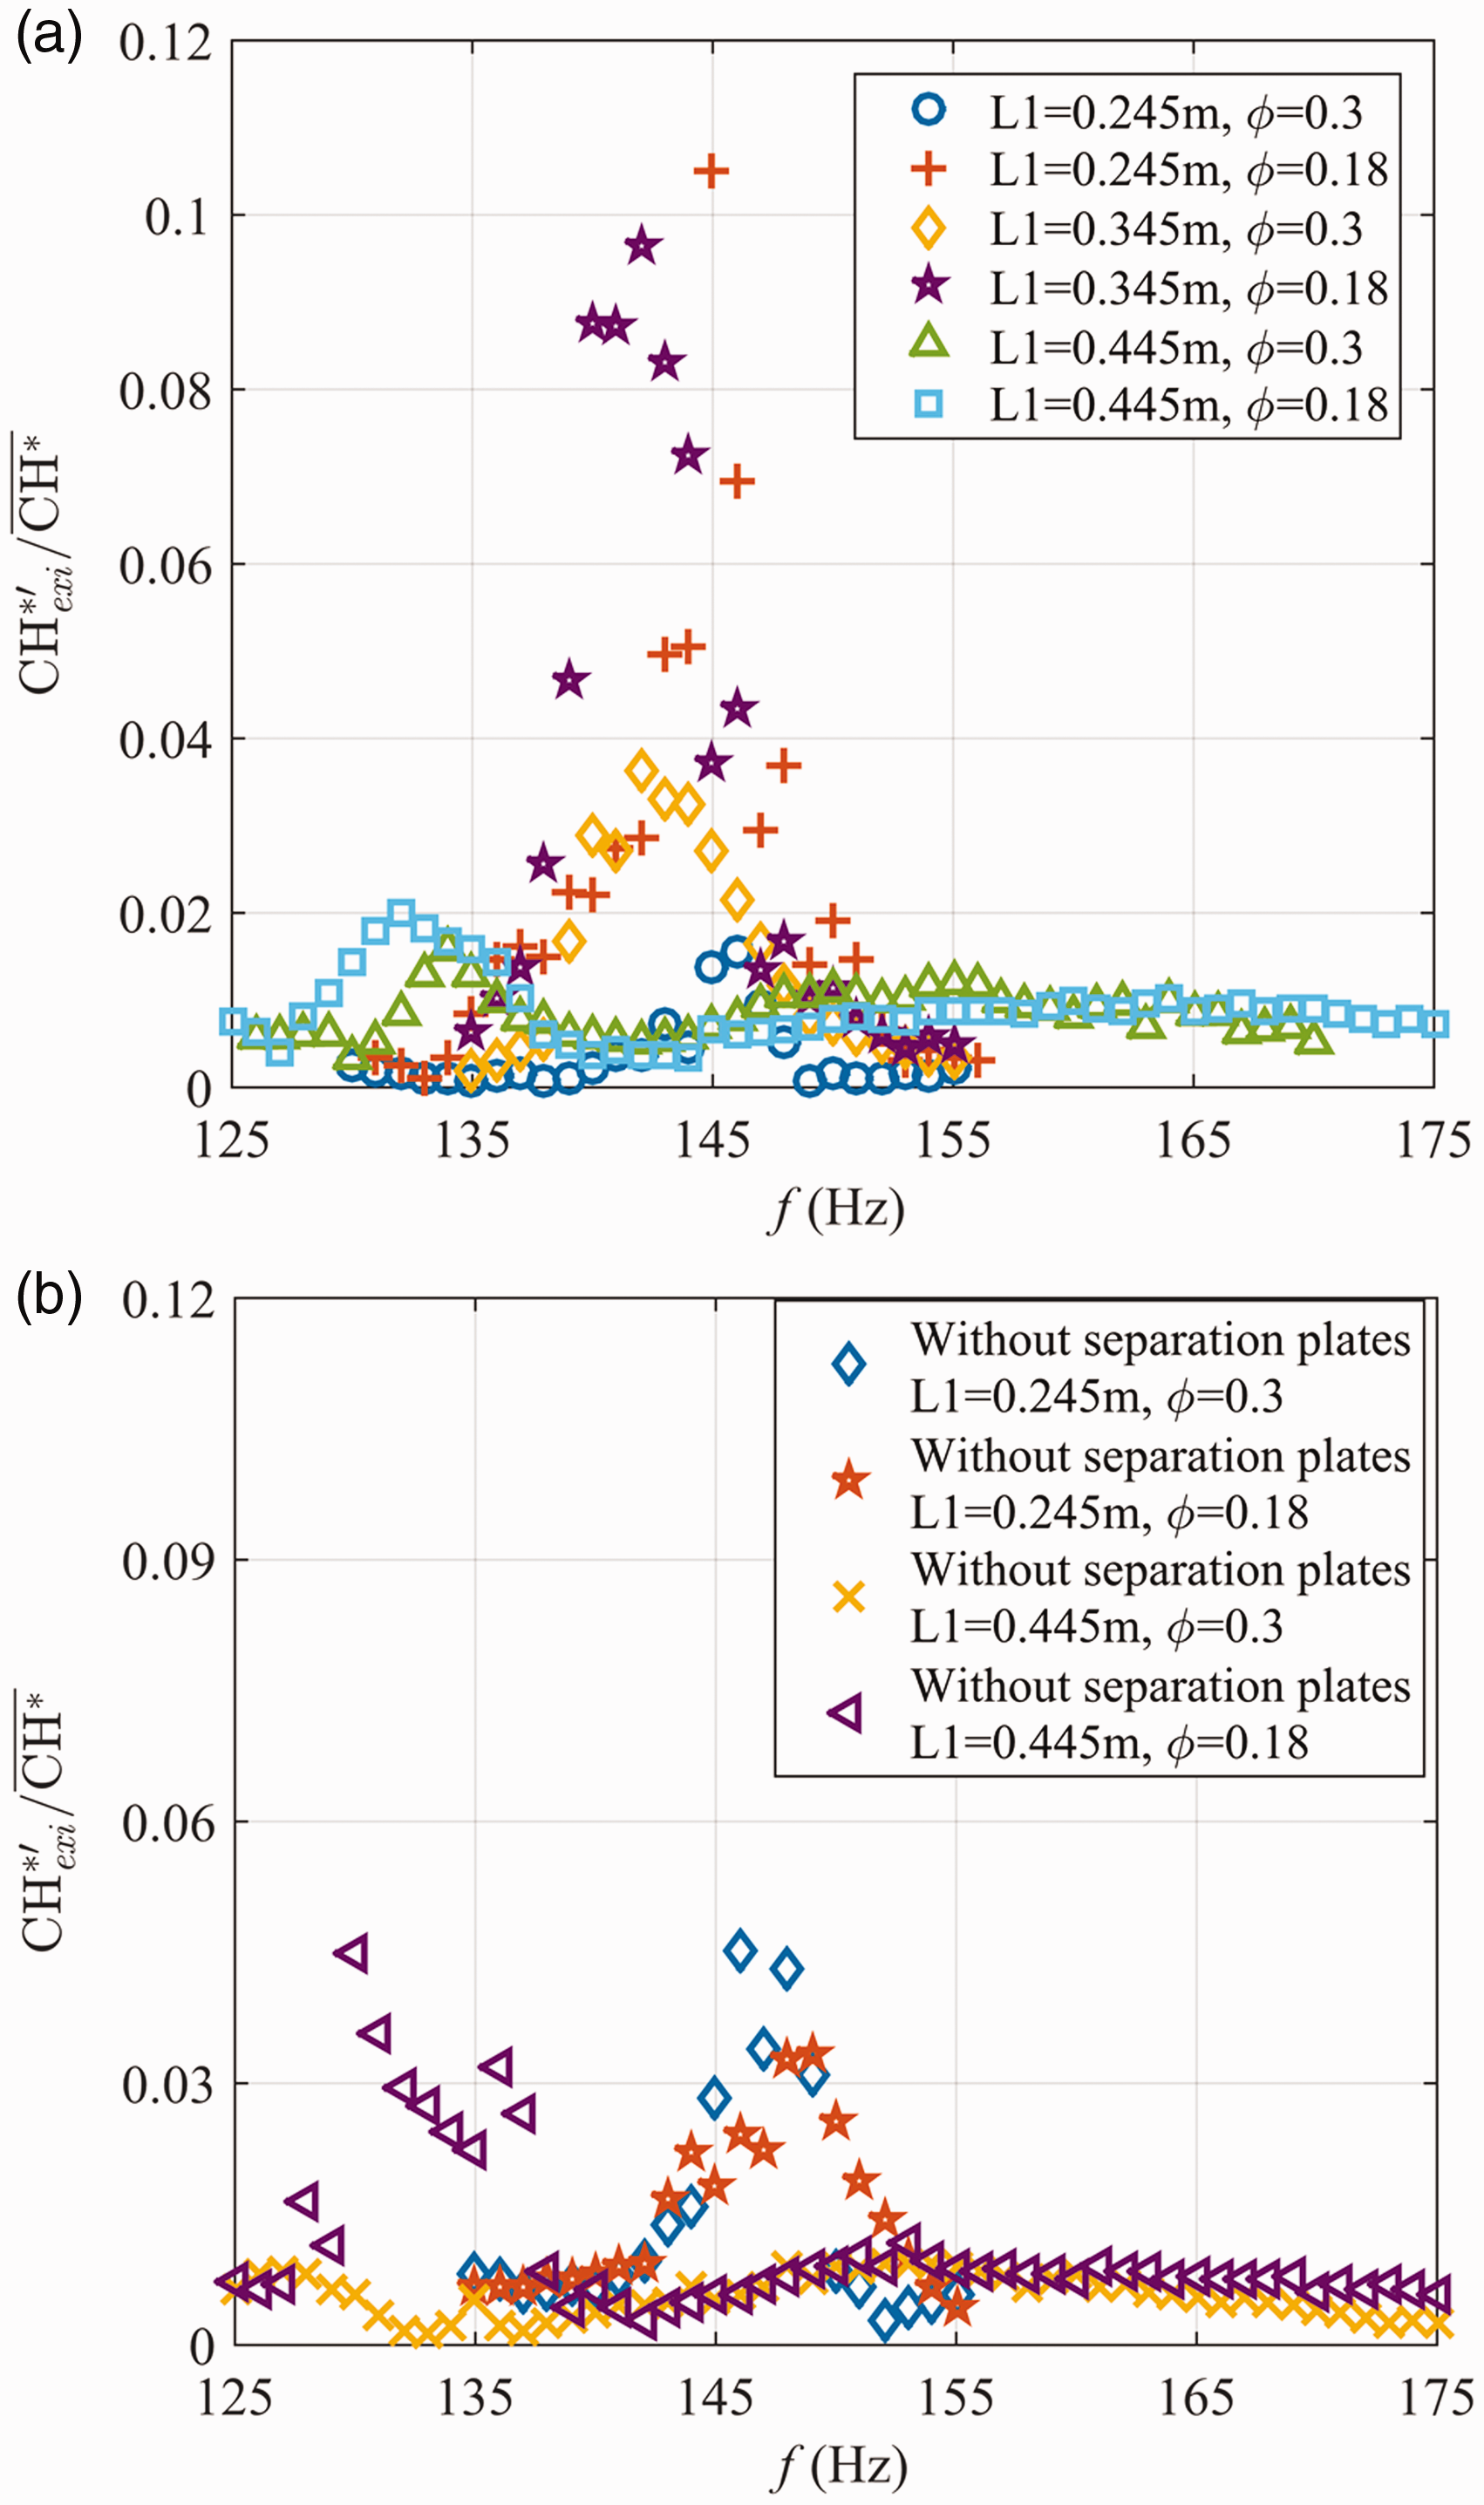
Flame heat release response under 125–175 Hz acoustic forcing: (a) cases with separation plates installed and (b) cases without separation plates installed.
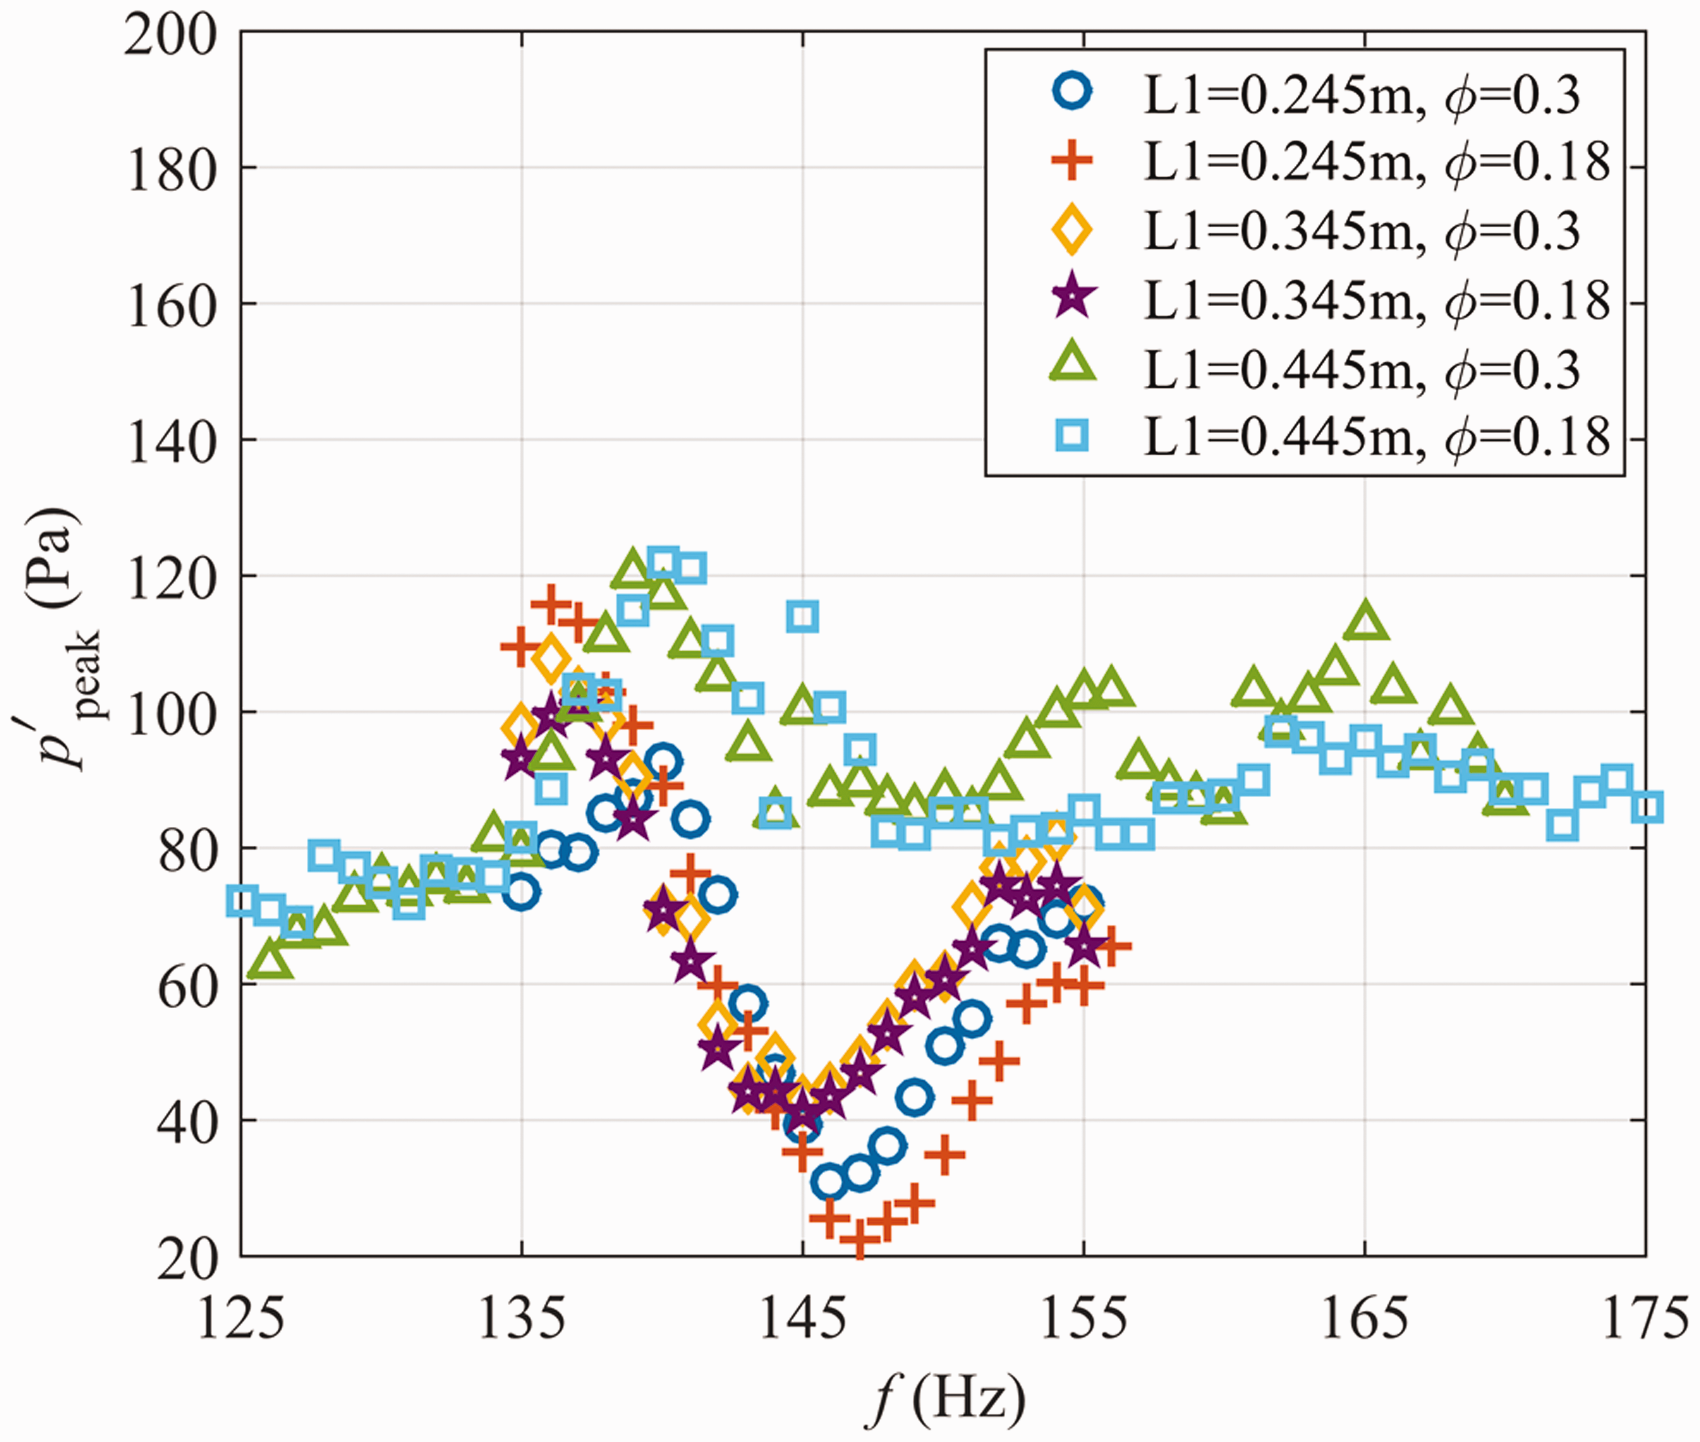
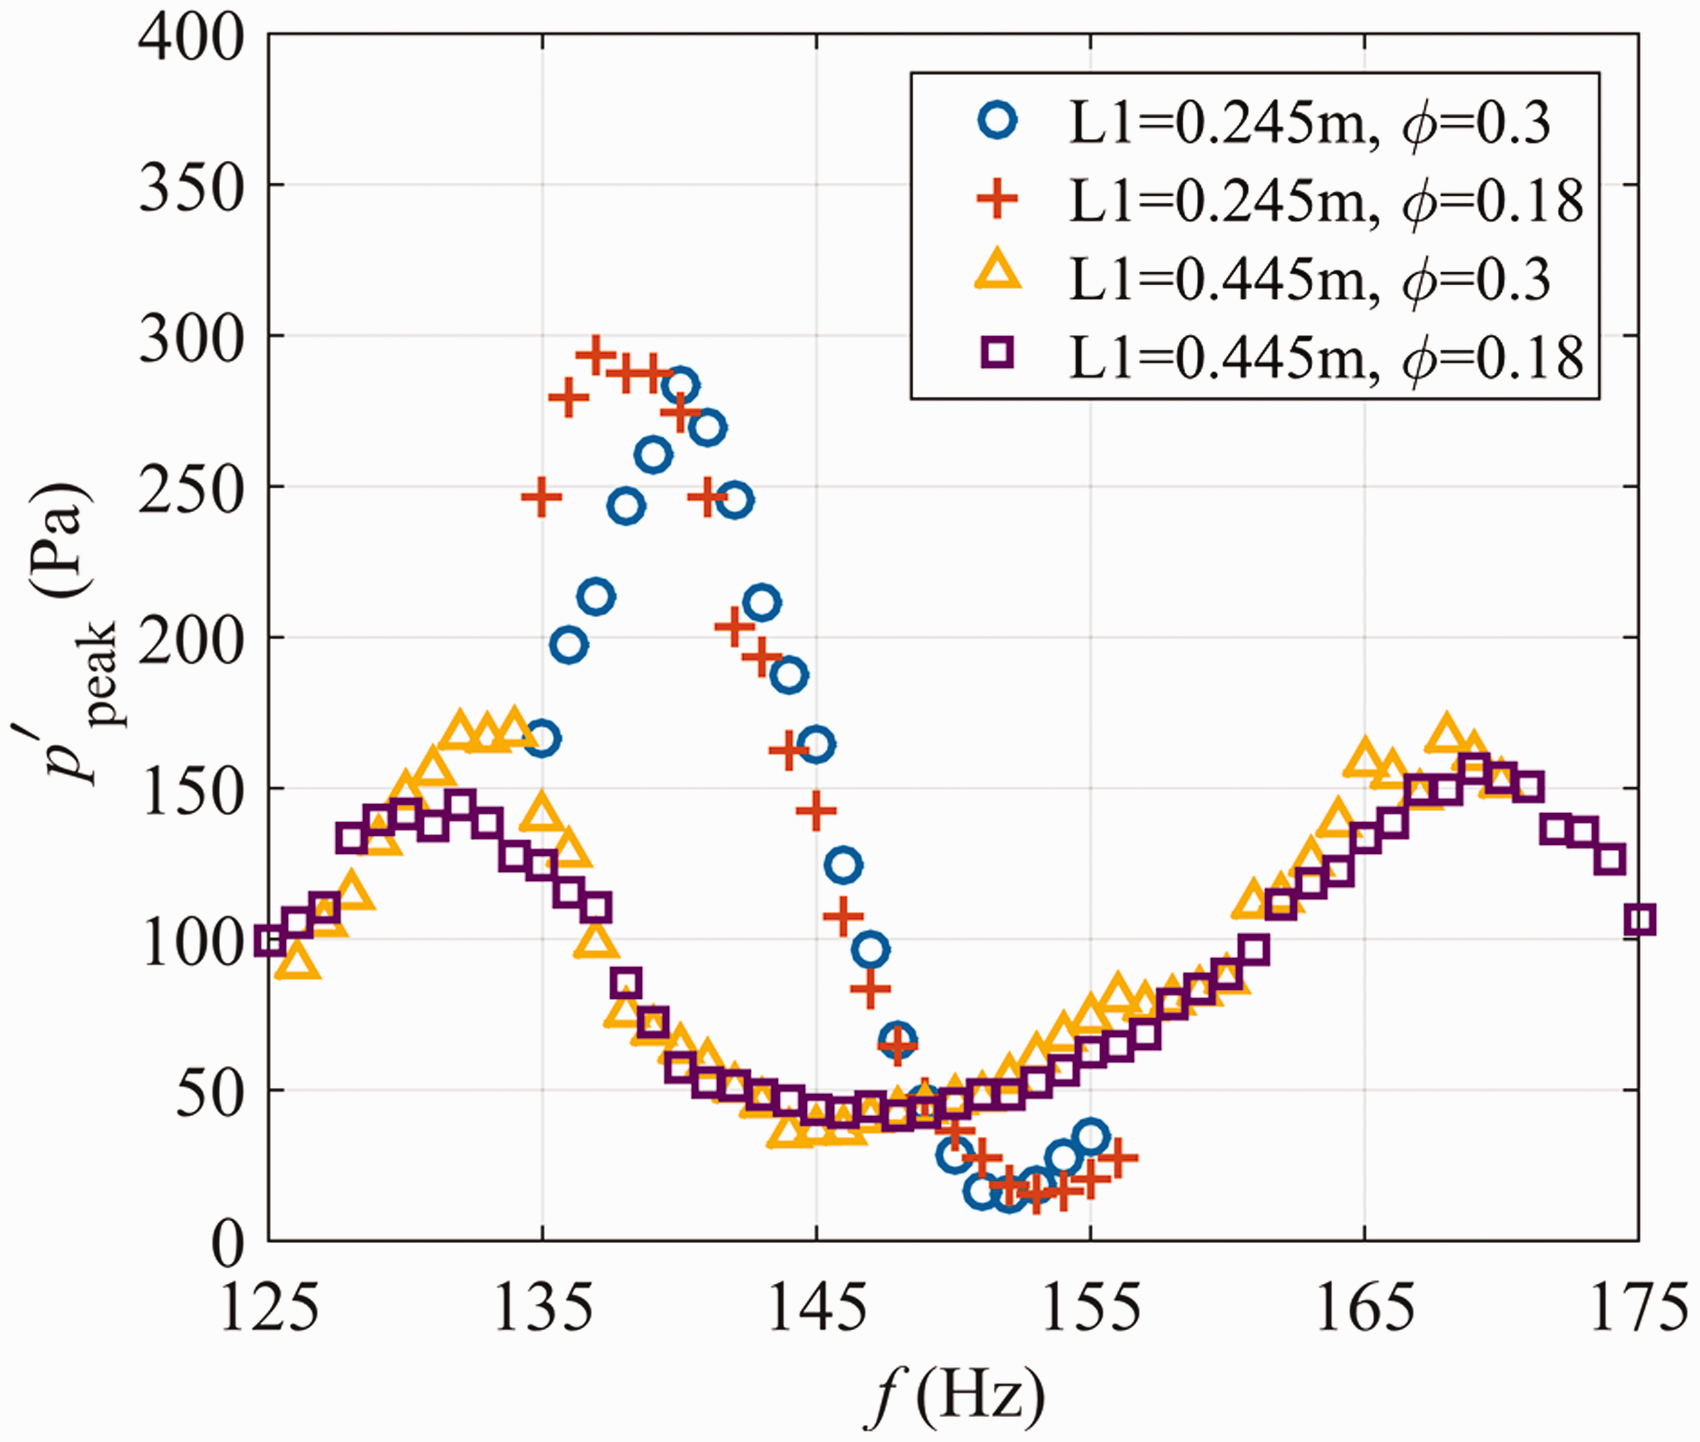
Pressure response in the combustion section under 125–175 Hz acoustic forcing. Separation plates are installed in these cases.
The differences between the pressure response and the flame response under acoustic excitation are the high responsive acoustic modes around 140 Hz (L1 = 0.245 m) and 130 Hz (L1 = 0.445 m); and the existence of separation plates can also have effects on the flame response. To further analyze the influence of inlet length variation and separation plates installation, the flame dynamic behavior is examined in the range of 125–175 Hz acoustic forcing. Figure 6 shows the flame heat-release response under acoustic forcing in the range of 125–175 Hz. The peak heat-release response of 0.245 m inlet length cases is at around 144 Hz. However, in the 0.445 m inlet length cases, the maximum flame response is at around 134 Hz.
Effect of inlet length variation
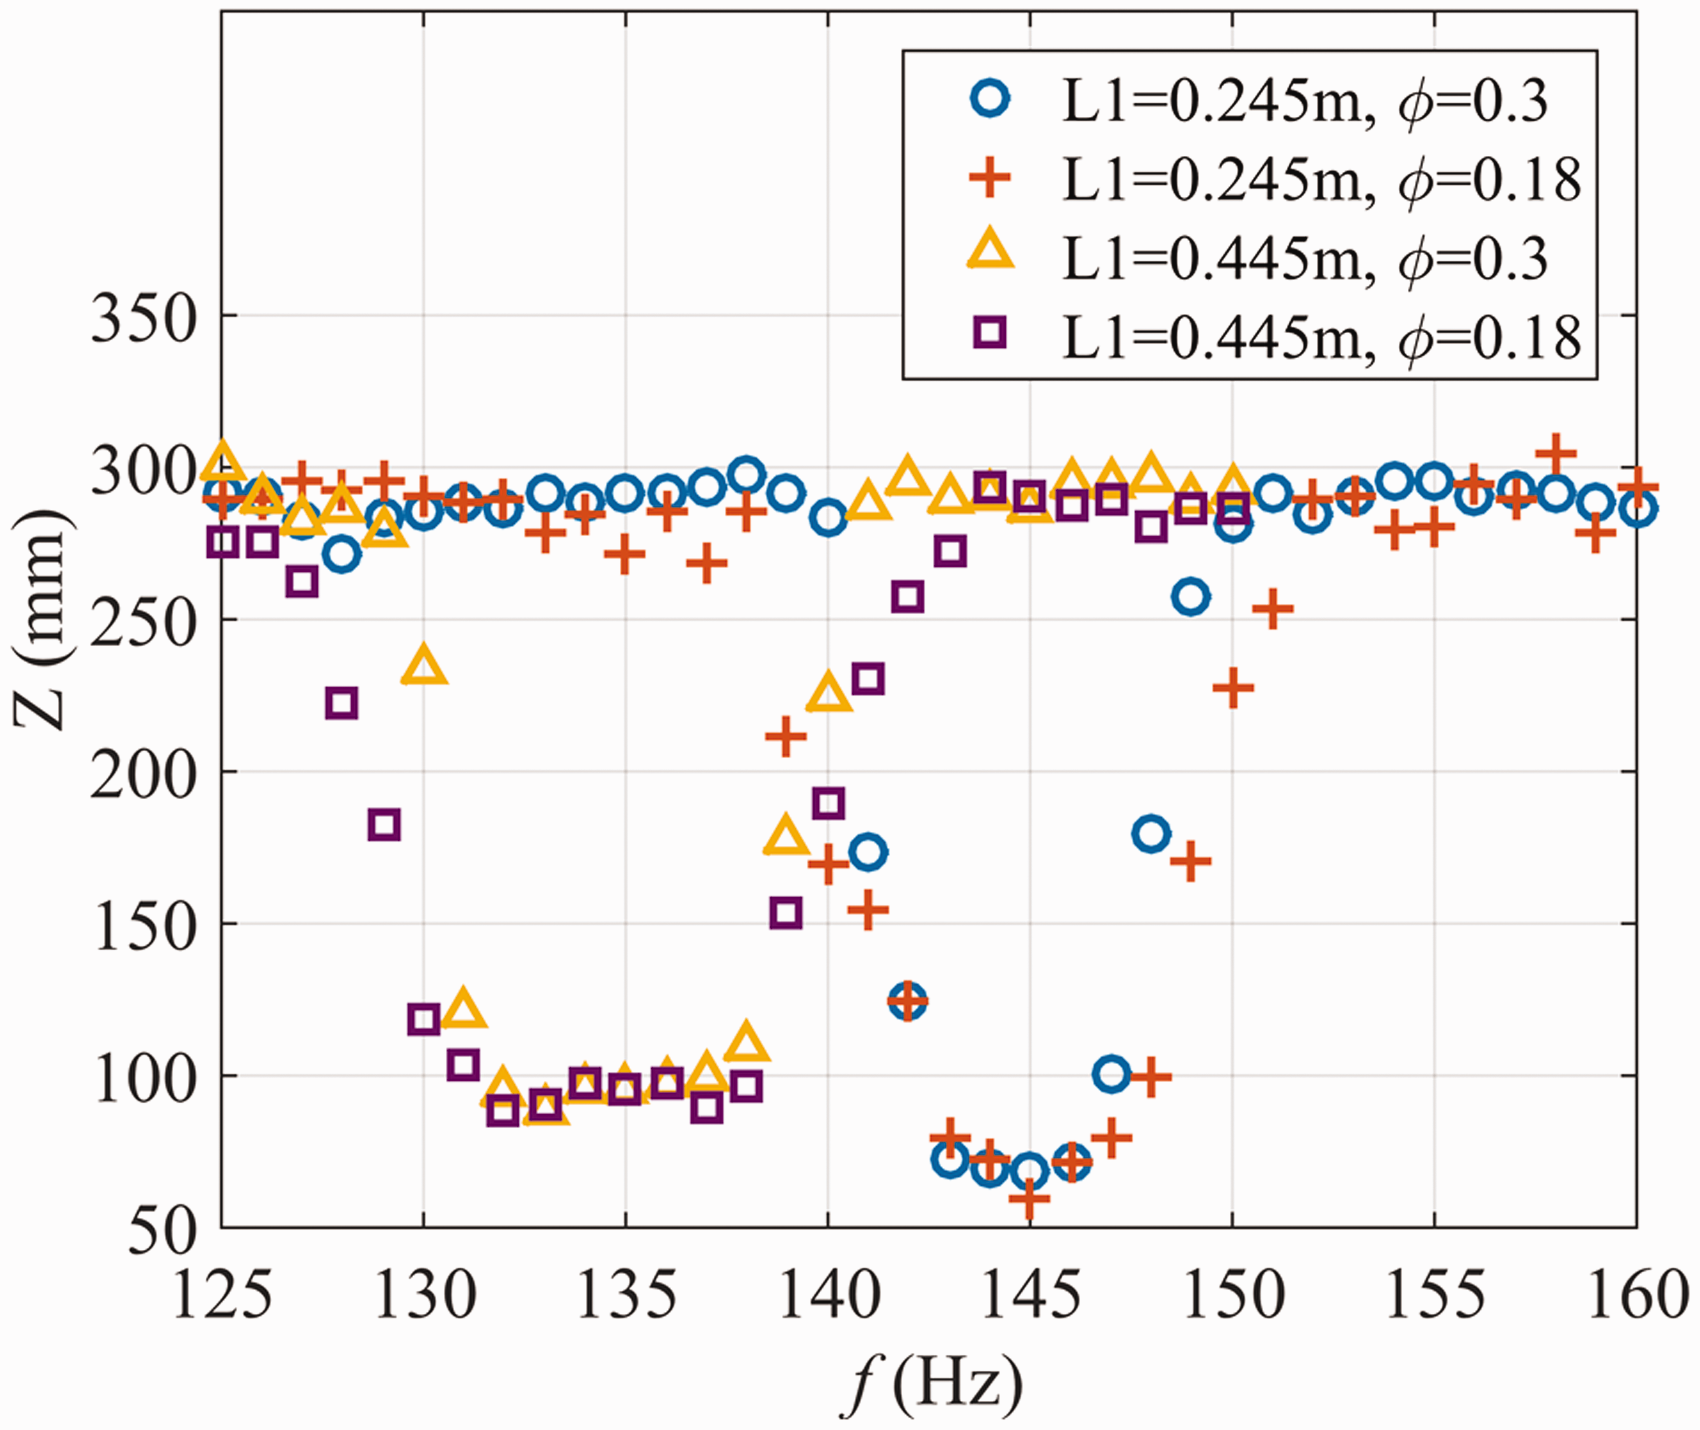
To further explain the different modes at two inlet lengths, the pressure responses at inlet section (P2) and combustion section (P1) are shown in Figures 7 and 8. For the cases of 0.245 m inlet length, the responsive pressure oscillation at both combustion section and inlet section are low at 144 Hz. This illustrates that the 144 Hz mode of high flame response is not the resonant mode of inlet section or combustion section. Due to the high swirl number of inner swirler (S ≍ 0.9), the flame can be stabilized in large amplitude acoustic forcing at 135 Hz for 0.245 m inlet cases. However, the pressure peak oscillation observed in Figure 8 shows a peak value at 134 Hz for 0.445 m inlet length cases. This reveals the reason for high flame response, which comes from the inlet pressure fluctuation.
Pressure response in the air inlet section under 125–175 Hz acoustic forcing. Separation plates are installed in these cases.
To validate this explanation, acoustic mode analysis performed by FEM is presented in Figure 9. In acoustic mode simulation, the mean temperatures in the inlet section and combustion section are set as 300 K and 1400 K, respectively. The average flame temperature was measured with an S-type thermocouple. From Figure 9, we can see that the highly responsive flame behavior in short inlet length cases is due to the fuel pipe resonance mode; and the 134 Hz mode in long inlet length cases is a mixed mode of fuel pipe and inlet section. It means that pressure oscillation in inlet section has an influence on flame response. Compared with 134 Hz and 144 Hz flame response modes, Figure 6 also illustrates that a pure fuel pipe resonant mode has a more significant impact on flame dynamic. Moreover, lower equivalence ratio in both cases leads to higher flame heat release fluctuation since the larger airflow rates tend to blow off the flame.
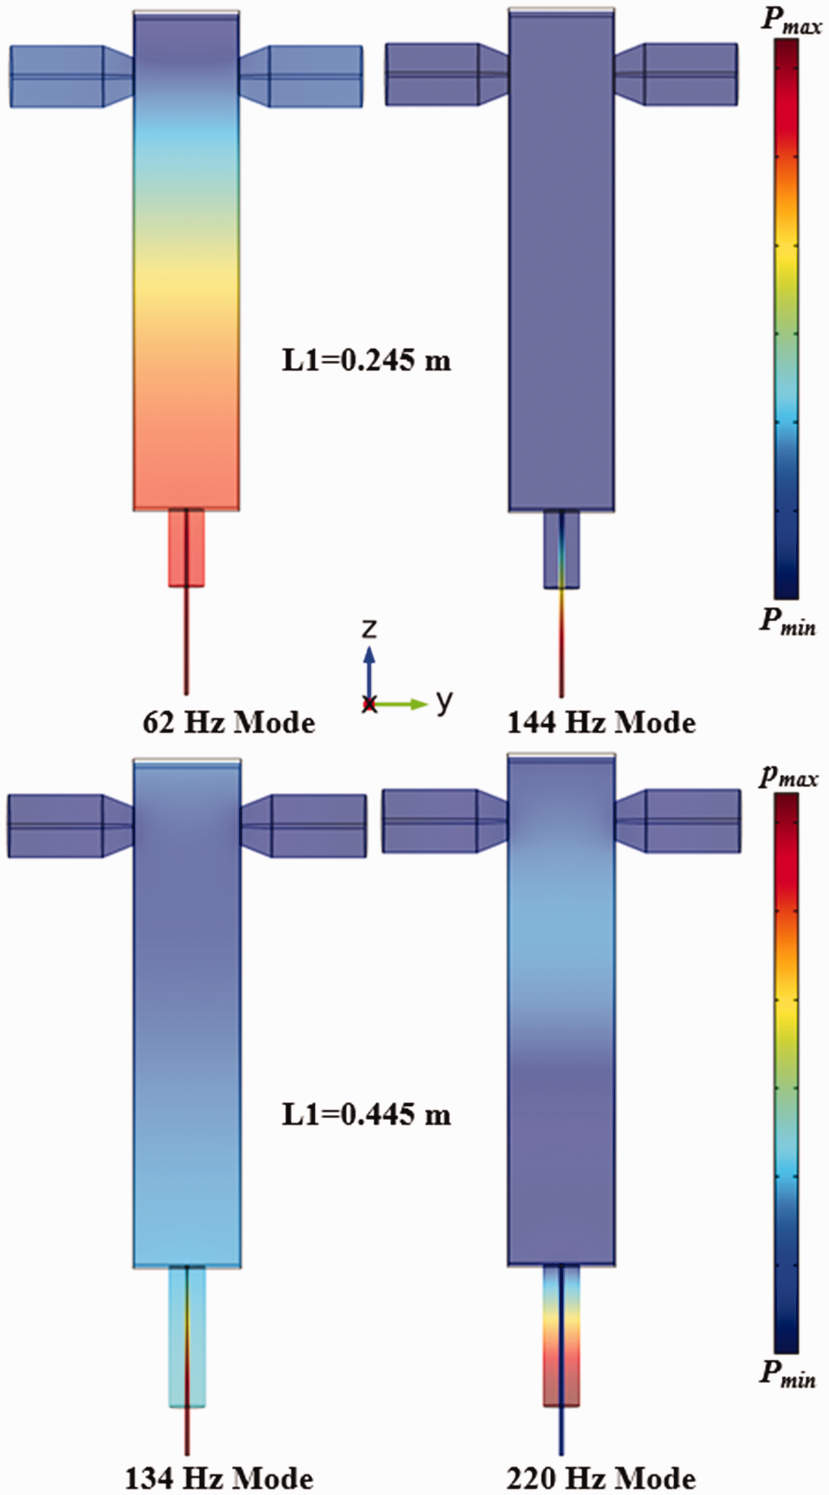
Acoustic modes for inlet length 0.245 m and 0.445 m. The red and blue colors denote the maximum and minimum normalized pressure oscillation.
Figures 10 and 11 show the phase-lock direct flame images and phase-averaged CH* chemiluminescence images with separation plates. The phase-averaged CH* filtered images are obtained through POD-based phase-averaging method described in section Methodology. A lower intensity of heat-release distribution is observed in the 144 Hz mode averaged CH* chemiluminescence images, which indicates a stronger perturbation of acoustic force acting on fuel pipe resonant mode. The lift-off height of the flame from the burner exit is estimated by grayscale images post-processed form high-speed direct flame images. Then, the 10% intensity threshold is set to get a binary image. The results in Figure 12 show the same flame height trend of 0.245 m and 0.445 m inlet length around 144 Hz and 134 Hz, respectively. The frequency lock-in behavior can also be observed in Figure 12. When the forced frequency near the resonant frequency, the flame behavior of both 134 and 144 Hz mode give a V-shaped curve. As the forced frequency increases or decreases from the resonant mode, the flame return to the unpulsed mode.
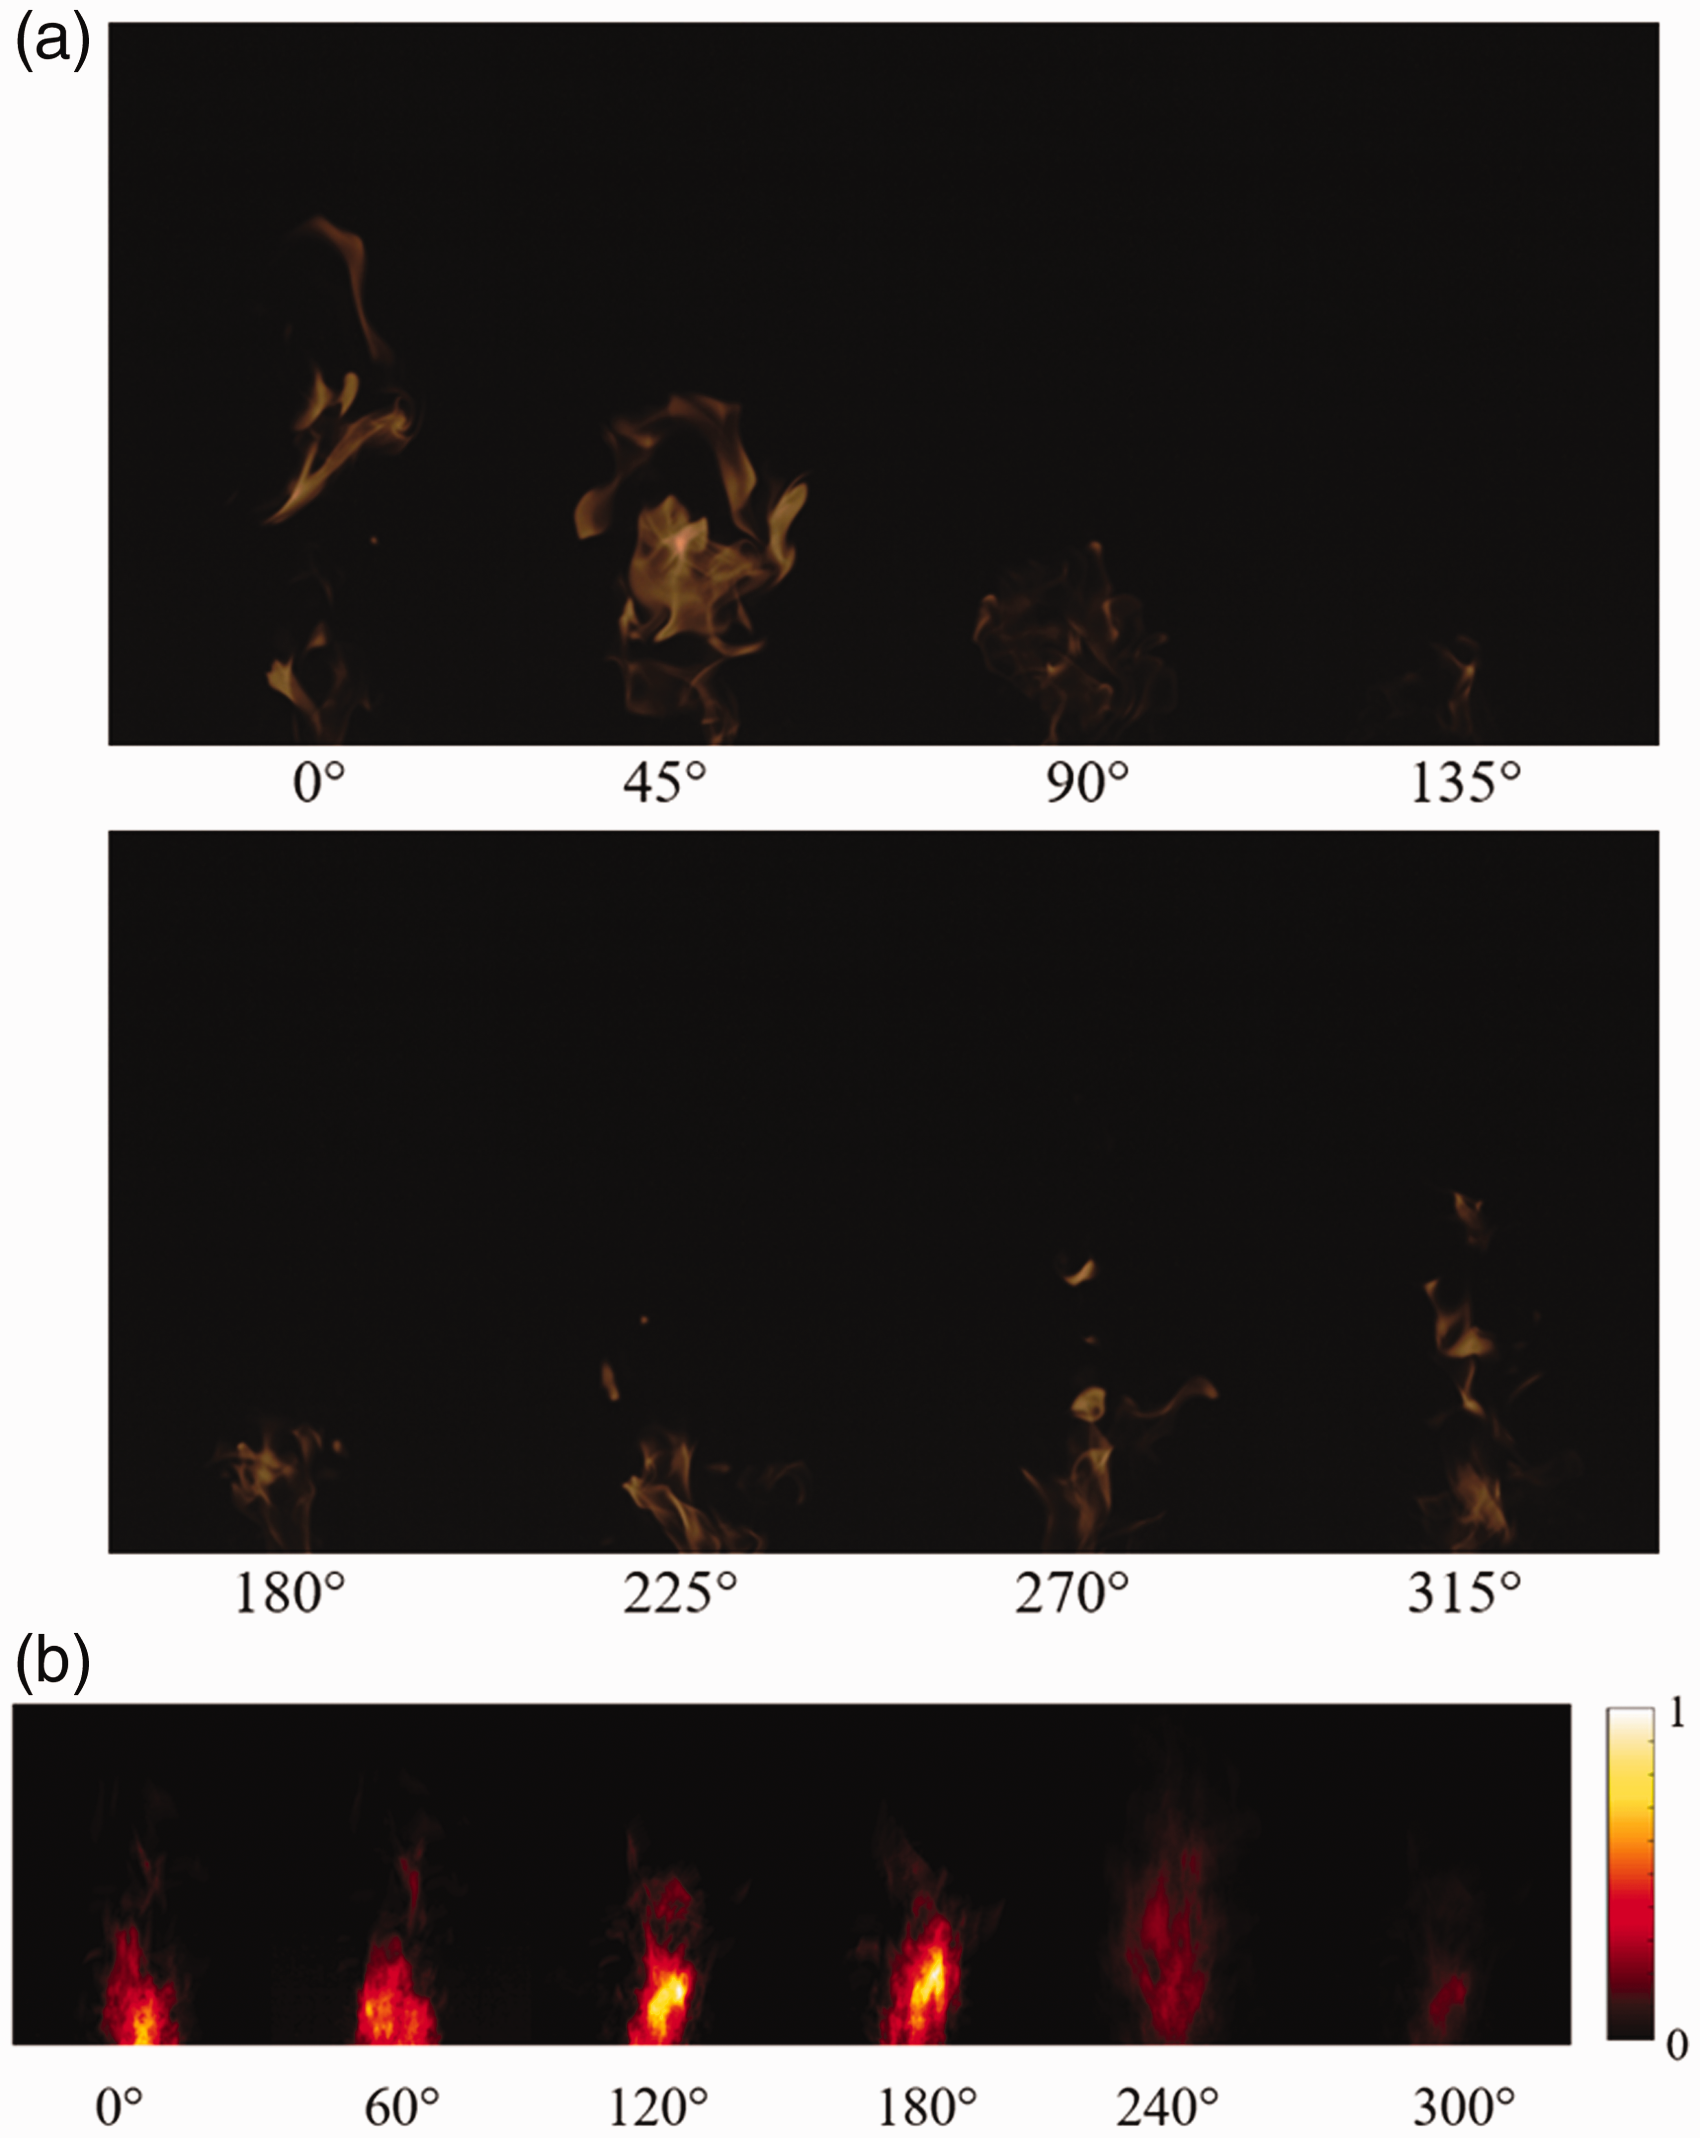
Flame images at 134 Hz (airflow rate, 760 L/min): (a) Phase-lock direct flame images. (b) Phase averaged CH* chemiluminescence images. Separation plates are installed in this case.
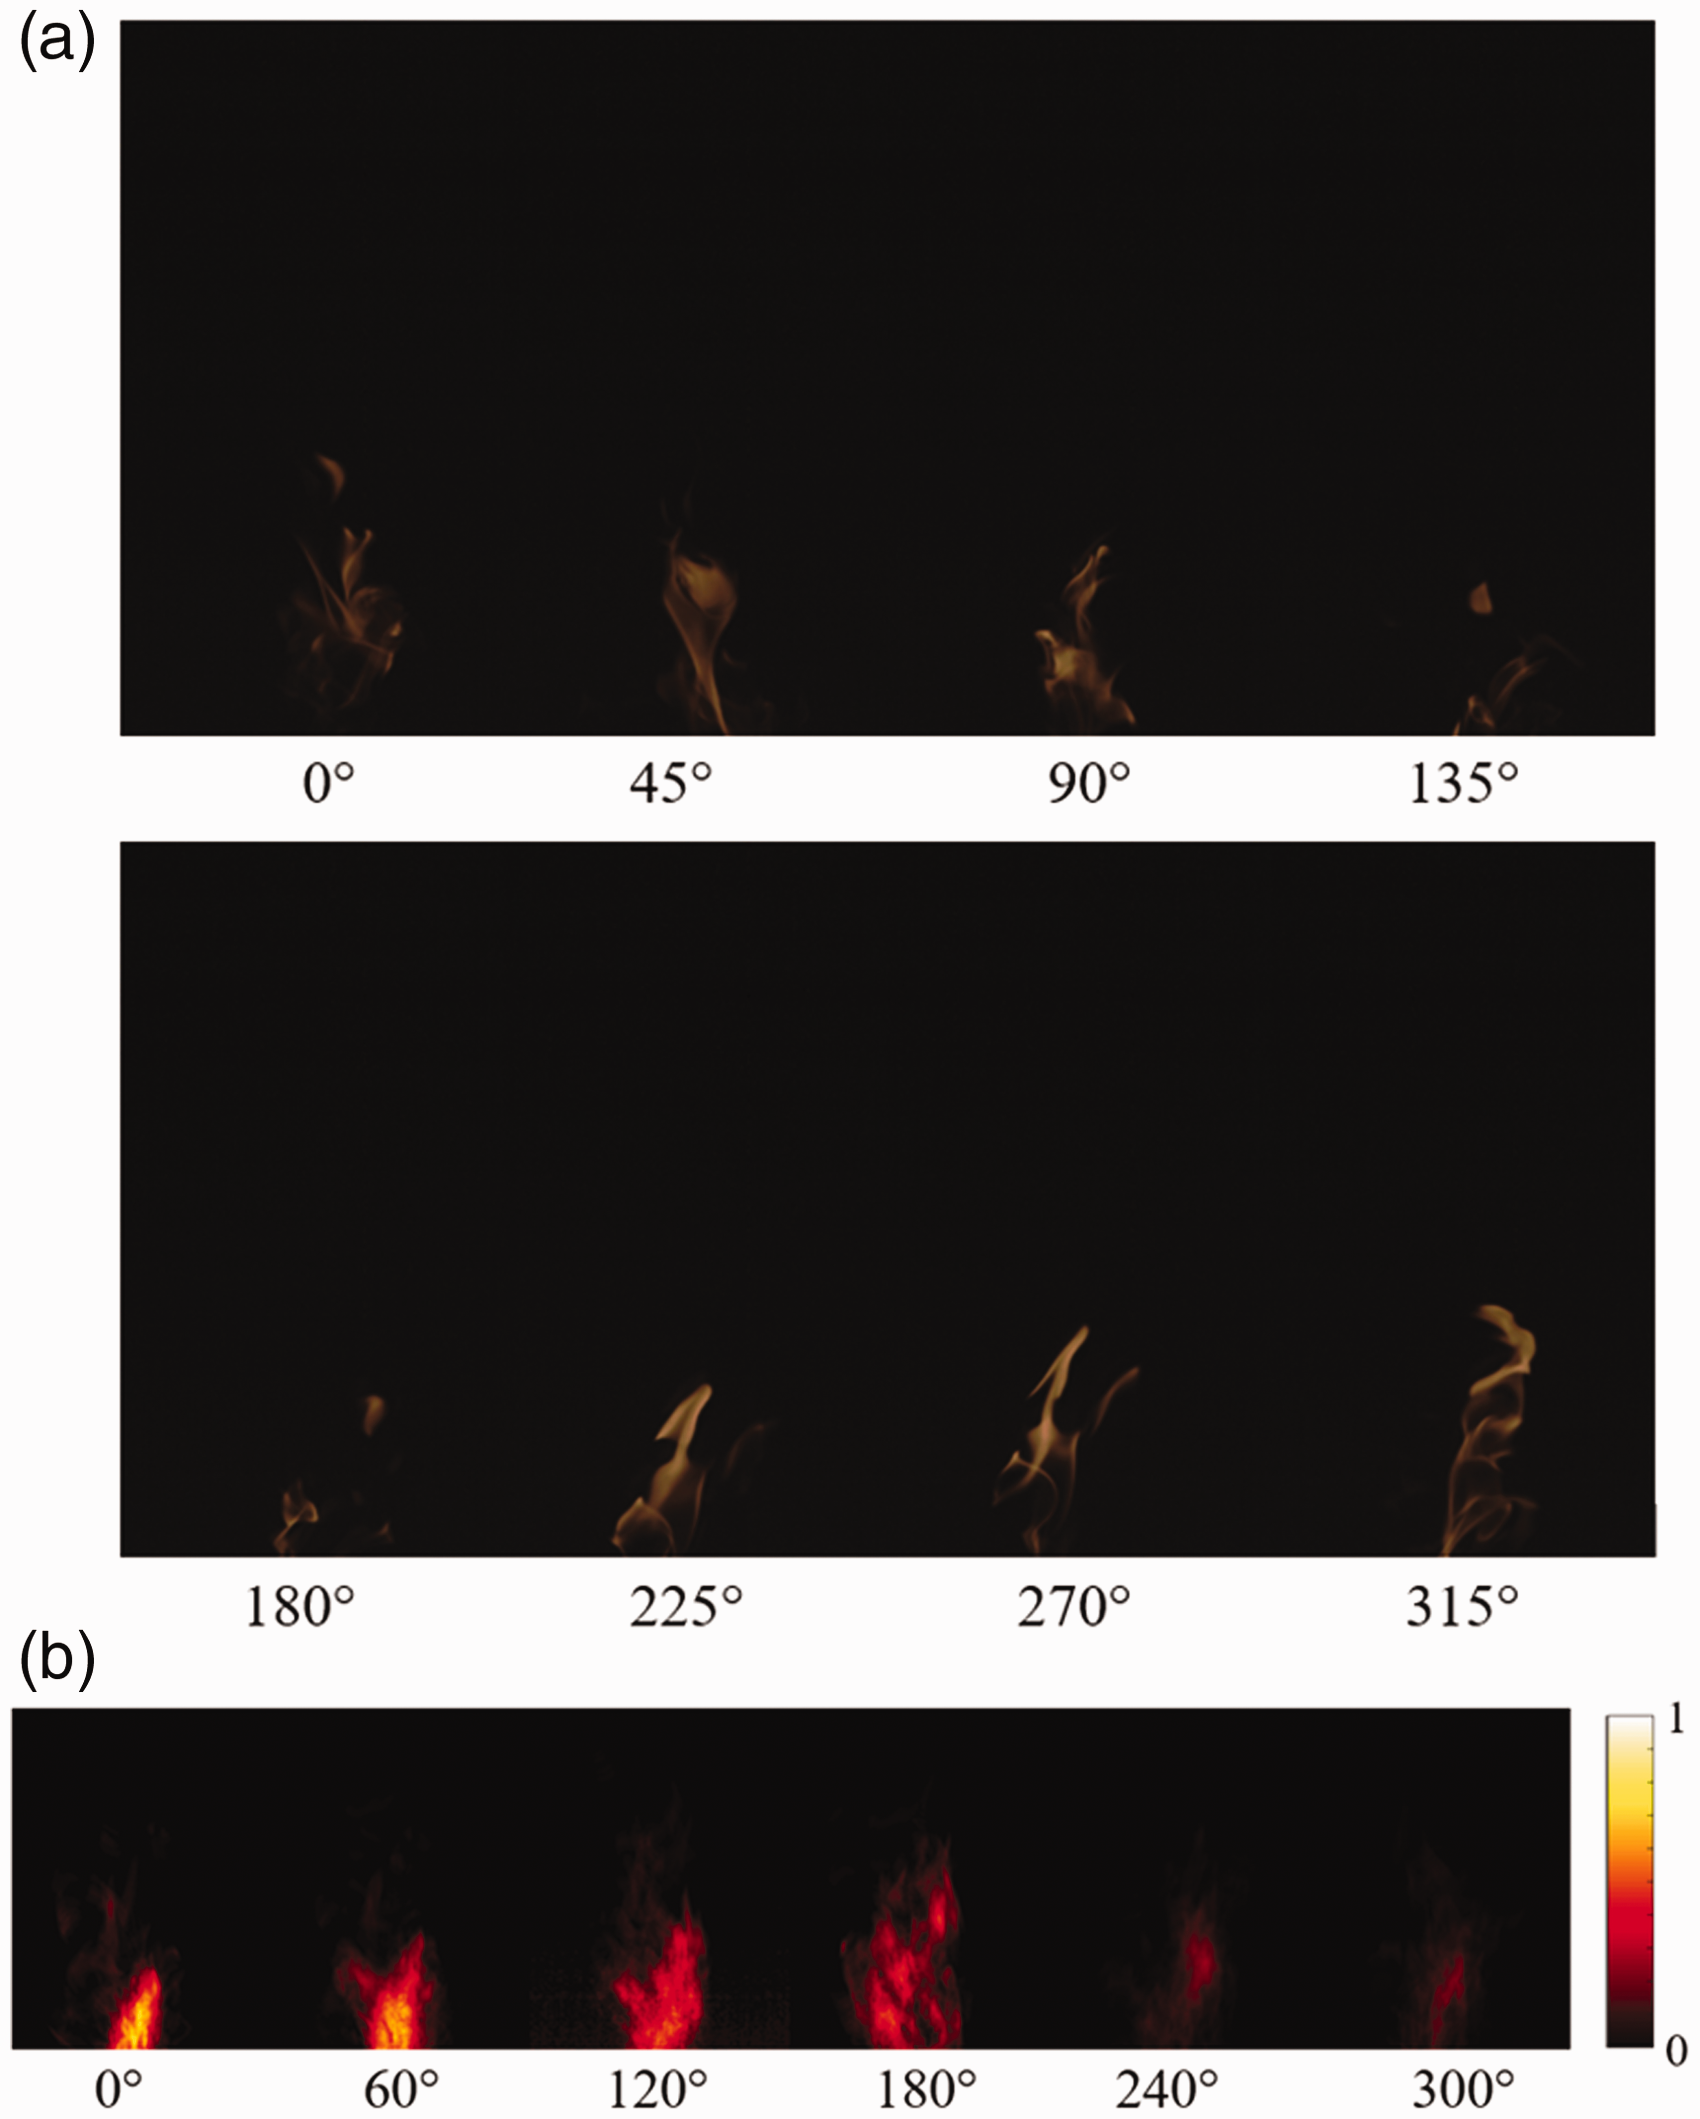
Flame images at 144 Hz (airflow rate, 760 L/min): (a) Phase-lock direct flame images. (b) Phase averaged CH* chemiluminescence images. Separation plates are installed in this case.
Flame length variation under 125–160 Hz acoustic forcing. Separation plates are installed in these cases.
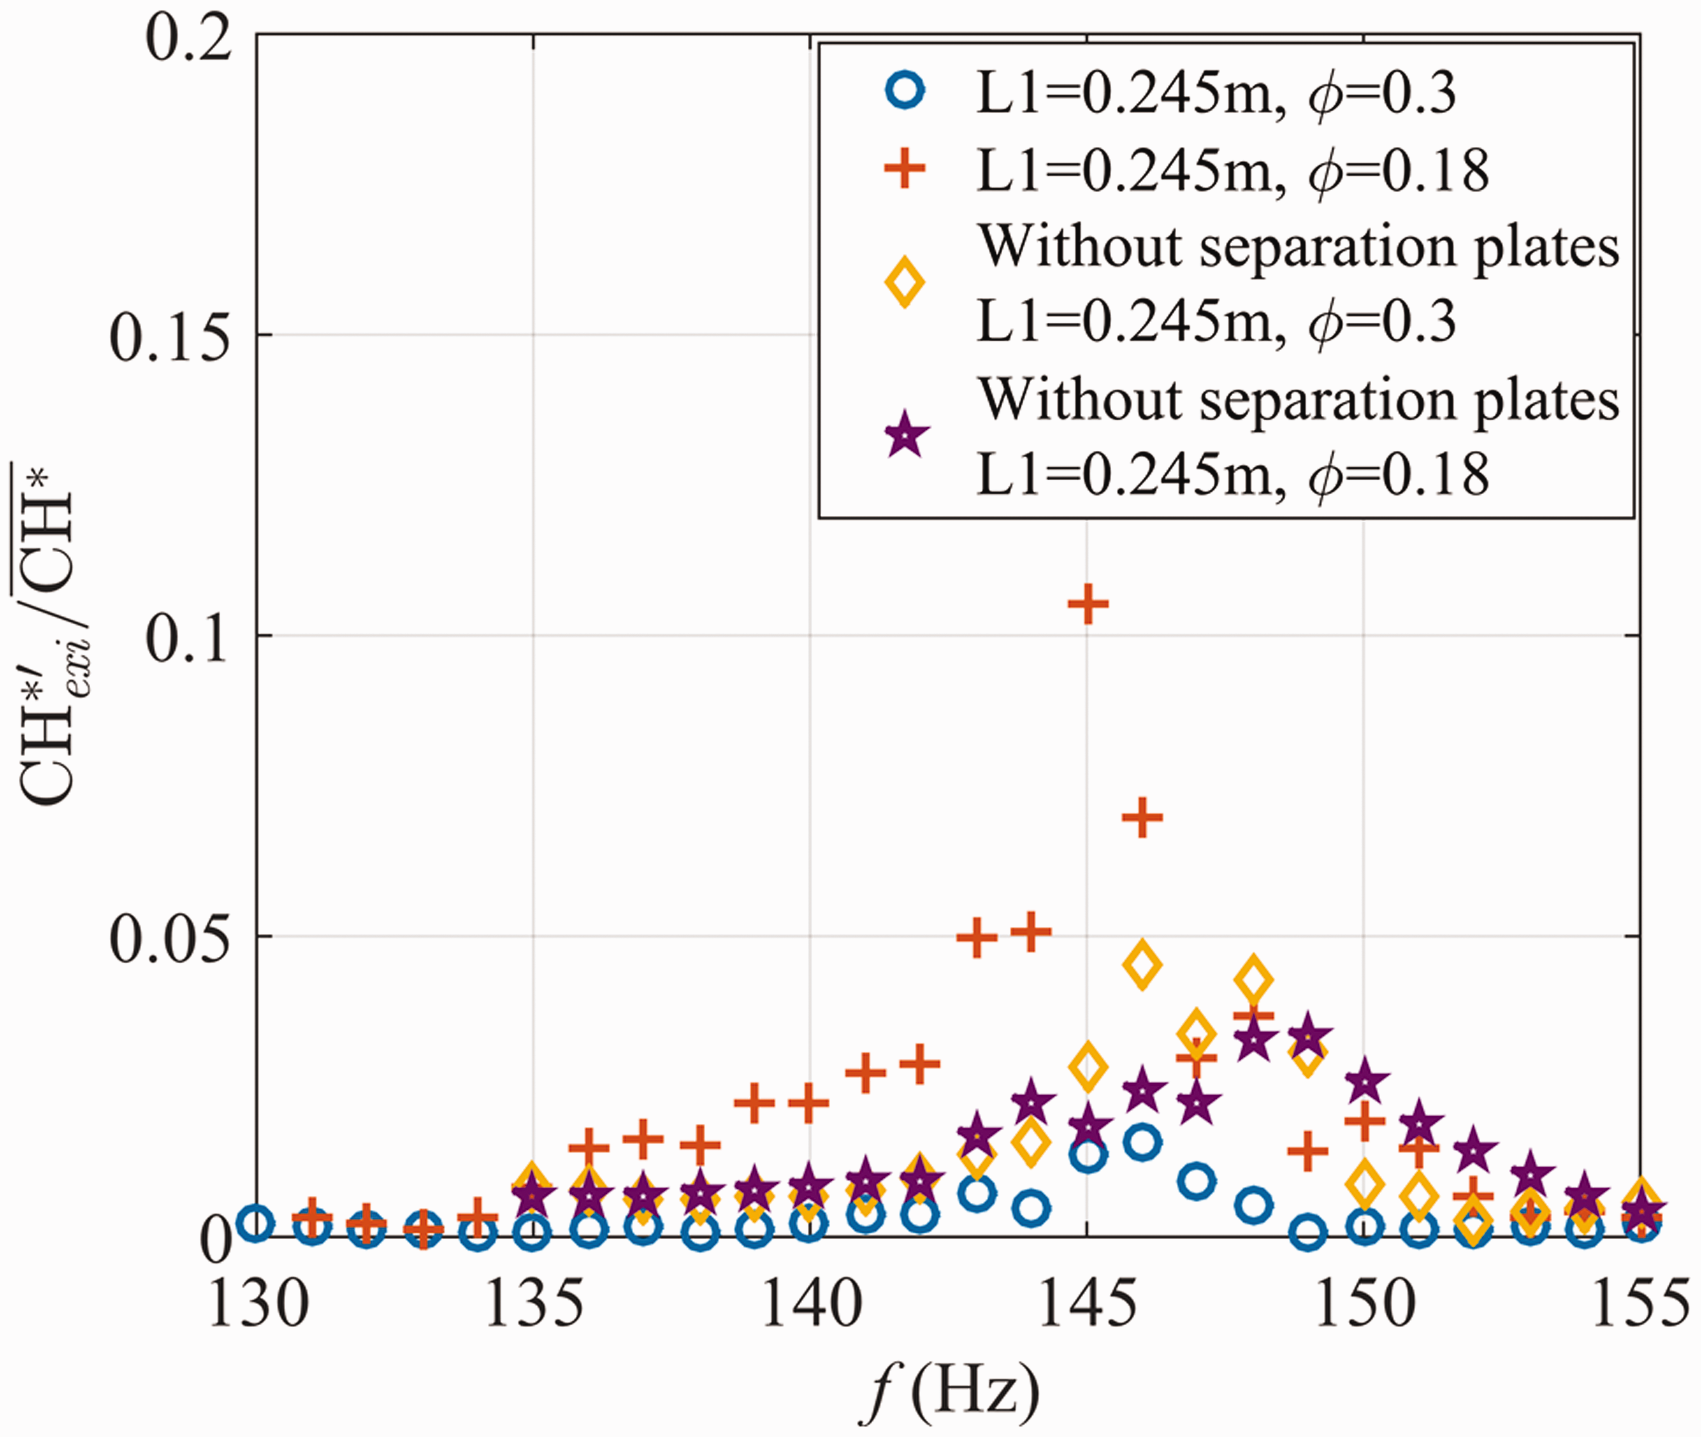
Effect of separation plates
Figure 13 shows that the cancelling of separation plates has little effect on flame heat release fluctuation since the 144 Hz flame response is controlled by the fuel pipe acoustic mode in the 0.245 m inlet length cases. Moreover, the lower global equivalence ratio (airflow rate, 1270 L/min) leads to a higher sensitivity of flame behavior with separation plates installed. On the contrary, in the 0.445 m inlet length cases, the flame behavior shows a complicated flame heat-release response in Figure 14. The removing of separation plates in 760 L/min airflow condition leads to a stable flame response near 134 Hz while a higher flame heat release fluctuation in 1270 L/min airflow condition. Further evidence can be found in flame length variation in Figure 15. Significant increasing of flame length is observed in the condition of 760 L/min airflow without separation plates, and that is close to the unpulsed mode results. One possible explanation of stronger flame response at 134 Hz in 1270 L/min airflow condition without separation plates and 144 Hz in 1270 L/min airflow condition with separation plates is that at low equivalence ratio condition the local mixing of fuel and air is more easily influenced by the hydrodynamic instability near the burner exit under acoustic forcing.49,50 However, this guess needs to be further validated.
Flame heat release response at 0.245 m inlet length under 130–155 Hz acoustic forcing.
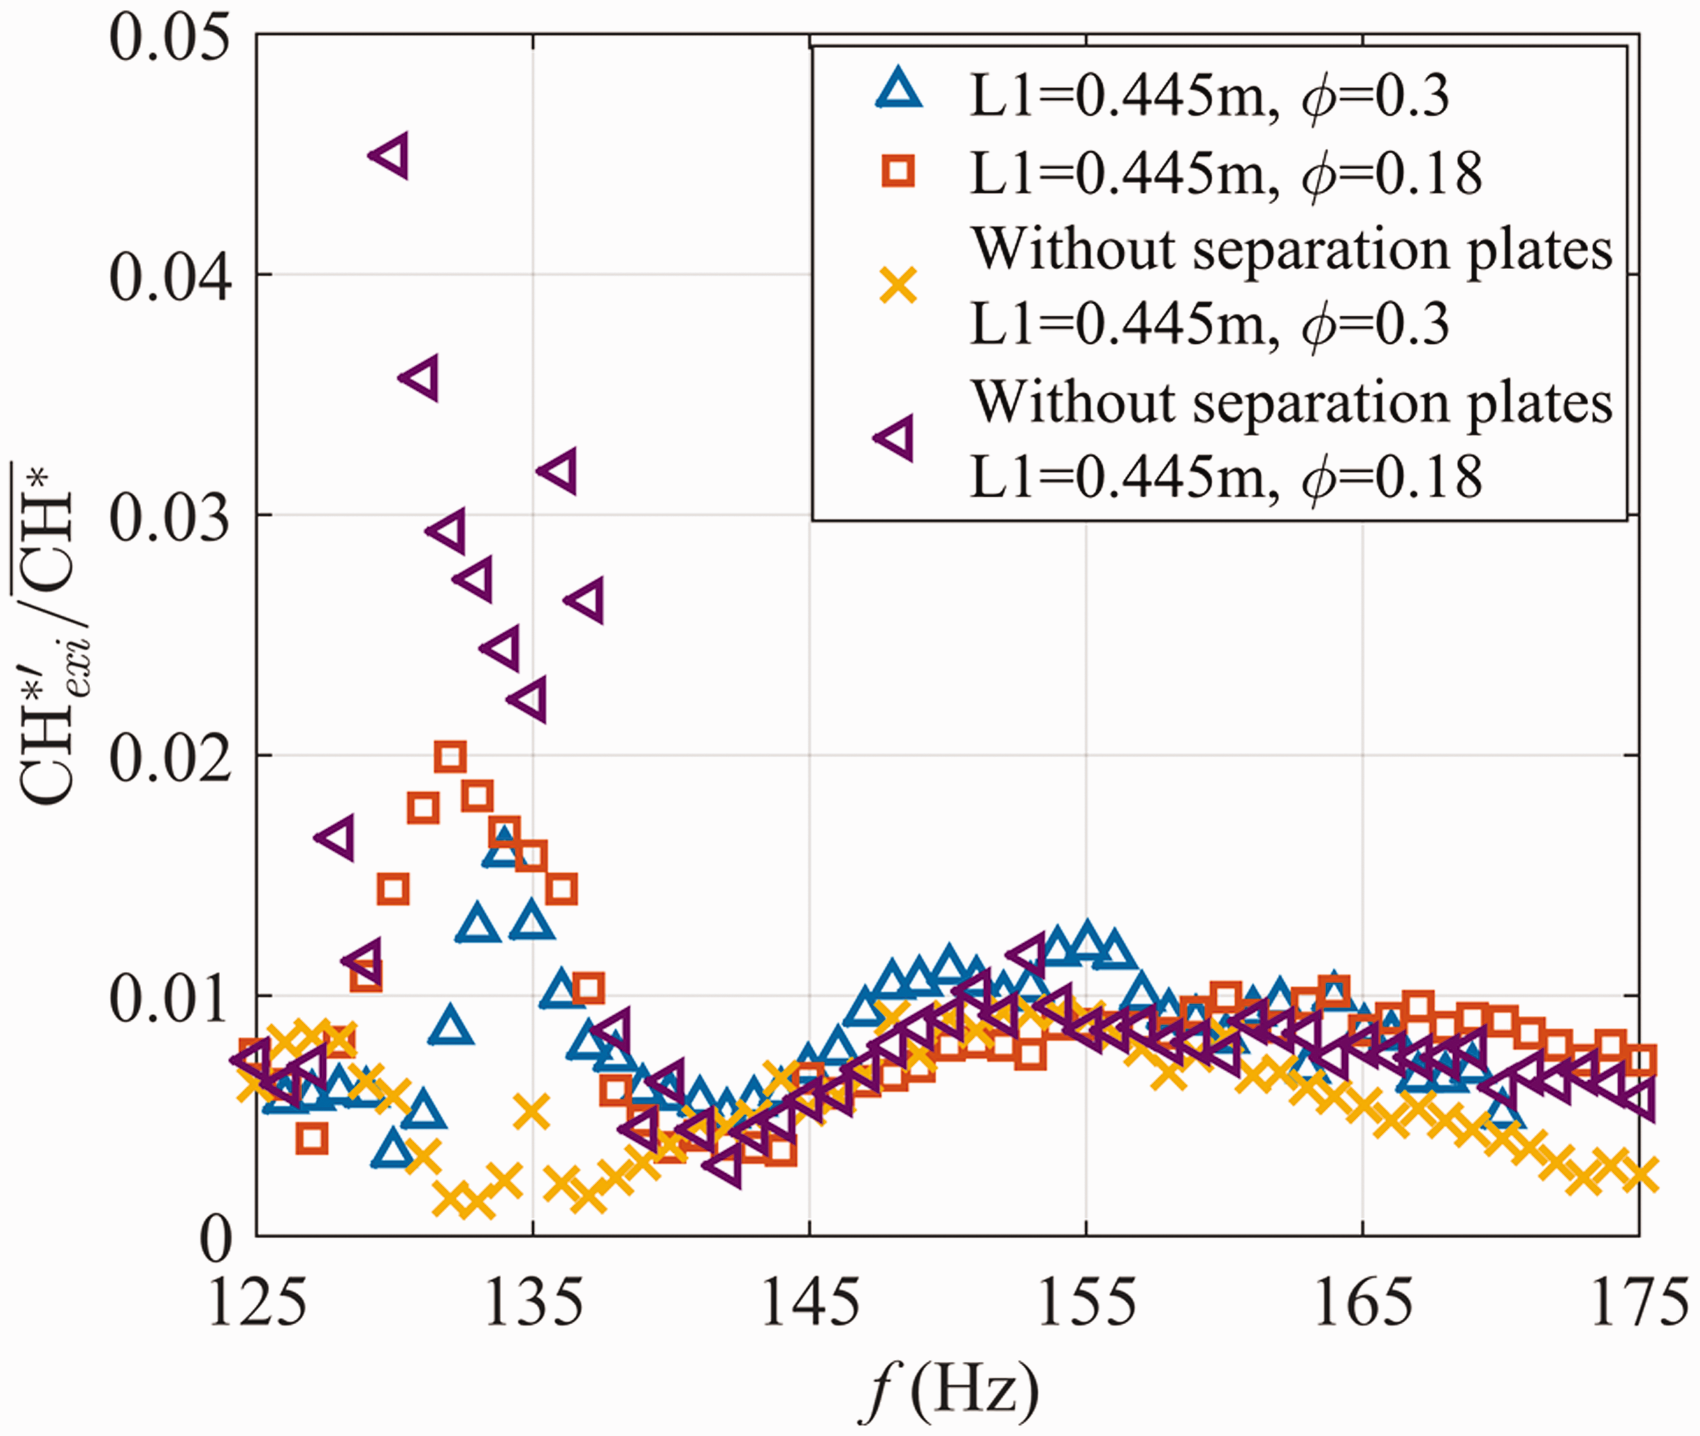
Flame heat release response at 0.445 m inlet length under 125–175 Hz acoustic forcing.
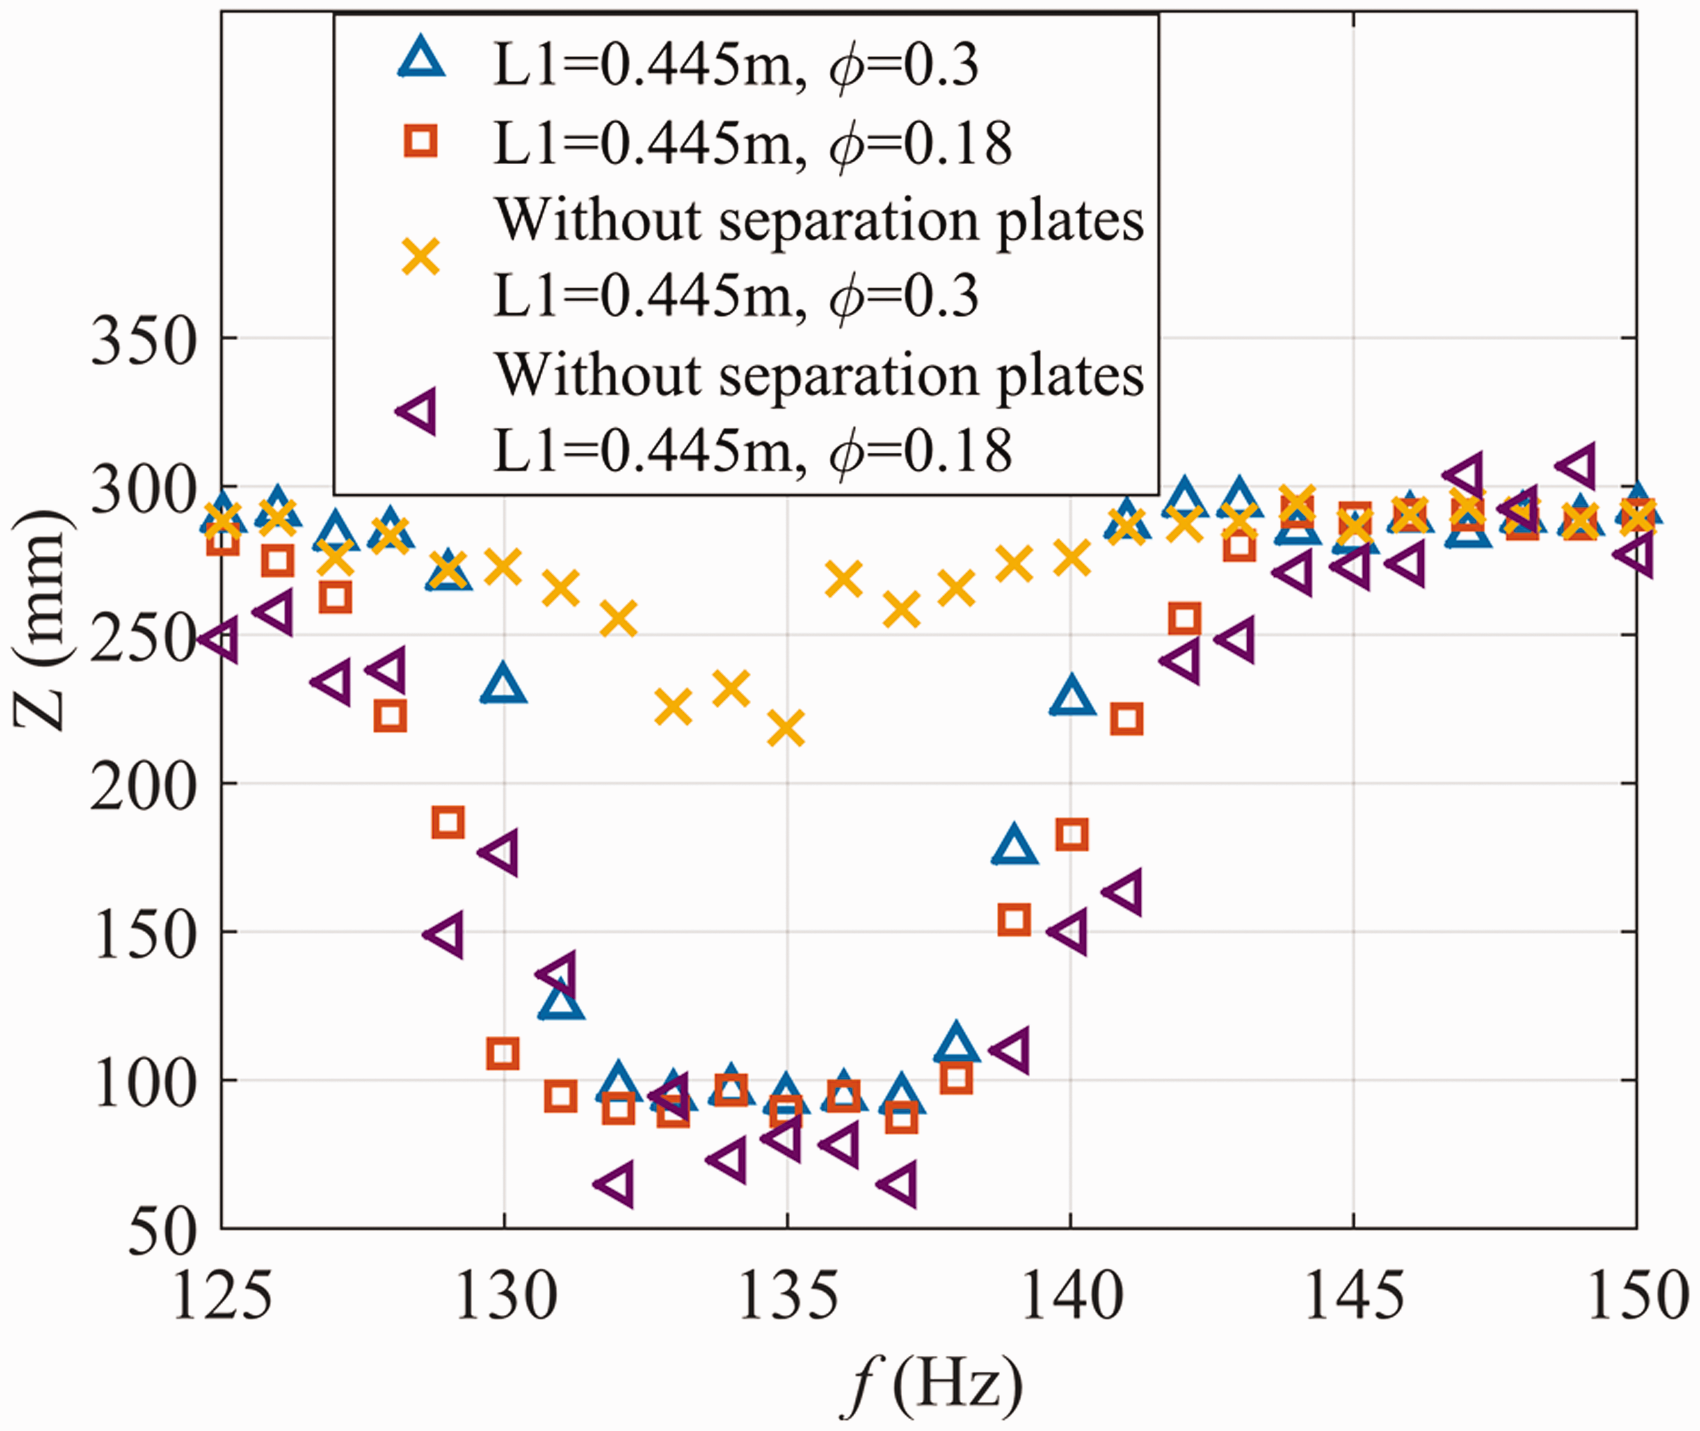
Flame length variation at the 0.445 m inlet length under 125–150 Hz acoustic forcing.
Nonlinear pressure response
For the acoustic excitation frequency smaller than the quarter-wave mode 60 Hz along the Z-direction of the combustion chamber, the combustion chamber pressure spectrum shows that flame responds to the excitation frequency and its multiplicated frequency occurs, as shown in Figure 16. For the cases of acoustic excitation close to the quarter-wave mode, the response of the flame is the same as the excitation frequency, as shown in Figure 17. This result is similar to the result of Balusamy et al. 27 When the excitation frequency of the acoustic field is higher than the quarter-wave mode, the nonlinear flame responses appear at both the forced pressure response and the quarter-wave mode (Figure 18). From Figure 18, it can be seen that the resonant mode of the flame is near 62 Hz and the flame dynamics are controlled by the forced acoustic mode and the resonant mode of the combustion chamber simultaneously. One reason for causing the nonlinear pressure response in this swirled non-premixed flame is that the flame is more sensitive to low-frequency acoustic forcing and the main flame dynamic is controlled by the forcing frequency. While in the high-frequency forcing, the effect of eternal acoustic exciting is less, and the flame self-instability frequency is revealed.
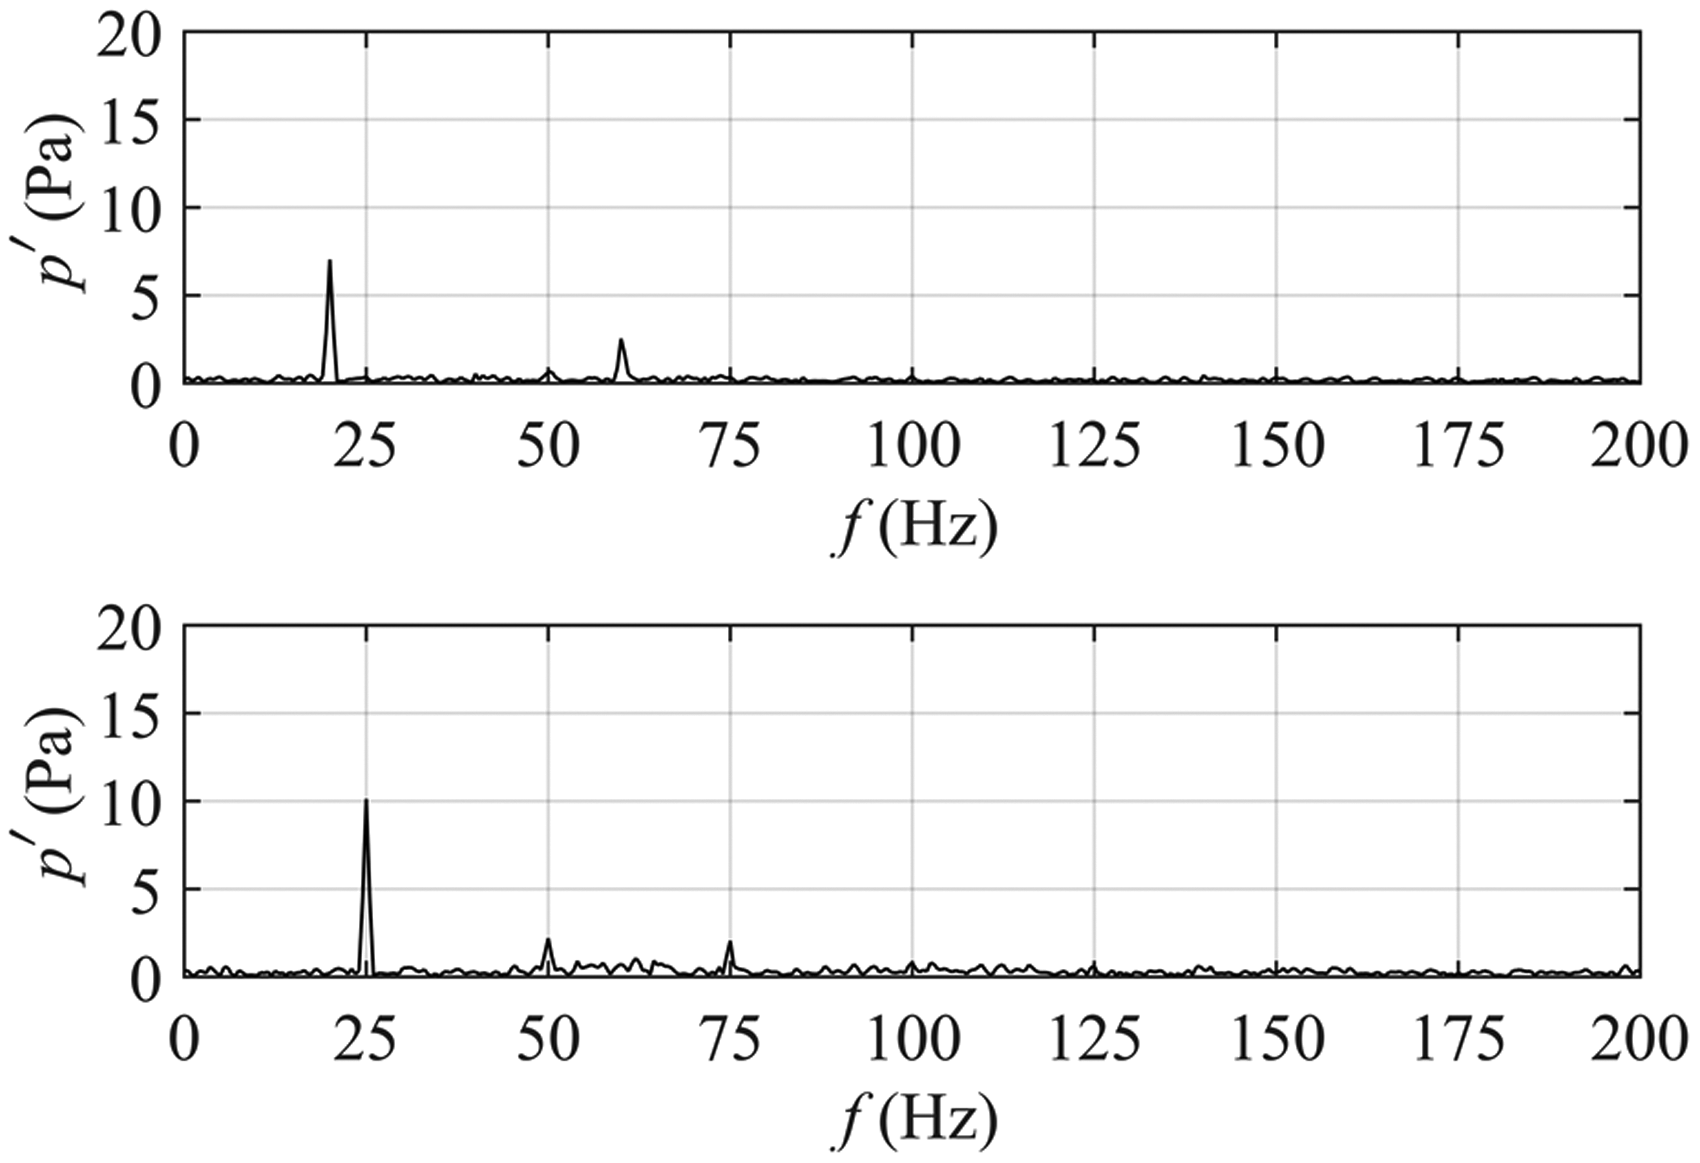
Pressure response at the combustion section under acoustic excitation of 20 and 25 Hz.
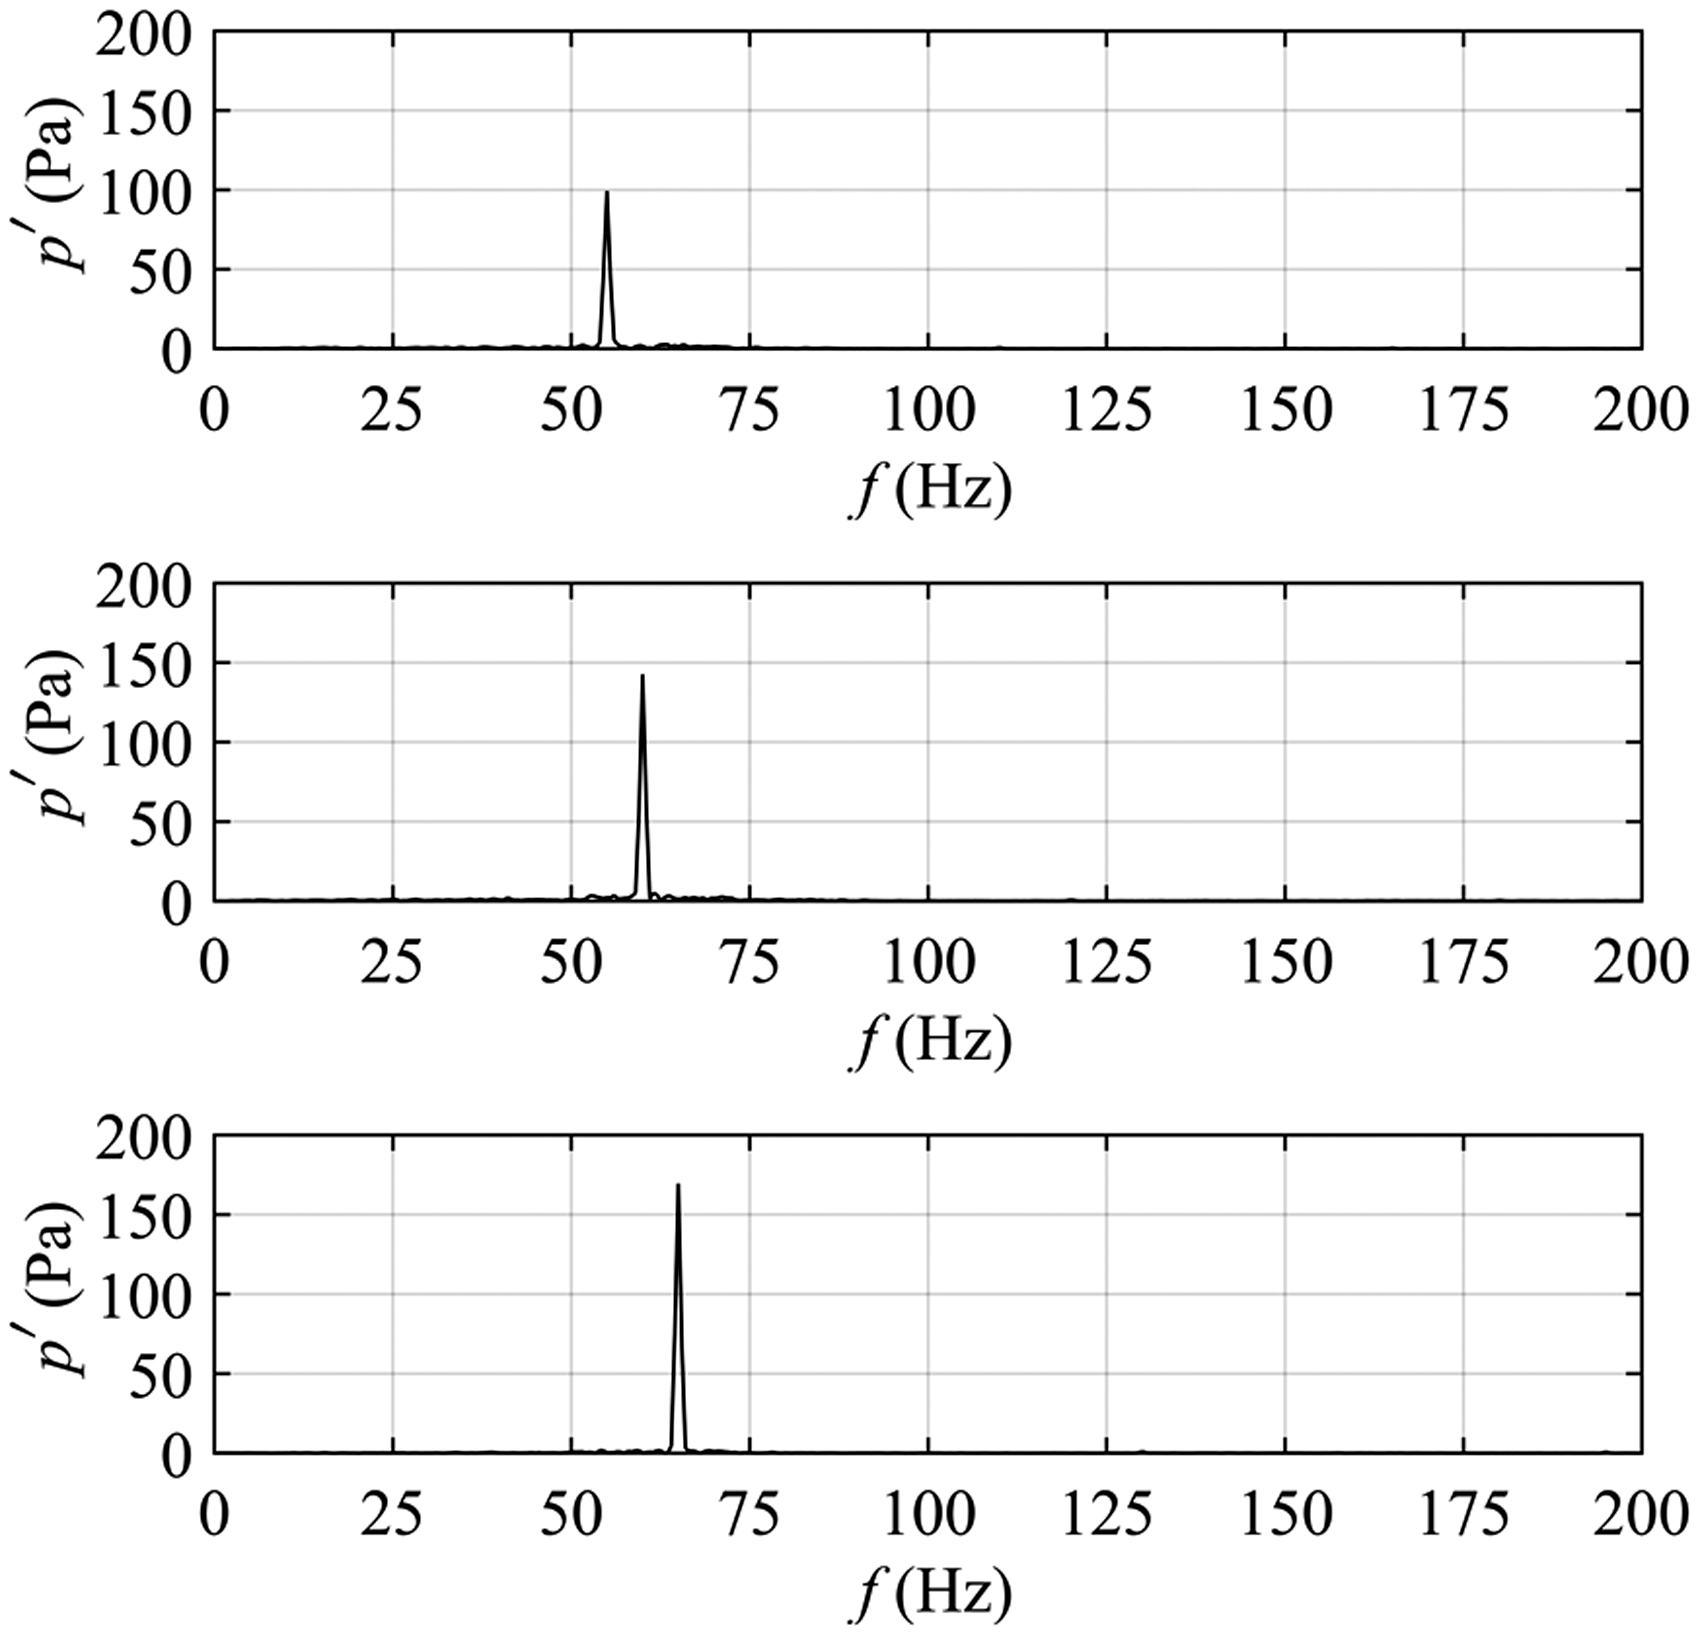
Pressure response at the combustion section under acoustic excitation of 55, 60 and 65 Hz.
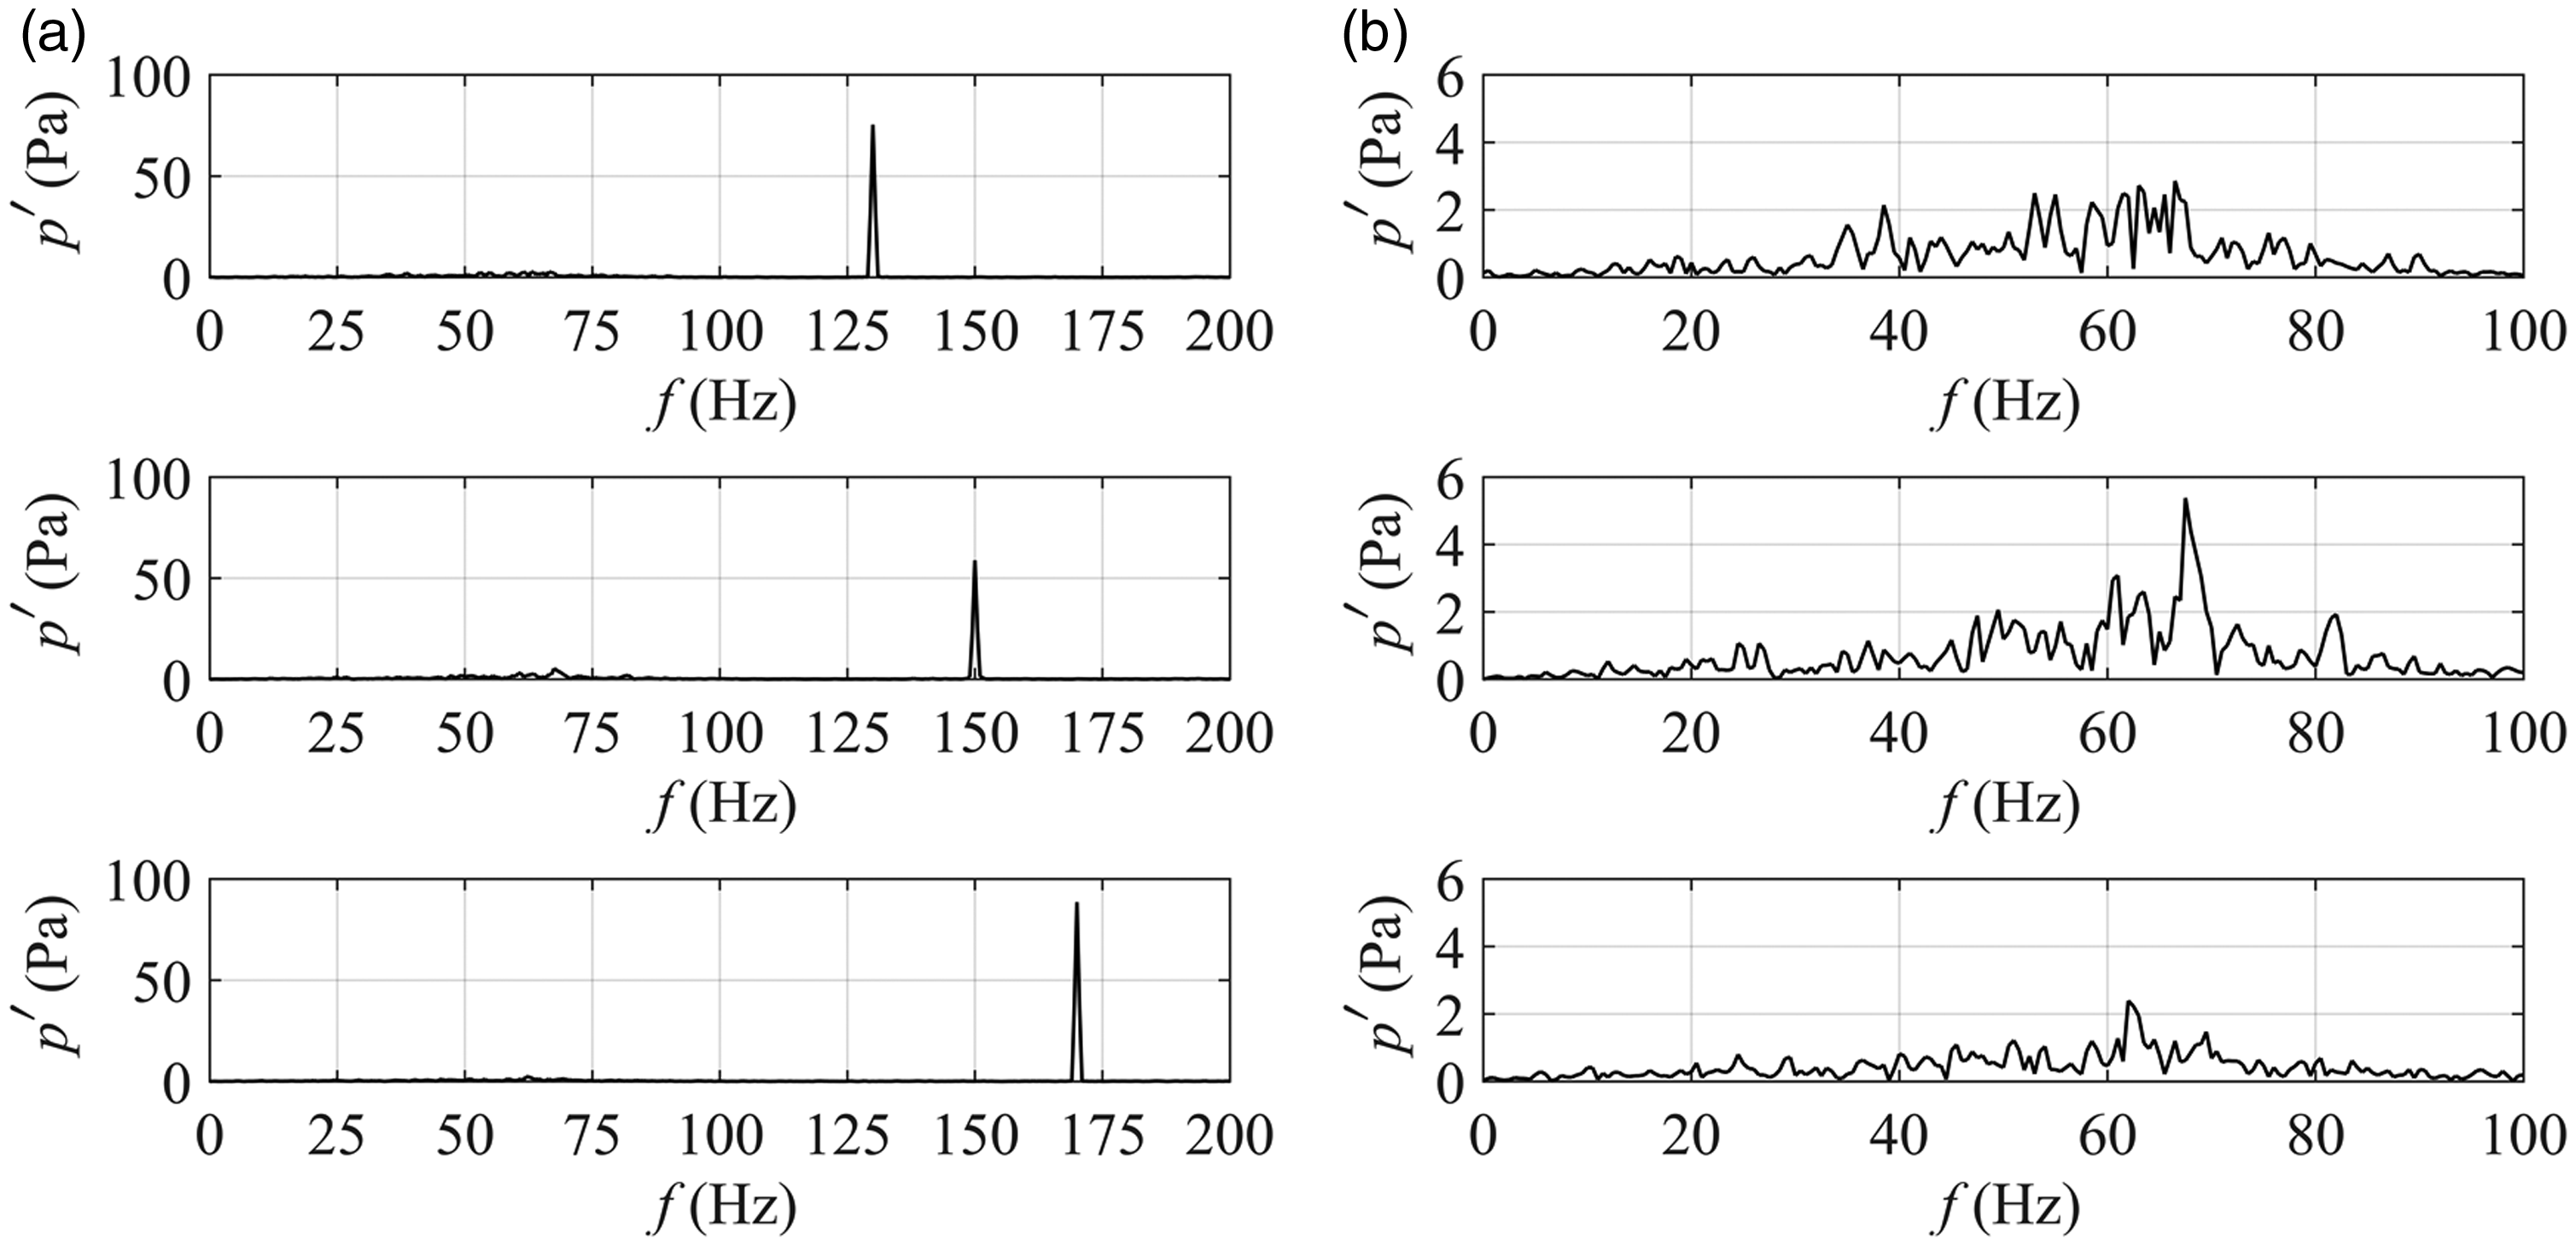
(a) Pressure response at the combustion section under acoustic excitation of 130, 155 and 170 Hz. (b) Pressure spectrum near 60 Hz under acoustic excitation of 130, 155 and 170 Hz.
Conclusions
The experimental study of the response of a non-premixed swirl flame under acoustic excitation is carried out. The main conclusions are as follows:
For inlet section with a length of 0.245 m, the maximum response value of the flame appears near 144 Hz. This is due to the response of the fuel pipe to the acoustic excitation and validated by the acoustic mode analysis through FEM. At the same time, the fluctuation of the fuel has a greater effect on the stability of the flame. The phase-locked direct flame images and phase-averaged CH* chemiluminescence images are also presented. The calculation of flame lift-off length also reveals the same response mode. For the 0.445 m inlet length cases, the maximum flame response occurs at 134 Hz. This is a mixed mode of fuel pipe and combustion chamber response. The flame Pressure fluctuations at the inlet will affect the flame response at this condition. The maximum response of the flame occurs at the point where the pressure fluctuation in the inlet section reaches the maximum. The removing of separation plates leads to a more stable response of the flame in low inlet airflow rate. However, at high airflow rate, the flame tends to be more unstable. This phenomenon needs to be further studied. Only the higher acoustic forcing frequency than quarter-wave mode will cause this acoustic resonant frequency to appear.
Our results show the burner geometry modification effect under acoustic excitation. It can benefit the implications of thermoacoustic instability in the non-premixed flame regime. Especially in the industrial applications, for example in a boiler fired by heavy oil or natural gas, the flame behavior can be influenced by the boiler acoustic mode in large-size width and depth.
Footnotes
Declaration of conflicting interests
The author(s) declared no potential conflicts of interest with respect to the research, authorship, and/or publication of this article.
Funding
The author(s) disclosed receipt of the following financial support for the research, authorship, and/or publication of this article: This work was supported by National Natural Science Foundation of China (51476137) and the National Science Fund for Distinguished Young Scholars (51825605).