
Abstract
Background:
The course of relapsing-remitting multiple sclerosis (RRMS), frequently preceded by the clinically isolated syndrome (CIS), is variable and challenging to predict. Given many treatment options available, prognostic algorithms are gaining importance in informing initial treatment decisions. However, to date, only a few externally validated exists. External validation, which involves the application of a model to independent data, is essential. Privacy-preserving federated analyses of individual-level data facilitate external validation using clinical datasets that are typically difficult to access.
Objectives:
Using data from the ProVal-MS study to externally validate the multiple sclerosis treatment decision score (MS-TDS), a predictive algorithm for early RRMS and CIS. The MS-TDS predicts the probability of the occurrence of at least one new or enlarging T2 lesion within 6–24 months following the onset of the disease and supports choosing between initiating platform treatment or a ‘wait-and-see’ approach. A secondary objective is to demonstrate the feasibility of privacy-preserving federated concepts within the Data Integration for Future Medicine (DIFUTURE) consortium.
Design:
Prospective, multicentric, non-interventional cohort study (ProVal-MS) within DIFUTURE.
Methods:
The calibrated MS-TDS was evaluated using the area under the receiver operating characteristic curve (AUROC) and the Brier score in both pooled and distributed settings. A decision curve analysis (DCA) was used to evaluate the net benefit of treatment decisions made by the MS-TDS in comparison to those made by treating neurologists.
Results:
Of the 271 individuals diagnosed with CIS or early RRMS, 202 (78.2%) received platform treatment, while 59 (21.8%) did not receive treatment. The AUROC was 0.561 (95% CI: 0.492–0.630) in the pooled analysis and 0.567 (95% CI: 0.496–0.634) in the distributed analysis. DCA demonstrated a net benefit that was commensurate with that achieved by decisions made by experienced neurologists.
Conclusion:
The external validation of the MS-TDS demonstrated low, non-significant predictive performance; however, it may serve as a useful complement, particularly for less-experienced neurologists. The distributed validation was found to be both feasible and compliant with data protection regulations.
Keywords
Background
The utilisation of a treatment decision score for relapsing-remitting multiple sclerosis (RRMS) is an emerging way to personalising the decision-making process. The purpose of these scores is to provide a framework to assist patients and clinicians in determining the appropriateness of commencing a disease-modifying treatment (DMT), and to consider individual disease characteristics and patient preferences. However, treatment decision-making in multiple sclerosis (MS) is complex, as illustrated in Figure 4 (right lower corner) of the article by Haki et al., 1 which highlights the multifaceted clinical considerations involved. 1 Treatment decision scores are a means of integrating key clinical data and patient-specific factors to guide the decision about commencing (or escalating) DMTs. However, a Cochrane systematic review concluded that existing prognostic algorithms in MS are not recommended for clinical use, as they have not been externally validated.2,3
We developed an MS-treatment decision score (MS-TDS) to decide the most appropriate treatment option between the alternative of the ‘wait-and-see’ strategy versus treat with a platform treatment. 4 The MS-TDS predicts the probability of new or enlarging T2 lesions (T2L) within 6–24 months after the initial cerebral MRI (cMRI) in individuals with newly diagnosed clinically isolated syndrome (CIS) or RRMS who are given a specific treatment option. The development process was undertaken using monocentric, retrospective data from 475 individuals collected during clinical routines. A total of 65 MS-related predictors were included in the study, encompassing clinical, imaging and laboratory features. The prognostic ability of the MS-TDS was assessed by internal validation, resulting in an area under the receiver operating characteristic curve (AUROC) of 0.624.
The objective of this study is to externally validate the MS-TDS using a prospectively collected independent dataset to demonstrating its generalisability to a wider population. The data presented herein is derived from the ProVal-MS cohort study (German Clinical Trials Register ID: DRKS00014034), 5 which is part of the DIFUTURE (Data Integration for Future Medicine) consortium (http://www.difuture.de). The DIFUTURE IT-infrastructure is characterised by its decentralised nature, manifested through the establishment of local Medical Data Integration Centres (meDICs).
We performed two analyses: the first utilised a centralised dataset in accordance with the principles of a standard pooled data analysis, and the second employed a federated algorithm based on differential privacy concepts. Such algorithms are designed to protect the confidentiality of sensitive medical data at the individual level. Furthermore, they can enable external researchers to analyse routinely collected clinical data in compliance with data protection regulations without requiring individual consent.6,7 In the context of our federated approach, analysts do not have access to individual-level data; rather, they provide aggregated statistics, thereby preventing any inferences about single individuals.7–9 The results are then compared to those obtained through the traditional pooled strategy.
Methods
MS-TDS development population
The development of the model was based on a discovery population consisting of a retrospective monocentric cohort of individuals diagnosed and monitored as part of routine clinical practice at the Department of Neurology at the TUM University Hospital in Munich between 2008 and 2017. The study included individuals with early RRMS or CIS diagnosed according to the 2005 or 2010 McDonald criteria. Individuals who were diagnosed with the condition more than 3 years prior to or more than 1 month subsequent to their initial cMRI were excluded from the study. The same applies to individuals who had received any treatment 6 months before their first cMRI (defined as baseline) or earlier and to those whose second cMRI was conducted later than 32 months after baseline. Glatiramer acetate, interferon beta-1a and -1b, pegylated interferon beta-1a, dimethyl fumarate, and teriflunomide were classified as ‘platform’ treatments. Twelve subjects who had been administered more efficacious DMTs, including alemtuzumab, cladribine, natalizumab, mitoxantrone or B-cell treatments, were excluded from the development of the MS-TDS. This resulted in a final sample size of 475. Individuals who switched medication were allocated to the treatment group of the DMT they received for the longest duration during the follow-up period. Definitions of predictors and outcomes in the discovery cohort are described in Hapfelmeier et al. 4
Predictors
Potential predictors were documented in the protocol of the ProVal-MS cohort. They included demographic information, diagnosis, symptoms at disease onset, the occurrence and symptoms of relapses and measures of both MS severity and functional assessment scores like the Expanded Disability Status Scale (EDSS), the Fatigue Scale for Motor and Cognitive Functions (FSMC), the Multiple Sclerosis Functional Composite (MSFC), and the Beck Depression Inventory (BDI-II). Furthermore, standard laboratory and cerebrospinal fluid (CSF) data were collected during routine examinations. The final model comprised 65 predictors. The modelled outcome was defined as the occurrence (yes/no) of T2L until 24 months since baseline, where the MS-TDS predicts the probability of the outcome within 6–24 months.
MS-TDS validation population
The validation cohort is based on the German prospective, non-interventional, diagnostic phase II multicentre ProVal-MS cohort study (German Clinical Trials Register ID: DRKS00014034). The participating centres are as follows: University Hospital Augsburg (UKA), LMU Hospital Munich, Ludwig-Maximilians University Munich (KUM), TUM University Hospital, Technical University of Munich (TUM), Eberhard Karl University, Tübingen (UKT) and Ulm University Medical Center (UKU).
ProVal-MS is an ongoing study conducted with the primary objective of validating MS-TDS. The study commenced on 6th March 2019 and comprised untreated individuals diagnosed with CIS or early RRMS (in accordance with the McDonald 2017 diagnostic criteria), aged 18–60 years, with a disease duration of no more than 2 years. 5 The analysis included individuals who had completed the 24-month visit prior to 1 June 2024 (see Figure 1).

Flowchart.
ProVal-MS was designed to collect data within routine clinical practice from standard clinical documentation systems at each site. In order to harmonise data collection across sites, a core dataset was developed. This dateset defined required variables in accordance with internationally recognised documentation guidelines for MS. Laboratory and CSF values were harmonised using percentile matching to align the data from the discovery population. The transfer of data to local databases was facilitated by the meDICs, utilising the open-source software Data Integration System (https://www.bitcare.de). 10
The implementation of uniform data quality controls was conducted at each site. In order to validate the MS-TDS, predictors were assessed at baseline, and the outcome was measured by cMRI performed at 6 and 24 months after baseline with an optional scan at month 12. The study protocol for the ProVal-MS study has been published. 5
Outcome definition and imaging analysis
The MRI acquired at the 6-month visit was designated as the baseline scan, while the MRI obtained at 24 months served as the follow-up scan. The progression of lesions in cMRI during this period was dichotomised in order to define the study outcome as present or not. The final outcome was determined through a consensus rating by two experienced, board-certified neuroradiologists who were blinded to the individual patient data. Their assessment was based on two sources: first, all routine radiology reports of follow-up cerebral MRIs; and second, an independent evaluation of longitudinal subtraction images. 11 In instances of discrepancy, both neuroradiologists conducted a comprehensive review of the raw imaging data, individual reports and subtraction images.
New lesions were defined as hyperintense areas in FLAIR sequences, hypointense in T1-weighted imaging, with a minimum diameter of 3 mm along the longest axis. Lesions demonstrating enlargement were considered new if a distinct component had newly emerged and exceeded 3 mm in its largest dimension. Slowly expanding lesions (SELs) with a diameter increase of less than 2 mm were not classified as new. Subtraction images were generated using double inversion recovery (DIR) sequences, following the methodology described by Eichinger et al. 11 In instances where DIR sequences were not available at either the baseline or the follow-up, FLAIR images were utilised for subtraction analysis.
For the distributed analysis, the outcome was determined at each site by the local neuroradiologists.
Primary statistical analysis
The MS-TDS is derived from a random forest model built upon a fully parameterised Cox proportional hazards model.
4
The algorithm was applied to the data of eligible ProVal-MS study subjects. The score is used to estimate the probability that a person with a specific set of characteristics (predictors) and treatment will develop at least one T2L between 6 and 24 months after first cMRI, assuming no T2L occurred within the first 6 months:
The sample size calculations of the ProVal-MS study indicated that 188 individuals (94 with at least one T2L and 94 without) are required to reject the null hypothesis of an AUROC ⩽ 0.7, while testing the alternative hypothesis (AUROC = 0.8) with 80% power and a type I error rate of 5%. 5
As delineated in the ProVal-MS protocol, 5 the calibration curve employing logistic regression, the area under the receiver operating characteristic curve (AUROC), and the Brier score (with confidence intervals (CIs) derived using bootstrap with 1000 iterations) were calculated. The Brier score is defined as the mean squared difference between the predicted probability of an event occurring and the actual outcome. This phenomenon is indicative of both discrimination and calibration. A Brier score of 0.25 is achieved when all predicted probabilities are 50%, irrespective of the true outcome. The score is 0 when predictions are exactly aligned with the actual outcomes. To illustrate, consider a prediction of 100% for events (e.g. at least one new/enlarged T2L) and 0% for non-events. In the worst-case scenario, the Brier score attains a value of 1, where events are invariably predicted with a probability of 0% and non-events with 100%. It is important to note that all analyses described in this article are based on the calibrated MS-TDS.
Analyses were performed with the pooled data and additionally using distributed data. Distributed analyses were performed using the DataSHIELD framework,8,9 with the dsBinVal DataSHIELD R-package being applied in order to determine the AUROC derived by ROC-glm estimation strategies. 12 The necessary IT infrastructure was provided by the meDICs within the DIFUTURE consortium. A comparison of the AUROC and calibration parameters between centralised and distributed analysis is of interest in order to prove the feasibility of a distributed approach. The MS-TDS has the capacity to manage missing values. However, given that the ROC-glm algorithm employed to derive a distributed AUROC is unable to accommodate missing values, the mice R-package 13 was employed to generate a single imputed dataset at each study site, thereby enabling the distributed analysis.
Decision curve representing benefit of using the MS-TDS
Vickers decision curve analysis (DCA) is a methodological approach that is utilised for the evaluation and comparison of the clinical usefulness of prediction models. In contrast to conventional metrics such as sensitivity or AUROC, DCA takes into account a risk threshold set by each individual who has been consulted by their treating physician. These thresholds reflect the point at which a person with a certain disease perceives the potential harm of treatment to be equal to the harm caused by the disease itself. Consequently, DCA assists in identifying the prediction strategy that offers the optimal overall benefit. In summary, the DCA allows us to quantify whether using a model leads to better decisions in practice, considering harms and benefits. 14 The DCA was applied to both the MS-TDS and the treatment decisions made by MS experts, as documented in the ProVal-MS dataset. Further details on the method and the interpretation of the DCA can be found elsewhere. 14
Causal considerations
The appendix presents a discussion of the results following causal strategies and reflecting considerations, which were also reported in the original paper 4 but were not mentioned in the ProVal-MS protocol. 5
Software
The execution of all pooled analyses was conducted utilising the statistical software R version 4.2.2. Depending on the study centre (for details on the study population see section “MS-TDS validation population”), the following software was utilised: DataSHIELD R packages dsBase version > 6.3.0 and dsBinVal version 1.0.2, and Opal servers with installed software version > 4. The large language model ChatGPT version GPT-4, provided by OpenAI, and DeepL pro advanced + write Pro was employed for the purpose of language polishing.
Reporting guidelines
The TRIPOD guidelines for prognostic model validation 15 were followed to ensure transparent, complete and reproducible reporting of the external validation of the MS-TDS. The corresponding checklist is provided in the Supplemental Material.
Results
The ProVal-MS study comprised 418 individuals diagnosed with early RRMS or CIS. The data were collected from routine clinical practice at five participating hospitals. The LMU Hospital Munich, Ludwig-Maximilians University Munich (KUM) with 99, the TUM University Hospital Munich with 116, the Eberhard Karl University, Tübingen (UKT) with 71, the University Hospital Augsburg (UKA) with 77, and the Ulm University Medical Center (UKU) with 55 participants. A total of 147 subjects were excluded from the analysis (see Figure 1). In the case of five subjects, the consent was either not present or had been revoked. Another 39 subjects were excluded from the analysis due to missing data concerning diagnosis or medication, incomplete follow-up visits, or incorrect date entries. A total of ten subjects were excluded from the study due to the fact that their expected 24-month follow-up visit was scheduled to take place after May 2024. Finally, 65 subjects were excluded on the basis that they had received a non-platform DMT, and a further 28 were excluded due to a missing outcome.
Tables 1 and S1 present the above defined T2 lesion outcome measure and the MS-TDS predictors. In this study, no treatment was administered to 59 (21.8%) patients, while 212 (78.2%) patients received platform medication. The discovery cohort included 198 untreated (41.7%) and 277 treated (58.3%) individuals. 4 In the validation cohort, 97% of subjects diagnosed with RRMS and 3% with CIS were treated, compared to 74% RRMS versus 26% CIS in untreated individuals. In the discovery cohort, the proportion of subjects diagnosed with RRMS was found to be 54.5% in the treated group, in comparison to 43.8% in the untreated group. In the discovery cohort, the total T2 lesion count was found to be balanced (median = 7 and interquartile range (4–11) and 8 (4–11)) between treated and untreated individuals. However, in the validation cohort, this was not the case: the median was 13.0 (5–27) in untreated versus 17.5 (9–37) in treated. In the validation cohort, 41% of untreated cases exhibited at least one new or newly enlarged T2 lesion, compared to approximately 46% of treated cases. A number of statistically significant differences were identified between the study arms of the validation cohort with regard to the diagnosis, CSF cell number and relapse counts (±3 months from baseline and 2 years before study participation).
Table of characteristics.

p-Values < 0.1 are bold; p-values < 0.05 are marked in bold italics.
Fifteen most important factors (see Figure 4 of the original publication of Hapfelmeier et al.) predicting probability of new/newly enlarged T2 lesions by the multiple sclerosis treatment decision score. All predictors are presented in Table S1.
Median (Q1–Q3); n (%).
Wilcoxon rank sum test; Pearson’s Chi-squared test; Fisher’s exact test.
To harmonize these variables across sites, we first calculated the percentile of each value. We then determined the corresponding percentiles for the same variable in the training dataset. Each value was subsequently matched to the value in the training dataset with the closest percentile. The matched training-value was then used for all further analyses.
BMI, body mass index; CIS, clinically isolated syndrome; cMRI, cerebral magnetic resonance images; CSF, Cerebrospinal fluid; EDSS, Expanded Disability Severity Scale; IgA, Immunoglobulin A; IQR, interquartile range; MSFC, MS functional composite; RRMS, relapsing-remitting multiple sclerosis; TSH, thyroid-stimulating hormone.
In comparison to the discovery cohort, where new or newly enlarged T2 lesions occurred in 77.3% of untreated individuals and 84.3% of treated individuals, the observed rates in the validation cohort were lower (see paragraph above). As demonstrated in Table S2, a marginal difference in outcomes is observed between centres (p = 0.06). A number of significant differences were observed across sites in several variables, including T2 lesion locations, the presence of oligoclonal bands, the 25-foot walk test, certain EDSS components and total EDSS, the number of relapses in the 2 years prior to baseline, specific relapse symptoms, and paresis as the first symptom.
As demonstrated in Figure S1, the calibration plot of the MS-TDS exhibits a systematic overestimation of the T2L probability (T2LP), necessitating recalibration. As demonstrated in Figure 2, the recalibrated result yielded a slope of 1 (95% CI: −0.05 to 2.05) and an intercept of 0 (−0.24 to 0.24). As demonstrated in Figure 3, the AUROC indicates marginal discrimination ability between individuals with and without T2Ls (0.561; 95% CI: 0.492–0.630). The Brier score yielded a value of 0.244 (95% CI: 0.236–0.253), which can be interpreted in a similarly manner. Across sites, the AUROC was found to range from 0.521 to 0.617 (CIs in Figure S2). The respective local Brier scores were found to be between 0.23 and 0.24. The AUROC derived from the distributed analysis is 0.567 (95% CI: 0.496–0.634) and the Brier score is 0.23, respectively. Figures S3 and S4 illustrate the AUROC and calibration curve of the distributed analysis, respectively.
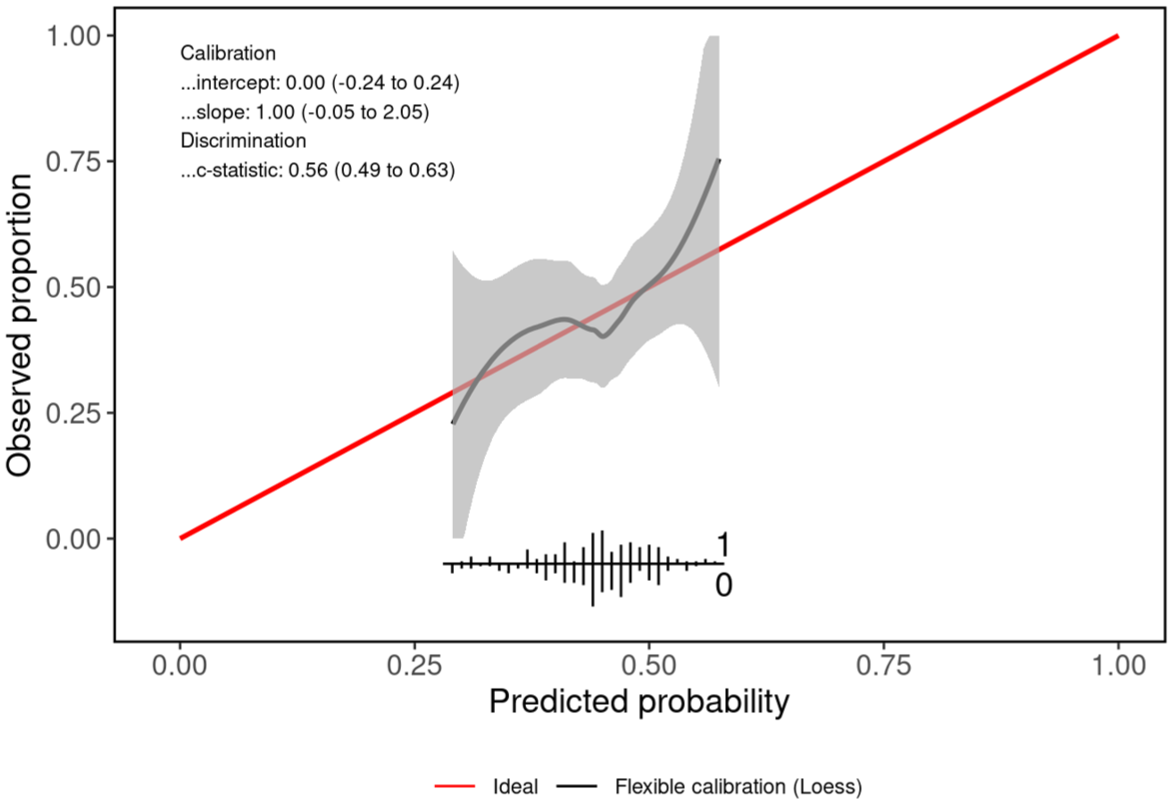
Re-calibrated calibration curve of the MS-TDS. The grey line shows a locally estimated scatter plot smoothing line (LOESS) with 95% confidence levels (shaded grey area). Red line indicates optimal calibration. The predicted probabilities of at least one new or enlarging T2L between months 6 and 24 after baseline were between around 25% and 60%. The re-calibrated MS-TDS is well calibrated for T2L probabilities below 55%. Predicted and observed outcomes show good agreement.
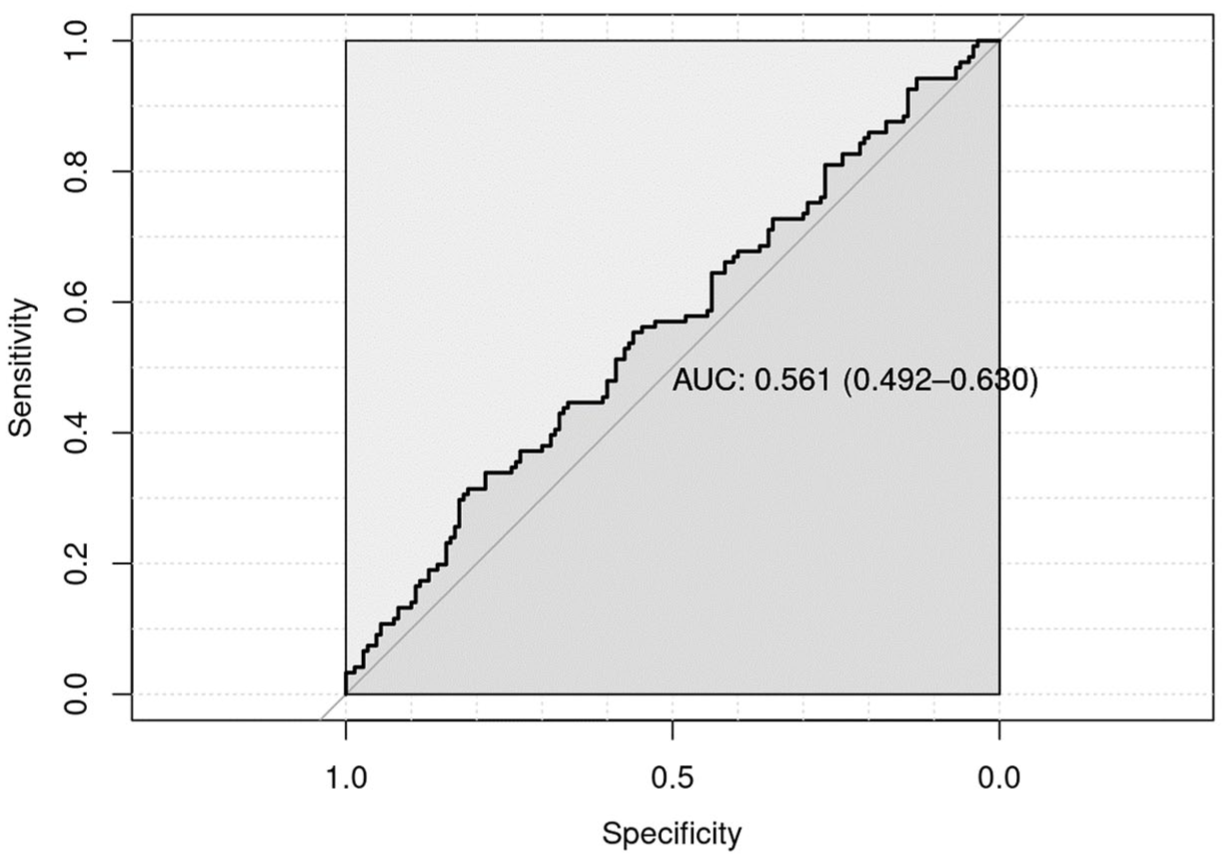
Area under the receiver operating characteristic curve (AUROC). The multiple sclerosis treatment decision score does not discriminate well between persons with relapsing-remitting multiple sclerosis with and without new or newly enlarged T2 lesions.
The DCA is presented in Figure 4. The findings indicate that, across a broad spectrum of assumed levels of T2LP as depicted on the x-axis, adherence to the MS-TDS recommendation (illustrated by the purple curve) yields the optimal net benefit. The net benefit associated with expert-based treatment decisions is comparable, but tends to be lower, particularly when the perceived T2LP is below 42%. In light of these findings, MS-TDS recommendations have the potential to inform treatment decisions. In instances where the individual risk of treatment-related complications is deemed to be lower than the consequences associated with a T2LP of 42%, the initiation of platform treatment is recommended. Conversely, if the perceived risk of complications exceeds the consequences corresponding to a T2LP of 47%, a ‘wait-and-see’ strategy may be considered. When T2LP falls between 42% and 47%, the MS-TDS recommendation yields the highest net benefit compared to the other strategies examined. Nevertheless, the added value of this approach is low, and treatment decisions remain inconclusive.

The figure illustrates a DCA following the approach by Vickers and colleagues. DCAs estimates the clinical value of prediction models by quantifying the net benefit across a range of threshold probabilities. Net benefit combines true positives and false positives into a single metric, allowing comparison between strategies while accounting for the relative harm of unnecessary treatment versus disease progression. The threshold probability represents the individual risk level at which treatment would be considered appropriate, based on the patient’s preferences regarding potential benefits and harms, in consultation with the physician’s clinical judgment. DCAs applies this personalised threshold to evaluate which treatment decision strategy yields the highest net benefit for a given patient. Here, the net benefit of initiating platform treatment under four different strategies are compared: treating all patients (red graph), treating none (green graph), treatment decisions made by physicians in the ProVal study (blue graph), and a hypothetical treatment decision based on the MS-TDS (purple graph). The x-axis represents the threshold probability (at least one new/newly enlarged T2 lesion – T2L – between months 6 and 24 after baseline): for each value along the axis, the strategy with the highest net benefit is considered optimal. The blue interval indicates the range of T2L probabilities predicted by the MS-TDS in the ProVal population. MS-TDS shows marginally better net-benefit compared to treating all, treating non, and physicians’ decisions.
Discussion
The objective of this study was to undertake the external validation of the MS-TDS using quality-checked data from the observational, non-interventional, prospective ProVal-MS cohort study, which examined individuals with recently diagnosed CIS or early RRMS. The Proval-MS cohort is a clinical cohort based on tertiary treatment centres. In this study, the occurrence of new or newly enlarged T2 lesions was utilised as a surrogate endpoint for disease outcome.
The MS-TDS demonstrated a marginal ability to distinguish between individuals with and without T2Ls, with the occurrence of T2Ls materialising within a period of 6–24 months following the baseline assessment (AUROC = 0.561; 95% CI = 0.492–0.630, Brier score = 0.244; 95% CI = 0.236–0.253). An AUC close to 0.5 and a Brier score of approximately 0.25 indicate poor discrimination between individuals with RRMS with and those without new/enlarged T2 lesions, thus limiting clinical applicability. The 95% CI of the external validation also encompasses the AUROC as reported in the original publication (AUROC = 0.624). 4 These values align with AUROC values not exceeding 0.7, as reported for existing predictive models in the literature, which demonstrated a low risk of bias.16–19 Despite the low discriminative ability of the MS-TDS, a qualitative positive trend towards a general treatment benefit was observed when participants would have followed MS-TDS recommendations (see Figures S5–S7). While the observed benefit is modest, the results suggest that the treatment decisions made by the treating physicians were well-founded (Figure 4).
As the demand for external validation continues to grow,2,3 access to relevant data becomes increasingly important. Routinely collected study data, such as that provided by initiatives such as the Medical Informatics Initiative in Germany (Medizininformatik Initiative, MII) including DIFUTURE or the French Multiple Sclerosis Observatory (Observatoire Français de la Sclérose en Plaques, OFSEP – https://www.ofsep.org/en), represent a valuable resource for this purpose. In the context of external validation, the utilisation of individual patient data from clinical trials, as made available through designated sharing platforms (VIVLI, CSDR, YODA), 20 has been proposed as a potential approach. Consequently, this study also validated the MS-TDS using data protection-compliant distributed analysis algorithms via DataSHIELD and the BinVal R-package. 12 The distributed analysis yielded results that were comparable to those of the pooled analysis. The utilisation of federated privacy-preserving algorithms has the potential to enable the use of individual data for privacy-protected analyses, such as external validations.
As previously discussed in our work on the generation of the MS-TDS, 4 difficulties have already been discussed in relation to the utilisation of data from routine clinical practice. Additional limitations were observed during the process of the validation. While the potential predictive value of the MS-TDS for patients receiving high-efficacy DMTs was not assessed in the validation cohort, this reflects a known limitation of the MS-TDS itself rather than of our study. This study was designed with the sole objective of validating the MS-TDS as originally developed, and it was not conceived for this particular purpose. The study’s design and setting provide a framework for the validation of alternative TDS approaches, including those that address this particular question. The development of a TDS is predicated on data from randomised trials, and as such, the process is not without its advantages and disadvantages. In the context of a randomised clinical trial, the selection of treatment is not influenced by confounding factors. However, this may not be representative of the application of MS-TDS in a care setting, where treatment decisions are made with consideration for the individual disease course. 21 In order to address potential biases resulting from an observation study design, causal analyses are provided that reduce bias created by the existence of confounding for the treatment choice (see Figures S5 and S6). A further strength of this article is the use of high-quality clinical cohort data for external validation. The study is deemed to fulfil all current methodological requirements. A limitation of this study is the loss of clinical data due to issues arising in routine clinical practice. Notably, the high rate of missing values in CSF-related variables, which were identified as an important prognostic factor during the MS-TDS development, 4 may have had an impact on the prognostic evaluation metrics. The distribution of data collection across the five participating centres was characterised by site-specific clinical data entry systems and IT infrastructures, which resulted in delays and necessitated complex data harmonisation strategies. Notwithstanding the implementation of inverse probability treatment weighting (IPTW), the absence of randomisation has the potential to hinder the unbiased estimation of treatment effects and benefits, thereby constraining the validity of counterfactual analyses (see Figures S5 and S6). This is attributable to the presence of potentially unmet and unverifiable assumptions that underpin the framework, as discussed in the Supplemental Material.
In summary, this study makes several significant contributions to the field.
It is the first to provide state-of-the-art validation of a TDS.
The validation of a developed TDS is successful when an independently collected cohort is used.
Third, the study provides individual-level data on CIS and early RRMS, which will serve as a basis for the future validation of new TDS approaches.
Conclusion
In summary, the findings of our study demonstrate that the treatment decisions made by MS experts were comparable with treatment recommendations derived by the MS-TDS. Furthermore, the study demonstrates that a distributed, privacy-preserving analysis strategy is compliant with data protection regulations and can be used to validate new prognostic algorithms. This approach facilitates the execution of validation studies employing quasi-anonymous routine clinical data, where the provision of informed consent is not obligatory, provided that ethical standards and data protection regulations are adhered to. Moreover, this study offers an external validation of the MS-TDS in the ProVal-MS cohort, a prospective multicentre observational study in CIS and early RRMS. The 95% CI of the derived AUROC, utilised as a metric for prognostic quality, encompassed the AUROC reported in the original MS-TDS development. Both are in the range of AUROC values from similar models which were reported in the literature and do not show high prognostic performance. The utilisation of the MS-TDS to assess treatment benefit can be regarded as a supplementary instrument in conjunction with clinical treatment decision-making. The relevance of the MS-TDS can be described as follows: In instances where the perceived risk of treatment complications is deemed to be lower than the harm associated with a T2LP of 42%, platform treatment is recommended. In instances where the harm at a T2LP exceeds 47%, a watchful waiting (no treatment) approach may be preferred. The MS-TDS may offer support for decisions within the range of 42% to 47%, but its added value is constrained.
Supplemental Material
sj-docx-1-tan-10.1177_17562864251391095 – Supplemental material for External validation of a multiple sclerosis treatment decision score using data from the ProVal-MS cohort study
Supplemental material, sj-docx-1-tan-10.1177_17562864251391095 for External validation of a multiple sclerosis treatment decision score using data from the ProVal-MS cohort study by Stefan Buchka, Alexander Hapfelmeier, Jan S. Kirschke, Verena Steuerwald, Markus Naumann, Iñaki Soto-Rey, Sven Olaf Rohr, Frank Kramer, Lars Behrens, Eva Oswald, Tania Kümpfel, Hanna Zimmermann, Verena S. Hoffmann, Marlien Hagedorn, Fady Albashiti, Markus Krumbholz, Ulf Ziemann, Oliver Kohlbacher, Benjamin Sailer, Viola Braunmüller, Stephanie Biergans, Marius de Arruda Botelho Herr, Ulrike Ernemann, Eva Bürkle, Benjamin Bender, Andreas Daul, Christer Ruff, Jörg Römhild, Benedikt Wiestler, Dominik Sepp, Helmut Spengler, Peter Pallaoro, Martin Boeker, Florian Kohlmayer, Vera Dehmelt, Achim Berthele, Mark Mühlau, Paula Uibel, Josephine Wauschkuhn, Klaus Kuhn, Makbule Senel, Ioannis Vardakas, Daniela Taranu, Hans Armin Kestler, Nico Sollmann, Begüm Irmak Ön, Sandra Bilger, Ulrich Mansmann, Antonios Bayas, Joachim Havla, Markus C. Kowarik, Hayrettin Tumani and Bernhard Hemmer in Therapeutic Advances in Neurological Disorders
Footnotes
Acknowledgements
We thank all participants of this observational study. Members of ProVal-MS Study Group: Sonja Bayas, Taner Öksüz, Ansgar Berlis, Marie Braun, Martin Kerschensteiner, Reinhard Thasler, Angelika Bamberger, Jonathan A. Gernert, Daniel Engels, Christopher Hemingway, Hanna Zausinger, Leo Hutter, Vasil Mitrevski, Lisa Ann Gerdes, Maria Tieck, Christoph Ruschil, Natalie Rumpel, Mihai Ancau, Ali Afzali, Christina Engl, Heike Fränkle, Danah Eichhorn, Meinrad Beer, Sabine Juscamayta, Hannah Spohn. We would like to thank the members of the ProVal-MS Study Group for their valuable contributions to the conceptualisation of the study, the examination of study participants, the assessment of MRI images, and the collection and processing of clinical data, as well as for their support in reviewing and editing the manuscript. Their efforts were essential and played a decisive role in enabling the completion of this work.
Declarations
ORCID iDs
Supplemental material
Supplemental material for this article is available online.
References
Supplementary Material
Please find the following supplemental material available below.
For Open Access articles published under a Creative Commons License, all supplemental material carries the same license as the article it is associated with.
For non-Open Access articles published, all supplemental material carries a non-exclusive license, and permission requests for re-use of supplemental material or any part of supplemental material shall be sent directly to the copyright owner as specified in the copyright notice associated with the article.