
Abstract
Background:
Stroke misdiagnosis, associated with poor outcomes, is estimated to occur in 9% of all stroke patients.
Objectives:
We hypothesized that machine learning (ML) could assist in the diagnosis of ischemic stroke in emergency departments (EDs).
Design:
The study was conducted and reported according to the Transparent Reporting of a multivariable prediction model for Individual Prognosis Or Diagnosis guidelines. We performed model development and prospective temporal validation, using data from pre- and post-COVID periods; we also performed a case study on a small cohort of previously misdiagnosed stroke patients.
Methods:
We used structured and unstructured electronic health records (EHRs) of 56,452 patient encounters from 13 hospitals in Pennsylvania, from September 2003 to January 2021. ML pipelines, including natural language processing, were created using pre-event clinical data and provider notes in the EDs.
Results:
Using pre-event information, our model’s area under the receiver operating characteristics curve (AUROC) ranged from 0.88 to 0.92 with a similar range accuracy (0.87–0.90). Using provider notes, we identified five models that reached a balanced performance in terms of AUROC, sensitivity, and specificity. Model AUROC ranged from 0.93 to 0.99. Model sensitivity and specificity reached 0.90 and 0.99, respectively. Four of the top five performing models were based on the post-COVID provider notes; however, no performance difference between models tested on pre- and post-COVID was observed.
Conclusion:
This study leveraged pre-event and at-encounter level EHR for stroke prediction. The results indicate that available clinical information can be used for building EHR-based stroke prediction models and ED stroke alert systems.
Keywords
Introduction
Stroke is the leading cause of death and long-term disability. 1 Stroke misdiagnosis is estimated to occur in 9% of all stroke patients and is associated with poor outcomes. 2 Rapid diagnosis and treatment of stroke are vital in improving the patient’s chances of recovery.3,4 The causes of delayed or misdiagnosis of stroke are multiple. Some patients with stroke may present with non-focal symptoms (e.g. dizziness, ataxia, diplopia) 5 and may not trigger a stroke alert. Furthermore, the emergency departments (EDs) are challenging environments, and triage, diagnosis, and admissions must be executed under tight time constraints.6,7 Patients without typical risk factors (including younger patients), 8 walk-in patients, 9 and those who do not trigger a pre-arrival emergency medical services (EMS) notification 10 are at greater risk of misdiagnosis.
We developed the first pilot study, using an artificial neural network based on clinical data, to effectively recognize an ischemic stroke (IS) and differentiate that from stroke mimics in ED. 11 We previously presented a practical framework outlining the stages needed to leverage electronic health records (EHRs) and create a machine learning (ML)-enabled clinical decision support system to screen for stroke patients in ED. 12
We present a multi-step strategy, using pre-event data and provider notes, to construct prediction models. We also used five misdiagnosed stroke cases within our healthcare system, to test if the ML-enabled models would have been able to flag those patients.
Methodology
The study was conducted and reported according to the transparent reporting of a multivariable prediction model for individual prognosis or diagnosis guidelines. 13 This study includes a multi-step approach to construct and validate prediction models using clinical data.
Study population
We used patient-level structured and unstructured data from 13 hospitals of a large health system (Geisinger with a catchment area of 3 million) in Pennsylvania, United States, from September 2003 to January 2021 [Figure 1(a)]. Geisinger is an integrated healthcare system in central and northeast Pennsylvania. Geisinger provides health insurance to its members; the majority of Geisinger’s patients have Geisinger’s Health Plan (30%) or Medicare with Medicare Supplement Plans (40%) often from Geisinger. Approximately 5% have Medicaid and 20% have commercial plans. Geisinger’s EHR contains rich longitudinal patient data.

(a) Study cohorts. (b) The two modeling pipelines for identification of ischemic stroke in the ED. (c) An example of clinical Text Analysis and Knowledge Extraction Systems (cTAKES) when applied to a patient note. (d) Modeling pipeline applied to the output of the NLP pipeline.
Data from September 2003 to May 2019 were used for model development and validation. We further collected data prospectively from June 2019 to January 2021 for additional prospective validation. The unstructured data included the initial history of present illness (HPI) of ED provider notes captured during the initial patient encounter. The modeling strategy is summarized in Figure 1(b).
Inclusion and exclusion criteria
Patients were included in the case group if they (1) presented to ED or transferred to inpatient (IP), (2) had a primary discharge diagnosis of IS, (3) had brain MRI, and (4) had an encounter duration of more than 24 h. Patients were included as non-stroke (controls) if they (1) presented to ED or transferred to IP, (2) had an encounter duration of 24 h or more, and (3) had a head CT. Patients were excluded from the study if they had a discharge diagnosis of transient ischemic attack (TIA), intracranial hemorrhage, or trauma-related diagnosis.
To calculate the required sample size before the study initiation, we assumed a sample ratio of non-stroke versus stroke as 7 and the expected sample Area Under the Curve (AUC) of 0.85 with a two-sided 95% confidence interval (CI) with a width of 0.03, we needed to have a random sample of 1041 subjects from the positive (stroke) and 7287 from the negative population (non-stroke) to achieve our expectation.
Structured data elements and processing
Structured variables
Table 1 includes the list of variables (demographics, medical history, laboratory results, and social and family history) used in this study. Variables were based on the last observation before the index stroke and were within a 3-year window. Measurements, such as laboratory values, available but not within the 3-year window were treated as missing. The dataset was randomly split into 80:20 training and testing sets.
Development cohort characteristics.

BP, bold pressure; HMO, health maintenance organization; IQR, interquartile range.
Imputation
Only laboratory-based features, the time between the last outpatient visit and index encounter, and body mass index (BMI) suffered from missingness (Table 1). Imputation was performed separately on training and testing sets using the MICE (Multivariate Imputation by Chained Equations) package, 14 for all the variables. We have previously shown that MICE is a good choice for EHR data for missingness in the range observed in this study.15,16 Finally, dummy binary variables (‘indicator variables’) were created for variables with higher missingness, indicating if the variable was missing for a given patient.
Statistical analysis
All continuous variables were summarized as median with interquartile ranges and categorical variables as count and percentage. For comparison between groups, Pearson’s chi-squared test or Fisher’s exact test was used for the categorical variables, and the Mann–Whitney U test was used for continuous variables. Correlation among quantitative variables was assessed using the Pearson correlation coefficient. All statistical analyses were performed using R version 3.6.2. 17
Unstructured data elements and processing
Unstructured data elements
This study was based on features extracted from ED provider notes, including generic entities, signs and symptoms, and time intervals. Entity attributes (e.g. polarity) were also captured. Medical dictionaries from the Unified Medical Language System (UMLS) 18 were selected to extract relevant concepts from the clinical notes. Clinical notes (initial HPI of ED provider notes) were extracted. Any addendum to the initial notes was excluded using the EHR automatically generated date and time stamp.
Data-driven named entity selection
Provider notes were used to ascertain clinical states, including the initial signs and symptoms of the patients. Informative concept unique identifiers (CUIs) from the ED provider notes were selected using an objective function (Algorithm 1). This process ensured that irrelevant concepts were removed and discriminative entities were used for the model training. The selection algorithm was designed to maximize the similarity (measured by cosine) between the patients in the same groups while minimizing the similarity among patients between the groups. The iterative process was repeated (CUIs were removed from the initial set) for a maximum of 4000 iterations or until improvement in the objective function was at most 1E−06. This process was repeated for eight cycles to ensure selection stability.
Concept unique identifier selection procedure. The algorithm is designed to increase similarity among patients in the same group while decreasing the similarity among patients between groups using CUIs to assess the similarity. The CUI selection optimization is repeated until the termination condition is met (step 9). This process was repeated for eight cycles to ensure selection stability.

Natural language processing
Apache cTAKES 19 was used as the natural language processing (NLP) engine. Apache cTAKES is an open-source resource focusing on annotating and mapping clinical notes using the UMLS dictionaries. Along with term-to-concept mapping, different attributes pertinent to a CUI were also extracted. NLP engine outputs a sentiment score (polarity) for each concept (negative = −1; positive = 1) which ensures that the lack of certain signs and symptoms is captured correctly in the model (e.g. ‘patient does not exhibit any evidence of neurological deficits’). A lexical variant generator was used to address the misspellings and abbreviations, which are frequently observed in clinical notes. Figure 1(c) shows a section of a clinical note that is processed to generate CUIs with a polarity attribute.
Feature selection optimization from provider notes
After extracting concepts from each note, various post-processing steps were taken to create four different variations of the NLP output for ML-enabled model development as part of feature selection optimization [Figure 1(d)].
(a) The raw output created from the cTAKES is used as the benchmark dataset;
(b) The CUIs were converted to binary, representing the presence or absence of a concept, without consideration of the frequency or polarity of the concepts for each note;
(c) The CUIs were converted to binary, representing the presence or absence of a concept, without consideration of the frequency; however, the polarity was taken into consideration (e.g. if a CUI is associated with a negative polarity, that concept was converted to −1); and
(d) The raw output from cTAKES was used without consideration for the polarity of the concepts (any mention of the concepts was considered as positive).
Latent semantic indexing (LSI) was used as a data-driven dimensionality reduction strategy. More specifically, each of the four variations of NLP outputs was fed into the LSI20,21 pipeline, where the dimensionality of the features was reduced to 50%, 20%, 10%, and 5%, respectively, thus generating five versions for each of the four outputs note collections. The various post-processing and the LSI pipeline created 20 versions of the ED provider (four entity selection × five LSI levels) for modeling [Figure 1(d)].
Model development and validation
Models for predicting stroke were developed, based on data from September 2003 to May 2019, using a case–control design (cases: ischemic stroke; controls: non-stroke). The modeling pipeline is summarized in Figure 1(b). For each model, we used 80% of the data for model development and 20% (unseen data) for model testing. Using structured pre-event data from EHR, algorithms used included logistic regression (Generalized Linear Model, GLM), 22 extreme gradient boosting (XGB), 23 and random forest (RF). 24 Using unstructured provider notes at the time of ED encounter, selected algorithms included GLM, 22 XGB, 23 support vector machine (SVM), 25 and RF. 24 The selected algorithms represent major ML families of algorithms and are easy to implement in EHR-based cloud infrastructures. Each of the 20 different post-processed provider notes (based on feature selection optimization) was used in the classification model. A parameter grid was built to train the models with five fold repeated cross-validation with five repeats. Model tuning was performed by an automatic grid search with 10 different values to try for each algorithm parameter randomly. The performance metrics included the positive predictive value (PPV), negative predictive value (NPV), area under the receiver operating characteristics curve (AUROC), and accuracy.
Prospective model valuation
In addition, an independent validation cohort was prospectively collected from June 2019 to January 2021 and divided into pre- and post-COVID cohorts for prospective and temporal validation to assess the model robustness and performance on more recent ED verbiage during triaging. The cohort was divided into pre-COVID and post-COVID based on the encounter date (pre-COVID: 1 June 2019 to 16 March 2020; post-COVID: 16 March 2020 to 30 January 2021). Officials across the USA mandated lockdowns and travel restrictions on 16 March 2020.
Furthermore, a case study was also performed using five misdiagnosed stroke cases. The quality improvement leadership had tagged these five stroke patients as missed treatment opportunities, between June 2019 and March 2021. The goal of this step was to examine whether the constructed models would have been able to identify those five misdiagnosed stroke patients using pre-event and ED triaging data (during the initial encounter).
There were no overlaps between validation, testing, and development cohorts.
Results
Patients characteristics
To build and prospectively validate the models, we used structured and unstructured EHRs of 56,452 patient-encounters from 13 hospitals, from September 2003 to January 2021. We included a total of 49,155 patient-encounters (8900 consecutive ischemic stroke patients and 40,255 controls) for model development. Among these patients, 7232 (18.0%) encounters in the control group were identified as potential stroke mimics,26,27 presented with stroke-like symptoms (e.g. migraine headache, Todd’s paralysis, conversion disorder). The control group included a wide range of encounters with over 3000 different discharge diagnosis codes. Overall, 48.4% of the stroke and 53.5% of the control group were women. The stroke group was older (71.6 versus 67.9 years, p value < 0.001). Family history of heart disease was similar in both groups (35.6% versus 35.1%) while the family history of stroke was significantly higher in the case group (13.5% versus 10.1%, p value < 0.001). The most common pre-event comorbidities among the case group were hypertension (49.9%), dyslipidemia (42.8%), diabetes (23.8%), chronic lung (17.6%), and kidney disease (15.1%). The most common pre-event comorbidities among the control group were hypertension (57.9%), dyslipidemia (49.3%), diabetes (29.9%), depression (28.6%), and anxiety disorder (25.1%). Table 1 summarizes the patient characteristics in different groups. The two variables with the highest missingness levels were hemoglobin A1c (57.6%) and low-density lipoprotein (46.4%), for which indicator variables were also used. The missingness for the other variables ranged from 0.0% to 19.9%. All quantitative variables were only weakly correlated [highest correlation coefficient was 0.49 for diastolic versus systolic blood pressure (BP), followed by 0.35 for white blood cell versus platelet count, Supplemental Figure S1].
Predicting stroke in ED using structured data
The three ML models achieved model accuracy and AUROC above 0.88 using only the patient’s pre-event information. The best model, based on AUROC and accuracy, was XGBoost (model accuracy: 0.89 with 95% CI of 0.87–0.90; AUROC: 0.92; NPV: 0.91; PPV: 0.74). The next best model was RF, with the highest PPV of 0.80, an AUROC of 0.91, a model accuracy of 0.88, and a 95% CI of 0.86–0.89. Finally, the model based on GLM also achieved high performance–model accuracy of 0.88 with 95% CI of 0.86–0.88; AUROC of 0.88, NPV of 0.89, and PPV of 0.74 (Supplemental Table S1).
The most important feature averaged across the different algorithms was age (average feature importance: 93.69%), followed by hemoglobin (average feature importance: 91.11%), hemoglobin A1c (HbA1c, average feature importance: 80.78%), and systolic BP (average feature importance: 57.22%). Other important features included laboratory-based features (creatinine, white blood cell count, platelet count) and baseline variables (e.g. BMI). The number of days since the last outpatient visit was among the top 15 features (average importance: 34.82%). Figure 2 summarizes the model performance (panel a) and the feature importance [Figure 2(b) and (c) and Supplemental Table S2].
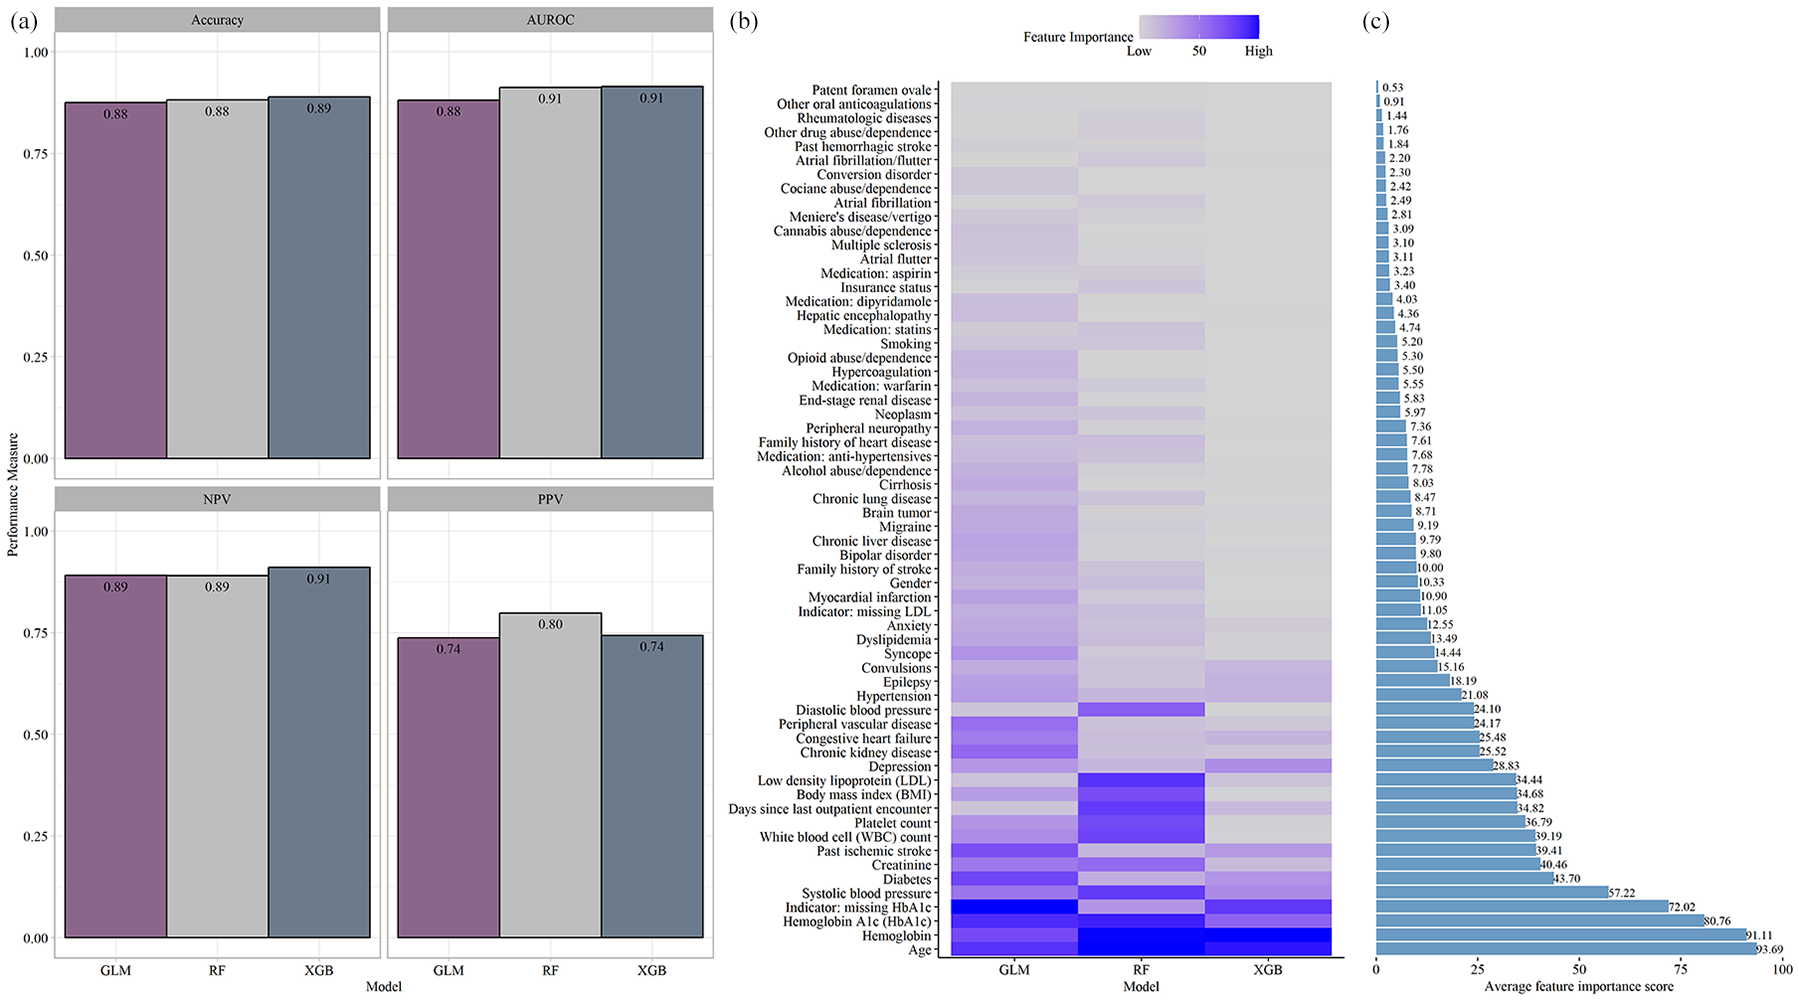
(a) Model performance of the models using retrospective structured data. (b) Feature importance extracted from the three algorithms. (c) Average feature importance.
Predicting stroke in ED using unstructured data
We analyzed the initial recording of the history of the present illness (HPI) at the ED and excluded any late addition, addendum, or correction using the time stamp. The follow-up notes (e.g. progress, history and physical (H&P), and nursing notes) were excluded. We applied the cTAKES NLP (with 55 UMLS dictionaries, see Supplemental Table S3) to the provider ED notes and removed irrelevant CUIs based on Algorithm 1. This process identified 480 CUIs that were identified as relevant for the prediction models (Supplemental Table S4).
In general, we observed that the inclusion of concept words without dimensionality reduction (using LSI) improved the model performance. Furthermore, even though four out of five models were based on the post-COVID cohorts, the model performance from pre- and post-COVID was comparable [the shape of the radar graphs in Figure 3(a)]. Further post hoc analysis highlighted that the five models reached a balanced AUROC, sensitivity, and specificity performance. Overall, four models had a complete set of CUIs. For most of the models, the inclusion of the negation detector was important for the model performance (in three out of the five models, negation was included in the NLP pipeline). Among the five best models, three were based on SVM and two on RF.

(a) Performance of all the models developed using unstructured data. (b) The pattern of CUIs in the development and prospective validation cohorts for cases and controls. In the validation cohort, the patients with a discharge diagnosis indicating stroke mimic (Development Cohort – CONTROLS-2) are represented separately to highlight similarity with the stroke cases in terms of their notes. Development Cohort – CONTROLS-1 represents all the patients in the control group, excluding stroke mimics. Each row represents one CUI.
Using the 20% of the unseen testing dataset, model performance ranged from AUROC of 0.95 to 0.99. In prospective validation using data from pre- and post-COVID, model performance, as measured by AUROC, ranged from 0.93 to 0.99. Model sensitivity and specificity were high, reaching 0.90 and 0.99, respectively. The PPV and NPV ranged from 0.80 to 0.98 and from 0.87 to 0.90, respectively. The model performance measures and model parameters (of the top five performing models) are provided in Tables 2 and 3. Further analysis of the most informative concepts (i.e. 480 CUIs from notes) highlighted that the pattern of concepts among the stroke is different from the non-stroke cohort [Figure 3(b)]. Among the top five models (Table 3), there is one model (model ID: 5) that shows significantly higher FP and that could likely be due to the fact that in that setting, the design was based on a ‘binary’ post-processing and only 10% of the CUIs were included.
Top five performing NLP-based models and their performance measured in prospective validation.
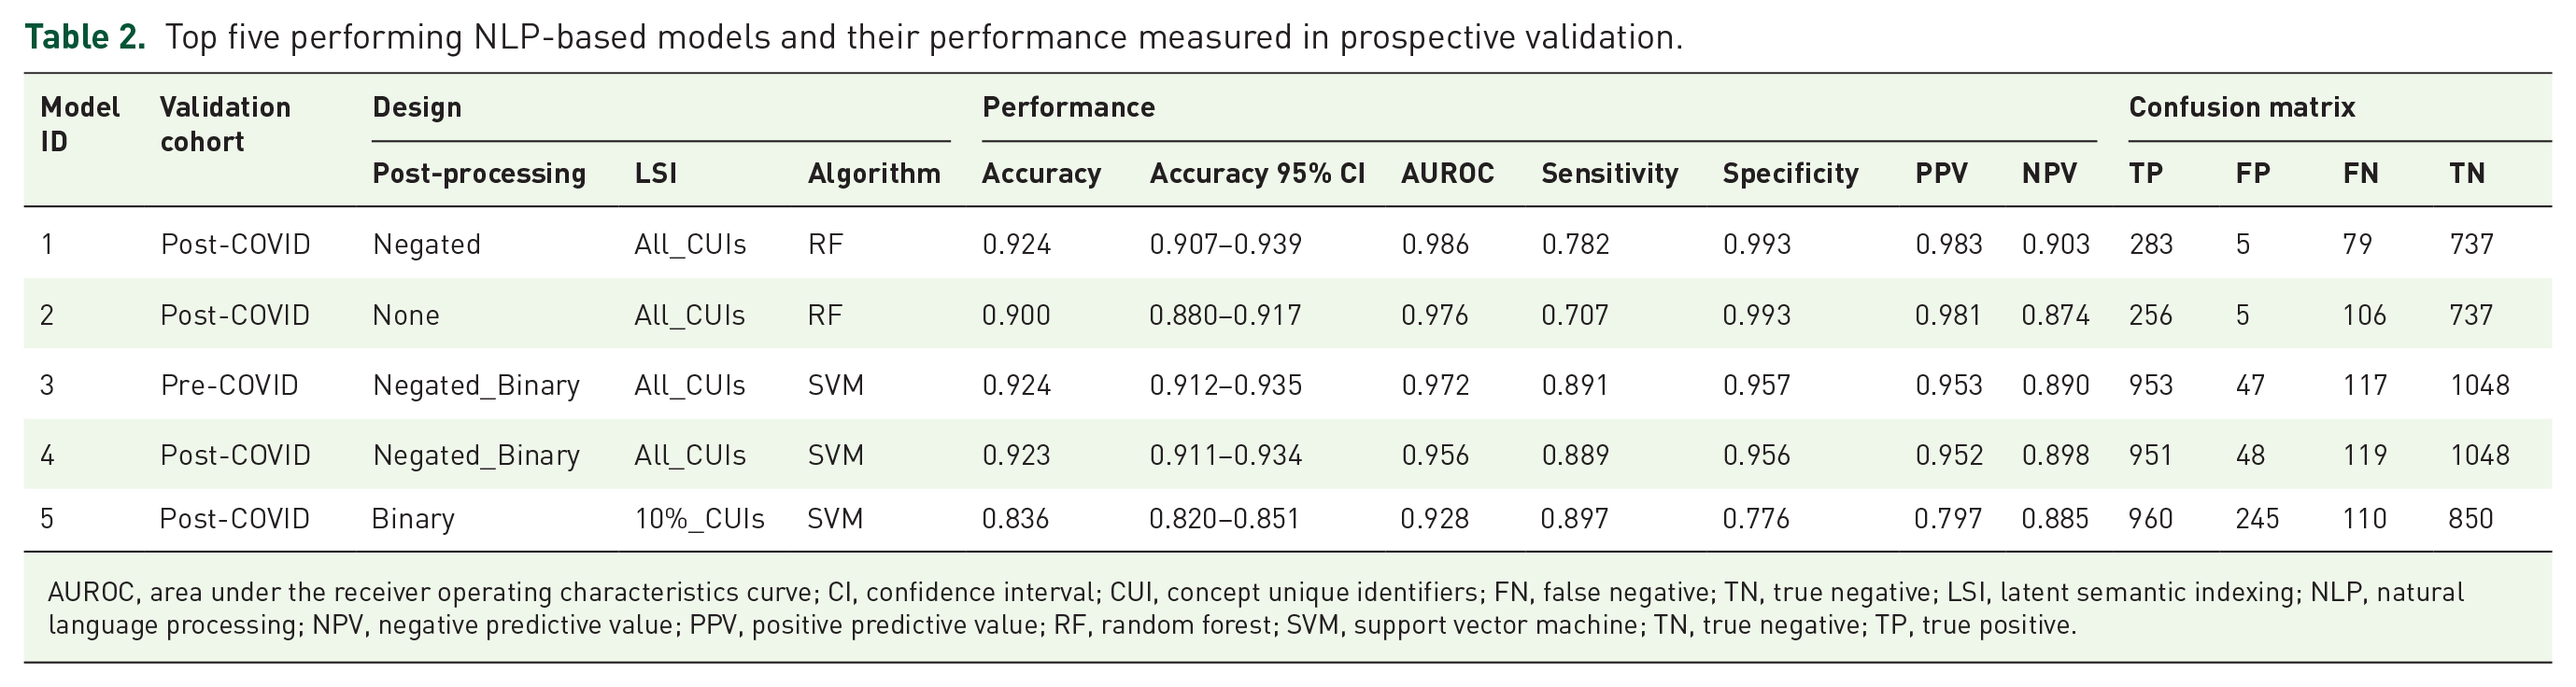
AUROC, area under the receiver operating characteristics curve; CI, confidence interval; CUI, concept unique identifiers; FN, false negative; TN, true negative; LSI, latent semantic indexing; NLP, natural language processing; NPV, negative predictive value; PPV, positive predictive value; RF, random forest; SVM, support vector machine; TN, true negative; TP, true positive.
Top five performing NLP-based models and model parameters.

CI, confidence interval; CUI, concept unique identifiers; LSI, latent semantic indexing; NLP, natural language processing; RF, random forest; SVM, support vector machine.
Predicting stroke in ED: a case study on misdiagnosed patients
A total of five patients were analyzed as a case study. These patients were tagged as missed treatment opportunities by the system quality improvement leadership at Geisinger Health System. The ED presentation HPI was extracted and processed in the same way. Overall, two patients were female and three were male, and the average age at onset was 78 years. When assessing the ability of the ML models developed for the clinical notes, our results showed that RF, SVM, and XGB were able to correctly identify the five ED notes as stroke for all five patients. However, the model developed based on GLM had a lower performance (correctly identifying two out of the five cases).
We also tested the models trained on pre-event structured clinical data. Two of the five patients were new patients without prior data. Our results showed that one of the three patients (with historical data) would have been correctly classified (see Table 4) by the model.
Performance of the models when tested on the five misdiagnosed cases.

The five misdiagnosed patients were two female patients (with age at onset 84 and 65) and three male patients (with age at onset 86, 81, and 74).
CUI, concept unique identifiers; GLM, logistic regression; NLP, natural language processing; RF, random forest; XGB, extreme gradient boosting.
Discussion
Artificial intelligence (AI) is driving innovation in cardiovascular and cerebrovascular medicine. 28 However, in the field of stroke, many studies are still solely retrospective with limited sample size and with inherent biases due to modeling strategies.28,29 We developed two modeling pipelines to predict stroke in ED. The first was based on structured pre-event data, readily available in EHRs. The second pipeline was based on provider notes taken during the initial ED encounter. The second pipeline was temporally and prospectively validated with recent pre- and post-pandemic data. Finally, we assessed the ability of both pipelines on five misdiagnosed cases from our healthcare system as a case study. These two pipelines can be combined for more accurate predictions; however, we reported the performances separately since currently, many healthcare systems do not have the infrastructure to timely and automatically extract and process clinical notes.
We showed that patients’ EHRs are rich in information that can be used to identify those at risk for primary or secondary prevention. Furthermore, mining pre-event clinical data does not require real-time data access and advanced resources which might make it more suitable to many institutions. Implementation of such a recommender flag system can be seamless without affecting the ED workflow. Using notes in real time for the detection of stroke is novel and can have clinical value as it does not require patients with available past medical history, especially in busy urban settings. Our case study shows that if such a system had been implemented, the five patients would have been flagged and would have potentially received timely care. Furthermore, the use of Apache cTAKES 19 provides scalability, transparency, and an unbiased training process, that can be customized for individual health systems, which is still a limitation of more recent NLP tools such as BERT 30 and large language models. Using the more established NLP such as cTAKES can lead to practical applications with fine-tuning and model training that can be done at a system level for different patient demographics and care management while safeguarding patient data from data breaches.
Our results support the results of other smaller studies. Bacchi and colleagues 31 showed that deep learning-based NLP based on medical free-text might prove effective in predicting the cause of TIA-like presentations. We have previously shown that ML models are effective in differentiating stroke from its mimics using clinical data. 11 Our recent pilot study using ML models has shown promising results in differentiating between causes of TIA-like presentations. 32 In addition, with the advances in AI, more clinical applications are being presented when NLP is applied to ED notes, 33 admission notes, 34 etc. We have also elaborated on the technical, operational, and ethical challenges associated with the implementation of an ML-based decision support system for stroke. 12 Finally, even though this framework targets ED; EMS and telemedicine/telehealth could be viable targets.
Interpretation of findings
Clinical data, including initial encounter notes, can be used to automatically screen for possible stroke cases in the emergency room. Such a system can be embedded as a stroke-alert tool in the EHR. Furthermore, we showed that mining pre-event clinical data can help risk stratify patients for improved stroke prediction. Risk stratification based on clinical notes requires added model fine-tuning based on unstructured data from the healthcare system to ensure the system is customized based on the characteristics of the health system and its patient population.
Study limitations
Clinical notes are unique to a healthcare system and may require a different level of pre-processing. While Geisinger has rich longitudinal data with a stable population, the EHR data remain prone to noise. Furthermore, pre-event data may be limited in centers with a high in-/out-migration rate, in that case, an NLP-based model that uses information during the ED encounter may be more suitable. Finally, using EHR, we did not have any means to capture patients who declined admission or left the ED before the workup was completed or the diagnosis of stroke was made. We want to further emphasize that we only performed internal and temporal validation, further external validation is warranted to evaluate generalizability and identify potential sources of systemic biases, if any.
Conclusion
Available clinical data can be leveraged to reduce stroke misdiagnosis. This study leveraged pre-event and at-encounter level EHR for stroke prediction. The results indicate that available clinical information can be used for building EHR-based stroke prediction models and ED stroke alert systems; however, further external validation is needed to assess the generalizability of the presented approach.
Supplemental Material
sj-docx-1-tan-10.1177_17562864241239108 – Supplemental material for Machine Learning-Based Prediction of Stroke in Emergency Departments
Supplemental material, sj-docx-1-tan-10.1177_17562864241239108 for Machine Learning-Based Prediction of Stroke in Emergency Departments by Vida Abedi, Debdipto Misra, Durgesh Chaudhary, Venkatesh Avula, Clemens M. Schirmer, Jiang Li and Ramin Zand in Therapeutic Advances in Neurological Disorders
Footnotes
References
Supplementary Material
Please find the following supplemental material available below.
For Open Access articles published under a Creative Commons License, all supplemental material carries the same license as the article it is associated with.
For non-Open Access articles published, all supplemental material carries a non-exclusive license, and permission requests for re-use of supplemental material or any part of supplemental material shall be sent directly to the copyright owner as specified in the copyright notice associated with the article.