
Abstract
Background:
Corneal immune cells (ICs) are antigen-presenting cells that are known to increase ocular and systemic inflammatory conditions.
Objective:
We aimed to assess longitudinal changes in corneal IC in patients with multiple sclerosis (MS) and relation to disability and ongoing treatment.
Design:
Prospective observational study conducted between September 2016 and February 2020.
Methods:
Patients with relapsing-remitting MS (RRMS) (n = 45) or secondary progressive MS (SPMS) (n = 15) underwent corneal confocal microscopy (CCM) at baseline and 2-year follow-up for estimation of corneal IC density [dendritic cells with (DCF) (cells/mm2) or without nerve fiber contact (DCP); and non-dendritic cells with (NCF) or without nerve fiber contact (NCP)]. Optical coherence tomography, neuroimaging, and disability assessments were additionally performed. Healthy controls (n = 20) were assessed at baseline.
Results:
In both RRMS and SPMS compared to controls, DCP (p < 0.001 and p < 0.001, respectively) and DCF (p < 0.001 and p = 0.005) were higher and NCF (p = 0.007 and p = 0.02) was lower at baseline. DCP showed excellent performance in identifying patients with MS (sensitivity/specificity = 0.88/0.90) followed by DCF (0.80/0.75) and NCF (0.80/0.85). At follow-up compared to baseline, DCP (p = 0.01) was significantly reduced, and NCP (p = 0.004) and NCF (p = 0.04) were increased. Subgroup analysis showed that baseline NCP and NCF were significantly higher (p = 0.04–0.05) in patients who switched disease-modifying treatment, and baseline NCP (p = 0.05) was higher in patients on interferon.
Conclusion:
Baseline and change in corneal IC were related to axonal degeneration and treatment status. Evaluation of corneal IC using CCM may allow an assessment of ongoing inflammation, disease progression, and the effect of treatment in MS.
Introduction
Multiple sclerosis (MS) is a chronic inflammatory, central demyelinating disorder, and axonal loss is a key determinant of disease progression. Neuroinflammation is present in all stages of the disease, due to activation of the innate and adaptive immune systems. 1 Neuropathological hallmarks of inflammation include multifocal white matter demyelinating lesions, 2 impaired blood–brain barrier function, 3 leptomeningeal inflammation, 4 and lymphocyte infiltration in the brain parenchyma. 5 Newer methods such as quantitative gadolinium magnetic resonance imaging (MRI) scanning, 6 T2 Fluid-Attenuated Inversion Recovery (FLAIR) MRI, 7 susceptibility imaging, 8 positron emission tomography, 9 and magnetic resonance spectroscopy 10 can assess inflammation. Although T2-FLAIR MRI with gadolinium enhancement can be used to quantify inflammatory activity in addition to white matter lesion counts, the use of contrast should be justified. 11 Positron emmision tomography studies are useful to assess chronic microglial activation but have low specificity due to poor spatial resolution and lack of microglia-specific radioligands. 12 Magnetic resonance spectroscopy of brain myoinositol may act as a biomarker of astrogliosis, but its specificity is questionable as it is also expressed in cells other than astrocytes. 13
Surrogate endpoints of neurodegeneration have attracted considerable interest to monitor and predict MS progression. Optical coherence tomography (OCT) has shown retinal nerve fiber layer (RNFL) thinning in MS, but this may be attenuated during acute optic neuritis (ON). 14 We and others have used corneal confocal microscopy (CCM) to show a corneal axonal loss, independent of ON and related it to the severity of MS.15–21 Corneal plasmacytoid dendritic immune cells (ICs) are bone marrow-derived antigen-presenting cells responsible for inducing primary immune responses and establishing immunologic memory via antigen capture and T-cell stimulation, respectively. 22 Recent experimental evidence has shown that corneal IC plays an important role in corneal nerve degeneration. 23 Alterations in their density, morphology, and distribution have been demonstrated in Sjogren’s syndrome, 24 rheumatoid arthritis, 25 systemic lupus erythematosus, 26 and chronic inflammatory demyelinating polyradiculoneuropathy. 27 In MS, Bitirgen et al. first showed increased dendritic cell density in patients with relapsing-remitting MS (RRMS), 15 with a significant increase in patients with worsening disability at follow-up.16,28 Khan et al. 29 demonstrated increased corneal IC density in patients with RRMS, to a lesser extent in secondary progressive MS (SPMS) and clinically isolated syndrome, and showed an association with cognitive function and neurological disability. In the present study, we have prospectively assessed alterations in corneal IC density in relation to corneal and retinal axonal morphology, disease-modifying treatment, MRI abnormality, and neurological disability.
Methods
Study participants and setting
This is a prospective, observational study conducted in Doha, Qatar (September 2016–2020). Patients with RRMS (n = 45) and SPMS (n = 15) underwent assessment of neurological disability, cranial MRI, and CCM at baseline and follow-up. Age-matched, healthy controls (n = 20) were assessed at baseline (Figure 1). Reporting of results in this study followed the STROBE guidelines. Inclusion criteria were MS diagnosis 30 and age 18–75 years. Exclusion criteria were the presence of ophthalmic disease, active ON (<6 months from diagnosis of ON episode), and history of ophthalmic surgery. Patients with comorbidities associated with peripheral neuropathy were also excluded.

Flow diagram of individuals at each stage of the study.
Clinical assessments
The expanded disability status scale (EDSS) was used to rate neurological impairment. The MS severity score (MSSS) was calculated from EDSS and MS duration. 31 The number of relapses and annualized relapse rate (ARR) were used as indications of disease activity over time. For the 25-foot walking test (25 FWT), the time was calculated from the starting point until the 25-foot mark. All clinical assessments preceded CCM except for cranial MRI scans, which were performed ±1 month from ophthalmic assessments based on availability. Clinical information was obtained from the participant’s electronic medical records.
Corneal confocal microscopy
CCM scans (Heidelberg Retinal Tomograph III Rostock Cornea Module, Heidelberg Engineering GmbH, Heidelberg, Germany) were performed as per the established methodology. 32 Based on location (apical cornea) and clarity (i.e. visibility of subbasal nerves without pressure lines), eight non-overlapping images/participants were analyzed by the same examiner with CCMetrics/ACCMetrics.27,32 The corneal nerve parameters measured were corneal nerve fiber density (CNFD) (fibers/mm2), corneal nerve branch density (CNBD) (branches/mm2), corneal nerve fiber length (CNFL) (mm/mm2), and corneal nerve fractal dimension analysis (CNFrD). Corneal ICs were assessed on the same images.27,33 Cells were classified into dendritic cells (DC) and non-dendritic cells based on morphology, and the corneal IC parameters measured were dendritic cells with fiber contact (DCF) (cells/mm2), without fiber contact (DCP) (cells/mm2), and non-dendritic cells with fiber contact (NCF) (cells/mm2), and without fiber contact (NCP) (cells/mm2) (Figure 2). The CCM parameters are presented as an average of analyzed images per participant. All CCM examiners were masked to the subtype of MS, clinical, and MRI examination results. Intra-rater reliability of corneal IC quantification was assessed by re-analyzing images of n = 16 (20%) patients (four healthy controls; nine patients with RRMS; and three patients with SPMS).
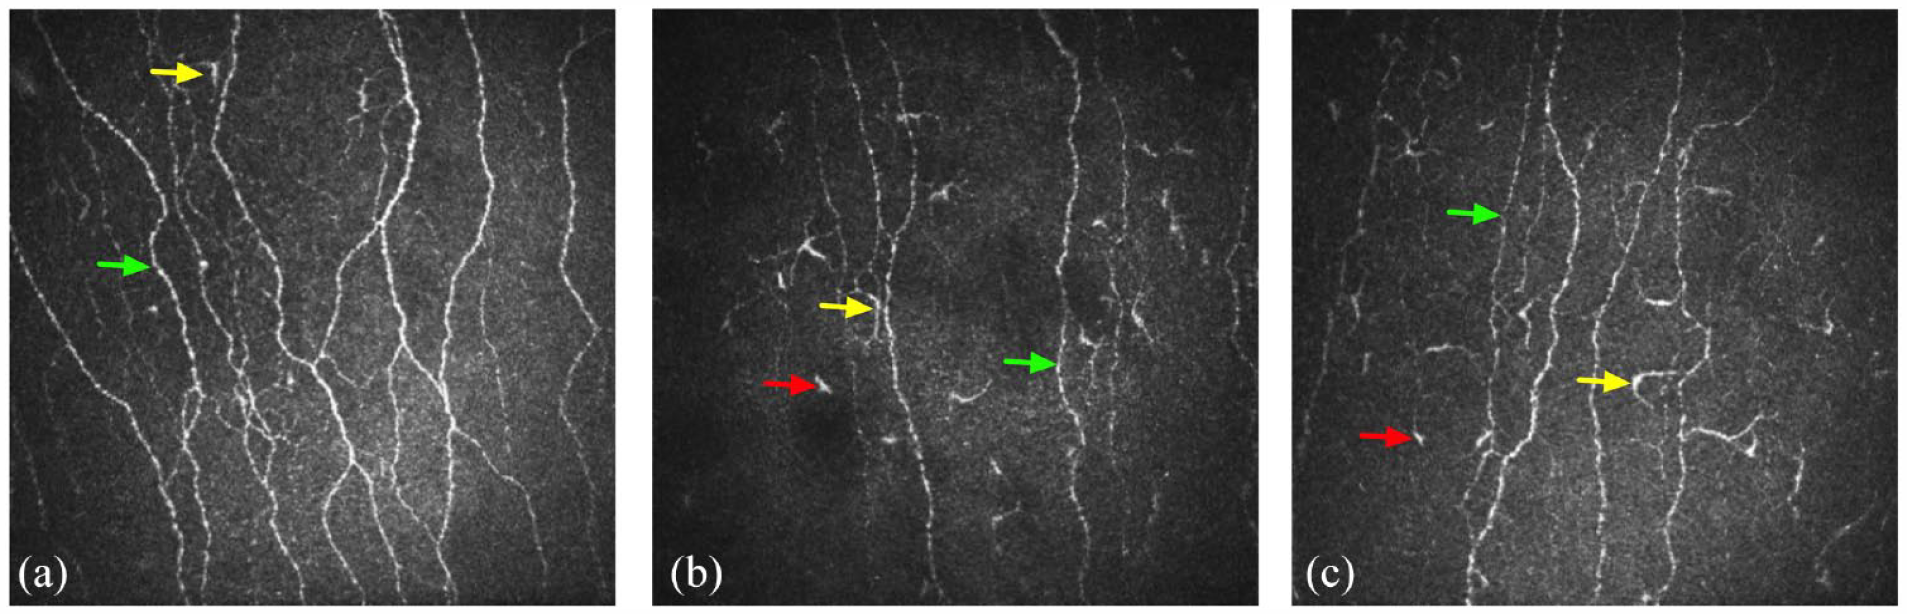
CCM images of the subbasal nerve plexus from a healthy control (a), a patient with RRMS at baseline (b), and the same patient with RRMS at follow-up (c). Yellow arrows denote dendritic cells with/without contact with the nerve fibers and red arrows denote non-dendritic cells with/without contract with the nerve fibers. Green arrows denote corneal axons.
Optical coherence tomography
Peripapillary RNFL thickness measurements were performed with a spectral-domain OCT (Spectralis OCT, Heidelberg Engineering GmbH, Heidelberg, Germany) under the same lighting conditions without pupil dilation. RNFL measurements were performed using circular scans with the eye tracker activated to minimize motion artifacts. All RNFL scans in this study were performed in high-speed mode, and a signal strength of ⩾20/30 was set as the minimum acceptable quality. Follow-up RNFL scans were performed using the ‘progression’ function. The built-in segmentation function was used to calculate peripapillary RNFL thickness.
Statistical analysis
IBM SPSS Statistics for Mac, version 26 (IBM Corp., Armonk, NY, USA) and Prism 9 for Mac, Version 9.4.1 (GraphPad Software, San Diego, CA, USA) were used for the statistical analysis and graphic illustrations in this study. This study was originally powered to detect differences in corneal nerve morphology in patients with MS compared to controls. 28 Post hoc power calculation using univariate analysis of variance with baseline DCP as the dependent variable and patient status as the fixed factor showed that a sample of n = 80 participants (effect size = 0.17, p < 0.001) provides 97.8% power with alpha = 0.05. Continuous data were tested for normality using a Shapiro–Wilk test (p > 0.05) and relevant histograms (Q–Q plots). Baseline and follow-up CNFD, CNBD, CNFL, and RNFL followed a normal distribution, while baseline and follow-up EDSS, MSSS, ARR, number of relapses, 25 FWT, DCP, DCF, NCF, and NCP did not follow a normal distribution. An unpaired t-test or nonparametric Mann–Whitney U test was used for comparisons between the MS group and healthy controls; a paired t-test was used for comparisons between MS patients at baseline and follow-up. One-way ANOVA (post hoc Bonferroni) or nonparametric Kruskal–Wallis (Dunn’s test for multiple comparisons correction) was used for comparisons between controls and MS subtypes. Receiver operating characteristic (ROC) curve analysis was performed to assess the diagnostic performance of corneal IC measurements. Cutoff points that balanced sensitivity and specificity were selected based on Youden’s index. Spearman’s correlation analysis was performed to assess the relationship between corneal IC measurements, and demographic, clinical, corneal, retinal nerve measurements, and time. The intra-class correlation coefficient [95% confidence interval (CI), p Value] was used to assess the intra-rater reliability of corneal IC analysis. Typically, ICC values ⩾0.8 are considered very good and ⩾0.9 indicate excellent reliability. Continuous parametric data are expressed as (mean difference, 95% CI of differences, p Value) and nonparametric data as (median difference, 95% CI of differences, p Value). The reported p values are two-sided and a p ⩽ 0.05 was considered significant.
Data availability
All anonymized, individual-level data used in this manuscript are available to qualified researchers by direct request to the corresponding author. All interested applicants will be asked to sign a data transfer agreement according to institutional regulations prior to receiving any data.
Results
Baseline demographic and clinical results
There was no significant difference in age [controls versus RRMS (−2.5, −4.0−3.0, p = 1.0); controls versus SPMS (−5.5, −2.0–10.0, p = 0.59); RRMS versus SPMS (−3.0, −2.0–9.0, p = 0.53)] or sex between controls and patients with MS. Patients with SPMS, compared to RRMS, had a significantly longer time since diagnosis of MS (−4.0, −6.0 to −1.0, p = 0.005); more relapses (−3.0, −1.0 to −3.0, p < 0.001), greater ARR (−1.52, −2.06 to −0.62, p < 0.001), EDSS (−4.0, −5.0 to −2.0, p < 0.001), and MSSS (−4.27, −5.55 to −2.56, p < 0.001) (Table 1).
Baseline demographic, clinical, and ophthalmic characteristics.
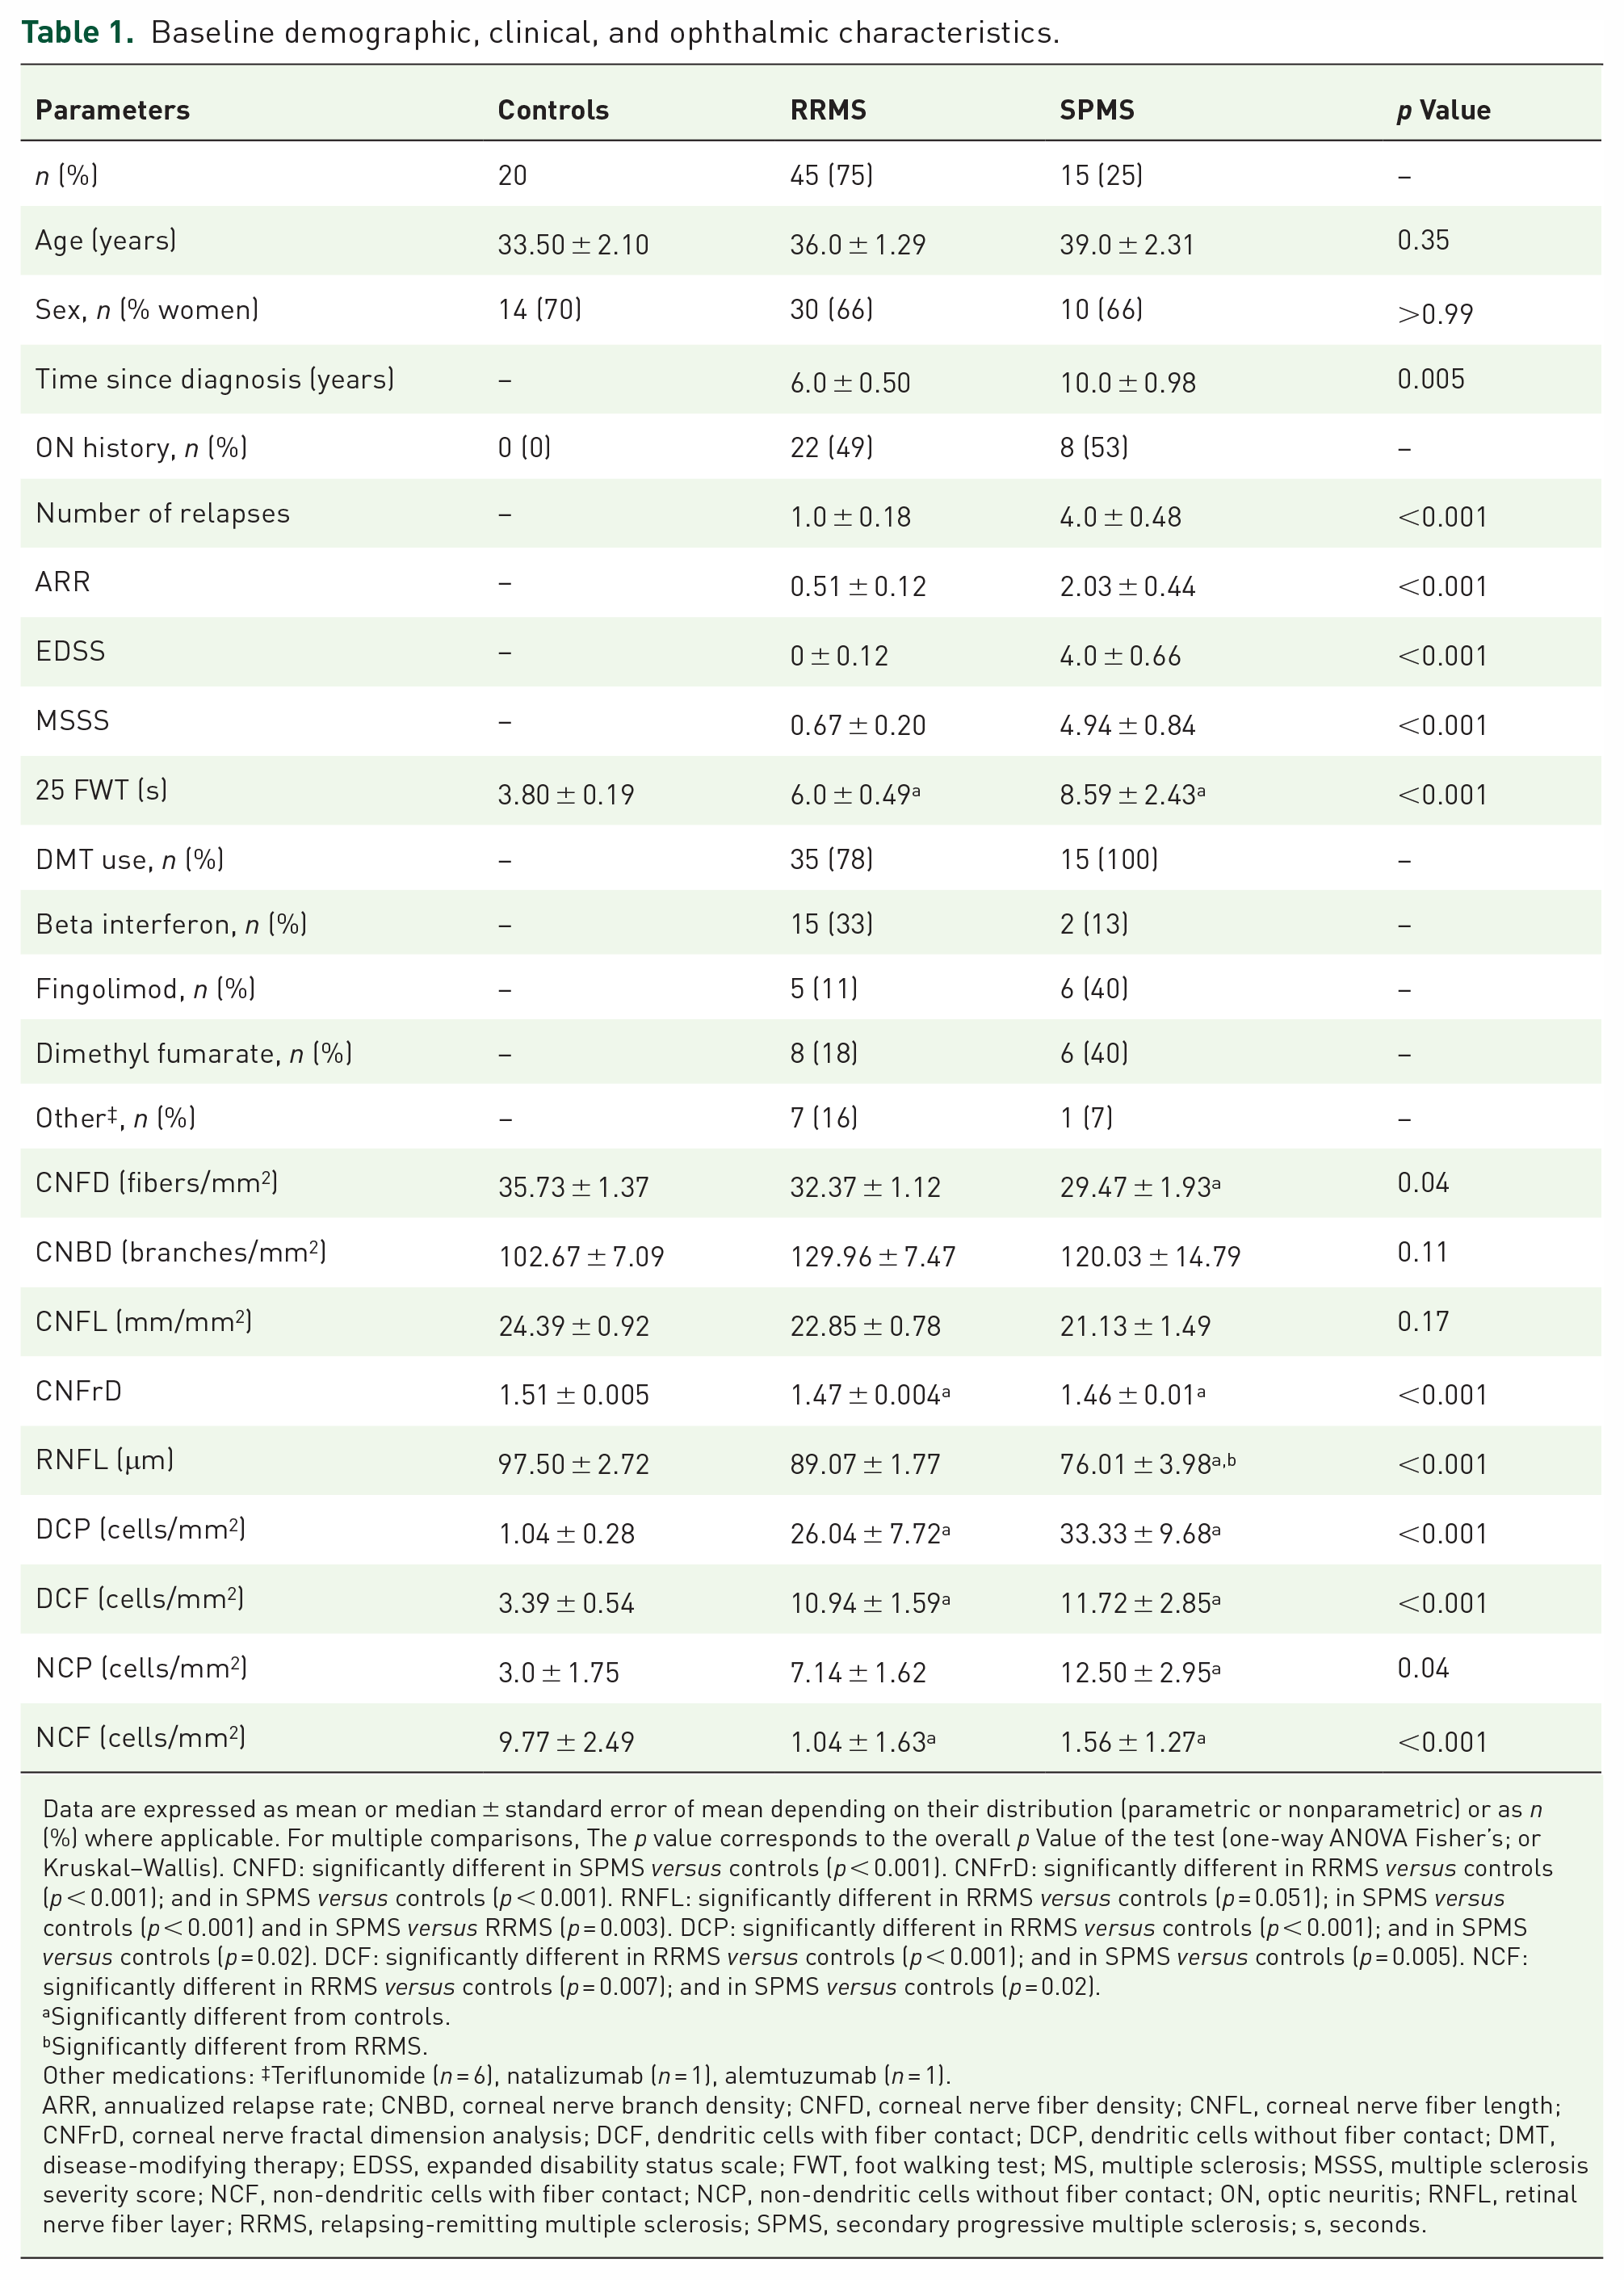
Data are expressed as mean or median ± standard error of mean depending on their distribution (parametric or nonparametric) or as n (%) where applicable. For multiple comparisons, The p value corresponds to the overall p Value of the test (one-way ANOVA Fisher’s; or Kruskal–Wallis). CNFD: significantly different in SPMS versus controls (p < 0.001). CNFrD: significantly different in RRMS versus controls (p < 0.001); and in SPMS versus controls (p < 0.001). RNFL: significantly different in RRMS versus controls (p = 0.051); in SPMS versus controls (p < 0.001) and in SPMS versus RRMS (p = 0.003). DCP: significantly different in RRMS versus controls (p < 0.001); and in SPMS versus controls (p = 0.02). DCF: significantly different in RRMS versus controls (p < 0.001); and in SPMS versus controls (p = 0.005). NCF: significantly different in RRMS versus controls (p = 0.007); and in SPMS versus controls (p = 0.02).
Significantly different from controls.
Significantly different from RRMS.
Other medications: ‡Teriflunomide (n = 6), natalizumab (n = 1), alemtuzumab (n = 1).
ARR, annualized relapse rate; CNBD, corneal nerve branch density; CNFD, corneal nerve fiber density; CNFL, corneal nerve fiber length; CNFrD, corneal nerve fractal dimension analysis; DCF, dendritic cells with fiber contact; DCP, dendritic cells without fiber contact; DMT, disease-modifying therapy; EDSS, expanded disability status scale; FWT, foot walking test; MS, multiple sclerosis; MSSS, multiple sclerosis severity score; NCF, non-dendritic cells with fiber contact; NCP, non-dendritic cells without fiber contact; ON, optic neuritis; RNFL, retinal nerve fiber layer; RRMS, relapsing-remitting multiple sclerosis; SPMS, secondary progressive multiple sclerosis; s, seconds.
Baseline corneal ICs
Healthy controls versus RRMS
DCP (25.0, 15.62–44.35, p < 0.001) and DCF (7.56, 4.90–12.50, p < 0.001) were higher and NCF (−8.73, −11.72 to −4.17, p < 0.001) was lower in patients with RRMS compared to healthy controls at baseline (Table 1 and Figure 3).

Scatter plots of baseline corneal immune cell density. Graphs represent the median and 95% confidence interval (dashed and continuous black lines, respectively) overlaid with the full data range for DCP (a), DCF (b), NCP (c), and NCF (d). Data circles represent controls (blue), patients with RRMS (red), and SPMS (yellow).
Healthy controls versus SPMS
DCP (32.29, 14.58–54.43, p < 0.001), DCF (8.34, 3.91–14.62, p < 0.001), and NCP (9.51, 1.23–13.28, p = 0.02) were higher and NCF (−8.21, −13.28 to −3.12, p < 0.001) was lower in patients with SPMS compared to healthy controls at baseline (Table 1 and Figure 3).
RRMS versus SPMS
There was no significant difference in corneal IC parameters between RRMS and SPMS subgroups at baseline (Table 1 and Figure 3).
ROC curve analysis
DCP showed excellent performance to identify patients with MS [area under the curve (AUC) = 0.92, 95% CI = 0.85–0.98, p < 0.001, sensitivity/specificity = 0.88/0.95, likelihood ratio = 17.67 using DCP > 3.78 cells/mm2 as cutoff point] followed by DCF (0.83, 0.75–0.92, p < 0.001, 0.80/0.75, 3.20, DCF > 4.32 cells/mm2); NCF (0.86, 0.78–0.94, p < 0.001, 0.80/0.85, 5.33, NCF < 4.58 cells/mm2); and NCP (0.66, 0.51–0.81, p = 0.03, 0.78/0.55, 1.74, NCP > 3.48 cells/mm2) (Figure 4).

Receiver operating characteristics curve analysis of baseline DCP (a), DCF (b), NCP (c), and NCF (d) (all shown as black lines) with reference line (red line) to assess their ability to distinguish between controls and patients with MS.
Follow-up demographic and clinical results
The average follow-up time was 18.26 ± 4.27 months. In patients with RRMS at follow-up, there was a significant increase in the number of relapses (0.2, 0.06–0.34, p = 0.008) and ARR (0.04, 0.04–0.23, p = 0.008) and a significant decrease in MSSS (−0.07, −0.18 to −0.03, p < 0.001) and the 25 FWT (−1.50, −2.70 to −0.08, p = 0.02]. In patients with SPMS at follow-up, there was a significant increase in the number of relapses (0.4, 0.12–0.68, p = 0.03) and ARR (0.12, 0.07–0.44, p = 0.03) (Table 2).
Baseline and follow-up demographic, clinical, and ophthalmic characteristics.

Data are expressed as mean ± standard error of mean or as n (%) where applicable. p Values have been generated with a paired t-test.
Other medications: Teriflunomide (n = 9), natalizumab (n = 1), alemtuzumab (n = 1), ocrelizumab (n = 1), and rituximab (n = 1).
ARR, annualized relapse rate; CNBD, corneal nerve branch density; CNFD, corneal nerve fiber density; CNFL, corneal nerve fiber length; CNFrD, corneal nerve fractal dimension analysis; DCF, dendritic cells with fiber contact; DCP, dendritic cells without fiber contact; DMT, disease-modifying therapy; EDSS, expanded disability status scale; FWT, foot walking test; MS, multiple sclerosis; MSSS, multiple sclerosis severity score; NCF, non-dendritic cells with fiber contact; NCP, non-dendritic cells without fiber contact; ON, optic neuritis; RNFL, retinal nerve fiber layer; RRMS, relapsing-remitting multiple sclerosis; SPMS, secondary progressive multiple sclerosis; s, seconds.
Follow-up corneal immune cells
Multiple sclerosis
In patients with MS, there was a significant reduction in DCP (−9.81, −29.22 to −4.74, p = 0.01) and a significant increase in NCP (4.18, 3.46–22.1, p = 0.004) and NCF (0.96, −0.82–5.31, p = 0.04) at follow-up compared to baseline (Table 2 and Figure 5). There was no significant correlation between follow-up time and the difference between baseline and follow-up DCP (r = −0.07, −0.32 and 0.20, p = 0.62), DCF (r = −0.03, −0.29–0.24, p = 0.83), NCP (r = 0.01, −0.25–0.27, p = 0.92), and NCF (r = −0.1, −0.35–0.17, p = 0.46).

Corneal immune cells in patients with MS at baseline compared to follow-up. Graphs represent the median and 95% confidence interval (dashed and continuous black lines respectively) overlaid with the full data range for DCP (a), DCF (b), NCP (c), and NCF (d). Data circles represent data points outside this range for patients with MS (red) at baseline and follow-up.
Relapsing-remitting multiple sclerosis
In patients with RRMS, there was a significant reduction in DCP [−9.80, −30.81 to −3.30, p = 0.02] and a significant increase in NCP [1.49, 2.97–25.90, p = 0.01] at follow-up compared to baseline (Table 2).
Secondary progressive multiple sclerosis
In patients with SPMS, there was no significant change in DCP, DCF, NCP, and NCF at follow-up compared to baseline (Table 2).
Subgroup analysis
Corneal ICs in relation to corneal nerve parameters
Patients with MS were classified according to their baseline status into patients with low corneal axonal density based on a CNFD, CNBD, or CNFL lower than the 25th percentile (CNFD < 27.08 fibers/mm2; CNBD < 82.42 branches/mm2; or CNFL < 19.32 mm/mm2). Patients with low baseline CNFD (n = 14) compared to all other patients (n = 46) had significantly higher EDSS (1.50, 0–3.0, p = 0.02), MSSS (3.01, 0.20–4.47, p = 0.02) and DCP at baseline (32.29, 0–76.0, p = 0.05), and significantly higher EDSS (1.50, 0–2.50, p = 0.05), ARR (0.91, 0–1.53, p = 0.05), and DCP (32.59, 3.56–47.16, p = 0.01) at follow-up [Figure 6(a)–(c)]. Patients with low baseline CNBD (n = 15) had significantly higher DCP (32.26, 10.16–45.05, p < 0.001) and DCF (2.22, 0–7.2, p = 0.05) at follow-up [Figure 6(d)–(f)]. Patients with low baseline CNFL (n = 15) had significantly higher DCP at follow-up (32.26, 8.04–44.82, p = 0.002) [Figure 6(g)–(i)].

DCP at baseline and follow-up for patients with MS with reduced baseline CNFD. Dot plots represent the mean (bold black line) with data points (full range) and 25th percentile (dashed line) for CNFD (a), CNBD (d), and CNFL (g). (b, c, e, f, h, and i) Graphs represent median and 95% confidence interval (dashed and continuous black lines, respectively) overlaid with the full data range for DCP at baseline and follow-up categorized by baseline CNFD, CNBD, and CNFL status, respectively (>25th percentile versus <25th percentile).
Corneal IC in relation to a new clinically documented relapse at follow-up
Patients with a new relapse (n = 13) compared to patients without a new relapse (n = 47) at follow-up had a significantly higher baseline EDSS (0.50, 0–1.50, p = 0.02), MSSS (1.77, 0.10–2.28, p = 0.04), and DCP (25.5, 0–48.21, p = 0.05) and follow-up MSSS (0.46, 0.05–0.71, p = 0.03), ARR (1.31, 0.37–2.03, p = 0.005), and NCP (9.38, 0.89–15.71, p = 0.03). Furthermore, patients with a new relapse compared to patients without a new relapse had significantly lower baseline CNFD (−4.76, −9.39 to −0.13, p = 0.04) and CNFL (−3.41, −6.70 to −0.13, p = 0.04).
Corneal IC in relation to new gadolinium-enhancing lesions at follow-up
Cranial MRI at follow-up showed that eight patients with MS had new gadolinium-enhancing lesions. Patients with new lesions compared to patients without new gadolinium-enhancing lesions at follow-up had a significantly higher baseline CNBD (37.07, 0.63–73.5, p = 0.05) with no further differences in clinical, corneal IC parameters, and RNFL at baseline or follow-up.
Corneal ICs in relation to the history of previous ON
In patients with MS with previous ON compared to patients who never had ON, baseline EDSS (1.0, 0–1.5, p = 0.01), baseline and follow-up relapses [(1.0, 0–1.0, p = 0.007); (1.0, 0–2.0, p = 0.002) respectively] and baseline and follow-up ARR [(0.94, 0–1.01, p = 0.01); (0.71, 0.19–1.16, p = 0.005) respectively] were significantly higher. There was no significant difference in any of the ophthalmic parameters.
Corneal IC in relation to disease-modifying treatment status
At follow-up compared to baseline, 19 (32%) patients with MS switched to a different disease-modifying treatment (n = 8), restarted (n = 6), or were off treatment (n = 5). In patients whose disease-modifying treatment had changed at follow-up compared to patients who were on the same treatment, baseline NCP [1.79, 0.23–10.42, p = 0.04], and NCF [7.18 (2.56), 2.06–12.29, p = 0.05] were significantly higher. There were no significant differences in follow-up demographic, clinical, or ophthalmic parameters.
Corneal IC in relation to baseline interferon
Patients on interferon at baseline compared to all other patients, excluding patients off treatment, had significantly lower follow-up ARR (0.77, 0–1.32, p = 0.03) and significantly increased baseline NCP (3.64, −0.21–7.74, p = 0.05). There was no significant difference in baseline or follow-up relapses, EDSS, MSSS, 25 FWT, CNFD, CNBD, CNFL, RNFL, DCP, DCF, NCF, and follow-up ARR.
Corneal IC in relation to baseline fingolimod
Patients on fingolimod at baseline compared to all other patients, excluding patients off treatment, had significantly higher baseline EDSS (3.25, 0–5.5, p = 0.03) and MSSS (4.54, 0.03–6.09, p = 0.04) and follow-up EDSS (5.0, 0–6.0, p = 0.03). There was no significant difference in baseline or follow-up relapses, ARR, 25 FWT, CNFD, CNBD, CNFL, RNFL, DCP, DCF, NCF, and NCP.
Corneal IC in relation to baseline dimethyl fumarate
Patients on dimethyl fumarate at baseline compared to all other patients, excluding patients off treatment, had significantly lower follow-up RNFL (−9.71, −18.29 to −1.14, p = 0.03). There was no significant difference in baseline or follow-up relapses, ARR, 25 FWT, EDSS, MSSS, CNFD, CNBD, CNFL, CNFrD, DCP, DCF, NCF, and NCP.
Correlation analysis
Baseline DCP correlated with baseline CNFL (r = −0.27, −0.50 to −0.01, p = 0.04), DCF (r = 0.78, 0.66–0.86, p < 0.0001), NCP (r = 0.29, 0.03–0.0.51, p = 0.02); and with follow-up NCF (r = 0.27, 0.005–0.49, p = 0.04) and NCP (r = 0.55, 0.34–0.71, p < 0.0001). Follow-up DCP correlated with baseline CNFD, CNBD (both: r = −0.27, −0.50 to −0.009, p = 0.04), CNFL (r = −0.29, −0.51 to −0.03, p = 0.02); and with follow-up CNBD (r = −0.32, −0.53 to −0.06, p = 0.01), CNFL (r = −0.27, −0.50 to −0.01, p = 0.04), and DCF (r = 0.75, 0.61–0.85, p < 0.0001). Baseline NCF correlated with baseline NCP (r = 0.47, 0.24–0.65, p = 0.0002). Follow-up NCF correlated with baseline DCF (r = 0.32, 0.06–0.53, p = 0.01) and NCP (r = 0.32, 0.07–0.54, p = 0.01); and with follow-up NCP (r = 0.65, 0.47–0.77, p < 0.0001). Baseline NCP correlated with baseline DCF (r = 0.33, 0.07–0.54, p = 0.01) and follow-up NCP (r = 0.35, 0.09–0.56, p = 0.007). Follow-up NCP correlated with baseline DCF (r = 0.41, 0.17–0.61, p = 0.001) (Figure 7).
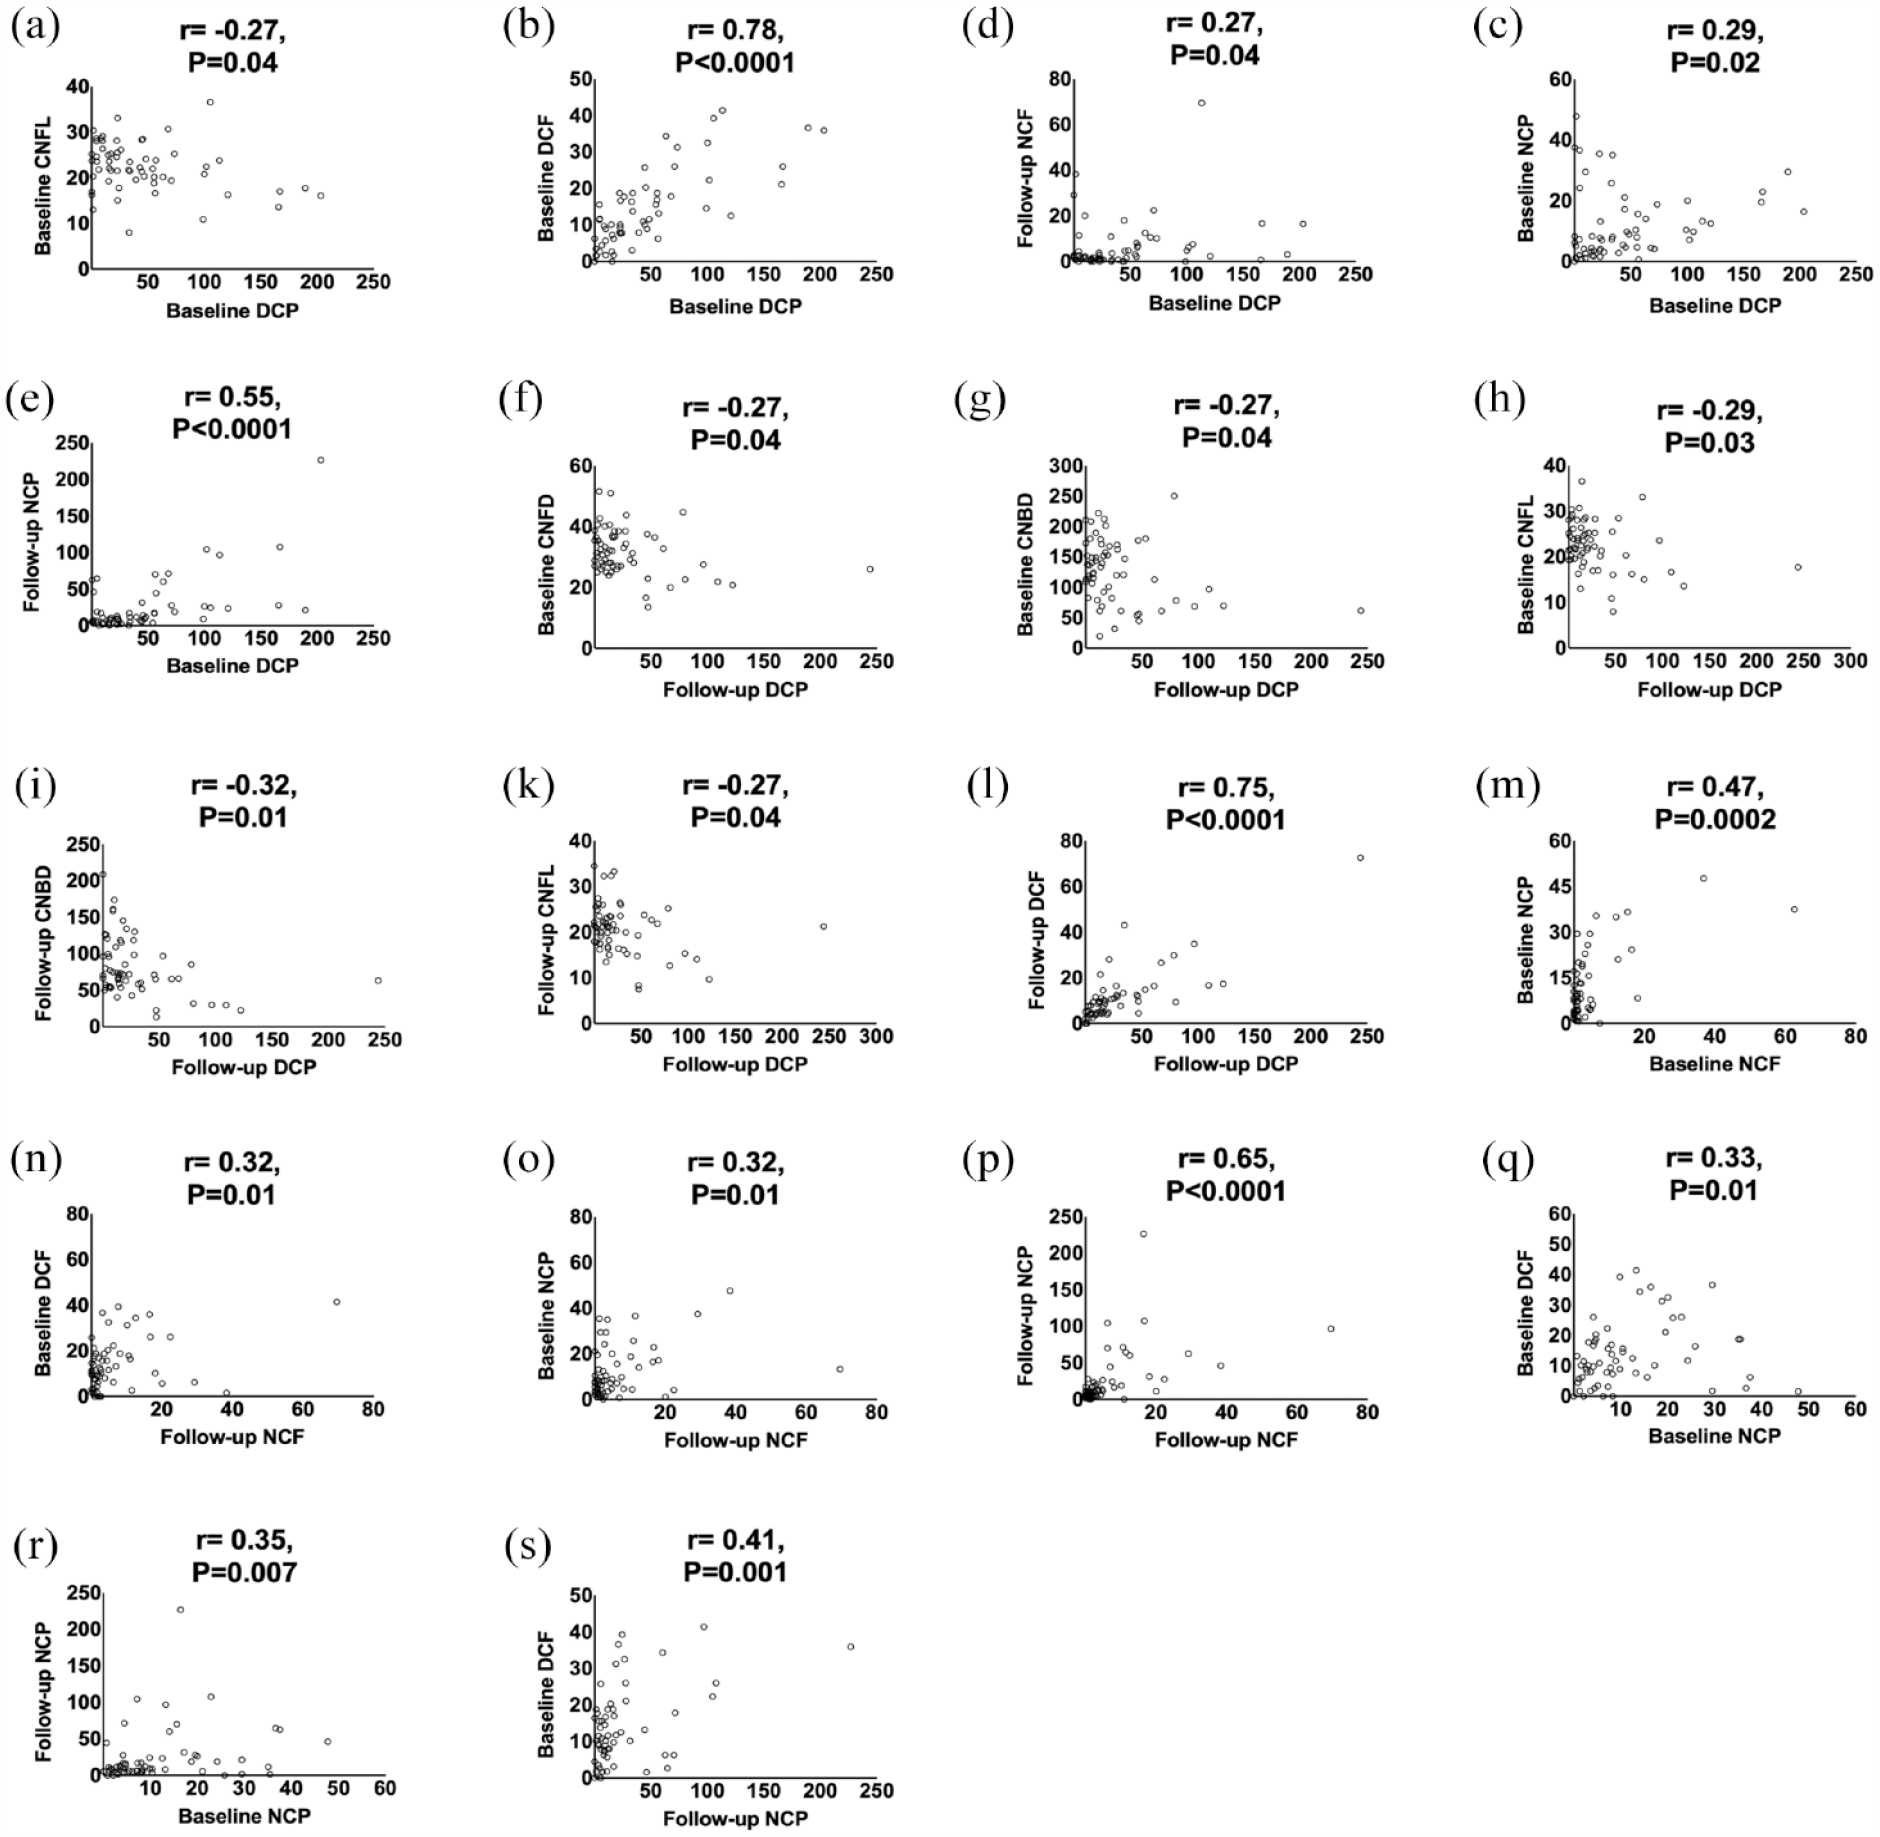
Correlation analysis of corneal immune cell parameters (a–s).
Reliability of corneal IC analysis
Intra-rater reliability was excellent for DCF (0.96, 0.89–0.99, p < 0.0001), DCP (0.98, 0.95–0.99, p < 0.0001), NCF (0.99, 0.98–0.99, p < 0.0001), and NCP (0.99, 0.98–0.99, p < 0.0001).
Discussion
The present study has four main findings. First, DCP and DCF were higher and NCF was lower in patients with RRMS and SPMS compared to healthy controls at baseline and all three parameters showed excellent diagnostic performance to distinguish between patients with MS and controls. Second, there was a significant decrease in DCP with a significant increase in NCP at follow-up, particularly in RRMS. Third, patients with MS with a lower baseline corneal axonal density had significantly increased DCP at follow-up. Fourth, NCF and NCP were higher and increased during follow-up in patients who switched disease-modifying treatments, and there was a greater increase in NCF at follow-up in patients on interferon treatment.
Inflammation is present during all stages of MS and plays a key role in neurodegeneration 34 as evidenced by axonal loss in both relapsing and progressive MS brain lesions.35,36 Outside the brain, MS eyes affected by ON exhibit greater retinal axonal loss, compared to the contralateral unaffected eyes, suggesting a similar pathologic pattern. 37 Although current neuroimaging techniques can assess inflammation in vivo, methodological issues such as the use of radioligands limits their wider adoption as resourceful endpoints. Corneal axons can be rapidly quantified by CCM and we have previously shown excellent diagnostic performance in diabetic neuropathy and other neurodegenerative disorders. 38 We and others previously demonstrated significant corneal axonal loss in MS,15–21 which correlated with neurological disability and progressed over time.16,28 Apart from axons, the cornea also contains corneal ICs, which are immature dendritic cells (MHC-class II, CD80 negative, and/or CD86 negative). These cells act as antigen-presenting cells and form part of the innate immune system. They mediate inflammation by expressing higher levels of MHC-II, and other co-stimulatory molecules such as CD80 and CD86. 39 Apart from molecular alterations, dendritic cells change their volume, sphericity, and motility to elicit adaptive immune responses by priming naive T cells at the draining lymph nodes to effector T cells.40,41 In a study investigating different models of corneal inflammation, dendritic cell morphology was differentially affected in acute compared to chronic inflammation. 42
Bitirgen et al. 15 first reported increased dendritic cell density in patients with RRMS. Subsequently, we extended these findings to a larger cohort of patients with MS and also demonstrated a correlation with neurological disability and cognitive performance. 29 In the present study, we have used an established protocol 27 from a study in patients with chronic inflammatory demyelinating polyradiculoneuropathy, whereby cells are categorized into dendritic or non-dendritic types based on size and further subdivided into cells with or without nerve fiber contact. The former measurement allows quantification of cell density while the latter enables quantification of neuroimmune interaction. This is relevant as previous studies have shown that these cells are closely located to nerves during steady state and dissociate during inflammation. 43 Indeed, Stettner et al. 27 showed that higher corneal IC density was associated with reduced nerve density in patients with chronic inflammatory demyelinating polyradiculoneuropathy (CIDP) and greater neurological disability and painful symptoms. In a subsequent study, corneal dendritic cell density was higher in patients with CIDP compared to diabetic neuropathy, suggesting that IC assessment could distinguish inflammatory from non-inflammatory neuropathies. 33 Higher dendritic cell density has also been reported in patients with autoimmune dry eye disease compared to non-immune dry eyes, suggesting a relationship with the degree of immune system activation. 44 We report for the first time a significant increase in DCP and DCF in both RRMS and SPMS at baseline, indicating inflammation, that was associated with the severity of corneal nerve loss. Indeed, a DCP > 3.26 cells/mm2, a DCF > 4.32 cells/mm2, and NCF < 4.58 cells/mm2 showed excellent diagnostic performance to distinguish controls from patients with MS. Reassuringly, all corneal IC measurements showed excellent intra-rater reliability. A recent study in patients with symptomatic comorbid dry eye disease showed that the presence of more than two dendritic cells was indicative of an underlying autoimmune condition. 45
There is a lack of natural history data on longitudinal alterations in corneal IC density and morphology. Previously, dendritic cells were shown to decrease following topical45,46 or systemic 25 anti-inflammatory treatment over 4 weeks to 6 months. In patients with CIDP, a baseline IC count >30 cells/mm2 had a 100% sensitivity for predicting disease progression over 6 months. 47 In MS, we have previously shown a significant increase in dendritic cells over 2 years in smaller sample of patients with RRMS, 16 while others have recently reported no change in remitting patients over 6 months. 48 In the present study, our results at follow-up suggest that both dendritic and non-dendritic cells undergo dynamic alterations, particularly in RRMS, independent of newly confirmed relapses. Moreover, these alterations are not related to time while these two morphological subtypes appear to follow opposing trajectories, although they are both associated with a reduction in corneal axonal density at follow-up. Considering that morphological and topographic alterations are hallmarks of corneal IC activity, the present results potentially reflect a pro-inflammatory corneal environment underpinning progressive corneal neurodegeneration.
Increased corneal IC density has been inversely correlated with reduced corneal nerve density 49 in patients with bacterial keratitis and has been related to increased levels of pro-inflammatory cytokines. 50 In systemic disease, the data are currently scarce. A recent study reported a significant increase in dendritic cell density and size in patients with Sjogren’s compared to non-Sjogren’s dry eye disease, which correlated with disease-specific antibodies. 24 In patients with rheumatoid arthritis, Villani et al. 25 reported a marginal increase in dendritic cell density with no difference in corneal nerve morphology. In patients with systemic lupus erythematosus, Bitirgen et al. 26 showed a significant reduction in CNBD which correlated inversely with corneal IC density. In our study, patients in the lowest 25th percentile of corneal nerve measures at baseline exhibited a significantly higher DCP density at follow-up, indicating a relationship between corneal axonal loss and immune system activation in patients with MS. Although it is unclear if this effect is systemic or localized, our protocol excluded patients with MS with a history of active ocular disease or prior ocular surgery.
Previous studies have shown that topical or systemic treatment can alter corneal IC density. Topical combination treatment with an immunosuppressant and an anti-inflammatory drug in patients with symptomatic dry eye disease resulted in a significant reduction in dendritic cell density 45 and systemic anti-inflammatory treatment with prednisone in patients with rheumatoid arthritis resulted in a significant reduction in dendritic cell density. 25 Chiang et al. 51 reported reduced corneal nerves and a significant increase in immature dendritic cells in patients with cancer treated with oxaliplatin. Corneal dendritic cell density increased dramatically without corneal nerve alterations in a patient with breast cancer after 11 weeks of treatment with paclitaxel and trastuzumab 52 and then returned to baseline values after cessation of paclitaxel therapy. 53 In the present study, baseline NCF and NCP were higher in patients who switched disease-modifying treatment during follow-up and baseline NCP was higher in patients on interferon. In this context, we hypothesize that higher corneal IC density may reflect reduced treatment effectiveness against underlying inflammation.
We acknowledge certain limitations in our study. First, the relatively short follow-up time does not allow adequate interpretation of our findings in relation to disability worsening. Second, the lack of follow-up in the healthy controls also limits the interpretation of our findings. Third, we did not examine patients immediately after a disease relapse, which would have potentially provided important insights into changes in corneal IC morphology in relation to immune system activation. In summary, we show significant alterations in corneal IC at baseline and follow-up in patients with MS. These alterations are more prominent in patients with lower baseline corneal nerve density, and in those who switch disease-modifying treatments or are on interferon. Future studies need to establish the annualized rate of change in corneal IC morphology and its relationship with markers of systemic inflammation, disease relapses, brain atrophy, and disability worsening.