
Abstract
Background:
Resourceful endpoints of axonal loss are needed to predict the course of multiple sclerosis (MS). Corneal confocal microscopy (CCM) can detect axonal loss in patients with clinically isolated syndrome and established MS, which relates to neurological disability.
Objective:
To assess corneal axonal loss over time in relation to retinal atrophy, and neurological and radiological abnormalities in MS.
Methods:
Patients with relapsing-remitting (RRMS) (n = 68) or secondary progressive MS (SPMS) (n = 15) underwent CCM and optical coherence tomography. Corneal nerve fibre density (CNFD-fibres/mm2), corneal nerve branch density (CNBD-branches/mm2), corneal nerve fibre length (CNFL-mm/mm2) and retinal nerve fibre layer (RNFL-μm) thickness were quantified along with neurological and radiological assessments at baseline and after 2 years of follow-up. Age-matched, healthy controls (n = 20) were also assessed.
Results:
In patients with RRMS compared with controls at baseline, CNFD (p = 0.004) and RNFL thickness (p < 0.001) were lower, and CNBD (p = 0.003) was higher. In patients with SPMS compared with controls, CNFD (p < 0.001), CNFL (p = 0.04) and RNFL thickness (p < 0.001) were lower. For identifying RRMS, CNBD had the highest area under the receiver operating characteristic (AUROC) curve (0.99); and for SPMS, CNFD had the highest AUROC (0.95). At follow-up, there was a further significant decrease in CNFD (p = 0.04), CNBD (p = 0.001), CNFL (p = 0.008) and RNFL (p = 0.002) in RRMS; in CNFD (p = 0.04) and CNBD (p = 0.002) in SPMS; and in CNBD (p = 0.01) in SPMS compared with RRMS. Follow-up corneal nerve loss was greater in patients with new enhancing lesions and optic neuritis history.
Conclusion:
Progressive corneal and retinal axonal loss was identified in patients with MS, especially those with more active disease. CCM may serve as an imaging biomarker of axonal loss in MS.
Introduction
The assessment of clinical disability and neuroimaging constitute the mainstay for assessing disease progression and therapeutic decision making in multiple sclerosis (MS). While the burden of inflammation on magnetic resonance imaging (MRI) can predict clinical outcomes to some extent, 1 quantitative evaluation of lesion metrics has failed to account fully for disease progression. 2 Moreover, in more advanced disease, neurodegeneration may occur in the absence of neuroinflammation. 3 Indeed, neuronal and axonal loss are major pathological features of irreversible and progressive MS 4 accompanied by progressive brain atrophy and ventricular enlargement. 5 However, the accuracy of automated brain volumetric assessment has been questioned, 6 with the demonstration of hypertrophy of the putamen 7 and an increase in brain volume in 26.3% of longitudinal scans. 8
There has been considerable interest in evaluating surrogate markers of neurodegeneration to monitor and predict disease progression, and as endpoints in trials of neuroprotection in MS. 9 Optical coherence tomography (OCT) has been used to show retinal nerve fibre layer (RNFL) thinning in MS and has been related to the severity of axonal damage in the visual pathways 10 and brain atrophy. 11 Corneal confocal microscopy (CCM) is a rapid, non-invasive ophthalmic imaging technique, which enables in vivo assessment of the corneal subbasal nerves. 12 CCM has been used to demonstrate axonal loss in a range of peripheral neuropathies, including diabetic neuropathy, 13 Friedreich’s ataxia, 14 chronic inflammatory demyelinating polyneuropathy 15 and chemotherapy-induced neuropathy. 16 Longitudinal studies have also established that CCM can predict incident diabetic neuropathy, 17 and clinical trials18–20 have shown that CCM identifies early nerve regeneration which precedes an improvement in symptoms, neurophysiology and intra-epidermal nerve density.
We and others have also demonstrated corneal nerve loss in patients with MS,21–26 Parkinson’s disease 27 and dementia. 28 In our recent study of a cohort of patients with relapsing-remitting MS (RRMS), followed over 2 years, we showed that progressive corneal nerve loss was associated with increasing disability. 29 We aimed to compare corneal and retinal axonal loss longitudinally in patients with MS in relation to neurological and radiological abnormalities.
Methods
Study participants and setting
The present study constitutes a pooled analysis of two prospective, observational studies conducted in Doha, Qatar (September 2016–March 2020), and Konya, Turkey (May 2016–July 2020). This research followed the tenets of the Declaration of Helsinki and obtained approvals from the institutional review boards of Weill Cornell Medicine–Qatar (1500064 with approval date 2 May 2016), Hamad Medical Corporation (15218/15 with approval date 5 September 2016) and the research ethics committee of Necmettin Erbakan University, Meram Faculty of Medicine (2016/570 with approval date 27 May 2016; and 2018/1134 with approval date 5 January 2018). Participants or their legally authorized representatives gave informed written consent to participate in this study. Patients with RRMS (n = 68) and secondary progressive MS (SPMS) (n = 15) underwent assessment of neurological disability, CCM and OCT at baseline and follow-up using a standardized protocol. Age-matched, healthy controls (n = 20) were also assessed at baseline. Four patients with MS (RRMS = 3, SPMS = 1) were lost to follow-up. Reporting of results in this study followed the STARD guidelines 30 and a participant flow chart is presented in Figure 1. Inclusion criteria were diagnosis of MS based on the 2010 McDonald criteria 31 and age 18–75 years. Exclusion criteria were regular contact lens use (>3 times/week), presence of chronic ophthalmic disease, active optic neuritis (ON), or history of refractive or cataract surgery. Patients with metabolic, rheumatologic or neurologic co-morbidities associated with peripheral neuropathy were excluded based on glycated haemoglobin A1c, presence of anti-nuclear antibody, serum B12/folate, immunoglobulins and medical history.
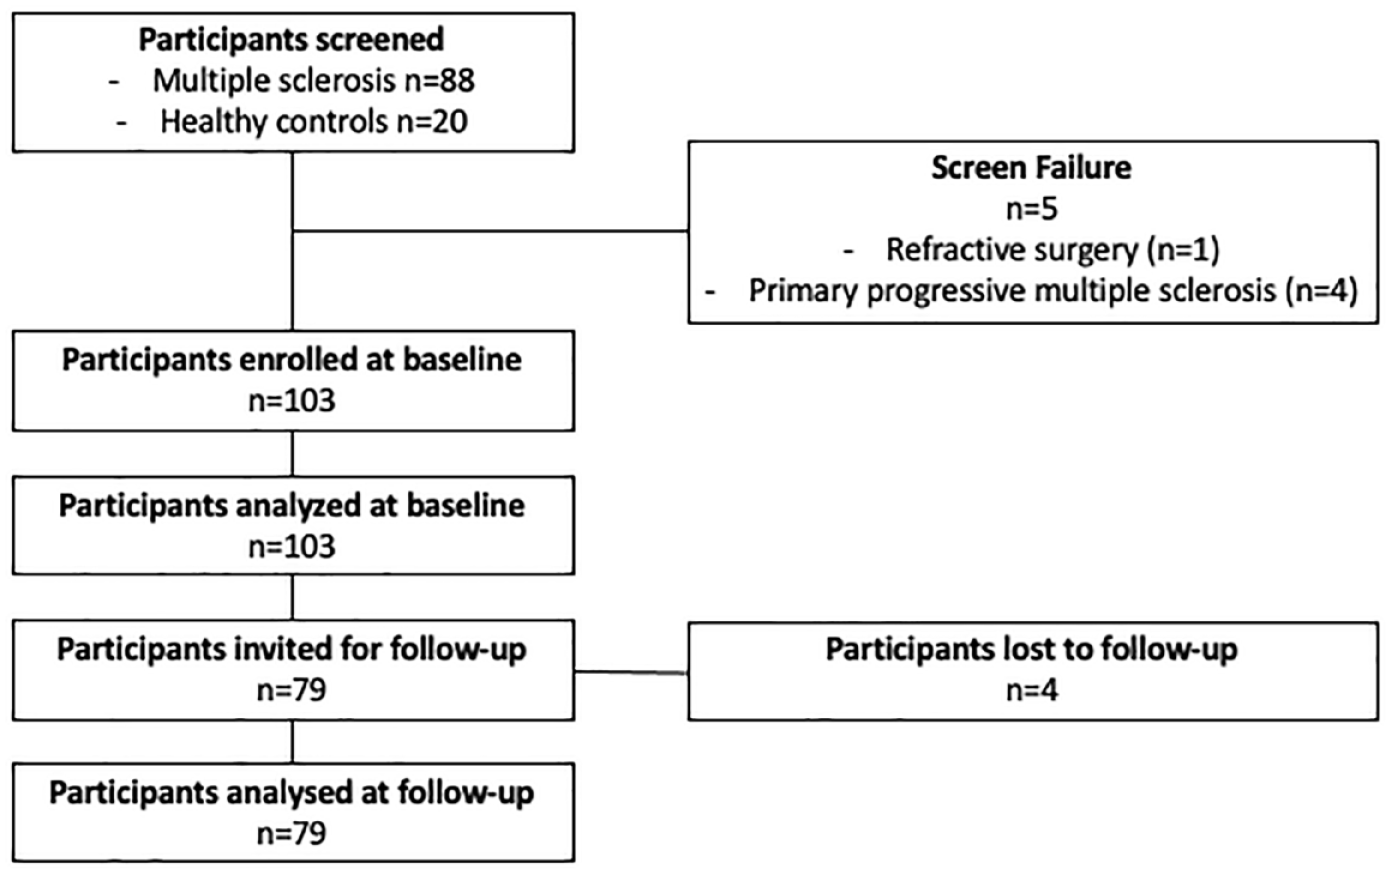
Participant flow chart.
Clinical assessments
The expanded disability status scale (EDSS) 32 was used to rate neurological impairment. The EDSS is a physician-administered composite ranging from 0 (normal) to 10 (death due to MS) in 0.5 increments (from EDSS > 1). Scores from 0 to 4 evaluate general neurological function; 4 to 6 focuses on walking ability; and scores > 6 indicate loss of independence. The MS severity score (MSSS) was calculated from the EDSS and MS duration. 33 The annualized relapse rate (ARR) was calculated as the ratio of the total number of relapses divided by the total number of days in the study for the group multiplied by 365. Clinical assessments preceded ophthalmic assessments. Brain MRI (Magnetom Skyra 3T, Siemens Medical Systems, Erlangen, Germany) was performed for all follow-up patients within 1 month of clinical and ophthalmic assessments and T1-weighted images were captured at axial, coronal and three-dimensional (3D) MP-RAGE sagittal planes. Enhancing lesions at follow-up were detected on post-contrast, T1-weighted images with fat saturation.
CCM
CCM scans (Heidelberg Retinal Tomograph III Rostock Cornea Module, Heidelberg Engineering GmbH, Heidelberg, Germany) were performed as per our established methodology13,34 in the same room, under constant light conditions by four trained examiners. Scans were performed on the right eye of healthy controls and patients without ON, on the ON eye in patients with history of unilateral ON, or on the right eye in patients with history of bilateral ON. Longitudinal studies have established that RNFL loss is greater in ON versus non-ON eyes.35,36 The same has not yet been established for CCM. Based on central location and clarity (i.e. visibility of subbasal nerves without pressure lines), three non-overlapping images/patient from the central subbasal nerve plexus were manually analysed using CCMetrics (Courtesy of Prof. RA Malik, Weill Cornell Medicine–Qatar of Cornell University, Doha, Qatar) as per our established protocol 37 by the same examiner. The specific parameters measured were corneal nerve fibre density (CNFD) (fibres/mm2), corneal nerve branch density (CNBD) (branches/mm2) and corneal nerve fibre length (CNFL) (mm/mm2), and the results were calculated as an average of analysed images per participant. Examiners were masked to the subtype of MS, clinical and MRI examination results during the ophthalmic examination and image analysis phase. Figure 2 illustrates CCM images from a healthy control (2a, b) and patients with MS (2c, d) at baseline.

Representative CCM images from controls and patients with multiple sclerosis. Panel shows an image from the corneal subbasal nerve plexus of a healthy control (a). Same image analysed with CCMetrics (b). Corneal subbasal nerve plexus images from a patient with RRMS (c) and SPMS (d) showing corneal axonal loss compared with the healthy control.
OCT
Peripapillary RNFL thickness measurements were performed with a spectral-domain OCT (Spectralis OCT, Heidelberg Engineering GmbH, Heidelberg, Germany) on the same eye scanned by CCM, under the same light conditions without pupil dilation. RNFL measurements were performed by using circular scans with a scanning angle of 12°, which equates to a retinal diameter of 3.5 mm when assuming a standard corneal curvature of 7.7 mm and with the eye tracker activated to minimize motion artefacts. All RNFL scans in this study were performed in high-speed mode, and a signal strength of ⩾ 20/30 was set as the minimum acceptable quality along with optimal centering of the circular scan on the optic nerve head. Follow-up RNFL scans were performed with reference to their respective baseline scans using the built-in ‘progression’ function.
Statistical analysis
Statistical analysis was performed using Prism (version 9.1.0 for Mac, GraphPad Software Inc, San Diego, CA, US). Data were confirmed to follow a normal distribution by means of a Shapiro–Wilk test (p > 0.05) and by visual inspection of the respective Q-Q plots. Based on the variability seen in our pilot MS data21,23,26 and previously published studies,13,34,38 we estimated (paired t-test) that a sample of 80 participants will give 90% power to detect an effect size of at least 0.365 in CCM measures with a type 1 error of 0.05. One-way analysis of variance (post hoc Tukey) was used for between-group comparisons. Fisher’s exact test was used to calculate differences in categorical data. A paired t-test was used for within-group comparisons and an unpaired t-test was used for the subgroup analysis. Receiver operating characteristic (ROC) curve analysis was performed to assess the discriminating ability of corneal nerve parameters and RNFL based on the area under the ROC (AUROC) curve, and sensitivity and specificity identified using Youden’s index. Multiple linear regression modelling was used to assess the influence of MS-specific features on the change (Δ) in neurological disability (as expressed by MSSS, EDSS), corneal and retinal nerve parameters calculated as the difference between follow-up and baseline. ΔMSSS, ΔEDSS, ΔCNFD, ΔCNBD, ΔCNFL and ΔRNFL were used as the dependent variables and presence of new enhancing lesions, positive ON history, use of disease-modifying treatments and ARR as the independent variables. Two models were used: an unadjusted (model 1); and an adjusted one for age and sex (model 2). As a second step, we used multiple linear regression modelling to assess the influence of baseline and follow-up clinical parameters as independent variables (time since diagnosis, EDSS, MSSS) on ΔCNFD, ΔCNBD, ΔCNFL and ΔRNFL, adjusting for subject’s age and sex. Continuous data are expressed as [mean difference (standard error of mean difference), 95% confidence interval, p value]. The reported p values are two-sided and a p ⩽ 0.05 was considered significant.
Protocol and data availability statement
The study protocol and all anonymized, individual-level data used in this manuscript are available to qualified researchers by direct request to the corresponding author.
Results
Baseline clinical and demographic results
In healthy controls compared with RRMS and SPMS, there was no significant difference in age or sex. Compared with RRMS, patients with SPMS had a higher EDSS [2.4 (0.5), 1.4–3.4, p < 0.001], MSSS [2.5 (0.7), 1.1–4.0, p < 0.001] and longer time since diagnosis [2.6 (1.1), 0.5–4.7, p = 0.02). There was no significant difference in age [4.1 (2.4), –0.7 to 8.9, p = 0.09], sex [44 (65%) versus 10 (67%), p > 0.99], ON prevalence [37 (54) versus 8 (53)], the total number of relapses [0.2 (0.7), –1.2 to 1.6, p = 0.76] and ARR [0.7 (0.4), –0.04 to 1.5, p = 0.06] (Table 1).
Baseline clinical and demographic characteristics.

ARR, annualized relapse rate; CNBD, corneal nerve branch density; CNFD, corneal nerve fibre density; CNFL, corneal nerve fibre length; DMT, disease-modifying therapy; EDSS, expanded disability status scale; MSSS, multiple sclerosis severity score; ON, optic neuritis; RNFL, retinal nerve fibre layer; RRMS, relapsing-remitting multiple sclerosis; SPMS, secondary progressive multiple sclerosis.
Data are expressed as mean (standard error of mean) or as n (%) where applicable. For multiple comparisons, p value corresponds to the overall p value of the test statistic (ANOVA, Fisher’s). Superscripted letters indicate: Asignificantly different from controls; Bsignificantly different from RRMS. CNFD: significantly different in RRMS versus controls (p = 0.004); and in SPMS versus controls (p < 0.001). CNBD: significantly different in RRMS versus controls (p = 0.002). CNFL significantly different in SPMS versus controls (p = 0.04). RNFL significantly different in RRMS versus controls (p < 0.001); in SPMS versus controls (p < 0.001) and versus RRMS (p = 0.05).
Teriflunomide (n = 6), Azathioprine (n = 6), Glatiramer Acetate (n = 2), Natalizumab (n = 1) and Alemtuzumab (n = 1).
Baseline CCM and OCT
The detailed results are presented in Table 1 and Figure 3(a)–(d).

Graphic illustration of baseline CCM and OCT data and ROC curves. Upper half: graphs indicate mean ± range (1%–99%) for baseline CNFD (a), CNFL (b), CNBD (c) and RNFL (d) in controls (left) compared with RRMS (middle) and SPMS (right). ROC curves illustrating the capacity of CCM and OCT measures to discriminate between controls and patients with RRMS (e); controls and patients with SPMS (f); and between MS subtypes (g). The diagonal line indicates where sensitivity = 1 – specificity.
RRMS
CNFD [7.1 (2.2), 1.9 to 12.2, p = 0.004] and RNFL [14.1 (3.5), 5.8 to 22.4, p < 0.001] were significantly lower, and CNBD [−49.7 (14.5), –84.3 to −15.1, p = 0.003] was significantly higher compared with healthy controls.
SPMS
CNFD [11.1 (3.0), 4.0 to 18.1, p < 0.001], CNFL [4.5 (2.0), 0.04 to 9.0, p = 0.04] and RNFL [23.5 (4.7), 12.3 to 34.8, p < 0.001] were lower compared with healthy controls. Compared with RRMS, RNFL [9.6 (4.0), 0.2 to 19.0, p = 0.05] was lower.
ROC curve analysis
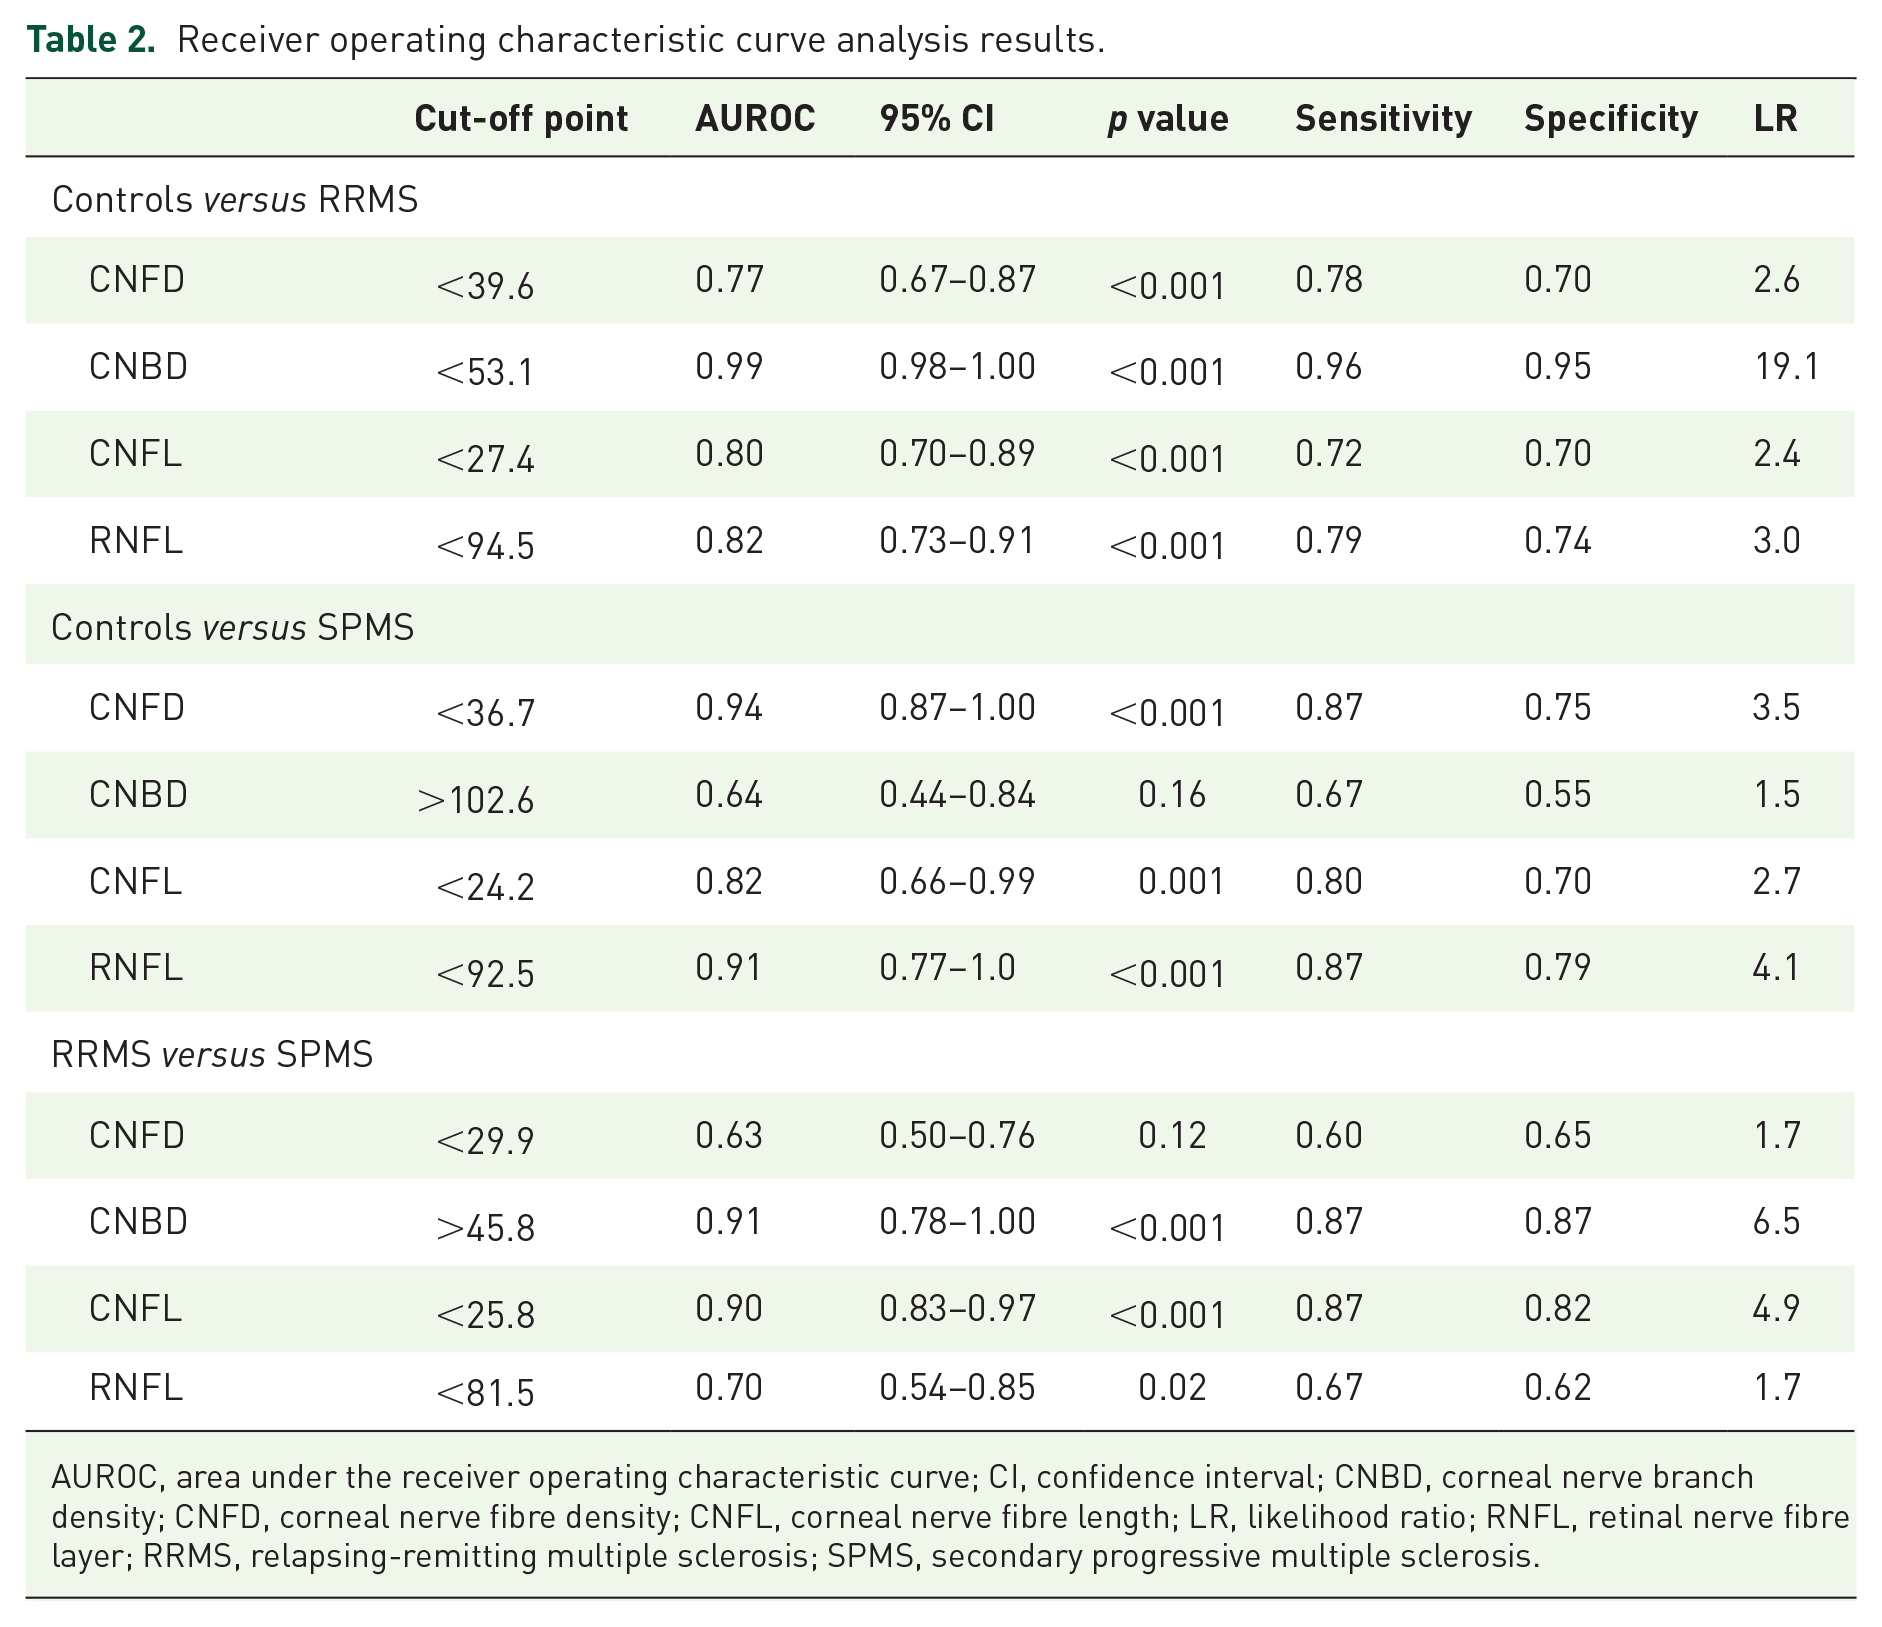
The detailed results are presented in Table 2 and Figure 3(e)–(g).
Receiver operating characteristic curve analysis results.
AUROC, area under the receiver operating characteristic curve; CI, confidence interval; CNBD, corneal nerve branch density; CNFD, corneal nerve fibre density; CNFL, corneal nerve fibre length; LR, likelihood ratio; RNFL, retinal nerve fibre layer; RRMS, relapsing-remitting multiple sclerosis; SPMS, secondary progressive multiple sclerosis.
Healthy controls versus RRMS
CNBD [AUROC = 0.99, sensitivity/specificity = 0.96/0.95, 95% confidence interval = 0.98–1.0, likelihood ratio (LR) = 19.1] showed the highest discriminative performance followed by RNFL (0.82, 0.79/0.74, 0.73–0.91, 3.0).
Healthy controls versus SPMS
CNFD (0.94, 0.87/0.75, 0.87–1.0, 3.5) showed the highest discriminative performance followed by RNFL (0.91, 0.87/0.79, 0.77–1.0, 4.1).
RRMS versus SPMS
CNBD (0.91, 0.87/0.87, 0.78–1.0, 6.6) showed the highest discriminative performance followed by CNFL (0.9, 0.87/0.82, 0.83–0.97, 4.9).
Follow-up clinical and demographic results
The average follow-up time was [20.7 (4.1), 19.7 to 21.7] months. New gadolinium-enhancing lesions were clinically confirmed in n = 19 (23%) of patients. Although there was no significant change in the number of patients on DMT, n = 27 (33%) patients switched or discontinued DMT by their follow-up visit. At follow-up, differences between RRMS and SPMS in EDSS, MSSS, ARR and relapses were comparable with baseline. Two additional patients (3%) in the RRMS group had a clinically confirmed episode of ON since their baseline visit, which had resolved by the time of their follow-up visit. In the RRMS group, there was a significant increase in relapses [0.2 (0.06), 0.1 to 0.3, p < 0.001]; ARR [0.1 (0.03), 0.06 to 0.2, p < 0.001] and MSSS [−0.3 (0.1), –0.6 to −0.05, p = 0.02) at follow-up compared with baseline. In the SPMS group, there was a significant increase in relapses [0.4 (0.1), 0.1–0.7, p = 0.009] and ARR [0.2 (0.1), 0.04–0.5, p = 0.02].
Follow-up CCM and OCT
RRMS
There was a decrease in CNFD [−2.3 (1.2), –4.6 to −0.01, p = 0.04], CNBD [−28.5 (8.2), –44.9 to −12.0, p = 0.001], CNFL [−1.8 (0.7), –3.2 to −0.5, p = 0.008] and RNFL [−1.2 (0.4), –2.0 to −0.5, p = 0.002] at follow-up compared with baseline; see Figure 4(a)–(d).

Trajectories of MS subtypes at follow-up. Graphs illustrating the mean difference between baseline and follow-up visits for patients with RRMS (dashed line) and SPMS (continuous line) for CNFD (a), CNFL (b), CNBD (c) and RNFL (d).
SPMS
There was a decrease in CNFD [−3.1 (2.6), –8.7 to 2.5, p = 0.04] and CNBD [−47.4 (11.8), –73.0 to −21.9, p = 0.002] at follow-up compared with baseline. In SPMS compared with RRMS, there was a significant difference in CNBD [−47.9 (18.3), –84.4 to −11.5, p = 0.01], see Figure 4(a)–(d).
Subgroup analysis
Clinical parameters, CCM and RNFL in relation to new enhancing lesions at follow-up
In patients with new enhancing lesions, there was a decrease in CNFD [−2.8 (1.4), to −5.7 to 0.08, p = 0.05], CNBD [−44.0 (14.3), –73.9 to −14.1, p = 0.006], CNFL [−2.9 (0.7), –4.4 to −1.5, p < 0.001] and RNFL [−2.2 (0.8), –3.9 to −0.5, p = 0.01] with a higher number of relapses [0.5 (0.1), 0.2 to 0.7, p < 0.001], EDSS [0.5 (0.1), 0.2 to 0.8, p < 0.001] and ARR [0.3 (0.06), 0.1–0.4, p = 0.001] at follow-up compared with baseline. In patients without new enhancing lesions, there was a decrease in CNBD [−23.2 (8.2), –39.6 to −6.7, p = 0.007] and RNFL [−0.9 (0.4), –1.6 to −0.2, p = 0.02] with a higher number of relapses [0.2 (0.05), 0.1 to 0.3, p < 0.001] and ARR [0.1 (0.03), 0.05 to 0.2, p = 0.001] and lower MSSS [−0.6 (0.2), –0.9 to −0.3, p < 0.001].
Clinical parameters, CCM and RNFL in relation to ON
In patients with a history of ON, there was a decrease in CNBD [−32.0 (9.5), to −51.0 to −12.9, p = 0.002], CNFL [−1.9 (0.8), −3.6 to −0.3, p = 0.02] and RNFL [−1.0 (0.5), −2.0 to −0.09, p = 0.03] with a higher number of relapses [0.3 (0.08), 0.2 to 0.5, p < 0.001] and ARR [0.2 (0.04), 0.1 to 0.3, p < 0.001]. In patients without ON history, there was a decrease in RNFL [−1.3 (0.4), –2.1 to −0.4, p = 0.005] with a higher number of relapses [0.2 (0.06), 0.04 to 0.3, p = 0.01] and ARR [0.1 (0.04), 0.02 to 0.2, p = 0.01]. In patients with left eye ON versus non-left eye ON (i.e. right eye or bilateral ON), there was no significant difference at baseline in CNFD [4.8 (2.5), −0.3 to 10.0, p = 0.07], CNBD [−9.9 (19.6), –49.4 to 29.6, p = 0.61], CNFL [1.5 (1.9), –2.3 to 5.4, p = 0.4] and RNFL [2.6 (4.5), –6.4 to 11.6, p = 0.56]. Similarly, there was no significant difference at follow-up in CNFD [4.7 (2.8), –1.0 to 10.3, p = 0.1], CNBD [27.7 (19.0), –10.6 to 65.9, p = 0.15], CNFL [2.8 (1.8), –0.9 to 6.4, p = 0.13] and RNFL [0.3 (4.5), –8.8 to 9.5, p = 0.94]. There was no difference in age [1.4 (2.7), –4.0 to 6.7, p = 0.61] and time since diagnosis [−0.9 (1.2), –3.4 to 1.6, p = 0.45].
Clinical parameters, CCM and RNFL in relation to disease-modifying therapy status
In patients with MS who switched or discontinued DMT at follow-up, there was a decrease in CNBD [−23.8 (8.8), –41.9 to −5.7, p = 0.01] with a higher number of relapses [0.3 (0.08), 0.1 to 0.5, p = 0.003] and ARR [0.1 (0.05), 0.04 to 0.2, p = 0.007]. In patients with MS with no change in DMT status, there was a decrease in CNBD [−27.0 (10.7), –48.4 to −5.7, p = 0.01], RNFL [−1.4 (0.3), –2.1 to −0.8, p < 0.001] and MSSS [−0.4 (0.2), –0.7 to −0.08, p = 0.01] with a higher number of relapses [0.3 (0.07), 0.1 to 0.4, p < 0.001] and ARR [0.2 (0.04), 0.08 to 0.2, p < 0.001].
Multiple linear regression analysis
The detailed results of the multiple linear regression modelling are presented in Tables 3 and 4. A model with ΔMSSS as the dependent variable and new enhancing lesions, ON history, DMT use and ARR as the independent variables predicted 8.8% of the variability in ΔMSSS in the unadjusted model and 6.5% in the adjusted model. Presence of new enhancing lesions was associated with an unadjusted mean difference of [0.959 (0.305), p = 0.002] and adjusted mean difference of [0.96 (0.309), p = 0.003] (Table 3). A model with ΔEDSS as the dependent variable predicted 8.1% of the variability in ΔEDSS in the unadjusted model and 5.9% in the adjusted model. Presence of new enhancing lesions was associated with an unadjusted mean difference of [0.637 (0.204), p = 0.003] and adjusted mean difference of [0.631 (0.207), p = 0.003] (Table 3). A model with ΔCNBD as the dependent variable predicted 8.3% of the variability in ΔCNBD in the unadjusted model and 8.9% in the adjusted model. Higher ARR was associated with an unadjusted mean difference of [14.95 (4.84), p = 0.003] and adjusted mean difference of [14.35 (4.85), p = 0.004] (Table 3). For ΔCNFL, the unadjusted model predicted 4.4% of the variability and higher ARR was associated with an unadjusted mean difference of [0.84 (0.42), p = 0.04] (Table 3). A regression model with ΔCNBD as the dependent variable and MSSS at baseline and follow-up as the independent variable adjusted for age and sex predicted 7.3% of the variability in ΔCNBD [7.05 (2.74), p = 0.01] at baseline and 4.7% [5.89 (2.8), p = 0.04] at follow-up (Table 4).
Multiple linear regression models: unadjusted (model 1) and adjusted for age and sex (model 2).

ARR, annualized relapse rate; CNBD, corneal nerve branch density; CNFD, corneal nerve fibre density; CNFL, corneal nerve fibre length; DMT, disease-modifying therapy; EDSS, expanded disability status scale; Gd, gadolinium; MSSS, multiple sclerosis severity score; ON, optic neuritis; RNFL, retinal nerve fibre layer; SEM, standard error of the mean.
Multiple linear regression models adjusted for age and sex.
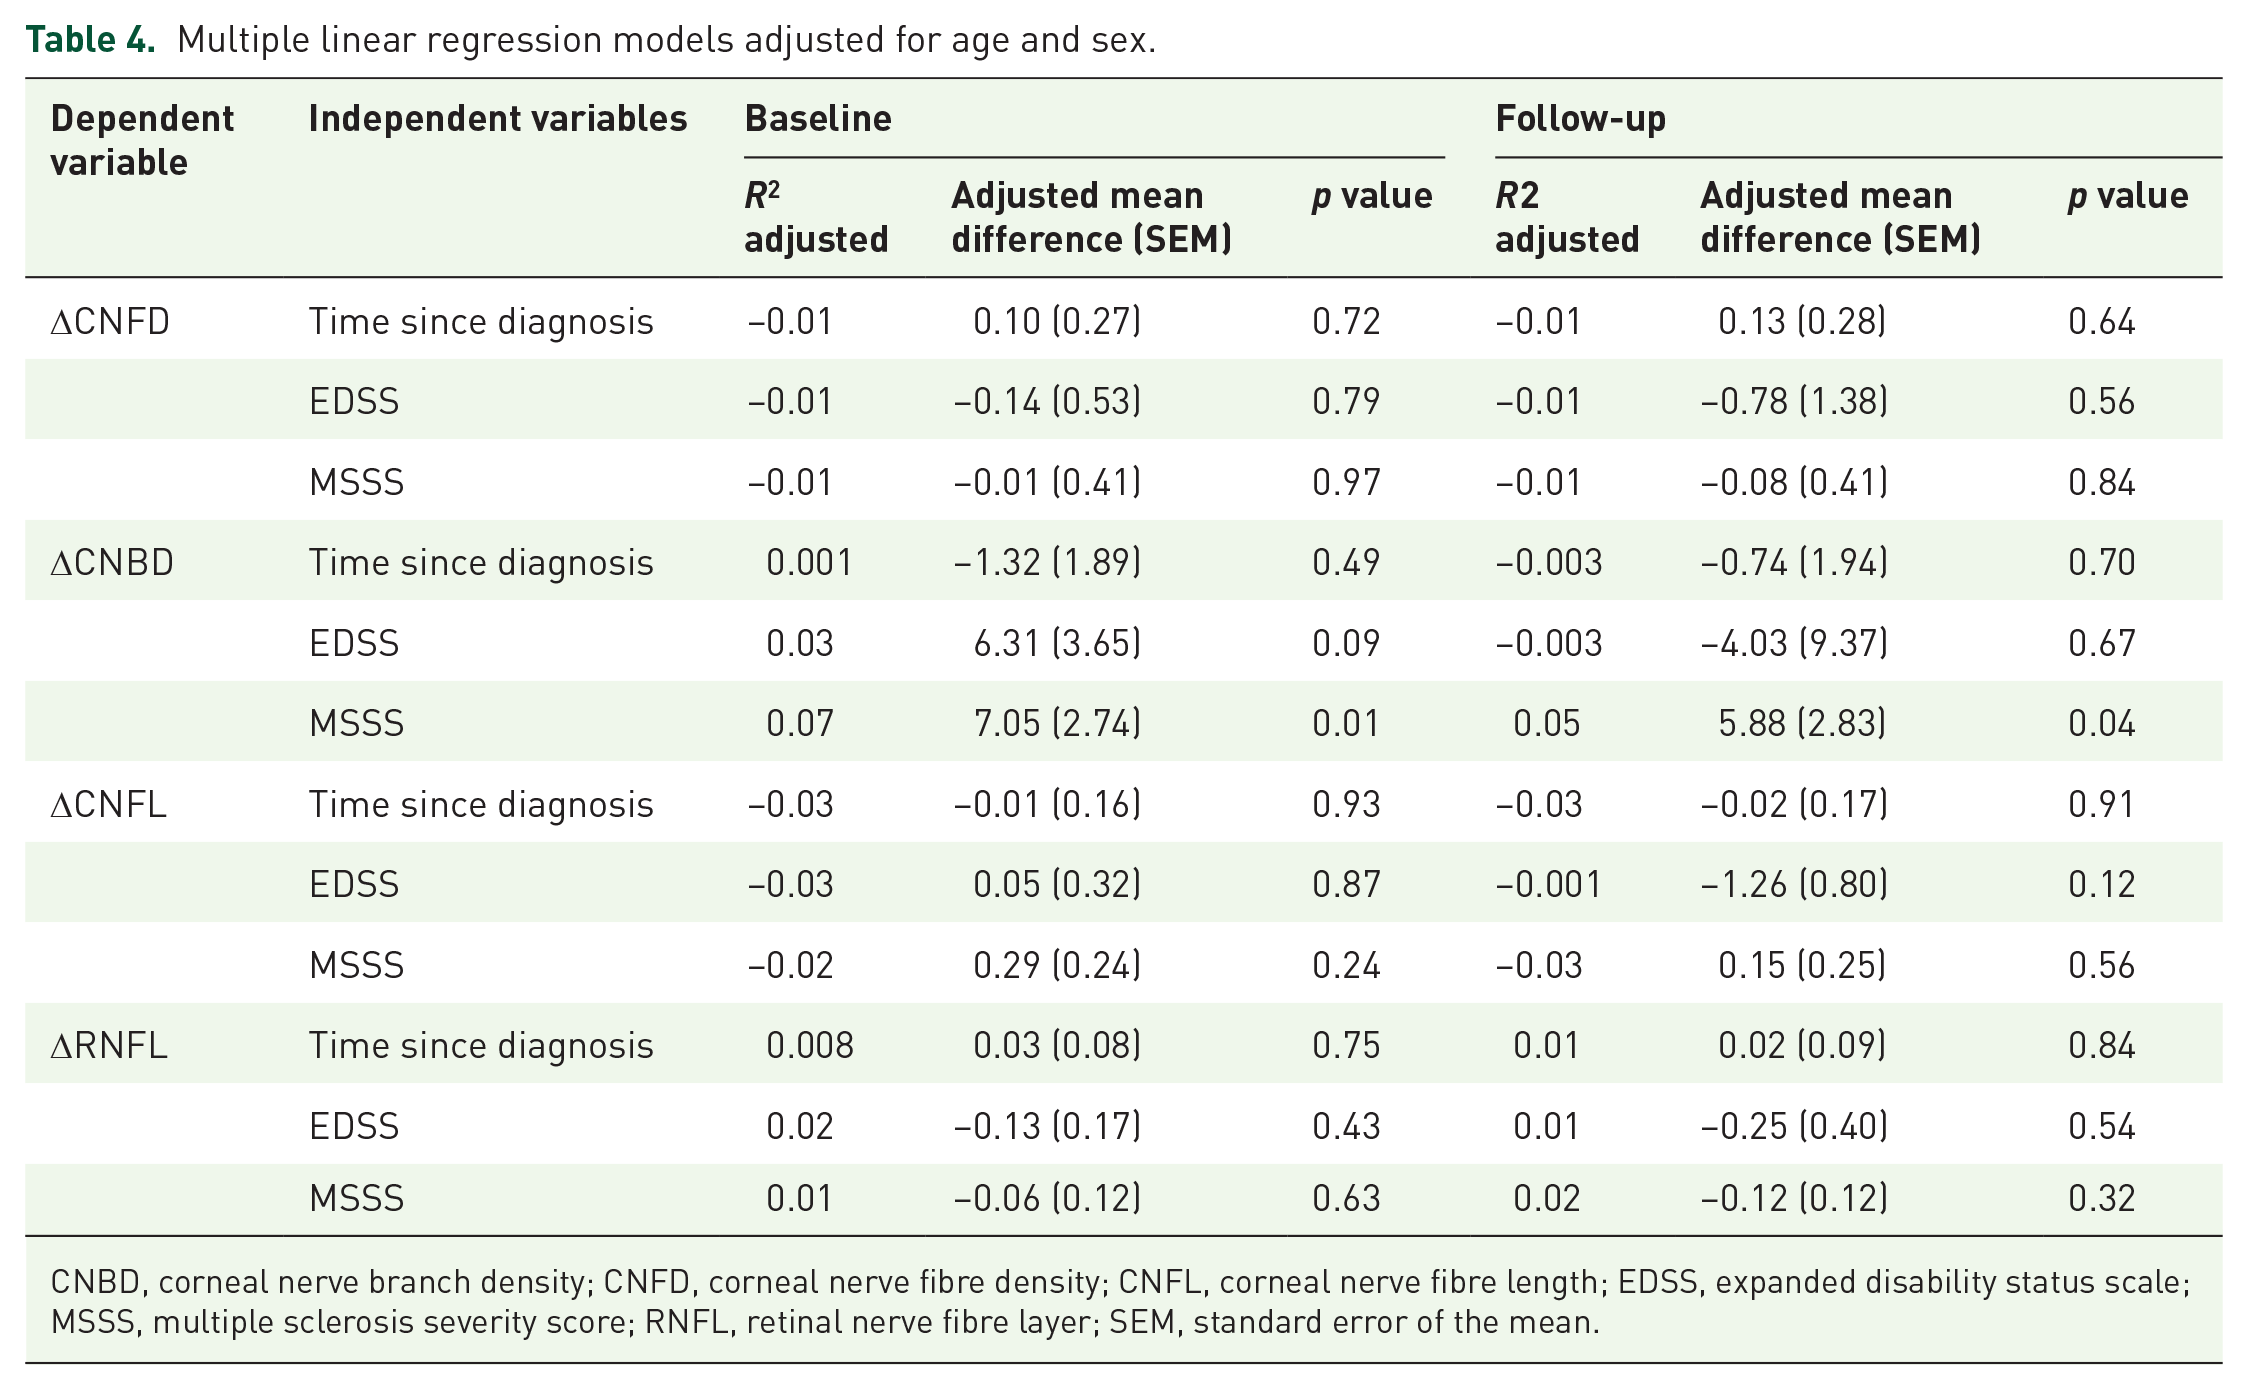
CNBD, corneal nerve branch density; CNFD, corneal nerve fibre density; CNFL, corneal nerve fibre length; EDSS, expanded disability status scale; MSSS, multiple sclerosis severity score; RNFL, retinal nerve fibre layer; SEM, standard error of the mean.
Discussion
We demonstrate corneal and retinal axonal loss in patients with RRMS and SPMS. Corneal and retinal axonal measures show excellent capacity to discriminate healthy controls from patients with RRMS and SPMS and patients with RRMS from SPMS. Furthermore, both CCM and OCT show progressive corneal and retinal axonal loss. Subgroup analysis showed greater corneal and retinal axonal loss in patients with new gadolinium-enhancing lesions and history of ON. Furthermore, regression modelling revealed a significant association between the change in CNBD and ARR at follow-up, and change in CNBD was also moderately associated with neurological disability.
Axonal degeneration is the major driver of progressive disability in MS, and a key finding from a pathological study was that smaller axons are more susceptible to injury. 39 CCM is a non-invasive imaging modality for rapid quantification of small fibres in diabetic 13 and other neuropathies,14,15 and predicts incident diabetic neuropathy. 17 We and others have also shown significant corneal axonal loss in RRMS,21–26 which was associated with neurological disability. In the present study, we show significant progressive corneal nerve loss and RNFL thinning in both RRMS and SPMS and higher CNBD in patients with RRMS. CNBD at follow-up differed significantly not only between patients with MS and controls but also between RRMS and SPMS suggesting cumulative axonal loss with more advanced MS course. We have previously shown higher CNBD in patients with Parkinson’s disease, which was related to neurological disability. 27 Clinical trials18,40 of DMTs in diabetic neuropathy have demonstrated that early nerve regeneration is characterized by an increase in branch density. Studies have shown that acute axonal damage is partially reversible in the initial stages of MS,4,41 and in this context increased CNBD may indicate nerve regeneration.
The ROC curve analysis revealed that baseline corneal nerve and RNFL thinning, a well-established measure of axonal degeneration in MS, have comparable diagnostic utility for both RRMS and SPMS. Furthermore, CNBD has excellent sensitivity and specificity for RRMS, while CNFD and CNFL are comparable with RNFL in discriminating patients with SPMS from healthy controls. Overall, our results are in keeping with previous findings on the diagnostic capacity of CCM for diabetic neuropathy. Ahmed et al. 42 reported a sensitivity/specificity of 0.85/0.84 for a diagnosis of diabetic neuropathy with a positive LR of 5.3. Petropoulos et al. 13 reported that reduced CNFD was associated with a sensitivity/specificity of 0.79/0.78 and a positive LR of 4.6 for diabetic neuropathy. Chen et al. 38 showed a 0.82/0.71 sensitivity/specificity for diabetic neuropathy. In the present study, CNBD had the highest discriminating capacity for RRMS, indicating a more dynamic role for branches, particularly during the early, highly active stage of MS.
RNFL thinning is progressive over time and predicts disability worsening.43,44 However, attenuation of RNFL thinning has been described with longer disease duration in MS. 45 In a population with diabetes, there is a continuing decline in CCM measures over 8 years which is greater in patients who subsequently develop neuropathy. 17 Bitirgen et al. 29 recently reported a progressive reduction in corneal nerve fibre area and width over 2 years in a small cohort of patients with RRMS. In the present study, we demonstrate a significant reduction in CNFD, CNBD and CNFL at follow-up in both RRMS and SPMS.
Subgroup analysis showed that both corneal and retinal axonal loss were greater in patients with clinically confirmed new gadolinium-enhancing lesions at follow-up, and that patients with a history of ON had greater loss of corneal nerve fibres and branches at follow-up compared with patients without ON. However, regression modelling revealed that ARR and MSSS were only associated with ΔCNBD at follow-up, and the presence of new enhancing lesions was associated with ΔMSSS and ΔEDSS. A potential explanation for these findings is that corneal axonal alterations are more susceptible to cumulative inflammation reflected by a higher relapse frequency over time as opposed to acute inflammation at a single timepoint. Previous studies have reported accelerated RNFL thinning after ON 46 paralleled by trans-synaptic changes in the central nervous system. No association has been previously reported between ON history and corneal nerve density.21–25
Previous studies have reported an association between CCM measures and neurological disability21–24,29 with the strength of the relationship increasing for greater EDSS. 25 In the present study, ΔCNBD was associated with the number of relapses and disability at baseline and follow-up, and ΔCNFL was associated with ΔEDSS and ΔMSSS. It has been postulated that neurodegeneration in MS may initially be detectable only on highly sensitive techniques, before it becomes diffuse and irreversible with progressive disability. 47 In this context, our findings imply a varying axonal burden as detected by CCM on patients with MS, particularly during the earlier stage, which increases in relation to relapses and worsening of disability.
We acknowledge several limitations in our study. The small sample size limits the generalizability of our findings. In addition, the relatively short follow-up time does not allow interpretation of our findings in relation to meaningful worsening of neurological disability and brain atrophy. We also acknowledge a lack of follow-up in the controls. However, it has been previously established that corneal nerves of healthy persons remain stable over a 3-year period. 48 Finally, our ophthalmic imaging protocol targeting the ON eye rather than the non-ON eye may have skewed our results towards greater alterations at both timepoints. Nolan-Kenney et al. 46 have described inter-eye difference thresholds in relation to the ON status, including subclinical ON. In the present study, we did not assess for subclinical ON in patients with MS, and the extent to which it could have influenced our results is unknown. The magnitude of differences between ON and non-ON eyes and in relation to subclinical ON should be established.
In conclusion, this is the largest study to date showing progressive corneal axonal loss in relation to radiological and clinical severity in patients with MS. CCM may add to the imaging toolbox as a surrogate marker of axonal degeneration and regeneration in MS. Larger studies with longer follow-up are required to assess the relationship between corneal nerve loss, ganglion cell inner plexiform thinning and disease progression.