
Abstract
Background:
Transmural healing (TH) is an emerging therapeutic target in Crohn’s disease (CD). Visceral adipose tissue (VAT) is associated with the prognosis of CD, but few studies investigate the ability of VAT in predicting TH.
Objectives:
We aimed to quantitatively assess VAT by magnetic resonance enterography (MRE) and evaluate the prediction of baseline VAT volume for TH in CD patients with Ustekinumab (UST) treatment.
Design:
This is an observational study.
Methods:
We retrospectively included CD patients receiving UST treatment, with bowel wall thickness (BWT) >3 mm assessed by MRE at baseline. Clinical characteristics, laboratory, endoscopic, and MRE indicators were evaluated at baseline, week 26 (W26), and week 78 (W78) of the therapy. Quantification of VAT volume was assessed by MRE at baseline, and adjusted by body mass index (BMI). The TH was defined as BWT ⩽3 mm without any signs of inflammation at W26 and W78.
Results:
Sixty-two patients were included in our study. After UST treatment for W26 and W78, 8 (13.1%) and 13 (21.0%) patients achieved TH. Compared with baseline, laboratory indicators such as C-reactive protein and erythrocyte sedimentation rate, simple endoscopic score for CD, and BWT were significantly improved at W26 and W78. We divided patients into the TH and non-TH groups at both W26 and W78, and found that adjusted VAT volume at baseline was significantly lower in the W26-TH and W78-TH groups. Adjusted VAT volume was then categorized into four scores by quartiles, and multivariable analysis showed that baseline VAT score could negatively predict W26-TH (odds ratio (OR) = 0.296, p = 0.018) and W78-TH (OR = 0.419, p = 0.012).
Conclusion:
Our study demonstrated that baseline VAT was an independent risk factor for predicting both short- and long-term TH in CD patients receiving UST. Patients with lower VAT volume at baseline were more likely to achieve TH after UST treatment.
Introduction
Crohn’s disease (CD) is a chronic inflammatory disorder that can affect any segment of the gastrointestinal tract. The intestinal lesions in CD are transmural, involving all layers of the intestinal wall—including the mucosa, submucosa, muscularis propria, and even mesenteric fat. 1 Because of this transmural nature, inflammation may persist in intestinal segments despite mucosal healing (MH), ultimately contributing to disease progression. An emerging treatment strategy for patients with CD is the treat-to-target strategy, which aims to achieve deeper and more sustained control of intestinal inflammation. 2 Transmural healing (TH) has been recommended as a long-term therapeutic goal, as it is associated with steroid-free remission and a reduced risk of hospitalization and surgery.3–5
Ustekinumab (UST) is a fully humanized monoclonal antibody targeting the common p40 subunit shared by interleukin (IL)-12 and IL-23. 6 Clinical and real-world studies have demonstrated that UST effectively induces remission in patients with CD. 7 Multicenter trials have reported that approximately 25% of patients achieve TH after 48–56 weeks of UST therapy.6,8 Notably, about 70% of patients fail to achieve TH with UST therapy, highlighting the importance of investigating predictive factors to guide individualized risk stratification in CD.
Visceral adipose tissue (VAT) in the abdomen surrounds internal organs and includes mesenteric adipose tissue (MAT), which envelops the intestine. In CD, the localized expansion of MAT around inflamed and fibrotic intestinal segments gives rise to creeping fat.9,10 Creeping fat (CrF) functions as an active endocrine and immune organ, secreting cytokines, adipokines, and free fatty acids that sustain intestinal inflammation and fibrosis, thereby contributing to disease persistence and progression.10–13 However, it remains technically challenging to directly measure creeping fat, especially in routine clinical practice. Therefore, most studies focused on the predictive role of VAT rather than creeping fat. As a nonsegmental parameter, VAT may reflect the overall assessment of the inflammatory burden of CD.14,15 Previous studies have found that VAT may serve as a radiological marker of complicated CD and predict disease progression.16,17 Moreover, VAT has been shown to predict clinical and endoscopic responses to infliximab therapy.18,19 Recent evidence indicates that VAT could even represent a therapeutic target to reduce postoperative recurrence. 20 These findings suggest that VAT is associated with the prognosis of CD. Nevertheless, the relationship between quantification of VAT volume and both short- and long-term TH in CD patients treated with UST remains unclear.
Therefore, this study aimed to investigate the predictive value of baseline VAT volume for short-term and long-term TH in patients with CD treated with UST, which may contribute to more precise risk stratification and individualized therapeutic strategies.
Methods
Study design and patients
This study was a retrospective observational study performed at the First Affiliated Hospital, Sun Yat-sen University. The reporting of this study conforms to the Strengthening the Reporting of Observational Studies in Epidemiology (STROBE) statement (Supplemental Material 2). 21
The inclusion criteria of our study were as follows: (1) an established diagnosis of CD with active lesions at baseline, (2) patients receiving UST treatment (standard dose or dose escalation) for more than 78 weeks, (3) available magnetic resonance enterography (MRE) examination at baseline, week 26 and 78, and (4) at least one intestinal segment with bowel wall thickness (BWT) >3 mm and inflammatory signs (e.g., ulceration, edema, and increased contrast enhancement) at baseline MRE. The exclusion criteria were as follows: (1) anastomotic stricture without other active CD lesions at baseline, (2) patients with surgery or endoscopic treatment during UST treatment, and (3) patients with incomplete information or loss of follow-up.
Clinical assessment
The following clinical parameters were collected: sex, age, age at CD diagnosis, disease duration, Montreal classification, history of prior medication use, and surgical history. 7 In the Montreal classification, 22 disease locations were categorized as L1, L2, L3, and L4 for involving the terminal ileum, colon, ileocolon, and upper gastrointestinal tract, respectively. L4 can coexist with L1, L2, or L3. Disease behaviors were categorized as B1, B2, B3, and P for non-stricturing/penetrating, stricturing, penetrating, and perianal disease. Perianal disease can be present concomitantly with B1, B2, and B3. UST dose escalation was defined as interval reduction or intravenous UST administration during the maintenance phase based on body weight (⩽55 kg, 260 mg; 56–85 kg, 390 mg; >85 kg, 520 mg). 23 Prior medication use indicates CD medication, including mesalazine (5-aminosalicylic acid (5-ASA)), thiopurine, thalidomide, corticosteroids, and anti-tumor necrosis factor (TNF) agents (e.g., infliximab and adalimumab) and vedolizumab.
MRE examinations and visceral fat measurement
All participants underwent MRE at baseline, week 26, and week 78 using a 3.0-T Magnetom Prisma scanner (Siemens Medical Solutions, Erlangen, Germany). The scanning protocol, image acquisition, and data analysis were consistent with previously published methods.24,25
After bowel preparation, patients were administered 1600–2000 mL of 2.5% mannitol solution 1 h before the examination. MRE was performed 10 min after intramuscular injection of 10 mg raceanisodamine hydrochloride into the gluteal muscle. T2-weighted imaging (T2WI) was acquired in axial and coronal planes using a half-Fourier acquisition single-shot turbo spin-echo (HASTE) sequence. The axial and coronal parameters were: acquisition matrices of 380 × 297 and 450 × 422, flip angles of 160° and 153°, echo times of 81 and 83 ms, repetition times of 1000 and 800 ms, and acquisition times of 81 and 83 s, respectively, with a uniform slice thickness of 4 mm. The parameters for the coronal fat-suppressed T2WI HASTE sequence were: acquisition matrix 450 × 422, flip angle 151°, slice thickness 4 mm, echo time 83 ms, repetition time 800 ms, acquisition time 24 s. Axial diffusion-weighted imaging was performed with a spin-echo echo-planar imaging sequence: acquisition matrix 380 × 283, slice thickness 4 mm, echo time 47 ms, repetition time 5400 ms, and acquisition time 105 s. Pre- and post-contrast T1-weighted imaging (T1WI) was performed before and at 15 s, 70 s, and 7 min after intravenous administration of gadopentetate dimeglumine (0.2 mL/kg, injection rate 2 mL/s). Two experienced radiologists (X.H.L. and Q.Z.Z., blinded to clinical data, independently reviewed the MRE images using a dedicated post-processing workstation.
Quantification of VAT volume was performed by a radiologist (C.N.F.) with 5 years of experience, using 3D Slicer (Version 5.6.2, Boston, USA) and a custom Python-based analysis pipeline. According to previously reported methods,26,27 coronal T2-weighted images were used to manually delineate VAT on each slice, followed by 3D reconstruction of the segmented region. VAT volume was then computed automatically using the Python script originally written by our team (provided in Supplemental Material 1). The adjusted VAT volume was defined as the ratio of VAT volume to BMI, according to the following equation:

Endoscopic examination
Endoscopy was performed at baseline, week 26, and week 78 to assess mucosal lesions. Routinely, the digestive tract is divided into five segments, including the terminal ileum, ascending colon, transverse colon, descending colon, and rectum. Simple Endoscopic Score for Crohn’s Disease (SES-CD) was used to assess endoscopic activity of each segment, based on the size of ulcers, ulcerated surface, affected surface, and presence of narrowing. 28 Segmental scores were summed to yield the total SES-CD (range: 0–56). Two experienced endoscopists (R.M. and S.S.X.) independently evaluated all endoscopic images and resolved discrepancies by consensus.
Definitions of outcomes
TH assessed by MRE was defined as BWT ⩽3 mm and without any sign of inflammation, including ulcer, edema, and mural hyperenhancement, as previous studies reported. 2 MH was defined as SES-CD ⩽2. 2 In our study, TH achieved at week 26 (W26-TH) was defined as short-term TH, and TH achieved at week 78 (W78-TH) was defined as long-term TH.
Statistical analysis
A descriptive analysis was conducted to assess baseline characteristics. Continuous variables were summarized using mean and standard deviation for normally distributed data, and median and interquartile range (IQR) for non-normally distributed data. Categorical variables were presented as frequencies and proportions. The Kolmogorov–Smirnov test was used to test the normality of the data. For comparing continuous variables, the Student’s t test or nonparametric Mann–Whitney U test was used as appropriate. For comparing discrete variables, Fisher’s exact test was used. Categorical variables were compared using Fisher’s exact test or χ2 test. Correlations were analyzed using Pearson or Spearman correlations as appropriate. Logistic regression analysis was utilized to investigate predictors for short-term and long-term TH. Variables with a p < 0.2 in univariate logistic regression analysis were then included in the multivariate logistic analysis. 29 Results were shown as odds ratios (OR) with 95% confidence intervals (CIs). A two-sided p-value <0.05 was considered statistically significant.
Results
Baseline characteristics and demographics
During the study period, 166 patients received UST treatment. After excluding 20 patients due to the absence of an active lesion, switching to other biologic therapy, undergoing endoscopic treatment or surgery, and 84 patients not having undergone MRE examination at week 26 or 78, a total of 62 patients met the inclusion criteria and were enrolled in the analysis (Figure 1). The baseline characteristics of these patients were summarized in Table 1. Of the 62 patients, the mean age at diagnosis was 28.39 ± 10.0 years, while the disease duration was 7.18 ± 5.7 years. The disease location was ileal in 9 (14.5%), colonic in 1 (1.6%), ileocolonic in 41 (66.1%), and ileocolonic/upper gastrointestinal in 10 (16.1%) patients. Of the 62 patients, 21 (33.9%) were inflammatory (B1), 25 (40.3%) were stricturing (B2), and 16 (25.8%) were penetrating (B3). In addition, 40 (64.5%) patients had perianal involvement. There were 28 (45.2%) patients who received UST dose escalation therapy among the included patients. Concerning previous treatment, 6 (9.7%) patients were treatment-naïve, 38 (61.3%) had been treated with 5-ASA, 23 (37.1%) with anti-TNFα agents (infliximab or adalimumab), 6 (9.7%) with vedolizumab, and 10 (16.1%) had undergone abdominal surgery prior to UST treatment.

Flowchart of patient inclusion and study design. A total of 166 patients with CD received UST treatment during the study period. Among them, 62 patients who underwent MRE at baseline, week 26, and week 78 were included in the final analysis.
Baseline characteristics of CD patients receiving Ustekinumab.

5-ASA, 5-aminosalicylic acid; CD, Crohn’s disease; SD, standard deviation; UST, Ustekinumab.
Inflammatory indicators and healing outcome at week 26 and week 78 after UST treatment
At week 26 after initiation of UST treatment, 16 (27.1%) patients achieved MH, and 8 (13.1%) achieved TH (Table S1). C-reactive protein (CRP, p < 0.001), erythrocyte sedimentation rate (ESR, p < 0.001), platelet count (PLT, p < 0.001), SES-CD (p < 0.001), and BWT (p = 0.001) significantly decreased versus baseline. Meanwhile, albumin (ALB, p < 0.001) significantly increased after treatment (Table S1).
At week 78 after initiation of UST treatment, 18 (30.5%) patients showed MH, and 13 (21.0%) achieved TH (Table S1). Similarly, CRP (p < 0.001), ESR (p < 0.001), PLT (p < 0.001), SES-CD (p < 0.001), and BWT (p < 0.001) significantly decreased, and ALB (p < 0.001) increased versus baseline (Table S1). Representative MRE images of patients with and without TH are shown in Figure 2.

Representative MRE and endoscopic findings of patients with and without TH at week 26 and week 78. (a) Representative endoscopic and MRE images of a patient without TH at both week 26 and week 78. At baseline, MRE revealed inflammatory lesions of the descending colon, with a BWT of 7 mm. At week 26 and 78, the inflammatory lesions were not healed, with a BWT of 7 mm. (b) Representative endoscopic and MRE images of a patient who achieved TH at week 26 and TH at week 78. At baseline, MRE revealed inflammatory lesions of the ascending colon, with a BWT of 7 mm. At week 26, the inflammatory lesions were alleviated, with a BWT of 5 mm, and healed at week 78.
Baseline-adjusted VAT volume in patients with and without TH
To identify predictors of healing outcome in CD, baseline clinical, endoscopic, and MRE variables were compared between patients who achieved TH and those who did not. At week 26, no significant differences were observed between the TH and non-TH groups in disease duration, age at diagnosis, disease behavior, prior treatment, or inflammatory indicators (Table 2). Notably, patients who achieved TH at week 26 had a significantly lower baseline-adjusted VAT volume compared with those without TH (median = 20.0, IQR (26.2–60.3), median = 38.7, IQR (16.2–24.3), p = 0.005) (Table 2; Figure 3(a) and (b)).
Comparisons of baseline clinical, laboratory, endoscopic, and MRE findings between patients with and without TH at week 26 and week 78.

ALB, albumin; BWT, bowel wall thickness; CRP, C-reactive protein; ESR, erythrocyte sedimentation rate; IQR, interquartile range; MRE, magnetic resonance enterography; PLT, platelet count; SD, standard deviation; SES-CD, Simple Endoscopic Score for Crohn’s Disease; TH, transmural healing; UST, Ustekinumab; VAT, visceral adipose tissue.
Boldface values indicate statistical significance (p < 0.05).

Comparison of baseline VAT volume between patients with and without TH at week 26 and 78. VAT volume was quantified using MRE and normalized to BMI to obtain the adjusted VAT volume. (a) Violin plot showed that at week 26, baseline-adjusted VAT volume was significantly lower in patients who achieved TH than in those without TH (p < 0.001). (b) Representative MRE-based 3D reconstructions illustrating VAT (highlighted in green) in patients with and without TH at week 26. Patients without TH exhibited greater VAT accumulation. (c) Violin plot showed that at week 78, baseline-adjusted VAT volume was significantly lower in TH patients than in non-TH patients (p = 0.002). (d) Representative MRE-based 3D reconstructions illustrating VAT in TH and non-TH patients at week 78. Patients without TH exhibited greater VAT accumulation.
Similarly, when evaluating long-term outcomes at week 78, disease duration was significantly shorter in patients with TH (p = 0.036). Baseline-adjusted VAT volume remained significantly lower in the TH group compared with the non-TH group (median = 21.6, IQR (15.8–37.4), median = 42.4, IQR (26.1–69.3), p = 0.018; Table 2 and Figure 3(c) and (d)).
Predictors of TH outcome at week 26 and week 78
To further identify independent predictors of TH for UST treatment at week 26 and 78, respectively, logistic regression analyses were conducted, incorporating clinical characteristics, laboratory, endoscopic, and MRE parameters. Based on the quartiles of adjusted VAT volume, a VAT score was generated and categorized into four levels (Table S2). VAT score was inversely correlated with TH at week 26 (r = −0.346, p = 0.006) and week 78 (r = −0.341, p = 0.007; Figure 4(a) and (b)).
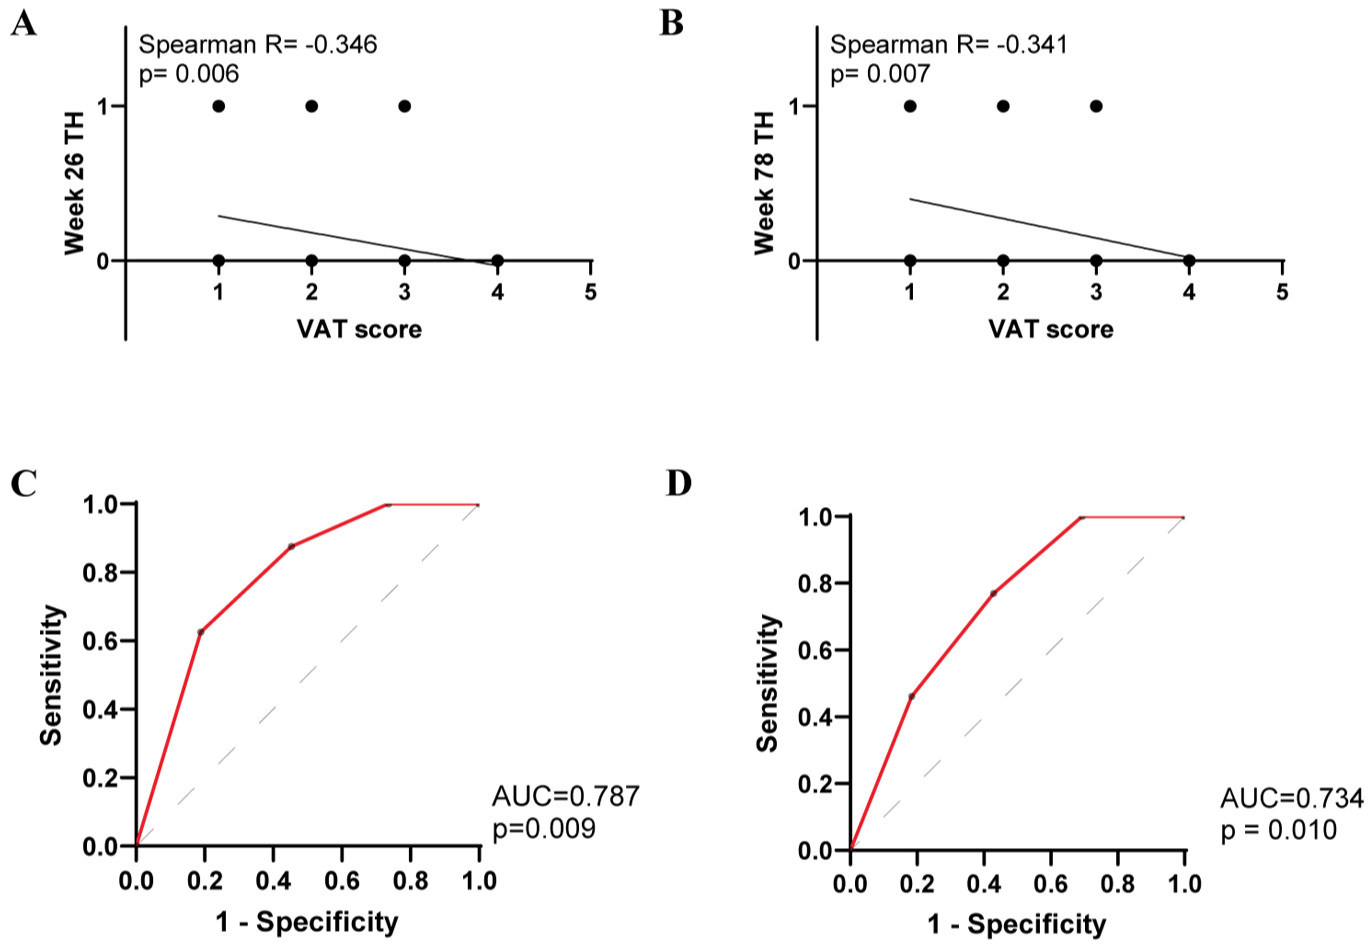
Correlation and predictive performance of baseline VAT score for TH in CD patients. Adjusted VAT volume was divided into four quartile-based categories to derive the VAT score. (a) and (b) Scatter plot showed that baseline VAT score was inversely correlated with TH outcomes at week 26 (r = −0.346, p = 0.006) and week 78 (r = −0.341, p = 0.007). (c) and (d) ROC curves derived from logistic regression analyses. Baseline VAT score was significantly associated with TH at week 26 (OR = 0.309, p = 0.021) and week 78 (OR = 0.427, p = 0.017).
Univariate logistic regression revealed that a lower baseline VAT score was significantly associated with TH at week 26 (OR = 0.296, 95%CI, 0.089–0.707, p = 0.018). Higher baseline ALB showed a trend toward TH, though not significantly (OR = 1.109, 95%CI, 0.955–1.313, p = 0.193). Indicators with p-value less than 0.2 in logistic regression analysis were further included in the multivariate logistic regression analysis. Multiple logistic regression analysis revealed that decreased baseline VAT score (OR = 0.309, 95%CI, 0.093–0.729, p = 0.021) was independently associated with a higher likelihood of TH at week 26 (Table 3). The corresponding prediction model for TH at week 26 was established: logit (p) = 0.537 − 1.216 × VAT score (area under the curve (AUC) = 0.787, p = 0.009; Figure 4(c)).
Logistic regression analysis of baseline predictors for TH at week 26.

ALB, albumin; BWT, bowel wall thickness; CRP, C-reactive protein; ESR, erythrocyte sedimentation rate; SES-CD, Simple Endoscopic Score for Crohn’s Disease; TH, transmural healing; VAT, visceral adipose tissue.
Similarly, baseline VAT score was significantly associated with TH at week 78 (OR = 0.419, 95%CI, 0.197–0.786, p = 0.012). Variables with p < 0.2, VAT score, and BWT were further included in multiple logistic regression analysis, which showed that decreased baseline VAT score (OR = 0.427, 95%CI, 0.197–0.814, p = 0.017) remained an independent predictor of TH at week 78 (Table 4). The corresponding prediction model for TH at week 78 was: logit (p) = 0.592 − 0.869 × VAT score (AUC = 0.734, p = 0.010; Figure 4(d)).
Logistic regression analysis of baseline predictors for TH at week 78.

ALB, albumin; BWT, bowel wall thickness; CI, confidence interval; CRP, C-reactive protein; ESR, erythrocyte sedimentation rate; PLT, platelet count; SES-CD, Simple Endoscopic Score for Crohn’s Disease; TH, transmural healing; VAT, visceral adipose tissue.
Discussion
This study demonstrated that baseline VAT volume adjusted by BMI was an independent risk factor for predicting both short- and long-term TH in CD patients receiving UST. Patients with lower VAT volume were more likely to achieve TH after UST treatment. This finding highlights a novel prognostic value of VAT volume in UST therapy, and may facilitate refined risk stratification and personalized therapeutic strategies in CD.
UST has been shown to be an efficient biologic agent to induce TH. The STARDUST trial reported that the TH rate was 24.1% after 48-week UST treatment. 6 Another multicenter study reported 20% TH rate after 52-week UST treatment.1,30 In these studies, TH was primarily assessed by intestinal ultrasonography. In our cohort, 13.1% and 21.0% of patients achieved TH assessed by MRE at week 26 and 78, respectively, which was broadly consistent with previous reports.
Prior studies identified increased BWT and the presence of strictures before treatment as independent risk factors, 31 whereas higher serum UST concentrations were protective factors for TH. 32 Although BWT and the stenotic phenotype were potential predictors in our dataset, no significant differences were detected between patients with and without TH in either the short- or long-term analyses. This discrepancy may be attributed to the relatively small sample size in the prior study and differences in UST therapy duration. Previous studies enrolled patients during the UST induction phase at week 26, whereas our analysis included patients under maintenance therapy at week 78, thereby excluding those who failed induction. This difference in cohort composition could partially explain the divergent findings. Notably, our study newly identified baseline VAT as a negative predictor for both short- and long-term TH in UST-treated CD. Larger, multicenter cohorts encompassing both induction and maintenance phases are warranted to validate these findings and to further delineate predictors of TH.
The association between VAT and treatment response in CD has been increasingly recognized. Previous studies have reported that higher abdominal VAT was associated with poorer responses to biologic therapy.18,19 In a multicenter study including patients treated with infliximab, vedolizumab, or UST, Yarur et al. found that higher baseline VAT was associated with a lower likelihood of achieving corticosteroid-free or endoscopic remission. 33 Tan et al. evaluated VAT using the VAT-to-skeletal muscle ratio at the mid-L3 vertebral level and reported that a higher VAT ratio increased the risk of loss of response to UST. 34 Similarly, a recent study revealed that baseline MAT index by computed tomography enterography could predict TH at week 26 in CD patients receiving UST. 35 Consistent with these previous studies, we newly identified that the score of quantified VAT volume adjusted by BMI negatively predicted both short- and long-term TH in CD patients receiving UST. Collectively, these data suggest that VAT may contribute to persistent intestinal injury and disease progression, thereby reducing treatment efficacy.
The mechanisms by which VAT influences intestinal healing merit further investigation. TH referred to the remission of bowel wall thickening with no sign of inflammation.2,5 Anatomically, VAT—particularly MAT—was in close proximity to the muscularis propria, providing a structural basis for bidirectional crosstalk between MAT and the intestinal wall. 10 Liu et. al revealed that MAT-derived free fatty acids could directly promote smooth muscle hypertrophy and fibrostenosis. 11 In addition, MAT-derived exosomes carrying pro-fibrotic mediators such as TINAGL1 and miR-103a-3p have been shown to facilitate intestinal fibrosis.36,37 Moreover, bacterial translocation from the intestinal lumen to MAT may perpetuate local inflammation, 38 leading to immune cell infiltration and sustained cytokine release. These processes may collectively exacerbate intestinal inflammation, enhance fibrosis, and hinder TH, ultimately attenuating the therapeutic efficacy of biologics such as UST.
It will be promising to incorporate VAT volume measurement into clinical practice. Although CrF is more correlated with CD bowel disease; VAT may better reflect the overall assessment of the inflammatory burden of CD.14,15 VAT measurement is noninvasive, reproducible, and readily integrated into routine MRE, as it relies on standard imaging sequences without additional scan time or radiation exposure. This makes VAT a practical imaging biomarker. Moreover, VAT may facilitate early risk stratification and guide personalized monitoring strategies. Given its potential to predict disease progression, biologic response, and postoperative recurrence.17,19,39 VAT could help identify high-risk patients who may benefit from earlier treatment optimization or combination therapy, thereby potentially reducing overall healthcare costs associated with prolonged ineffective treatment. However, we acknowledge that manual VAT quantification remains time-consuming and increases radiologists’ workload. Therefore, the development of automated or semi-automated VAT measurement tools will be essential to enable efficient, standardized, and wider clinical adoption.
Several limitations should be acknowledged. First, although longitudinal data at both short- and long-term timepoints were collected, this was a single-center retrospective study with a relatively small sample size, which may limit the generalizability of the findings. Future multicenter prospective cohorts are required to confirm the predictive value of baseline VAT for TH. Secondly, including patients under UST maintenance therapy may inadvertently remove patients with failed UST induction therapy, leading to selection bias. Although previous studies have revealed that VAT was a negative predictor for disease healing/remission in biologics induction therapy.19,33 Future studies should include both short-term and long-term patients to strengthen the reliability of the findings. Third, it remains necessary to integrate VAT with other clinical, endoscopic, and histopathological parameters to establish a comprehensive model for predicting treatment outcomes in patients receiving UST or other biologics. Finally, VAT quantification in our study was performed manually by experienced radiologists. The development of accurate, automated algorithms for MRE-based VAT assessment would greatly facilitate its clinical application.
Conclusion
Baseline VAT was an independent risk factor for predicting both short- and long-term TH in CD patients receiving UST. Patients with lower baseline VAT volume were more likely to achieve TH after UST treatment.
Supplemental Material
sj-docx-1-tag-10.1177_17562848261424142 – Supplemental material for Quantification of visceral adipose tissue volume predicts both short-term and long-term transmural healing in patients with Crohn’s disease receiving Ustekinumab
Supplemental material, sj-docx-1-tag-10.1177_17562848261424142 for Quantification of visceral adipose tissue volume predicts both short-term and long-term transmural healing in patients with Crohn’s disease receiving Ustekinumab by Xiaomin Wu, Cien Fan, Xiaoyu Duan, Zhiyin Feng, Xuehua Li, Minhu Chen, Yu Wang, Qingzhu Zheng and Ren Mao in Therapeutic Advances in Gastroenterology
Supplemental Material
sj-docx-2-tag-10.1177_17562848261424142 – Supplemental material for Quantification of visceral adipose tissue volume predicts both short-term and long-term transmural healing in patients with Crohn’s disease receiving Ustekinumab
Supplemental material, sj-docx-2-tag-10.1177_17562848261424142 for Quantification of visceral adipose tissue volume predicts both short-term and long-term transmural healing in patients with Crohn’s disease receiving Ustekinumab by Xiaomin Wu, Cien Fan, Xiaoyu Duan, Zhiyin Feng, Xuehua Li, Minhu Chen, Yu Wang, Qingzhu Zheng and Ren Mao in Therapeutic Advances in Gastroenterology
Supplemental Material
sj-xlsx-3-tag-10.1177_17562848261424142 – Supplemental material for Quantification of visceral adipose tissue volume predicts both short-term and long-term transmural healing in patients with Crohn’s disease receiving Ustekinumab
Supplemental material, sj-xlsx-3-tag-10.1177_17562848261424142 for Quantification of visceral adipose tissue volume predicts both short-term and long-term transmural healing in patients with Crohn’s disease receiving Ustekinumab by Xiaomin Wu, Cien Fan, Xiaoyu Duan, Zhiyin Feng, Xuehua Li, Minhu Chen, Yu Wang, Qingzhu Zheng and Ren Mao in Therapeutic Advances in Gastroenterology
Supplemental Material
sj-xlsx-4-tag-10.1177_17562848261424142 – Supplemental material for Quantification of visceral adipose tissue volume predicts both short-term and long-term transmural healing in patients with Crohn’s disease receiving Ustekinumab
Supplemental material, sj-xlsx-4-tag-10.1177_17562848261424142 for Quantification of visceral adipose tissue volume predicts both short-term and long-term transmural healing in patients with Crohn’s disease receiving Ustekinumab by Xiaomin Wu, Cien Fan, Xiaoyu Duan, Zhiyin Feng, Xuehua Li, Minhu Chen, Yu Wang, Qingzhu Zheng and Ren Mao in Therapeutic Advances in Gastroenterology
Footnotes
References
Supplementary Material
Please find the following supplemental material available below.
For Open Access articles published under a Creative Commons License, all supplemental material carries the same license as the article it is associated with.
For non-Open Access articles published, all supplemental material carries a non-exclusive license, and permission requests for re-use of supplemental material or any part of supplemental material shall be sent directly to the copyright owner as specified in the copyright notice associated with the article.