
Abstract
Background:
Transmural healing (TH) is a potential therapeutic goal of Crohn’s disease (CD) and is associated with better clinical outcomes. However, few studies have described early TH and its predictors.
Objectives:
We aimed to evaluate early TH and its predictors using magnetic resonance enterography (MRE) in patients with CD receiving ustekinumab (UST).
Design:
This was a retrospective observational study.
Methods:
Patients with active CD treated with UST and their intestinal segments with bowel wall thickness (BWT) ⩽ 3 mm at baseline were included. Clinical characteristics, laboratory indicators, endoscopic manifestations, and MRE indices were evaluated at baseline and week 26 (W26) of the therapy. The following MRE parameters were assessed: BWT, edema, apparent diffusion coefficient (ADC), Clermont score, Magnetic Resonance Index of Activity score, fat stranding, comb sign, and stricture. TH was defined as BWT ⩽ 3 mm without any signs of inflammation (i.e., ulceration, edema, diffusion-weighted hyperintensity, and increased contrast enhancement) at W26.
Results:
The study included 37 patients with 106 intestinal segments (including 15 proximal small intestines, 33 terminal ilea, and 58 colons). Clinical features, laboratory indicators, endoscopic results, and MRE parameters at W26 were significantly improved after UST treatment in both patient-based and intestinal segment-based analysis. Seven (18.9%) patients and 26 (24.5%) intestinal segments achieved TH at W26. Baseline BWT [odds ratio (OR) = 0.287, 95% confidence interval (CI), 0.090–0.918, p = 0.035] and ADC (OR = 2.997, 95% CI, 1.009–8.908, p = 0.048) predict TH of patients at W26. Baseline ADC (OR = 2.857, 95% CI, 1.285–6.349, p = 0.010) and presence of stenosis (OR = 0.196, 95% CI, 0.052–0.735, p = 0.016) were associated with TH of segments at W26.
Conclusion:
Early TH assessed by MRE was observed in nearly one-fifth of patients with CD and intestinal segments after UST treatment for 26 weeks. Baseline MRE indices such as BWT and presence of stenosis might negatively predict TH, while ADC might positively predict early TH.
Introduction
Crohn’s disease (CD) is a chronic inflammatory gastrointestinal disease that often causes strictures or fistulas in multiple segments. 1 Numerous previous studies have shown that mucosal healing (MH), assessed by endoscopy, predicts lower clinical relapses, complications, hospitalization, and risks of surgery.2–4 However, considering that transmural damage is the major characteristic of CD, active inflammation can still be detected in some patients with MH in cross-sectional evaluations.5,6 Recent studies demonstrated that transmural healing (TH), assessed by intestinal ultrasonography (IUS) or magnetic resonance enterography (MRE), might be a more appropriate therapeutic goal of CD than MH.7–9
Ustekinumab (UST) is a fully human IgG1κ monoclonal antibody that binds to the shared p40 subunit of interleukin (IL)-12 and IL-23. 10 It is indicated as induction and maintenance therapies for CD (CERTIFI17 and UNITI18 trials) and ulcerative colitis (UNIFI19 trial).11,12 In patients with CD receiving 1-year UST treatment, the cumulative rates of clinical remission (CR) and MH were both nearly 40%.13,14 Serum UST concentrations are associated with outcomes in patients with CD. 15 However, early TH has rarely been assessed using MRE, and risk factors associated with TH in UST therapy remain unclear.
In this study, we explored the early achievement of TH assessed by MRE in patients with CD receiving UST, according to patient-based and intestinal segment-based analyses. Furthermore, the association between baseline indices and early TH was investigated to identify the predictors of early responsiveness to UST.
Materials and methods
Study design and patients
This retrospective observational study was conducted at the First Affiliated Hospital, Sun Yat-Sen University. Patients in this study were consecutively included from August 2021 to September 2022 in the prospectively maintained database of our department. They were diagnosed with CD based on clinical, radiologic, endoscopic, and histological examinations according to the European Crohn’s and Colitis Organization guidelines. 16 Patient consent to UST treatment was obtained. The dosage of UST was approximately 6 mg/kg intravenously on day 0, and 90 mg was administered subcutaneously once every 8 or 12 weeks. In our center, repeat endoscopy and MRE were regularly performed to assess the efficacy at week 26 (W26) in patients with CD receiving UST. Demographic features and clinical characteristics of patients with CD at baseline and W26 were obtained from the prospectively maintained database of our department.
The inclusion criteria were as follows: (1) a confirmed diagnosis of active CD at baseline, (2) patients receiving UST for >26 weeks, (3) MRE and ileocolonoscopy performed at baseline and W26 of UST treatment, and (4) at least one inflamed intestinal segment with bowel wall thickness (BWT) > 3 mm and signs of inflammation (i.e., ulceration, edema, diffusion-weighted hyperintensity, and increased contrast enhancement) on MRE at baseline. The exclusion criteria were as follows: (1) patients younger than 14 years old or older than 70 years old, (2) patients with comorbid immunological diseases (e.g., systemic lupus erythematosus), (3) patients treated with other biologic agents (e.g., infliximab, adalimumab, vedolizumab) or those who underwent abdominal surgery during the 26-week UST treatment, and (4) patients with incomplete information or loss of follow-up.
The reporting of this study conformed to the STROBE statement. 17 All patient details were de-identified in this study. This study was approved by the Ethics Committee Institutional Board of the First Affiliated Hospital, Sun Yat-Sen University, and a waiver of informed consent was permitted in retrospective study.
MRE examinations and image analysis
All patients underwent MRE using a 3.0-T Magnetom Trio system (Siemens Medical Solutions, Erlangen, Germany). Bowel cleansing was performed according to our previously reported protocol. 18 In brief, 1.6–2 L of 2.5% mannitol solution was administered one h before the procedure; 10 mg of raceanisodamine hydrochloride was intramuscularly injected into the buttocks 10 min before MRE. 18 T2-weighted imaging (repetition time/echo time (TR/TE): 1200/87 ms, matrix: 320 × 194, slice thickness: 4 mm, flip angle: 160°) and diffusion-weighted imaging (DWI) with three b values of 50, 400, and 800 s/mm2 (TR/TE: 5000–5900/73–83 ms, matrix: 192 × 115, slice thickness: 4–5 mm) were routinely performed. 18 Apparent diffusion coefficient (ADC) map was generated automatically on the scanner console using monoexponential model. T1-weighted images (TR/TE: 4.37/1.37 ms, matrix: 320 × 217, slice thickness: 2 mm, flip angle: 13°) were acquired before and at 15 s, 70 s, and 7 min after the intravenous injection of 0.2 mL/kg gadopentetate dimeglumine at a rate of 2 mL/s. 18
Two experienced radiologists (XL and CH), who were blinded to the clinical data, analyzed the images using a postprocessing workstation. For patient-based analysis, the intestinal segment with the thickest bowel wall at baseline was selected as the representative segment for follow-up. If one patient showed multiple affected segments with the highest BWT, we selected the intestinal segment with the highest Magnetic Resonance Index of Activity (MaRIA) score at baseline as the representative segment. For intestinal segment-based analysis, we divided the digestive tract into seven segments (i.e., small intestine, terminal ileum, ascending colon, transverse colon, descending colon, sigmoid colon, and rectum).
The ADC was calculated on the ADC map by drawing a region of interest on the bowel wall corresponding to the area of highest signal intensity on bowel DWI. 19 Relative contrast enhancement (RCE) of the intestinal wall was calculated according to previous publications. 20 The Clermont score was calculated for each segment using the following formula: 1.646 × BWT (mm) −1.321 × ADC + 5.613 × edema + 8.306 × ulcers + 5.039. 19 The MaRIA score was calculated using the following formula for each segment: MaRIA = 1.5 × BWT (mm) + 0.02 × RCE + 5 × edema + 10 × ulceration. 20 Stenosed intestinal segments were defined as localized luminal narrowing (a luminal diameter reduction of ⩾50%, measured relative to the normal adjacent bowel loop), bowel wall thickening (⩾25% increase in BWT relative to the adjacent non-affected bowel), and pre-stenotic dilation (proximal dilated luminal diameter of small intestine was more than 3 cm, or proximal dilated luminal diameter of colon was more than 6 cm). 21 Ulcerations on MRE were defined as the appearance of small focal breaks in the intraluminal surface of the bowel wall, with focal extension of air or enteric contrast into the inflamed bowel wall. 22 Intramural edema was defined as a hyperintense signal on fat-saturated T2-weighted images. 22 Fat stranding was defined as the loss of the normal sharp interface between the intestinal wall and mesentery, with edema or fluid in the perienteric fat. 23
Endoscopic evaluation
Endoscopy was performed to detect mucosal lesions and MH. For segmental analysis, we divided the digestive tract into five segments (i.e., terminal ileum, right colon, transverse colon, left colon, and rectum). Endoscopic activity was assessed by two experienced endoscopists (RM and YQ) according to the Simple Endoscopic Score for Crohn’s Disease (SES-CD). The SES-CD score was the sum of each segment based on the size of the ulcers, ulcerated surface, affected surface, and presence of narrowing (score range 0–56). 24
Outcomes and definitions
The primary outcome of this study was to evaluate TH using MRE at W26, while the secondary outcome was the analysis of baseline predictors of TH. TH at MRE was defined as BWT ⩽3 mm without any signs of inflammation (i.e., ulceration, edema, diffusion-weighted hyperintensity, and increased contrast enhancement) at W26. 25 CR was defined as Crohn’s Disease Activity Index (CDAI) < 150 at W26. 26 Complete MH was defined as the absence of any mucosal ulcerations (i.e., SES-CD = 0) in all segments under endoscopy at W26. 27
Statistical analysis
The IBM Statistical Package for the Social Sciences (SPSS v26.0, IBM, Armonk, NY, USA) was used for statistical analysis. Continuous variables are presented as mean ± standard deviation (SD) and compared using unpaired Student’s t test or paired Student’s t test, as appropriate. Discrete variables are shown as median ± interquartile range and were compared using the nonparametric Mann–Whitney U test. Categorical variables were expressed as n (%) and compared using χ2 test. Logistic regression was used for univariate and multivariate analyses with stepwise selection to predict TH at W26 using baseline factors. Variables with a p < 0.1 in univariate logistic regression analysis were used in the multivariate logistic analysis. Results are expressed as odds ratios (OR) with 95% confidence intervals (CI). A two-sided p < 0.05 was considered significant.
Results
Baseline characteristics and demographics
A total of 37 patients with CD receiving UST treatment were included from the prospectively maintained database of our department. Table 1 presents the baseline patient characteristics. Of the 37 patients, the mean age at diagnosis was 29.1 ± 10.8 years, while the duration of the disease was 6.0 ± 5.0 years. Patients were classified into B1 (45.9%), B2 (48.6%), and B3 (5.4%), based on disease behavior. In addition, 21 patients (56.8%) had perianal lesions, and eight (21.6%) had upper gastrointestinal lesions. Regarding their medication history, 8 (21.6%) patients were treatment-naïve, 22 (59.5%) had prior anti-tumor necrosis factor therapy (e.g., infliximab or adalimumab), and 13 (35.1%) had previous bowel resection.
Baseline patient characteristics.

BMI, body mass index; CD, Crohn’s disease; SD, standard deviation.
Changes of clinical, laboratory, endoscopic, and MRE features after 26-week UST treatment
Patient-based analysis
After the 26-week UST treatment, 25 patients (67.6%) were in CR, 10 (27.0%) showed MH, and seven (18.9%) achieved TH. More specifically, seven patients achieved both TH and MH, while three patients showed MH only. CDAI (p < 0.001), platelet count (PLT, p = 0.030), C-reactive protein (CRP, p = 0.001), erythrocyte sedimentation rate (ESR, p < 0.001), SES-CD (p < 0.001), total MaRIA score (p = 0.004), and total Clermont score (p = 0.003) significantly decreased, while body mass index (BMI, p = 0.016) and hematocrit (HCT, p = 0.045) increased versus baseline (Table 2, Figure 1).
Comparison of clinical, laboratory, endoscopic, and magnetic resonance enterography features at baseline and W26.
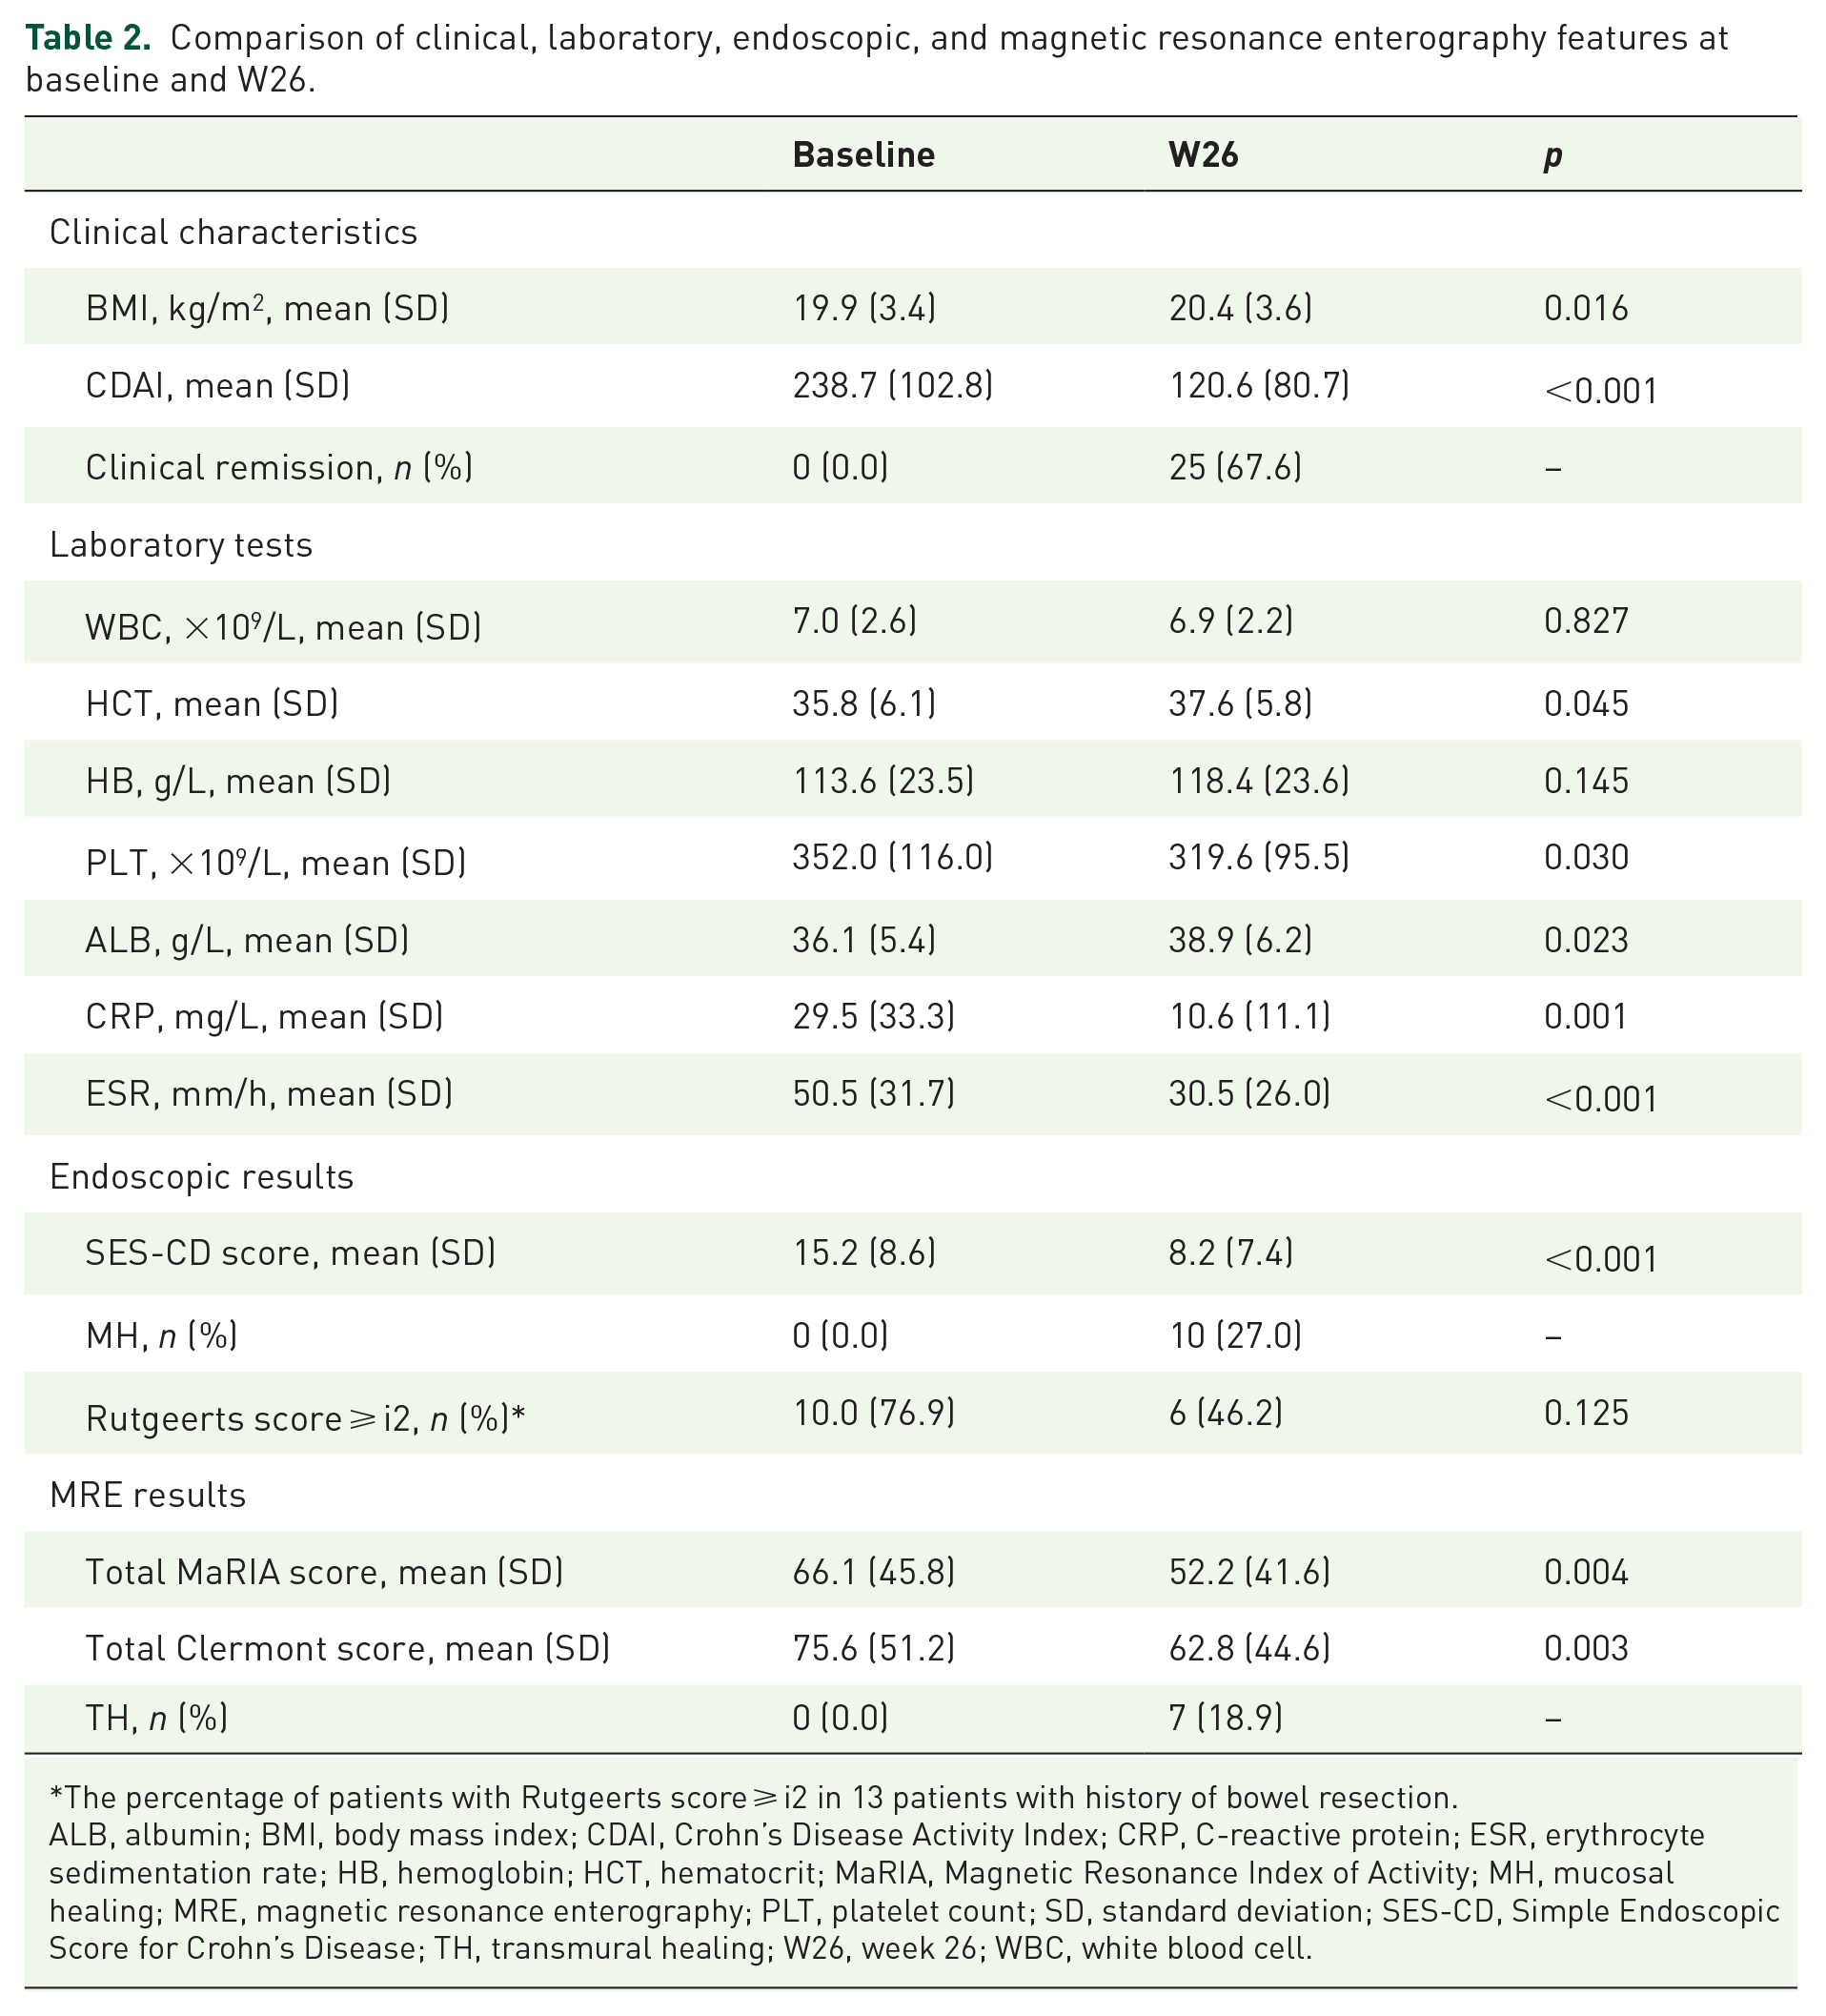
The percentage of patients with Rutgeerts score ⩾ i2 in 13 patients with history of bowel resection.
ALB, albumin; BMI, body mass index; CDAI, Crohn’s Disease Activity Index; CRP, C-reactive protein; ESR, erythrocyte sedimentation rate; HB, hemoglobin; HCT, hematocrit; MaRIA, Magnetic Resonance Index of Activity; MH, mucosal healing; MRE, magnetic resonance enterography; PLT, platelet count; SD, standard deviation; SES-CD, Simple Endoscopic Score for Crohn’s Disease; TH, transmural healing; W26, week 26; WBC, white blood cell.

MRE and endoscopic manifestations at baseline and W26 of UST treatment. MRE (top, T2-weighted image; middle, contrast-enhanced T1-weighted image) and endoscopic (bottom) manifestations of patients achieving TH (a) and no TH (b) at baseline and at W26. (a) At baseline, MRE detected severe inflammatory lesions in the ascending colon, with bowel wall thickening, edema, and hyperenhancement. Baseline endoscopy showed severe ulcers. At W26, the ascending colon achieved TH at both MRE and endoscopy. (b) At baseline, MRE detected severe lesions in the descending colon, with edema of the bowel wall, fat stranding, comb sign, hyperenhancement, and irregular mucosal surface. Baseline endoscopy confirmed the presence of severe ulcers. At W26, these signs did not improve.
Intestinal segment-based analysis
Because CD is characterized by multi-segmental involvement, we performed an intestinal segment-based analysis in 37 patients with CD. We included 106 intestinal segments with BWT > 3 mm and signs of inflammation (i.e., ulceration, edema, diffusion-weighted hyperintensity, and increased contrast enhancement) at baseline; 26 (24.5%) achieved TH at W26. Specifically, the colon tended to show a higher proportion of TH (27.6%), MaRIA score < 7 (19.0%), and <11 (27.6%), and a lower rate of edema (60.3%) than small intestine and terminal ileum at W26 (Figure 2(a)). Compared to baseline, BWT, MaRIA score, and Clermont score decreased and ADC increased after 26 weeks of treatment (Figure 2(b) and (e)).

MRE parameters of different intestinal segments.
Prediction of TH
Patient-based analysis
In subgroup analysis, the TH group were older age at diagnosis (p = 0.017), had lower baseline PLT (p = 0.011), SES-CD score (p = 0.049), BWT (p = 0.003), fat stranding (p = 0.042), Clermont score (p = 0.003), luminal diameters of upstream segments (p = 0.017), and MaRIA score (p = 0.002), but higher ADC (p = 0.001) than the no-TH group (Table 3). There were no differences in disease location and disease behavior between the two groups. In addition, the TH group tended to have lower CDAI, white blood cell, CRP, ESR, and RCE, and higher HCT, hemoglobin, albumin at baseline compared to the no-TH group (Table 3). The TH group were less likely to have perianal disease involvement, edema, ulceration, and comb sign at baseline (Table 3).
Comparison of clinical, laboratory, endoscopic, and MRE features at baseline in patients with TH versus no TH.
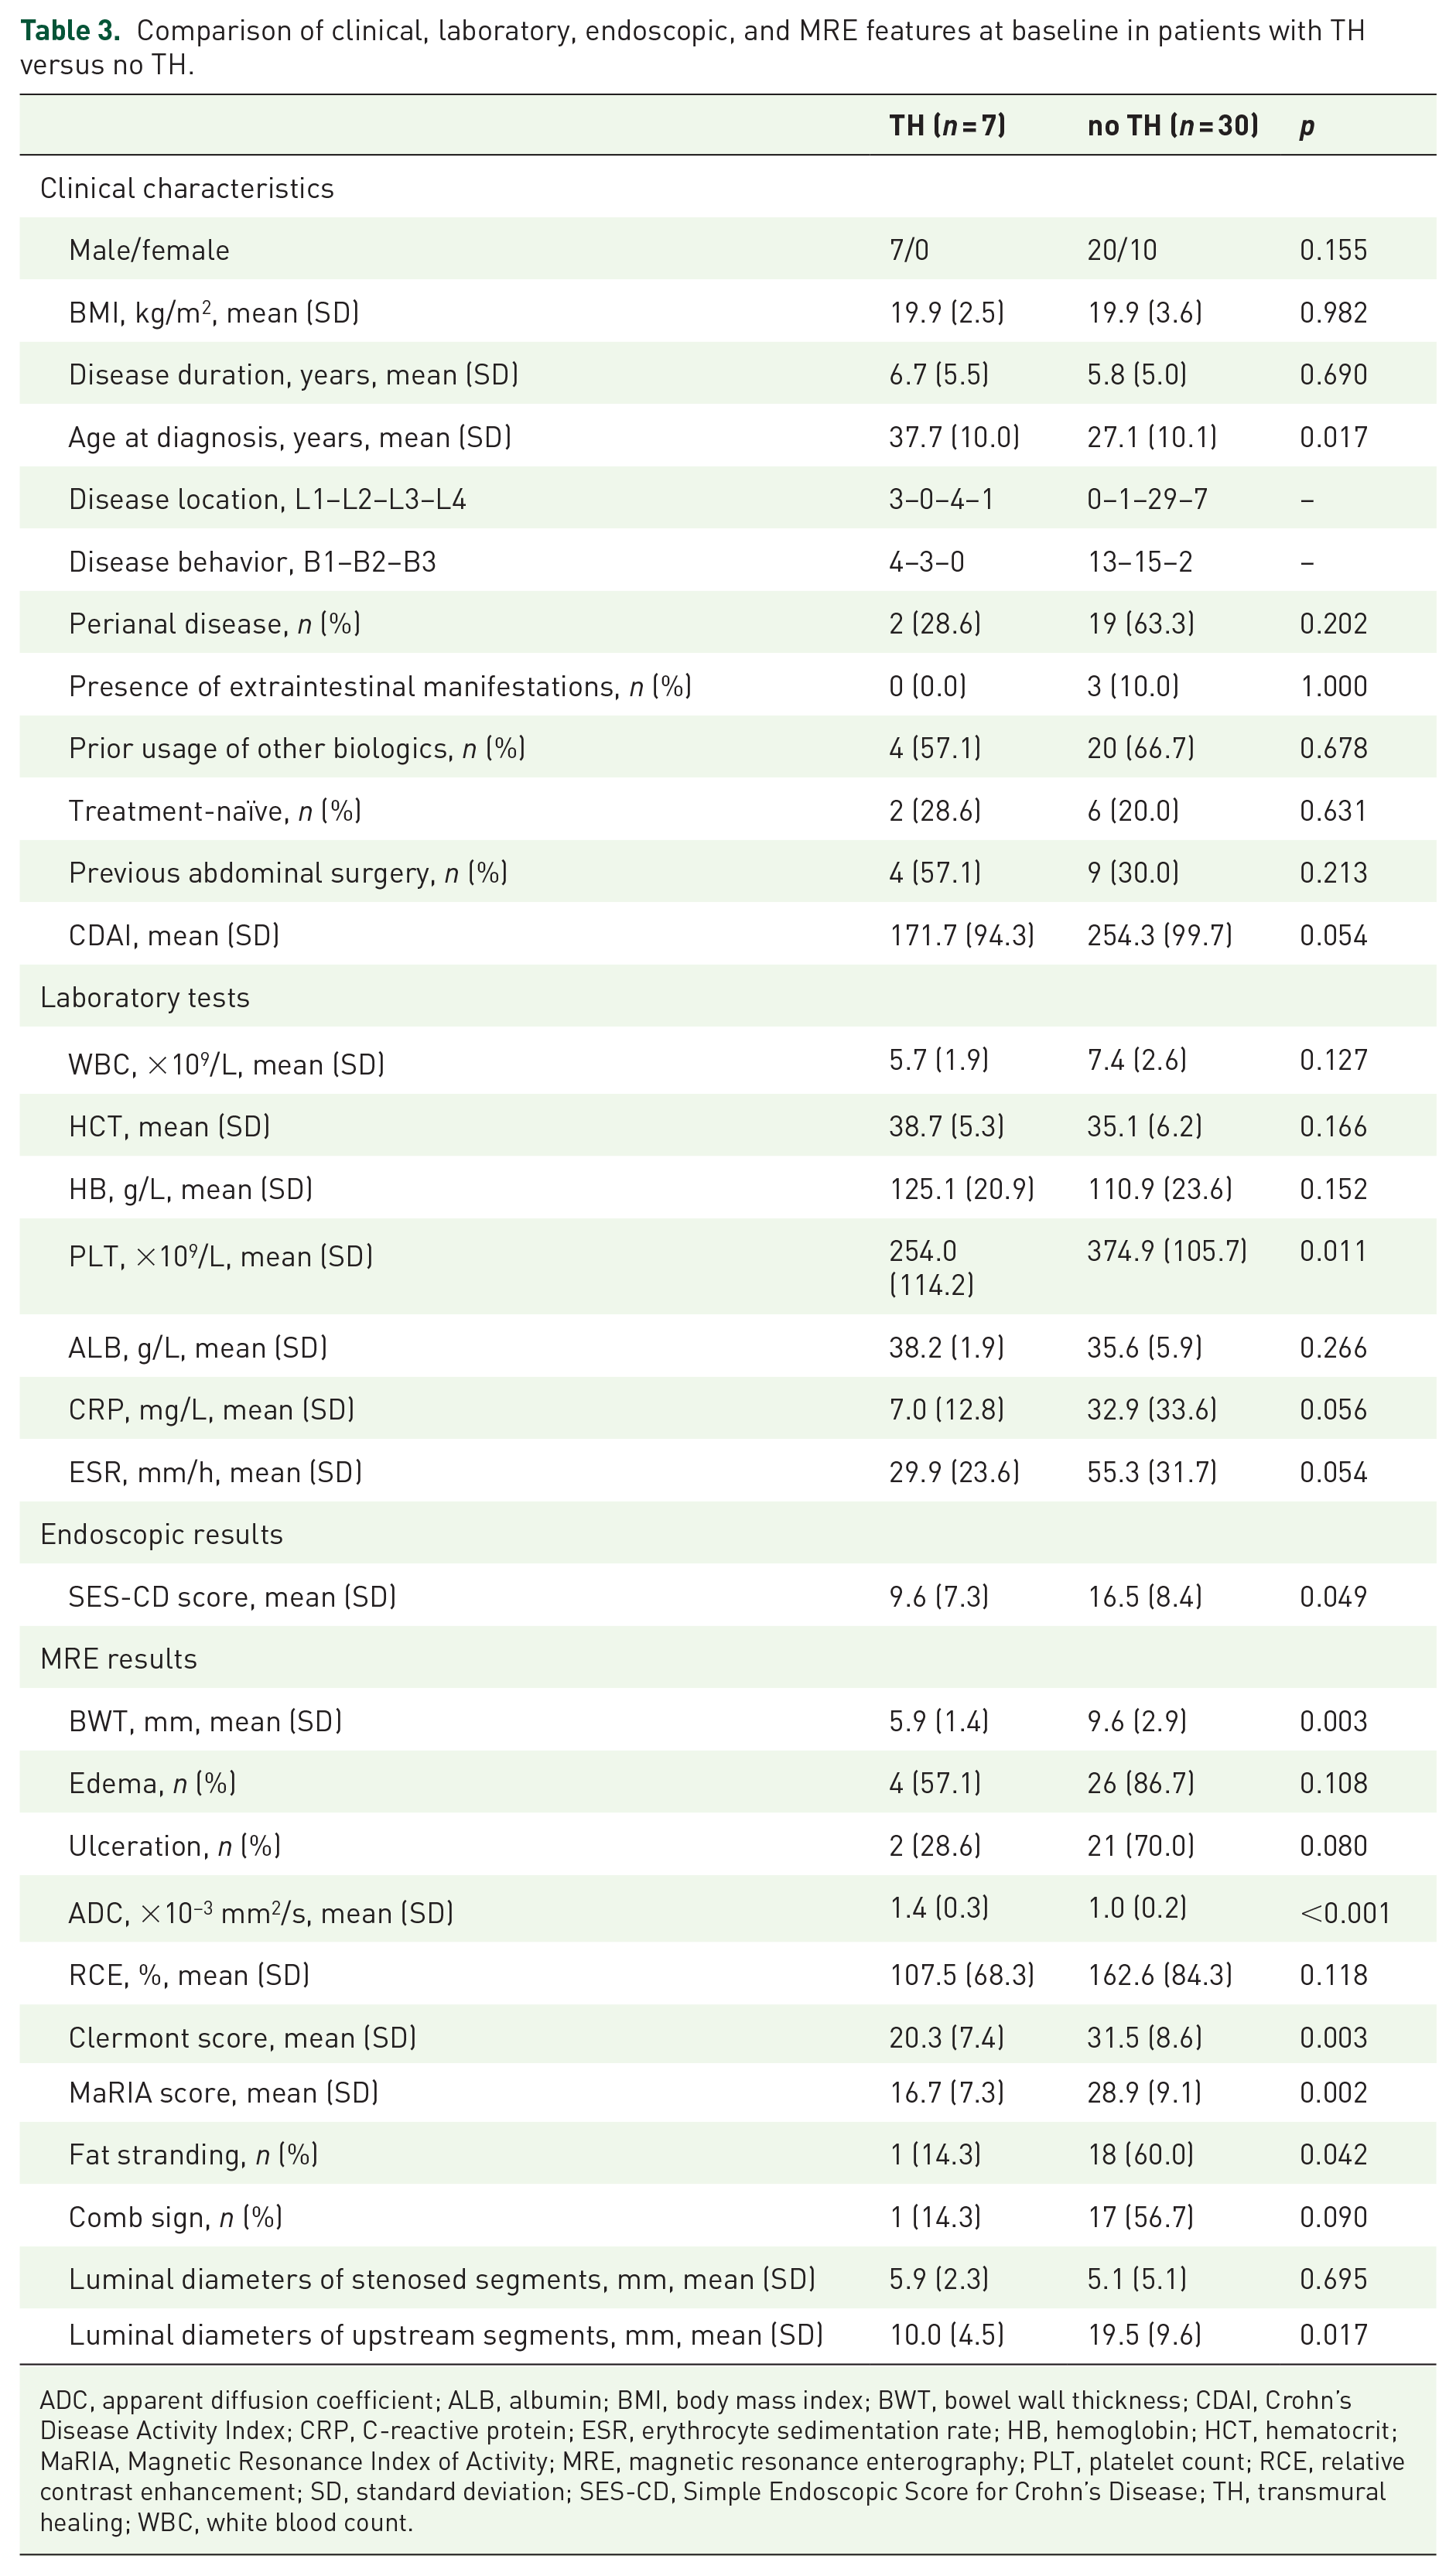
ADC, apparent diffusion coefficient; ALB, albumin; BMI, body mass index; BWT, bowel wall thickness; CDAI, Crohn’s Disease Activity Index; CRP, C-reactive protein; ESR, erythrocyte sedimentation rate; HB, hemoglobin; HCT, hematocrit; MaRIA, Magnetic Resonance Index of Activity; MRE, magnetic resonance enterography; PLT, platelet count; RCE, relative contrast enhancement; SD, standard deviation; SES-CD, Simple Endoscopic Score for Crohn’s Disease; TH, transmural healing; WBC, white blood count.
Logistic regression revealed that decreased baseline BWT (OR = 0.287, 95% CI, 0.090–0.918, p = 0.035) and increased ADC (OR = 2.997, 95% CI, 1.009–8.908, p = 0.048) were independently associated with a higher likelihood of TH in patients (Table 4). Finally, we included these two factors and established a prediction model for TH in patients: logit (p) = 0.677 − 1.248 × BWT + 1.098 × ADC. The model accurately predicted TH in patients with 100% sensitivity and 76.7% specificity [area under the curve (AUC) = 0.952, 95% CI 0.879–1.000, p < 0.001; Figure 3(a)].
Predictors of TH with baseline features in patient-based analysis.
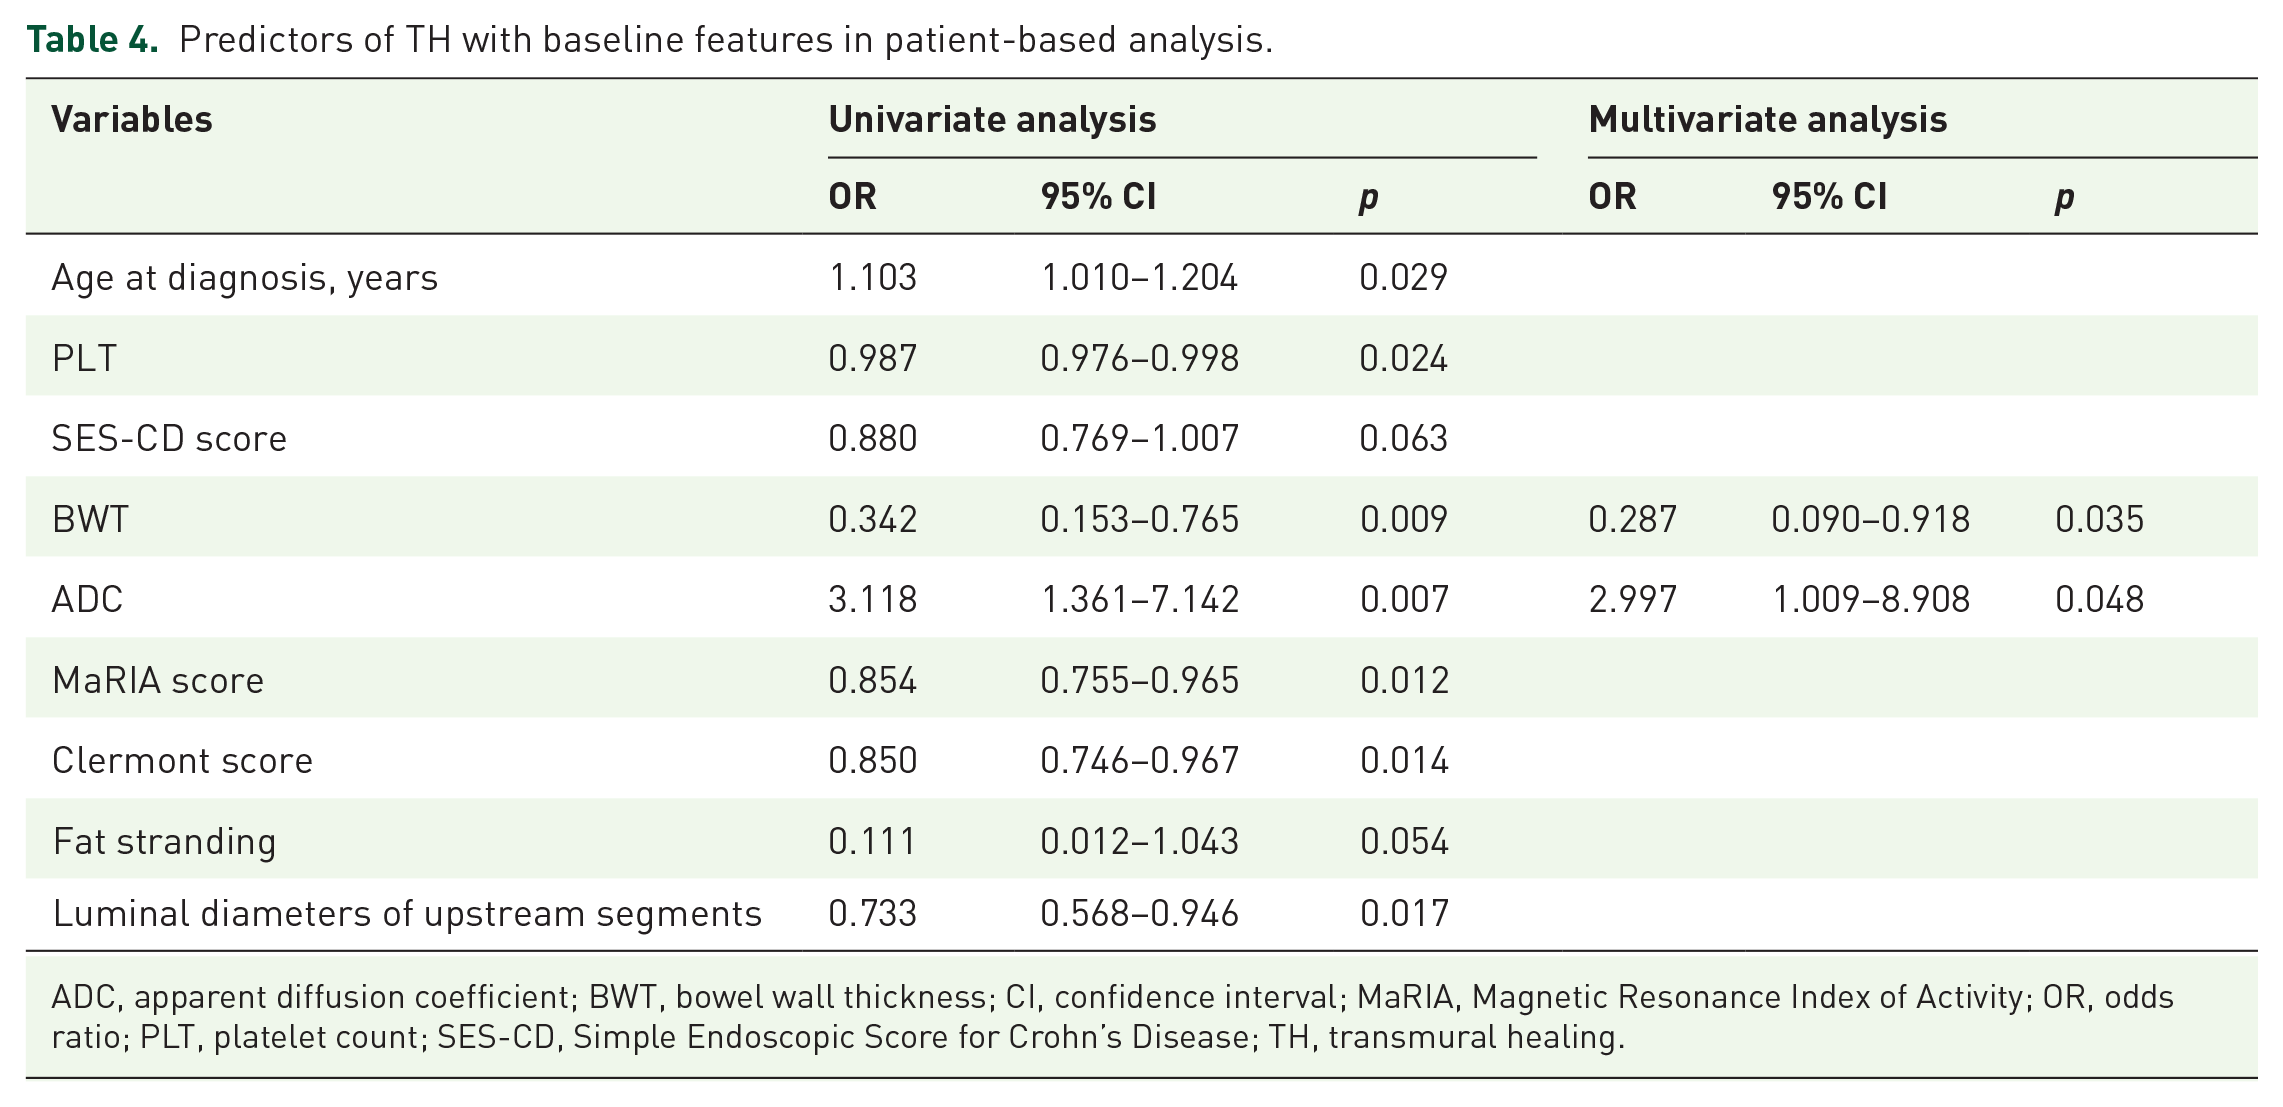
ADC, apparent diffusion coefficient; BWT, bowel wall thickness; CI, confidence interval; MaRIA, Magnetic Resonance Index of Activity; OR, odds ratio; PLT, platelet count; SES-CD, Simple Endoscopic Score for Crohn’s Disease; TH, transmural healing.
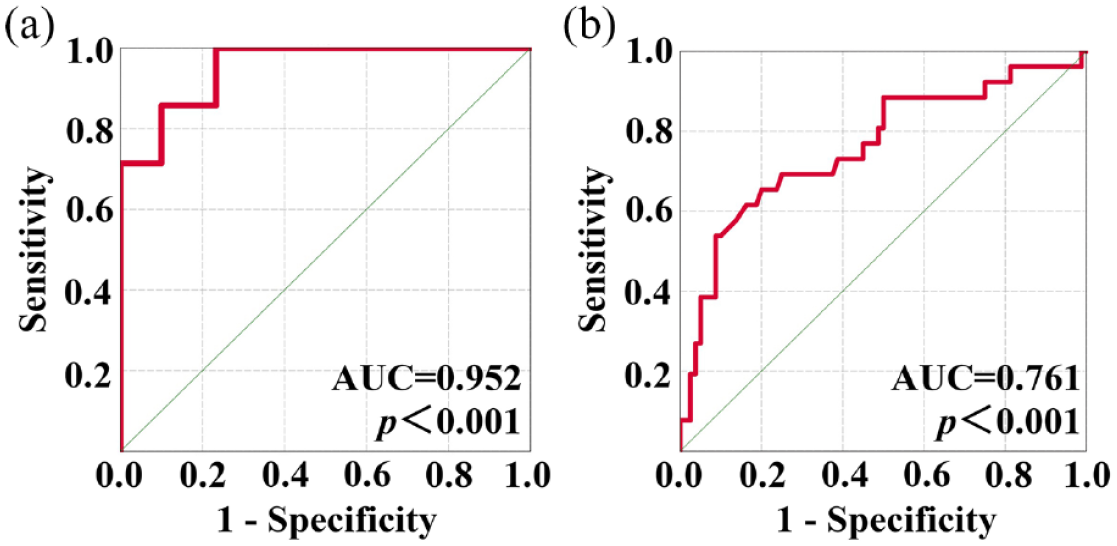
ROC curve of logistic regression analysis. (a) ROC curve for the prediction of TH of patients with baseline BWT and ADC; (b) ROC curve for the prediction of TH of intestinal segments with baseline ADC and stenosis.
Intestinal segment-based analysis
Segments with TH showed significantly decreased BWT (p = 0.004), lower proportion of stenosed segments (p = 0.010), reduced luminal diameters of upstream segments (p = 0.011), but higher ADC (p < 0.001) and luminal diameters of stenosed segments (p = 0.011) at baseline (Table 5). In addition, segments with TH tended to have lower RCE, Clermont score, MaRIA score, and were less likely to exhibit the comb sign at baseline than those segments that fail to achieve TH.
Comparison of MRE features at baseline in intestinal segments with TH versus no TH.

ADC, apparent diffusion coefficient; BWT, bowel wall thickness; MaRIA, Magnetic Resonance Index of Activity; MRE, magnetic resonance enterography; RCE, relative contrast enhancement; SD, standard deviation; TH, transmural healing.
Logistic regression showed that increased ADC (OR = 2.857, 95% CI, 1.285–6.349, p = 0.010) and no stenosis at baseline (OR = 0.196, 95% CI, 0.052–0.735, p = 0.016) were independently associated with a higher likelihood of TH of a single intestinal segment (Table 6). A prediction model of TH in segments was formed based on ADC and stenosis: logit (p) = −3.210 − 1.576 × stenosis + 0.870 × ADC. The model accurately predicted TH in segments with 65.4% sensitivity and 80.0% specificity (AUC = 0.761, 95% CI, 0.645–0.876, p < 0.001; Figure 3(b)).
Predictors of TH with baseline features in intestinal segment-based analysis.

ADC, apparent diffusion coefficient; BWT, bowel wall thickness; CI, confidence interval; MaRIA, Magnetic Resonance Index of Activity; OR, odds ratio; RCE, relative contrast enhancement; TH, transmural healing.
Discussion
Previous clinical trials showed that UST was effective at inducing and maintaining CR and MH in patients with CD.12,28 Considering that CD is a multi-segmental inflammatory disease with transmural damage, TH should be assessed and achieved. 29 TH is also associated with better clinical outcomes in patients with CD and is a potential therapeutic goal in the management of CD. 25 In this study, we found that nearly 20% of patients or intestinal segments achieved TH defined by MRE in 37 patients with CD and 106 intestinal segments at W26 of UST therapy. Clinical features, laboratory indicators, endoscopic results, and MRE indices were significantly improved at W26. Furthermore, colon showed higher rates of TH than the small intestine and terminal ileum at W26. Finally, we demonstrated that baseline BWT and ADC might predict TH in patients, while baseline ADC and stenosis might predict TH in segments at W26. These parameters may work as early indicators of TH, and potentially guide the optimization of UST therapy and personalized treatment to achieve TH.
The UST was effective in achieving early TH in patients with CD. A previous study (STARDUST trial) reported that patients with CD treated with UST achieved progressive transmural remission from week 4 to 48 (24.1% at week 48).13,30 Another real-world clinical study (SUCCESS trial) showed that 30% of patients with CD achieved radiographic remission at 12 months after UST treatment. 14 In our study, only 18.9% patients achieved TH at W26 of UST therapy. The lower rates of TH in our study were due to the shorter follow-up time and the different definitions. The STARDUST trial defined transmural remission as normalization of all IUS parameters; in the SUCCESS trial, radiographic remission was defined as the absence of imaging features of active inflammation based on interpretation by a local radiologist.13,14 We defined TH as BWT ⩽ 3 mm without any signs of inflammation using MRE. Although previous studies have demonstrated an excellent agreement between IUS and MRE in the detection of bowel lesions, it is challenging for different modalities to define TH by a consistent definition.31–33 Because the definitions of TH varied in different studies, an appropriate and consistent definition of TH should be developed in the future.
Interestingly, the colon showed the most robust responses to UST therapy in the STARDUST trial (62.5% for IUS response at week 48) and our study (27.6% for TH at W26). 13 Differences in healing among the colon, small intestine, and terminal ileum have also been shown in other immunosuppressants and biologics in previous studies and were attributed to differences in genetic susceptibility, structural anatomic characteristics, different bacterial colonization, and immune response.34–36 Previous studies showed that variants in the NOD2 gene were positively associated with small intestinal disease, whereas IL23R polymorphisms were positively associated with isolated colonic CD. 36 Furthermore, the ratio of Faecalibacterium prausnitzii to Escherichia coli can discriminate between patients with ileal, ileocolonic, and colonic-only CD. 36 The ileum in CD is characterized with type 1 or type 17 helper T cell profile, whereas the colon is just characterized by a type 1 profile. 36 In addition, previous studies have reported that larger and deeper ulcers in the ileum were less likely to heal than smaller or superficial ulcers.37,38
Predictors and risk factors for TH in UST therapy have gained much attention. In the SUCCESS trial, patients with biologic exposure experienced significantly reduced rates of radiographic remission at 12 months compared to biologic-naïve patients. 14 However, there were no differences in prior biologic therapy between the TH and no-TH group in our study (p = 0.678). Prior usage of biologics was also not associated with likelihood of TH in patients at W26 (p = 0.404). This was possibly due to small sample size and short follow-up time of our study. To our knowledge, our study is the first to predict early TH in UST therapy using baseline MRE indices. We demonstrated that decreased baseline BWT and increased ADC were independently associated with a higher likelihood of TH of patients, while increased ADC and no stenosis at baseline predict TH in a single intestinal segment. In general, higher ADC values functionally indicated less inflamed tissues and differentiated inactive-mild from moderate-severe CD. 39 The absence of stenosis was anatomically associated with better outcomes (e.g., symptomatic and endoscopic remission). 40 We finally combined both morphological and functional indices of MRE to predict early TH in UST therapy. Patients and intestinal segments with less anatomical abnormalities and less inflammatory burden were more likely to achieve TH.
Our study has several limitations. First, our study had a small sample size. However, we performed segment-based analysis and drew similar conclusions. A future multicenter study with a large sample size is warranted. Second, the criteria for TH using MRE are still controversial, and the definition we adopted has been frequently used in the relevant literature. 25 Finally, we did not study long-term outcomes; whether achieving early TH improves long-term outcomes warrants further investigation.
In summary, by performing patient-based and intestinal segment-based analyses, we showed TH using MRE in approximately one-fifth of patients with CD and intestinal segments at W26 of UST therapy. Baseline MRE indices such as BWT, ADC, and stenosis predict early TH.
Supplemental Material
sj-docx-1-tag-10.1177_17562848231170947 – Supplemental material for Early transmural healing and its predictors assessed by magnetic resonance enterography in patients with Crohn’s disease receiving ustekinumab
Supplemental material, sj-docx-1-tag-10.1177_17562848231170947 for Early transmural healing and its predictors assessed by magnetic resonance enterography in patients with Crohn’s disease receiving ustekinumab by Longyuan Zhou, Cicong Hu, Ruonan Zhang, Yun Qiu, Yu Wang, Zishan Liu, Baili Chen, Yao He, Zhirong Zeng, Xuehua Li, Ren Mao and Minhu Chen in Therapeutic Advances in Gastroenterology
Footnotes
Acknowledgements
We are grateful to our collaborators in Department of Gastroenterology and Department of Radiology, the First Affiliated Hospital, Sun Yat-sen University.
Declarations
Supplemental material
Supplemental material for this article is available online.
References
Supplementary Material
Please find the following supplemental material available below.
For Open Access articles published under a Creative Commons License, all supplemental material carries the same license as the article it is associated with.
For non-Open Access articles published, all supplemental material carries a non-exclusive license, and permission requests for re-use of supplemental material or any part of supplemental material shall be sent directly to the copyright owner as specified in the copyright notice associated with the article.