
Abstract
Background:
It remains unclear whether visceral adipose tissue (VAT) can predict the response of patients with Crohn’s disease (CD) to anti-tumour necrosis factor-α (anti-TNF-α) therapy.
Objectives:
This study aimed to investigate whether VAT predicts the efficacy of infliximab (IFX) for different sites of CD and its relationship with serum TNF-α levels and IFX serum trough concentration.
Design:
This is a multicentre retrospective study.
Methods:
Patients with CD treated with IFX from January 2014 to January 2021 were included. The perimeter of the visceral adipose area was obtained by a Computed Tomography (CT) scan. Participants were classified according to the lesion site (L1, L2, and L3) and visceral fat area. The participants were divided into colon-uninvolved non-visceral obesity (L1-VATL), colon-uninvolved visceral obesity (L1-VATH), colon-involved non-visceral obesity (L2 + L3-VATL), and colon involved visceral obesity (L2 + L3-VATH) groups. The end points of this study were set as disease remission status at 6 and 12 months.
Results:
The final cohort included 140 patients. Regarding efficacy at 6 and 12 months, there was a significant difference between L1-VATL (73.8% versus 36.8%, p = 0.006) and L1-VATH (81.0% versus 47.4%, p = 0.008) groups. In the analysis of serum TNF-α levels and IFX serum trough concentrations, there was a significant difference between L1-VATL and L1-VATH (59.5 pg/mL versus 236.0 pg/mL, pTNF-α = 0.006), (10.0 μg/mL versus 0.4 μg/mL, pIFX = 0.000), and L1-VATH and L2 + L3-VATH (78.7 pg/mL versus 118.6 pg/mL, pTNF-α = 0.031), (0.4 μg/mL versus 6.40 μg/mL, pIFX = 0.017).
Conclusion:
In L1 patients, the VAT level predicted the efficacy of IFX, with high VAT values indicating poor efficacy. The VAT level may be a useful radiological marker to predict the efficacy of IFX in patients with various types of CD.
Introduction
Crohn’s disease (CD) is a chronic granulomatous inflammatory disease involving the whole digestive tract. It is mainly found in the terminal ileum and sites adjacent to parts of the colon, with a segmental distribution, and it usually manifests as transmural inflammation. 1 The precise pathogenesis underlying CD remains unclear and is thought to be related to many factors, including immunity, genetics, intestinal flora, and the environment. 2 CD is characterized by incurability and lifelong recurrence. With repeated recurrence, patients may require surgery. However, CD patients often lose weight due to intestinal malabsorption, with their visceral fat content increasing instead. As early as 1932, Crohn et al. found the proliferation of mesenteric adipose tissue (MAT) in patients with CD. 3
Tumour necrosis factor-α (TNF-α) is closely associated with CD pathogenesis; furthermore, the condition of patients with CD is related to TNF-α expression levels in the inflamed intestinal mucosa. Inhibiting TNF-α expression can significantly alleviate the condition of patients with CD. Currently, the main anti-TNF-α agents used for CD treatment are infliximab (IFX) and adalimumab. 1 The data from several randomized case-controlled studies and single- or multicentre cohort studies suggest that the incidence of primary non-response to treatment with IFX and other anti-TNF-α agents in patients with inflammatory bowel disease (IBD) is 9–40%. 4 Therefore, it is clinically important to predict the efficacy of anti-TNF-α therapy for CD.
Visceral adipose tissue (VAT) is the white adipose tissue surrounding the viscera, which can be divided into omental adipose tissue, MAT, retroperitoneal fat, peri-gonadal fat, and pericardial fat, where MAT is the VAT that surrounds the mesentery and attaches to the intestine in a reticular form. 4 VAT forms a particular crawling fat in patients with CD. VAT releases inflammatory mediators, such as TNF-α, which are closely associated with inflammation. This suggests that VAT plays an inflammatory role in CD pathogenesis; arguably, VAT is one of the radiological markers of CD. 5
To date, few studies have assessed the efficacy of IFX according to VAT levels, and the results have been inconsistent. Ding et al. 6 found that VAT did not correlate well with the effect of anti-TNF therapy. However, Shen et al. 7 found that VAT is associated with mucosal healing of anti-TNF therapy in CD. These were conducted in patients with IBD, and the disease locations were not classified. Moreover, studies have highlighted the importance of classifying the disease locations in its diagnosis and treatment. Ileocolonic CD exhibits differences in disease epidemiology, genetics, histology, structure, microbiology, and immunology. 8 Therefore, the effect of VAT on the therapeutic outcomes of various types of CD warrants further investigation.
To fill this gap in current knowledge, the study subjects were limited to CD patients in whom colon involvement had been analysed. In this research, we assessed the predicted efficacy of VAT quantity as a radiological marker in various locations of CD patients receiving IFX therapy and conducted a multicentre retrospective study.
Materials and methods
Patients
This retrospective study was approved by the Ethics Committee of The Third Xiangya Hospital of Central South University (IRB No. R19057). Since this study retrospectively collected the available medical records of the centre, the Ethics Committee of the Third Xiangya Hospital of Central South University agreed that all patients should be treated in accordance with the relevant guidelines and regulations and granted a waiver of informed consent.
Study design
We included CD patients who visited The Third Xiangya Hospital of Central South University, Zhuzhou Central Hospital, and The Central Hospital of Shaoyang between January 2014 and January 2021. The inclusion criteria were (1) patients with CD confirmed by endoscopy and histology, aged ⩾18 years; (2) patients with active CD based on biochemical, endoscopic, or radiological findings, or those requiring corticosteroid therapy; (3) patients who had not undergone any abdominal surgery; (4) patients who had received IFX therapy; (5) patients who had at least one abdominal and pelvic CT examination within 6 months before commencing treatment, and if they had received multiple examinations, the one closest to the IFX treatment was selected; and (6) patients were followed up for no fewer than 12 months after the first IFX administration. Patients were not followed up for less than 12 months after the initial use of IFX unless they received surgeries or changed biological agents because of drug failure within 12 months. The inclusion process of the cohort in this study is shown in Figure 1.

Inclusion and exclusion processes of participants.
Baseline information, including age, sex, body mass index (BMI), smoking, alcohol consumption, mean disease duration, disease presentation (Montréal typing), baseline medications, baseline disease activity [Crohn’s Disease Activity Index (CDAI) score], basic biochemical markers (erythrocyte sedimentation rate, C-reactive protein, albumin), was collected from all enrollees. According to the Montréal typing of the disease and the level of VAT, they were divided into four groups, including colon-uninvolved non-visceral obesity (L1-VATL), colon-uninvolved visceral obesity (L1-VATH), colon-involved non-visceral obesity (L2 + L3-VATL), and colon-involved visceral obesity (L2 + L3-VATH). The L1 subtype was the colon-uninvolved group, and L2 + L3 was the colon-involved group, where visceral obesity was defined as a VAT area ⩾130 cm2. All treatment regimens were performed according to the CD guidelines, and a shared doctor–patient decision-making approach was used to select a treatment regimen acceptable to patients and their families. All enrolled patients received adjuvant treatments and probiotic therapy at different stages of the disease course according to their conditions.
Follow-up
Patients were followed up using CDAI assessments. The CDAI scores were examined 6 and 12 months after the initial treatment.
Study outcome
The primary outcome was clinical remission at 6 and 12 months of treatment. Because monitoring the concentration of therapeutic drugs was not necessary, concentration monitoring was not performed for some patients. Clinical remission was defined as a CDAI score calculated prospectively as <150. 9 Patients were considered to have unremitting disease if they had undergone CD-related surgery or required additional systemic corticosteroids while the treatment dose was increased during the follow-up period.
VAT measurements
Computed Tomography (CT) images were taken of the third lumbar (L3) and VAT was measured (Figure 2). When repeated abdominal CT examinations were performed, the CT report closest to the use of IFX was selected. A total of 50 patients were randomly selected, and their CT images were evaluated by two radiologists (Radiologist 1 and Radiologist 2) to assess the inter-observer reproducibility. In addition, to assess the intra-observer reproducibility, Radiologist 1 generated texture features twice with the same procedure over an 8-week interval. Then, each selected image was evaluated by Radiologist 1 with no knowledge of clinical and biological data using NIH ImageJ 1.47 (Bathesda, Maryland, America), free public domain software produced by the National Institutes of Health. A standard threshold of −150 to −50 Hounsfield units was used to outline the visceral fat area (cm2). As previously reported, visceral obesity was defined as a VAT area ⩾130 cm2. 10
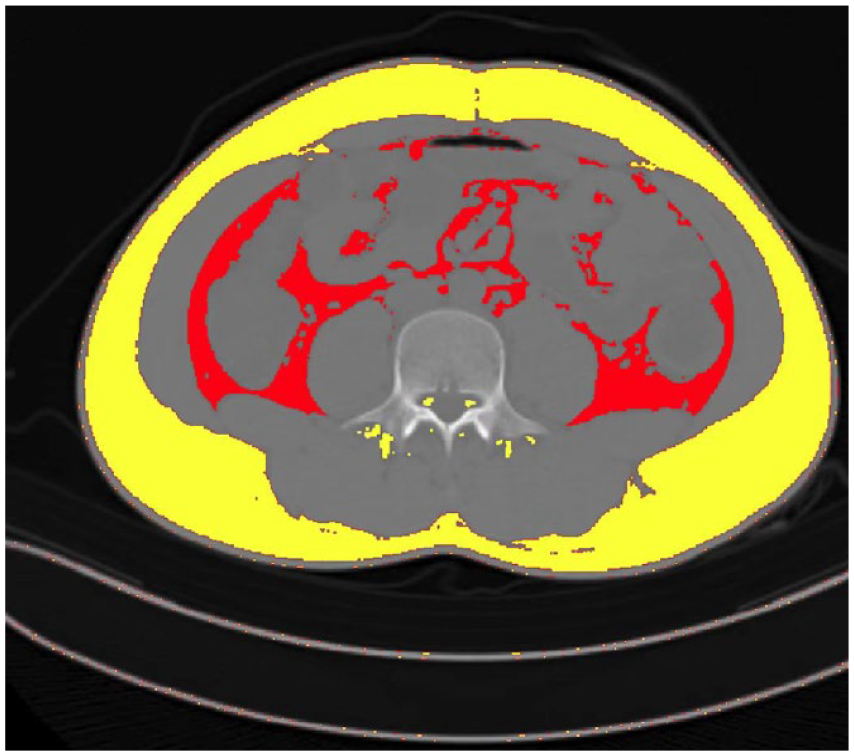
Evaluation of the body composition using a third lumbar computed tomography scan slice. Red, visceral adipose tissue; yellow, non-visceral adipose tissue.
Anti-TNF trough concentration level analysis
Intravenous injections of 5 mg/kg were initially administered at weeks 0, 2, and 6, followed by IFX (5 mg/kg) every 8 weeks. According to the results of therapeutic drug monitoring (TDM) at 6 months, for patients in remission, we will maintain the original regimen; for patients in the active stage, we will provide suggestions according to the guidelines and combine the patient’s wishes in the follow-up treatment for maintenance treatment, a combination of immunomodulator, or a replacement of drug regimens. There is no dosing optimization of IFX performed because the effect of dose optimization after IFX failure is controversial, and some studies do not support dose optimization after TDM. Trough concentrations of IFX and the serum TNF-α concentrations were collected for the final statistical analysis at the time of the 6-month review. We performed proactive TDM, but some patients refused to test; thus, some data on concentration levels were incomplete. The drug concentration was monitored in 92 patients (52 measured proactively and 40 measured reactively), including 26 individuals in the L1-VATL group (17 measured proactively and 9 measured reactively), 16 individuals in the L1-VATH group (7 measured proactively and 9 measured reactively), 36 individuals in the L2 + L3-VATL group (20 measured proactively and 16 measured reactively), and 14 individuals in the L2 + L3-VATH group (8 measured proactively and 6 measured reactively). Immunochromatography (Suzhou Herui Biotechnology, Suzhou, China) was used to detect the trough concentration of IFX and concentration of IFX antibody, while chemiluminescence (Siemens, Erlangen, Germany) was used to detect the serum TNF-α levels.
Statistical analysis
IBM SPSS version 22.0 (IBM Corporation, Armonk, NY, USA) was used to analyse the recorded data, where continuous variables were displayed as mean ± standard deviation (normal) or median and interquartile (non-normal). Efficacy was analysed using the Pearson chi-square test. First, the four-group overall chi-square test was performed. Paired chi-square analyses were performed when colonic lesions were involved, high visceral obesity was controlled, and Spearman correlation analyses were performed for VAT and efficacy in L1 patients. Subsequently, serum TNF-α concentrations and IFX serum trough concentrations were analysed. First, the overall Kruskal–Wallis test for the four groups was performed. When the involved colonic lesions were controlled, and high visceral obesity remained unchanged, paired Mann–Whitney tests were implemented separately, and Pearson correlation analyses were performed for L1 patients. A p-value < 0.05 indicates a statistically significant difference. For the chi-square test, a p-value < 0.0125 (
Results
Patients and demographics
A total of 140 CD patients were enrolled, including 92 men (65.7%) and 48 women (34.3%). On average, the age of patients was 28.8 ± 10.2 years, the CDAI score was 135.6 ± 74.0, and disease duration was 4.4 ± 3.4 years. In the L1-VATL group, there were 42 cases (30.0%): 29 men (20.7%) and 13 women (9.3%), with an average CDAI score of 242.8 ± 50.1 and disease duration of 4.6 ± 3.3 years. In the L1-VATH group, there were 19 cases (13.6%): 13 men (9.3%) and 6 women (4.3%), with an average CDAI score of 239.7 ± 27.5 and disease duration of 3.7 ± 3.2 years. In the L2 + L3-VATL group, there were 52 cases (37.1%): 36 men (25.7%) and 16 women (11.4%), with an average CDAI score of 234.6 ± 41.7 and disease duration of 4.9 ± 3.7 years. In the L2 + L3-VATH group, there were 27 cases (19.3%): 14 men (10.0%) and 13 women (9.3%), with an average CDAI score of 247.5 ± 52.9 and disease duration of 3.7 ± 3.0 years. There were no statistical differences in the demographic and disease characteristics of the groups (Table 1).
Demographic and disease characteristics of all enrolled patients.

Age collected for data analysis refers to the patient’s age when he or she was first diagnosed with Crohn’s disease.
B1 – non-stricturing, non-penetrating; B2 – stricturing; B3 – penetrating.
ALB, albumin; CRP, C-reactive protein; ESR, erythrocyte sedimentation rate.
Analysis of efficacy at 6 and 12 months
We found a significant difference in the overall efficacy of the four groups at 6 months (p = 0.041) and at 12 months (p = 0.036). In the 6-month efficacy group, there was a significant difference between L1-VATL and L1-VATH (73.8% versus 36.8%, p = 0.006). However, the differences between L2 + L3-VATL and L2 + L3-VATH (59.6% versus 51.8%, p = 0.509), L1-VATL and L2 + L3-VATL (73.8% versus 59.6%, p = 0.149), and L1-VATH and L2 + L3-VATH (36.8% versus 51.8%, p = 0.314) were not statistically significant. The 12-month efficacy group showed a significant difference between L1-VATL and L1-VATH (81.0% versus 47.4%, p = 0.008). However, those of L2 + L3-VATL and L2 + L3-VATH (61.5% versus 55.6%, p = 0.607), L1-VATL and L2 + L3-VATL (81.0% versus 61.5%, p = 0.041), and L1-VATH and L2 + L3-VATH (47.4% versus 55.6%, p = 0.584) were not statistically significant. The efficacy at 6 months was consistent with that at 12 months, indicating that the level of VAT had a significant impact on the efficacy of IFX therapy in L1 patients (Figure 3). In Spearman’s correlation analysis, there was a negative correlation between VAT and the efficacy of IFX treatment at 12 months (p′ < 0.001, R = −0.541).
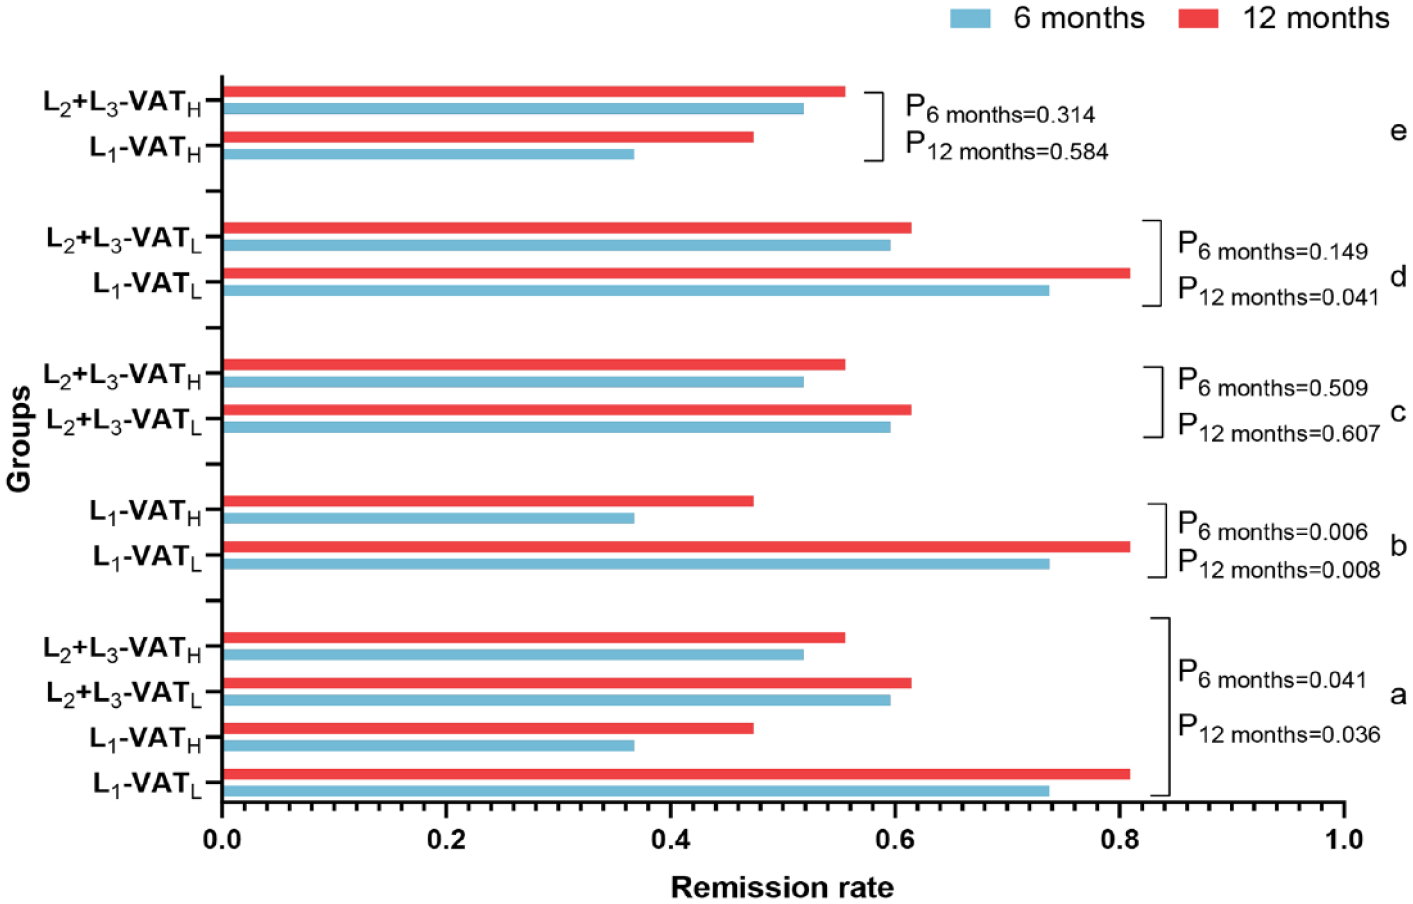
Analysis of efficacy at 6 and 12 months. (a) The overall chi-square analysis was performed on the efficacy of the four groups at 6 and 12 months, respectively. (b) The chi-square analysis was performed on the efficacy of L1-VATL and L1-VATH at 6 and 12 months, respectively. (c) The chi-square analysis was performed on the efficacy of L2 + L3-VATL and L2 + L3-VATH at 6 and 12 months, respectively. (d) The chi-square analysis was performed on the efficacy of L1-VATL and L2 + L3-VATL at 6 and 12 months, respectively. (e) The chi-square analysis was performed on the efficacy of L1-VATL and L2 + L3-VATH at 6 and 12 months.
In binary logistic regression analysis, the group with low visceral fat was more likely to achieve remission at 6 months than the group with high visceral fat adjusted odds ratio (aOR), 2.295; 95% CI, 1.116–4.721; p = 0.024), whereas there was no significant difference between location factor and disease remission (95% CI, 0.611–2.460; p = 0.566). Similarly, at 12 months, the group with low visceral fat was more likely to achieve remission than the group with high visceral fat (aOR, 2.147; 95% CI, 1.032–4.468; p = 0.041), but there was no significant difference between location factors and disease remission (95% CI, 0.75–3.315; p = 0.195).
Outcome analysis of serum TNF-α concentrations
We monitored the serum TNF-α concentrations in four groups of patients treated with IFX. The results showed that the general concentrations in the four groups were significantly different (p = 0.003). In the concentration analysis, there were significant differences between L1-VATL and L1-VATH (59.5 pg/mL versus 236.0 pg/mL, p = 0.006) and L1-VATH and L2 + L3-VATH (236.0 pg/mL versus 118.6 pg/mL, p = 0.031). However, there were no significant differences between L2 + L3-VATL and L2 + L3-VATH (78.7 pg/mL versus 118.6 pg/mL, p = 0.320) and L1-VATL and L2 + L3-VATL (59.5 pg/mL versus 78.7 pg/mL, p = 1.000). The analysis of serum TNF-α concentrations indicated that in L1 patients, the level of VAT has a reasonably large effect on serum TNF-α concentrations. Furthermore, there was a positive correlation between serum TNF-α concentrations and the VAT values of patients (p′ < 0.001, R = 0.572). In patients with high VAT, the presence or absence of colonic involvement greatly affected serum TNF-α concentrations. Serum TNF-α concentrations were relatively high in L1 patients compared to L2 and L3 patients (Figure 4).

Outcome analysis of serum TNF-α concentrations. (a) The overall Kruskal–Wallis test was performed on serum TNF-α concentration at 6 and 12 months in four groups. (b) The Mann–Whitney test was performed on L1-VATL and L1-VATH at 6 months and the serum TNF-α concentration, respectively. (c) The Mann–Whitney test was performed on L2 + L3-VATL and L2 + L3-VATH at 6 months and the serum TNF-α concentration at 12 months, respectively. (d) The Mann–Whitney test was performed on L1-VATL and L2 + L3-VATL at 6 months and the serum TNF-α concentration at 12 months, respectively. (e) The Mann–Whitney test was performed on the L1-VATH and L2 + L3-VATH at 6 months and the serum TNF-α concentration at 12 months. (f) Pearson correlation analysis was performed on visceral adiposity and serum TNF-α concentrations in L1 patients.
Outcome analysis of IFX serum trough concentrations
We monitored the IFX serum trough concentrations in four groups of IFX-treated patients. The results showed a significant difference in efficacy between the four groups (p = 0.001). In the concentration analysis, there were significant differences between L1-VATL and L1-VATH (10.0 μg/mL versus 0.4 μg/mL, p < 0.001) and L1-VATH and L2 + L3-VATH (0.4 μg/mL versus 6.40 μg/mL, p = 0.017). However, there was no significant difference between L2 + L3-VATL and L2 + L3-VATH (6.55 μg/mL versus 6.40 μg/mL, p = 0.420), and L1-VATL and L2 + L3-VATL (10.0 μg/mL versus 6.55 μg/mL, p = 0.636). The IFX serum trough concentration analysis demonstrated that the VAT level would significantly affect IFX serum trough concentration in L1 patients. Furthermore, there was a negative correlation between IFX serum trough concentrations and patients’ VAT values (p′ < 0.001, R = −0.806). In patients with visceral obesity (i.e. high VAT), the presence or absence of colonic involvement would significantly impact IFX serum trough concentrations. L1 patients had lower IFX serum trough concentrations, and L2 and L3 patients had higher serum trough concentrations (Figure 5).

Outcome analysis of IFX serum trough concentrations. (a) The overall Kruskal–Wallis test was performed on the IFX serum trough concentration at 6 and 12 months in the four groups. (b) The Mann–Whitney test was performed on the IFX serum trough concentration in L1-VATL and L1-VATH at 6 and 12 months, respectively. (c) The Mann–Whitney test was performed on the IFX serum trough concentrations in L2 + L3-VATL and L2 + L3-VATH at 6 and 12 months, respectively. (d) The Mann–Whitney test was performed on the IFX serum trough concentrations in L1-VATL and L2 + L3-VATH at 6 and 12 months, respectively. (e) The Mann–Whitney test was performed on the serum trough concentrations in L1-VATL and L2 + L3-VATH at 6 and 12 months, respectively. (f) Pearson correlation analysis was performed on visceral adiposity and IFX serum trough concentrations in L1 patients.
Outcome analysis of antibodies in response to IFX
We monitored the levels of serum antibodies in response to IFX concentrations in four groups. The results showed no significant difference in efficacy between the four groups (p = 0.822). In addition, there was no linear correlation between the serum antibody responses to IFX and the VAT values of L1 patients (p = 0.584, R = 0.087), and the serum antibody responses to IFX and the VAT values of L2 + L3 patients (p = 0.409, R = −0.119).
Outcome analysis of ROC curves
Since we found that VAT levels predicted the efficacy of IFX therapy in L1 CD patients, we performed a ROC curve analysis of VAT in L1 patients to determine the critical VAT value that could distinguish between good and poor efficacy. The results showed that in L1 patients, VAT = 103.40 cm2 was the threshold value to distinguish the efficacy of IFX therapy. A value higher than the threshold value indicates poor efficacy, and a lower threshold value indicates good efficacy. The AUC was 0.842, with a sensitivity of 94.4% and specificity of 67.4% (95% CI, 0.745–0.940) (Figure 6). The Youden index was used in the ROC analysis. The Youden index was found to be 0.618, the positive predictive value was 0.743, and the negative predictive value was 0.923.

Receiver operating characteristic curve analysis of visceral adipose tissue in L1 patients.
Discussion
The phenomenon of VAT hyperplasia in the mesentery of CD patients is called the ‘creeping fat symptom’, a characteristic change of CD. 12 Histopathological examination of VAT in CD patients reveals tissue fibrosis, perivascular inflammation, lymphatic thickening, stromal cell infiltration, chronic inflammation around nerves, and small adipocytes. 13 Currently, many studies are examining VAT as an indicator of disease severity and prognosis. High VAT values are associated with phenotypic complexity and poor CD prognosis. However, some study conclusions have been contradictory.14–19 Compared to magnetic resonance imaging (MRI), CT is less likely to be affected by breathing artefacts. Moreover, most MRI systems have 60 cm bores, which may not be suitable for severely obese individuals20,21; therefore, we chose CT to measure VAT instead of MRI. This is the first study to focus on VAT predicting the efficacy of IFX treatment on different CD locations.
Different cohort studies have shown that the overall efficacy of IFX for colonic disease is superior to ileal or ileocolonic diseases. 8 Several studies have shown that CD patients with solitary colonic disease respond better to anti-TNF-α therapy (especially IFX), while the efficacy tends to be poorer in isolated ileal disease. This observation could be explained by the fact that some ileal stricture diseases may be associated with an initial loss of response to IFX. 22 Therefore, the experimental design divided CD patients into L1 and L2 + L3 groups. At 6 and 12 months of efficacy monitoring, VAT predicted the efficacy of IFX in CD patients in the L1 group. A high VAT value was related to efficacy, whereas, in the L2 + L3 group, VAT did not predict the associated efficacy. This indicates that the presence or absence of colonic involvement may influence the prediction of efficacy in CD patients.
However, analysis of TNF concentrations and serum trough concentrations in patients with high VAT revealed that the presence or absence of colonic involvement was significantly associated with efficacy. In contrast, no significant correlation was found in patients with low VAT. Studies have shown that TH17 cells are abundant in the healthy large and small intestines but are mainly induced by IL-6 and IL-23 in the ileum.23–25 Cytokines generated by TH17 cells include IL-17 and IL-21, which induce the production of the proinflammatory mediator TNF. VAT may be a valid predictor of IFX efficacy in the L1 group but not in the L2 + L3 group. Moreover, adipocytes in the VAT of CD patients are the main source of TNF-α; compared to healthy controls, CD patients exhibited a significantly higher TNF-α expression level than in VAT, 12 and high serum TNF-α concentrations often correspond to low IFX serum trough concentrations. Thus, colonic involvement in patients with high VAT may be a valid predictor of serum TNF-α and IFX serum trough concentrations. However, patients with low VAT do not have the same predictive reliability.
The trough concentration is the lowest point of drug concentration before the next dose, also known as the lowest effective drug concentration. Relatively low IFX serum trough concentrations are strongly associated with loss of response to IFX therapy, regardless of whether antibodies to infliximab (ATI) is produced. The decrease in IFX serum trough concentrations is believed to be primarily due to accelerated IFX clearance. In treating IBD, IFX serum trough concentrations above 3 μg/mL may effectively control the disease. If the IFX serum trough concentration is below 3 μg/mL, it will increase the risk of developing ATI. 26 If the IFX drug concentration is too low, it will not be able to inhibit TNF-α activity. In the SONIC trial, the IFX serum concentration threshold for CD patients in remission at 30 weeks was calculated to be 3 μg/mL. The low IFX serum trough concentration required to maintain the remission state of patients exceeded 3 μg/mL, which is a crucial determinant of clinical response and mucosal healing at 26 weeks. 27 The American Gastroenterological Association TDM for IBD implies that the threshold of IFX serum concentration should be 5 μg/mL. 28 In the experimental results, the trough concentration of IFX in the L1-VATH group was 0.4 μg/mL (IQ1–IQ3, 0.4–1.6 μg/mL), which is below the threshold of IFX serum trough concentration, indicating a poor therapeutic effect. L1-VATL = 10 μg/mL (IQ1–IQ3, 4.4–14.3 μg/mL), L2 + L3-VATL = 6.6 μg/mL (IQ1–IQ3, 1.3–17.9 μg/mL), and L2 + L3-VATH = 6.4 μg/mL (IQ1–IQ3, 0.4–14.0 μg/mL) were above the IFX serum trough concentration threshold, suggesting a better prognosis. A negative correlation was found between VAT volume and low IFX trough concentration levels. 29 L1-VATL and L1-VATH, L2 + L3-VATL, and L2 + L3-VATH all showed that high VAT values corresponded to low IFX serum trough concentrations, corroborating this conclusion.
There are two innovative aspects of this study. First, this study was conducted in patients with CD, whereas previous studies only explored the predictive value of VAT on the efficacy of IFX therapy in IBD 29 ; furthermore, CD patients were subdivided into colon-involved and colon-uninvolved groups according to the lesion site in our study. In this study, we also investigated the VAT value as a predictor of the therapeutic efficacy of IFX therapy in CD patients by lesion site. Second, we performed a correlation analysis between IFX serum trough and serum TNF-α concentrations and compared IFX serum trough concentrations and the associated cut-off values to make them more clinically relevant for guidance.
However, this study also has some limitations. First, there was data bias because this study was a retrospective study with a small sample. In addition, the proactive TDM was refused by some patients, resulting in missing data for serum TNF-α and IFX serum trough concentrations. Second, the number of isolated patients with colonic-type CD was so small that they could only be divided into colon-involved and colon-uninvolved groups. Third, the patients were mainly concentrated in Hunan Province, China. Therefore, the results of this study may not apply to every patient group.
Conclusion
The results suggest that the lesion site and the high VAT of CD patients affect the clinical efficacy of IFX therapy to some extent. In L1 patients, high VAT was associated with poor IFX therapy response, and the serum concentrations of TNF-α were positively correlated with VAT values, whereas IFX serum trough concentrations were negatively correlated with VAT values. Patients with high VAT values had higher serum TNF-α concentrations and lower IFX serum trough concentrations than patients in L2 and L3. In L1 patients, the critical VAT value (VAT = 103 cm2) was obtained from the ROC curve. Based on these data, we can more accurately predict the efficacy of IFX therapy in patients with different lesion locations and develop a more appropriate treatment plan for patients with poor prognoses to prevent further disease progression. If tested by prospective trials, VAT would be a potential radiological marker that could inform treatment decisions for patients with specific types of CD.