
Abstract
Background:
Heart failure (HF) is the most common cardiovascular diseases and the leading cause of cardiovascular diseases related deaths. Increasing molecular targets have been discovered for HF prognosis and therapy. However, there is still an urgent need to identify novel biomarkers. Therefore, we evaluated biomarkers that might aid the diagnosis and treatment of HF.
Methods:
We searched next-generation sequencing (NGS) dataset (GSE161472) and identified differentially expressed genes (DEGs) by comparing 47 HF samples and 37 normal control samples using limma in R package. Gene ontology (GO) and pathway enrichment analyses of the DEGs were performed using the g: Profiler database. The protein–protein interaction (PPI) network was plotted with Human Integrated Protein–Protein Interaction rEference (HiPPIE) and visualized using Cytoscape. Module analysis of the PPI network was done using PEWCC1. Then, miRNA-hub gene regulatory network and TF-hub gene regulatory network were constructed by Cytoscape software. Finally, we performed receiver operating characteristic (ROC) curve analysis to predict the diagnostic effectiveness of the hub genes.
Results:
A total of 930 DEGs, 464 upregulated genes and 466 downregulated genes, were identified in HF. GO and REACTOME pathway enrichment results showed that DEGs mainly enriched in localization, small molecule metabolic process, SARS-CoV infections, and the citric acid tricarboxylic acid (TCA) cycle and respiratory electron transport. After combining the results of the PPI network miRNA-hub gene regulatory network and TF-hub gene regulatory network, 10 hub genes were selected, including heat shock protein 90 alpha family class A member 1 (HSP90AA1), arrestin beta 2 (ARRB2), myosin heavy chain 9 (MYH9), heat shock protein 90 alpha family class B member 1 (HSP90AB1), filamin A (FLNA), epidermal growth factor receptor (EGFR), phosphoinositide-3-kinase regulatory subunit 1 (PIK3R1), cullin 4A (CUL4A), YEATS domain containing 4 (YEATS4), and lysine acetyltransferase 2B (KAT2B).
Conclusions:
This discovery-driven study might be useful to provide a novel insight into the diagnosis and treatment of HF. However, more experiments are needed in the future to investigate the functional roles of these genes in HF.
Keywords
Introduction
Heart failure (HF) is one of the chronic cardiovascular diseases, affecting 1% to 2% of the adult population worldwide. 1 HF is said to be heart muscle does not pump blood and is linked with a high risk of mortality. 2 Diabetes mellitus, 3 hypertension, 4 obesity, 5 genetics, 6 environmental factors, 7 immunity, 8 inflammation, 8 and oxidative stress 8 were the risk factors for HF. However, the molecular mechanism underlying many HF cases remains unclear, resulting in a lack of effective treatment.9,10 Due to high mortality in HF, revealing the causes and the underlying molecular mechanisms, discovering novel biomarkers for early diagnosis, prevention, and personalized therapy, is essential and highly demanded.
Genetics and epigenetics have significantly contributed to our understanding of HF; the effects of genetics and epigenetics on the advancement and progression on HF are not so well understood. Epigenetics and genetics include deoxyribonucleic acid (DNA) methylation, DNA hydroxymethylation, histone modification, miRNAs, naturally occurring variants, missense mutation, nonsense mutation, and chromosomal abrasion are responsible for progression of HF.11,12 Understanding the status of various genes and signaling pathway in early diagnosis of HF could improve the effect of initial treatment. Accumulating evidence has demonstrated that abnormal expression of COL1A1, 13 CXCL14, 14 MECP2, 15 RBM20, 16 and PGC-1 17 is involved in the progression of HF. Signaling pathway including Wnt signaling pathway, 18 TGF‑β1/Smad3 signaling pathway, 19 AT1-CARP signaling pathway, 20 Akt signaling pathway, 21 and neuregulin-1/ErbB signaling 22 plays key role in progression of HF. However, there is still a large amount of bioinformatics data related to HF to be explored.
Next-generation sequencing (NGS) technology plays a crucial role in the analysis of gene expression, which served as essential tool in cardiovascular research with clinical application. 23 Recently, a large number of gene expression profiling studies have been reported with the use of NGS technology. The integrated bioinformatics analysis will be more positive and provide valuable novel molecular targets to foster the advancement of specific diagnosis and new therapeutic strategies. The aim of current investigation was to characterize the differentially expressed genes (DEGs) in NGS HF dataset and identify more genes with prognostic value.
Here, we analyzed the NGS HF dataset (GSE161472) 24 that was downloaded from the Gene Expression Omnibus (GEO) database (http://www.ncbi.nlm.nih.gov/geo/) 25 and performed the identification of DEGs between the HF and the normal control samples. Afterward, gene ontology (GO) terms and REACTOME pathways associated with DEGs were explored to elucidate the gene enrichment in HF. We established protein–protein interaction (PPI) network and then applied PEWCC1 for additional analysis of the DEGs which would identify some hub genes in modules. After evaluating the clinical prognosis of these hub genes and their miRNA-hub gene regulatory network and TF-hub gene regulatory network, we further validated these hub genes by ROC curve (ROC) analysis. The workflow chart is shown in Supplementary Figure S1. Our findings provided novel key genes involved in the progression of HF.
Material and methods
Data resources
This study investigated DEGs in HF versus normal samples by analyzing GSE161472 NGS dataset downloaded from the GEO database. GEO serves as a public repository for NGS data. NGS data were generated with the GPL11154 Illumina HiSeq 2000 (Homo sapiens). The GSE161472 dataset included 84 samples, containing 47 HF samples and 37 normal control samples.
Identification of DEGs
The analysis of screening DEGs between HF and normal control samples was analyzed by limma in R package. 26 Moreover, the threshold for the DEGs was set as p < 0 .05, and|log2foldchange (FC)| > 0.22 for upregulated genes and|log2FC| < −0.18 for downregulated genes. DEGs to use moderated t-test also known as empirical Bayes t-test are used to identify genes that are differentially expressed between two groups of samples, such as HF and control groups, and the Benjamini–Hochberg (BH) method can be used to control the false discovery rate (FDR) of the test statistics when analyzing and selecting statistically significant differentially expressed upregulated and downregulated genes. The heat map and volcano plot of the DEGs were plotted using gplots and ggplot2, respectively.
GO and REACTOME pathway enrichment analysis of DEGs
The GO enrichment analysis is concept for describing the functions of various gene products from all organisms. The GO terms (http://www.geneontology.org) database primarily adds three categories: biological process (BP), cellular component (CC), and molecular function (MF). 27 Pathway enrichment analysis is for exploring functions of various genes and identifying disease risk pathways. The REACTOME pathway (https://reactome.org/) 28 database compiles genomic, chemical, and systematic functional information. The g: Profiler (http://biit.cs.ut.ee/gprofiler/) 29 online tool implements methods to analyze and anticipate functional profiles of gene and gene clusters. In this investigation, Gene Set Enrichment Analysis (GSEA) uses a statistical test called the ‘rank-based gene set test’ to determine whether a gene set is enriched in a particular input gene set. The test is based on comparing the ranks of the genes in the gene set with the ranks of all other genes in the gene set, and it uses a modified version of the Kolmogorov–Smirnov statistic to calculate the significance of the enrichment. In addition, GSEA also uses a normalization procedure to adjust for the size of the gene set, and it uses a permutation-based method to calculate the FDR for the enrichment. GO terms and REACTOME pathways were analyzed using the g: Profiler with the enrichment threshold of p < 0.05.
Construction of the PPI network and module analysis
PPI are important to almost every process in a various cell types, so understanding PPIs is essential for understanding molecular cell physiology in normal and disease states. The Human Integrated Protein–Protein Interaction rEference (HiPPIE) interactome (http://cbdm-01.zdv.uni-mainz.de/~mschaefer/hippie/) 30 database provides a significant association of PPI. Cytoscape 3.8.2 (http://www.cytoscape.org/) 31 is used for the visual exploration of interaction networks. In this investigation, DEGs PPI networks were analyzed by the HiPPIE database and subsequently visualized by using Cytoscape. In a PPI network, nodes mean proteins, and edges mean interactions. In addition, the node degree, 32 betweenness centrality, 33 stress centrality, 34 and closeness centrality 35 of each protein node in the PPI network were calculated using plug-in Network Analyzer of the Cytoscape software. Nodes with the highest node degree, betweenness centrality, stress centrality, and closeness centrality score are considered as hub node. PEWCC (http://apps.cytoscape.org/apps/PEWCC) 36 plug-in of the Cytoscape software was then used to screen out modules of PPI networks, and the degree cutoff = 2, node score cutoff = 0.2, k-core = 2, and max depth = 100.
MiRNA-hub gene regulatory network construction
MiRNA-hub gene regulatory network is essential for controlling expression of crucial genes in development of various diseases. The miRNet database (https://www.mirnet.ca/), 37 a web biological database for prediction of known and unknown miRNA and hub genes relationships, was used to construct the miRNA-hub gene regulatory network, which was visualized in Cytoscape 3.8.2. 31 In a MiRNA-hub gene regulatory network, nodes mean miRNAs and hub genes, and edges mean interactions.
TF-hub gene regulatory network construction
TF-hub gene regulatory network analysis is useful to analyze the interactions between hub genes and TF which might provide novel insights into the mechanisms of generation or development of various diseases. NetworkAnalyst database (https://www.networkanalyst.ca/) 38 and Cytoscape 3.8.2 31 software were used to build the TF-hub gene regulatory network. In a TF-hub gene regulatory network, nodes mean TFs and hub genes, and edges mean interactions.
Validation of hub genes by ROC analysis
Then, ROC curve analysis was implemented to calculate the sensitivity (true positive rate) and specificity (true negative rate) of the hub genes for HF diagnosis, and we investigated how large the area under the curve (AUC) was by using pROC package in R statistical software. 39 The diagnostic values of the hub genes were predicted based on the ROC curve analysis.
Results
Identification of DEGs
NGS dataset GSE161472 was downloaded from the GEO database and analyzed using R packages (limma). Volcano plot was constructed to visualize fold changes of the DEGs (Supplementary Figure S2). As shown in Supplementary Table S1, a total of 930 DEGs were identified in GSE161472, among which a total of 464 were upregulated genes and 466 were downregulated genes. A total of 930 DEGs between HF and normal control were screened by limma package (as p < 0 .05, and|log2FC| > 0.22 for upregulated genes and|log2FC| < −0.18 for downregulated genes) as shown in the heat map (Supplementary Figure S3). Top 10 upregulated and 10 downregulated genes are given in Table 1.
The statistical metrics for key DEGs.

RNA, ribonucleic acid.
GO and REACTOME pathway enrichment analysis of DEGs
The top 930 DEGs were chosen to perform GO term and REACTOME pathway analyses. The DEGs were significantly enriched in the BP: localization, organic substance transport, small molecule metabolic process, and cellular metabolic process. The DEGs were significantly enriched in the CC: cytoplasm, membrane, intracellular anatomical structure, and organelle lumen. The DEGs were significantly enriched in the MF: protein binding, enzyme binding, catalytic activity, and nucleoside phosphate binding. The GO enrichment of upregulated and downregulated genes is shown in Supplementary Table S2. Moreover, REACTOME pathway enrichment analysis indicated that the DEGs were involved in SARS-CoV infections, asparagine N-linked glycosylation, the citric acid (tricarboxalic acid(TCA)) cycle, and respiratory electron transport, and respiratory electron transport was mostly associated with these genes. The pathway enrichment analysis of upregulated and downregulated genes is shown in Supplementary Table S3.
Construction of the PPI network and module analysis
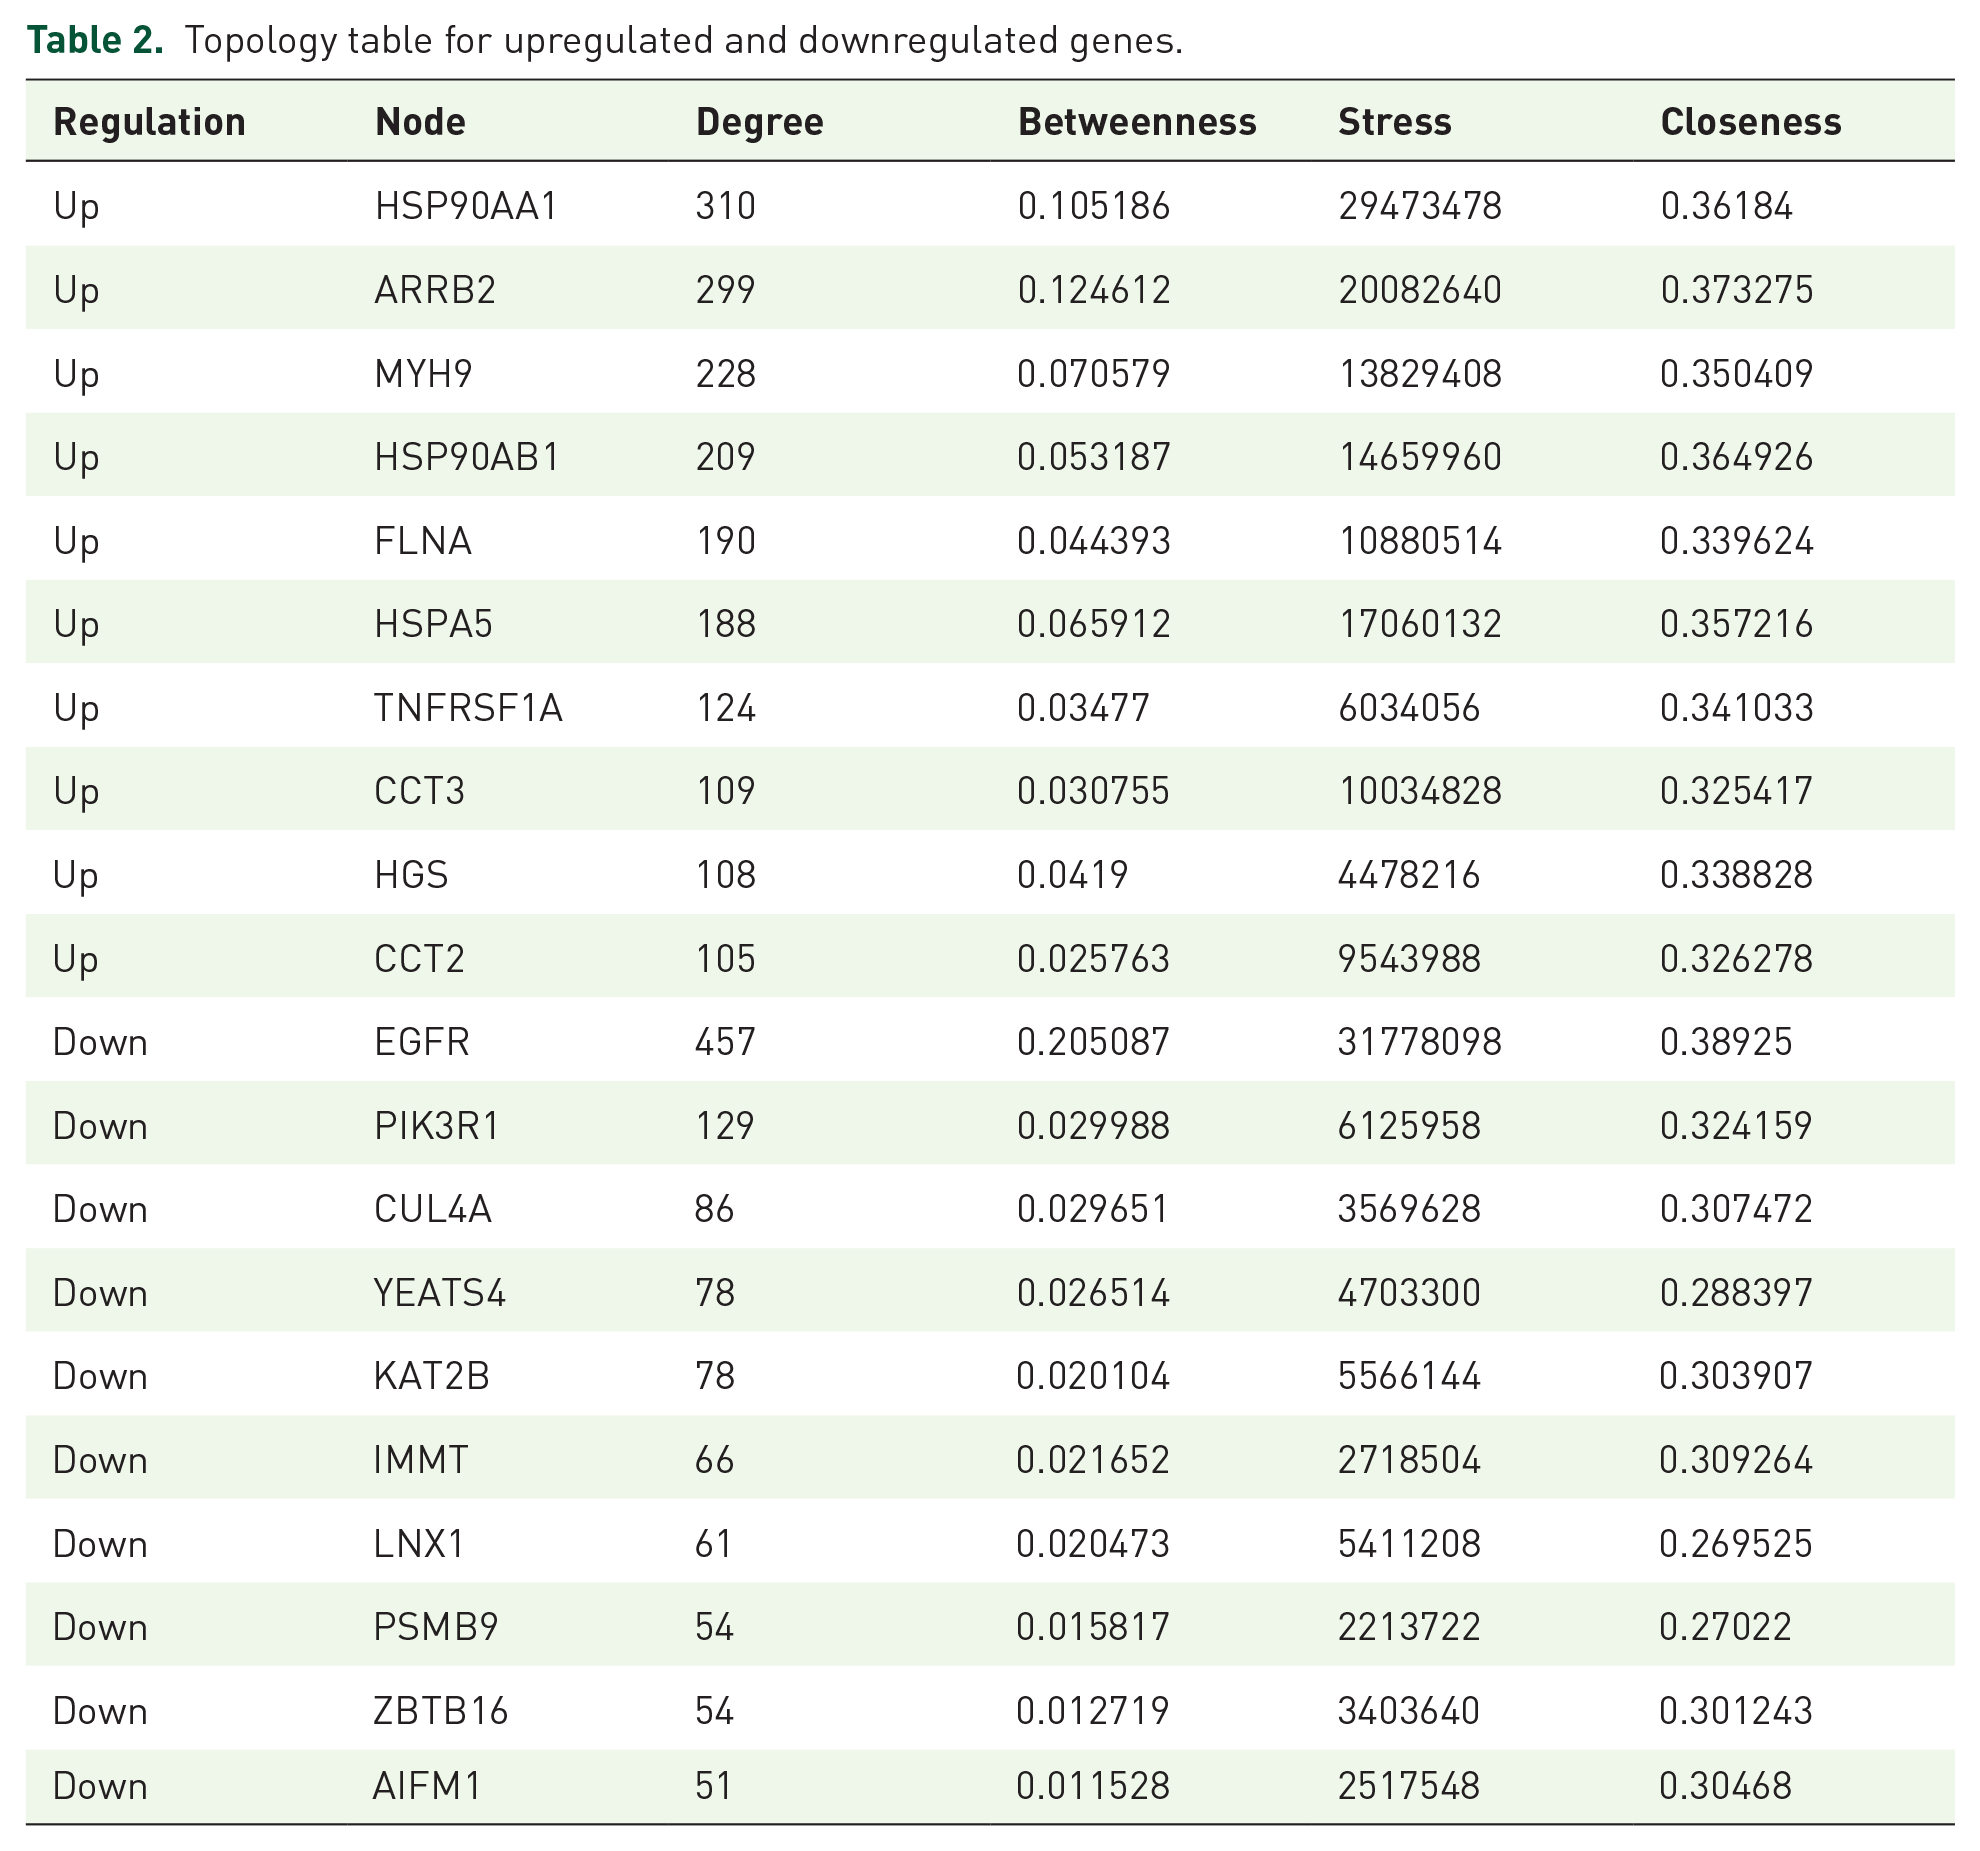
Using Cytoscape, a HIPPIE interactome database was used to establish a PPI network of these DEGs, with 4194 nodes and 8352 edges (Supplementary Figure S4). Topological properties of hub genes are shown in Supplementary Table S4. The hub genes were obtained using the four centrality methods with the highest score, including HSP90AA1, ARRB2, MYH9, HSP90AB1, FLNA, EGFR, PIK3R1, CUL4A, YEATS4, and KAT2B. Top 10 upregulated and 10 downregulated hub genes are given in Table 2. A significant module was constructed from the PPI network of the DEGs using PEWCC1, including module 1 had 35 nodes and 124 edges (Supplementary Figure S5A) and module 2 had 14 nodes and 34 edges (Supplementary Figure S5B). Module 1 is enriched in SARS-CoV infections, disease, immune system, cytoplasm, neutrophil degranulation, protein binding, infectious disease, localization, and organic substance transport. Module 2 is enriched in the citric acid (Tricarboxalic acid (TCA)) cycle and respiratory electron transport, respiratory electron transport and metabolism.
Topology table for upregulated and downregulated genes.
MiRNA-hub gene regulatory network construction
According to the information in miRNet database and Cytoscape databases, the miRNA-hub gene regulatory network relationships of miRNA and hub genes were obtained. A total of 801 nodes (miRNA: 2223; Genes: 307) and 3301 edges were included in miRNA-hub gene regulatory network (Supplementary Figure S6). Topological properties of miRNAs are shown in Supplementary Table S5. After comparing the targets with hub genes, we found that MYH9 was the potential target of 226 miRNAs (e.g. hsa-mir-520e); tubulin beta class I (TUBB) was the potential target of 202 miRNAs (e.g. hsa-mir-8084); exportin 1 (XPO1) was the potential target of 198 miRNAs (e.g. hsa-mir-125a-5p); HSP90AA1 was the potential target of 188 miRNAs (e.g. hsa-mir-133a-3p); HSP90AB1 was the potential target of 162 miRNAs (e.g. hsa-mir-4801); PIK3R1 was the potential target of 131 miRNAs (e.g. hsa-mir-138-5p); nuclear receptor coactivator 2 (NCOA2) was the potential target of 114 miRNAs (e.g. hsa-mir-539-5p); EGFR was the potential target of 83 miRNAs (e.g. hsa-mir-132-3p); interferon-induced protein with tetratricopeptide repeats 3 (IFIT3) was the potential target of 78 miRNAs (e.g. hsa-mir-449a); proteasome 20 S subunit beta 9 (PSMB9) was the potential target of 68 miRNAs (e.g. hsa-mir-200c-5p).
TF-hub gene regulatory network construction
According to the information in NetworkAnalyst database and Cytoscape databases, the TF-hub gene regulatory network relationships of TF and hub genes were obtained. A total of 801 nodes (TF:509; Genes: 292) and 3301 edges were included in TF-hub gene regulatory network (Supplementary Figure S7). Topological properties of TFs are shown in Supplementary Table S5. After comparing the targets with hub genes, we found that HSP90AA1 was the potential target of 35 TFs (e.g. RUNX1 partner transcriptional co-repressor 1 (RUNX1 T1)); XPO1 was the potential target of 33 TFs (e.g. signal transducer and activator of transcription 1 (STAT1)); SWI/SNF-related, matrix-associated, actin-dependent regulator of chromatin, subfamily a, and member 4 (SMARCA4) was the potential target of 33 TFs [e.g. early growth response 1 (EGR1)]; heat shock protein family A (HSP70) member 5 (HSPA5) was the potential target of 22 TFs [e.g. (FosB proto-oncogene, AP-1 transcription factor subunit) (FOSB)]; ARRB2 was the potential target of 20 TFs [e.g. aryl hydrocarbon receptor nuclear translocator (ARNT)]; KAT2B was the potential target of 47 TFs [e.g. twist family bHLH transcription factor 1 (TWIST1)]; zinc finger and BTB domain containing 16 (ZBTB16) was the potential target of 39 TFs [e.g. GATA-binding protein 2 (GATA2)]; NCOA2 was the potential target of 34 TFs [e.g. aryl hydrocarbon receptor (AHR)]; PIK3R1 was the potential target of 34 TFs [e.g. general transcription factor IIH subunit 1 (GTF2 H1)]; EGFR was the potential target of 27 TFs [e.g. signal transducer and activator of transcription 5B (STAT5B)].
Validation of hub genes by ROC curve analysis
A ROC analysis was performed to evaluate the diagnostic value of hub genes. The AUCs for the 10 hub genes were HSP90AA1 (0.953), ARRB2 (0.941), MYH9 (0.976), HSP90AB1 (0.948), FLNA (0.931), EGFR (0.969), PIK3R1 (0.958), CUL4A (0.906), YEATS4 (0.912), and KAT2B (0.950), respectively (Supplementary Figure S8). These hub genes show good diagnostics values.
Discussion
Numerous basic and clinical investigation have been conducted to reveal the causes and underlying mechanisms of HF in the past several decades, but the incidence and mortality of HF are still very high in the globe. Bioinformatics analysis is progressively adopted to screen out biomarkers for diagnosis and treatment of HF. 40 In the present investigation, bioinformatics and NGS data analysis are promising methods to analyze the critical genes and pathways which were associated with HF.
In this investigation, we performed a series of bioinformatics analysis to screen key genes and pathways. The NGS data found that 464 upregulated genes and 466 downregulated genes were identified in HF samples compared with normal control samples. Genes include ZFP57 zinc finger protein (ZFP57) 41 and ankyrin 1 (ANK1) 42 expression has significant diagnosis value in diabetes mellitus patients and acts as potential targets for diabetes mellitus targeted therapy. Tenascin C (TNC) plays an important role in cardiac hypertrophy. 43 C-C motif chemokine ligand 2 (CCL2) was observed to be associated with the risk of myocardial infarction. 44 Genes include secreted phosphoprotein 1 (SPP1), 45 and immunoglobulin superfamily member 1 (IGSF1) 46 plays an important role in obesity. Kiczak et al. 47 found that TIMP (Tissue inhibitor of metalloproteases) metallopeptidase inhibitor 1 (TIMP1) might affect the prognosis of patients with HF.
GO and REACTOME pathway enrichment analyses were used to investigate the interactions of DEGs. Pathways include SARS-CoV infections, 48 asparagine N-linked glycosylation, 49 neutrophil degranulation, 50 immune system, 51 respiratory electron transport, 52 metabolism, 53 complex I biogenesis, 54 neddylation, 55 localization, 56 membrane, 57 protein binding, 58 and small molecule metabolic process 59 were responsible for progression of HF. Han et al., 60 Yamada et al., 61 Wang et al., 62 García-Manzanares et al., 63 Raitoharju et al., 64 King et al., 65 Hirokawa et al., 66 Kahali et al., 67 Kuhn et al. 68 , and Sun et al. 69 found that expression of 24-dehydrocholesterol reductase (DHCR24), syntaxin-binding protein 2 (STXBP2), C-type lectin domain containing 5A (CLEC5A), XPO1, ADAM metallopeptidase domain 8 (ADAM8), interferon regulatory factor 3 (IRF3), DOT1-like histone lysine methyltransferase (DOT1 L), protein phosphatase 1 regulatory subunit 3B (PPP1R3B), IFIT3, and proproteinconvertasesubtilisin/kexin type 6 (PCSK6) could induce myocardial infarction. Altered expression of genes includes cytochrome P450 family 1 subfamily B member 1 (CYP1B1), 70 solute carrier family 7 member 1 (SLC7A1), 71 MYH9, 72 linker for activation of T cells family member 2 (LAT2), 73 FXYD domain containing ion transport regulator 5 (FXYD5), 74 calcium/calmodulin-dependent protein kinase I (CAMK1), 75 transforming growth factor beta receptor 1 (TGFBR1), 76 HSP90AB1, 77 pleckstrin homology domain containing A7 (PLEKHA7), 78 angiotensin II receptor-associated protein (AGTRAP), 79 solute carrier family 16 member 9 (SLC16A9), 80 acyl-CoA dehydrogenase short/branched chain (ACADSB), 81 inositol monophosphatase 1 (IMPA1), 82 CD300 molecule-like family member g (CD300LG), 83 cold inducible RNA-binding protein (CIRBP), 84 PIK3R1, 85 YEATS4, 86 ubiquitin specific peptidase 2 (USP2), 87 neural precursor cell expressed, developmentally downregulated 9 (NEDD9), 88 coiled-coil-helix-coiled-coil-helix domain containing 5 (CHCHD5), 89 and endoplasmic reticulum aminopeptidase 1 (ERAP1) 90 might crucially contribute to the development of hypertension. Genes include heat shock protein family B (small) member 1 (HSPB1), 91 crystallin alpha B (CRYAB), 92 annexin A5 (ANXA5), 93 C-C motif chemokine receptor 2 (CCR2), 94 regulator of G protein signaling 4 (RGS4), 95 TNF receptor superfamily member 1A (TNFRSF1A), 96 X-box-binding protein 1 (XBP1), 97 NK2 homeobox 5 (NKX2-5), 98 neuraminidase 1 (NEU1), 99 glutathione S-transferase pi 1 (GSTP1), 100 catechol-O-methyltransferase (COMT), 101 LIM domain kinase 1 (LIMK1), 102 calcium/calmodulin-dependent protein kinase kinase 1 (CAMKK1), 103 CD276 molecule (CD276), 104 SMARCA4, 105 adenosine A2b receptor (ADORA2B), 106 acyl-CoA thioesterase 1 (ACOT1), 107 regucalcin (RGN), 108 inorganic pyrophosphatase 2 (PPA2), 109 KAT2B, 110 pyruvate dehydrogenase kinase 1 (PDK1), 111 citrate synthase (CS), 112 fibroblast growth factor 12 (FGF12), 113 aquaporin 4 (AQP4), 114 leiomodin 2 (LMOD2), 115 selenium-binding protein 1 (SELENBP1), 116 myoglobin (MB), 117 S100 calcium-binding protein A1 (S100A1), 118 ryanodine receptor 2 (RYR2), 119 glypican 5 (GPC5), 120 jumonji and AT-rich interaction domain containing 2 (JARID2), 121 EGFR, 122 FUN14 domain containing 1 (FUNDC1), 123 sphingosine-1-phosphate receptor 1 (S1PR1), 124 endothelial PAS domain protein 1 (EPAS1), 125 and oxysterol-binding protein-like 11 (OSBPL11) 126 played a critical role in HF. Genes include calreticulin (CALR), 127 BSCL2 lipid droplet biogenesis associated, seipin (BSCL2), 128 polycystin 1, transient receptor potential channel interacting (PKD1), 129 transmembrane BAX inhibitor motif containing 1 (TMBIM1), 130 carbohydrate sulfotransferase 15 (CHST15), 131 N-alpha-acetyltransferase 10, NatA catalytic subunit (NAA10), 132 transcription factor 3 (TCF3), 133 calponin 1 (CNN1), 134 TATA-box binding protein associated factor, RNA polymerase I subunit A (TAF1A), 135 acyl-CoA dehydrogenase family member 9 (ACAD9), 136 kelch-like family member 24 (KLHL24), 137 myomesin 2 (MYOM2), 138 tripartite motif containing 63 (TRIM63), 139 catenin alpha 3 (CTNNA3), 140 NLR family CARD domain containing 5 (NLRC5), 141 Kruppel-like factor 9 (KLF9), 142 myosin light chain kinase 3 (MYLK3), 143 RNA-binding motif protein 20 (RBM20), 144 glutathione S-transferase kappa 1 (GSTK1), 145 ubiquinol-cytochrome c reductase, Rieske iron-sulfur polypeptide 1 (UQCRFS1), 146 NADH: ubiquinoneoxidoreductase core subunit S2 (NDUFS2), 147 and cytochrome c oxidase subunit 6B1 (COX6B1) 148 have been reported to be positively correlated with cardiomyopathy. Genes include reticulon 4 (RTN4), 149 neutrophil cytosolic factor 2 (NCF2), 150 Rho GTPase activating protein 9 (ARHGAP9), 151 lipase G, endothelial type (LIPG), 152 BCL3 transcription coactivator (BCL3), 153 heparansulfate proteoglycan 2 (HSPG2), 154 apolipoprotein B receptor (APOBR), 155 integrin subunit alpha 2 (ITGA2), 156 peptidylprolylisomerase A (PPIA), 157 interleukin 1 receptor-associated kinase 1 (IRAK1), 158 vitamin K epoxide reductase complex subunit 1 (VKORC1), 159 renalase, FAD-dependent amine oxidase (RNLS), 160 major histocompatibility complex, class I, F (HLA-F), 161 F-box and leucine-rich repeat protein 17 (FBXL17), 149 collagen type XI alpha 2 chain (COL11A2), 162 and NADH: ubiquinoneoxidoreductase subunit C2 (NDUFC2) 163 are associated with prognosis of coronary heart disease. Genes include C-C motif chemokine receptor 1 (CCR1), 164 mesencephalic astrocyte-derived neurotrophic factor (MANF), 165 HSP90AA1, 166 ARRB2, 167 solute carrier family 39 member 13 (SLC39A13), 168 prolyl 4-hydroxylase subunit alpha 2 (P4HA2), 169 HECT domain E3 ubiquitin protein ligase 3 (HECTD3), 170 canopy FGF signaling regulator 2 (CNPY2), 171 enoyl-CoA hydratase domain containing 2 (ECHDC2), 172 NADH: ubiquinoneoxidoreductase subunit S4 (NDUFS4), 173 and inner membrane mitochondrial protein (IMMT) 174 plays an important role in the ischemic cardiac diseases. Genes include proliferation and apoptosis adaptor protein 15 (PEA15), 175 CD48 molecule (CD48), 176 ER degradation enhancing alpha-mannosidase-like protein 2 (EDEM2), 177 CD55 molecule (Cromer blood group) (CD55), 178 nuclear receptor co-repressor 2 (NCOR2), 179 exostosinglycosyltransferase 2 (EXT2), 180 sprouty related EVH1 domain containing 1 (SPRED1), 181 protein disulfideisomerase family A member 6 (PDIA6), 182 CD300e molecule (CD300E), 183 transcription factor 19 (TCF19), 184 abhydrolase domain containing 15 (ABHD15), 185 3-oxoacyl-ACP synthase, mitochondrial (OXSM), 186 microsomal glutathione S-transferase 3 (MGST3), 187 coenzyme Q7, hydroxylase (COQ7), 188 acyl-CoA synthetase long chain family member 5 (ACSL5), 189 ankyrin 1 (ANK1), 42 glycogen phosphorylase, muscle associated (PYGM), 190 F-box protein 40 (FBXO40), 191 solute carrier family 2 member 4 (SLC2A4), 192 major histocompatibility complex, class II, DO alpha (HLA-DOA), 193 transporter 2, ATP-binding cassette subfamily B member (TAP2), 194 major histocompatibility complex, class II, DP alpha 1 (HLA-DPA1), 195 NSE2 (MMS21) homolog, SMC5-SMC6 complex SUMO ligase (NSMCE2), 196 NDUFA4 mitochondrial complex associated (NDUFA4), 197 high mobility group 20A (HMG20A), 198 amylase alpha 2B (AMY2B), 199 and acylphosphatase 2 (ACYP2) 200 were identified as a candidate biomarkers for the diagnosis and treatment of diabetes mellitus. Genes include signal regulatory protein alpha (SIRPA), 201 profilin 1 (PFN1), 202 eukaryotic translation initiation factor 6 (EIF6), 203 aryl hydrocarbon receptor (AHR), 204 RUNX family transcription factor 1 (RUNX1), 205 indoleamine 2,3-dioxygenase 1 (IDO1), 206 pyruvate dehydrogenase E1 subunit beta (PDHB), 207 NADH: ubiquinoneoxidoreductase core subunit S1 (NDUFS1), 208 microtubule-associated scaffold protein 1 (MTUS1), 209 zinc finger protein 418 (ZNF418), 210 and myotubularin-related protein 14 (MTMR14) 211 were reported to be associated with the prognosis of cardiac hypertrophy. Chloride intracellular channel 1 (CLIC1), 212 actin-related protein 2/3 complex subunit 1B (ARPC1B), 213 FLNA, 214 hypoxia-inducible lipid droplet associated (HILPDA), 215 reticulon 3 (RTN3), 216 G0/G1 switch 2 (G0 S2), 217 calumenin (CALU), 218 myeloid-derived growth factor (MYDGF), 219 lymphotoxin beta receptor (LTBR), 220 gamma-glutamyl carboxylase (GGCX), 221 sterile alpha motif domain containing 1 (SAMD1), 222 acetyl-CoA acetyltransferase 1 (ACAT1), 223 nicotinamide nucleotide transhydrogenase (NNT), 224 and autophagy-related 14 (ATG14) 225 have been identified as a key genes in atherosclerosis. Genes include HSPA5, 226 neuromedin B (NMB), 227 elongatoracetyltransferase complex subunit 5 (ELP5), 228 neuroligin 2 (NLGN2), 229 RAB23, member RAS oncogene family (RAB23), 230 membrane bound O-acyltransferase domain containing 7 (MBOAT7), 231 centrosomal protein 19 (CEP19), 232 phosphofructokinase, platelet (PFKP), 233 transketolase (TKT), 234 prolyl 4-hydroxylase subunit beta (P4HB), 235 crystallin mu (CRYM), 236 aminomethyltransferase (AMT), 237 mono-ADP ribosylhydrolase 2 (MACROD2), 238 nudix hydrolase 3 (NUDT3), 239 dihydrolipoamide dehydrogenase (DLD), 240 NCOA2, 241 ZBTB16, 242 transcription factor A, mitochondrial (TFAM), 243 RAS protein activator-like 2 (RASAL2), 244 NADH: ubiquinoneoxidoreductase subunit B6 (NDUFB6), 245 helicase with zinc finger 2 (HELZ2) 246 , and CIITA (class II major histocompatibility complex transactivator) 247 are a potential prognostic markers in obesity. Genes include transforming growth factor beta 1 (TGFB1), 248 CD63 molecule (CD63), 249 disheveled-binding antagonist of beta catenin 1 (DACT1) 250 , and proteasome 20 S subunit beta 10 (PSMB10) 251 play an important role in the progression of atrial fibrillation. Genes include FAM20 C golgi associated secretory pathway kinase (FAM20 C) 252 and CD74 molecule (CD74) 253 participate in pathogenic processes of cardiac arrhythmia. Therefore, the identification of enriched genes in GO terms and pathway for the association in HF are of great interest and could facilitate therapeutic strategies.
To explore the pathogenesis of HF, we constructed PPI network and isolated modules from PPI network for systematic analysis. The genes in the PPI network and modules with higher score were the hub genes that affected the progression of HF. To the date, there are still no reports on the correlation between the genes of CLTA, RAI14, MPRIP, AP2A1, CUL4A, and NDUFA13 with HF.
To investigate the molecular mechanism of HF, miRNA-hub gene regulatory network and TF-hub gene regulatory network were constructed. Hsa-mir-125a-5p, 254 hsa-mir-539-5p 255 , and RUNX1 T1 256 have been proposed as biomarkers for obesity. Aberrant expression of hsa-mir-138-5p 257 and STAT1 258 is associated with HF. Previous studies have shown that Hsa-mir-200c-5p 259 and STAT5B 260 may influence the prognosis in diabetes mellitus. TFs including EGR1 261 and GATA2 262 have a significant prognostic potential in coronary heart disease. TFs including FOSB 263 and AHR 264 are molecular markers for the diagnosis and prognosis of ischemic cardiac diseases. Studies had shown that TWIST1 was associated with atherosclerosis. 265 We identified TUBB, PSMB9, hsa-mir-520e, hsa-mir-8084, hsa-mir-133a-3p, hsa-mir-4801, hsa-mir-132-3p, hsa-mir-449a, ARNT, and GTF2 H1 might serve as potential novel biomarkers for HF diagnosis and prognosis.
In summary, the present data provide a comprehensive bioinformatics analysis of DEGs that might be related to the progression of HF. We have identified 930 candidate DEGs with NGS data and integrated bioinformatics analyses. A variety of novel genes and signaling pathways might be associated in the pathogenesis of HF. We also conclude that HSP90AA1, ARRB2, MYH9, HSP90AB1, FLNA, EGFR, PIK3R1, CUL4A, YEATS4, and KAT2B might be associated with progression of HF. These findings could lead to a significant increase in our understanding of the etiology and underlying molecular events of DN.
Supplemental Material
sj-docx-10-tak-10.1177_17539447231168471 – Supplemental material for Identification of biomarkers, pathways, and potential therapeutic targets for heart failure using next-generation sequencing data and bioinformatics analysis
Supplemental material, sj-docx-10-tak-10.1177_17539447231168471 for Identification of biomarkers, pathways, and potential therapeutic targets for heart failure using next-generation sequencing data and bioinformatics analysis by Prashanth Ganekal, Basavaraj Vastrad, Chanabasayya Vastrad and Shivakumar Kotrashetti in Therapeutic Advances in Cardiovascular Disease
Supplemental Material
sj-docx-11-tak-10.1177_17539447231168471 – Supplemental material for Identification of biomarkers, pathways, and potential therapeutic targets for heart failure using next-generation sequencing data and bioinformatics analysis
Supplemental material, sj-docx-11-tak-10.1177_17539447231168471 for Identification of biomarkers, pathways, and potential therapeutic targets for heart failure using next-generation sequencing data and bioinformatics analysis by Prashanth Ganekal, Basavaraj Vastrad, Chanabasayya Vastrad and Shivakumar Kotrashetti in Therapeutic Advances in Cardiovascular Disease
Supplemental Material
sj-docx-9-tak-10.1177_17539447231168471 – Supplemental material for Identification of biomarkers, pathways, and potential therapeutic targets for heart failure using next-generation sequencing data and bioinformatics analysis
Supplemental material, sj-docx-9-tak-10.1177_17539447231168471 for Identification of biomarkers, pathways, and potential therapeutic targets for heart failure using next-generation sequencing data and bioinformatics analysis by Prashanth Ganekal, Basavaraj Vastrad, Chanabasayya Vastrad and Shivakumar Kotrashetti in Therapeutic Advances in Cardiovascular Disease
Supplemental Material
sj-jpeg-4-tak-10.1177_17539447231168471 – Supplemental material for Identification of biomarkers, pathways, and potential therapeutic targets for heart failure using next-generation sequencing data and bioinformatics analysis
Supplemental material, sj-jpeg-4-tak-10.1177_17539447231168471 for Identification of biomarkers, pathways, and potential therapeutic targets for heart failure using next-generation sequencing data and bioinformatics analysis by Prashanth Ganekal, Basavaraj Vastrad, Chanabasayya Vastrad and Shivakumar Kotrashetti in Therapeutic Advances in Cardiovascular Disease
Supplemental Material
sj-jpeg-6-tak-10.1177_17539447231168471 – Supplemental material for Identification of biomarkers, pathways, and potential therapeutic targets for heart failure using next-generation sequencing data and bioinformatics analysis
Supplemental material, sj-jpeg-6-tak-10.1177_17539447231168471 for Identification of biomarkers, pathways, and potential therapeutic targets for heart failure using next-generation sequencing data and bioinformatics analysis by Prashanth Ganekal, Basavaraj Vastrad, Chanabasayya Vastrad and Shivakumar Kotrashetti in Therapeutic Advances in Cardiovascular Disease
Supplemental Material
sj-jpeg-7-tak-10.1177_17539447231168471 – Supplemental material for Identification of biomarkers, pathways, and potential therapeutic targets for heart failure using next-generation sequencing data and bioinformatics analysis
Supplemental material, sj-jpeg-7-tak-10.1177_17539447231168471 for Identification of biomarkers, pathways, and potential therapeutic targets for heart failure using next-generation sequencing data and bioinformatics analysis by Prashanth Ganekal, Basavaraj Vastrad, Chanabasayya Vastrad and Shivakumar Kotrashetti in Therapeutic Advances in Cardiovascular Disease
Supplemental Material
sj-jpg-1-tak-10.1177_17539447231168471 – Supplemental material for Identification of biomarkers, pathways, and potential therapeutic targets for heart failure using next-generation sequencing data and bioinformatics analysis
Supplemental material, sj-jpg-1-tak-10.1177_17539447231168471 for Identification of biomarkers, pathways, and potential therapeutic targets for heart failure using next-generation sequencing data and bioinformatics analysis by Prashanth Ganekal, Basavaraj Vastrad, Chanabasayya Vastrad and Shivakumar Kotrashetti in Therapeutic Advances in Cardiovascular Disease
Supplemental Material
sj-jpg-2-tak-10.1177_17539447231168471 – Supplemental material for Identification of biomarkers, pathways, and potential therapeutic targets for heart failure using next-generation sequencing data and bioinformatics analysis
Supplemental material, sj-jpg-2-tak-10.1177_17539447231168471 for Identification of biomarkers, pathways, and potential therapeutic targets for heart failure using next-generation sequencing data and bioinformatics analysis by Prashanth Ganekal, Basavaraj Vastrad, Chanabasayya Vastrad and Shivakumar Kotrashetti in Therapeutic Advances in Cardiovascular Disease
Supplemental Material
sj-jpg-3-tak-10.1177_17539447231168471 – Supplemental material for Identification of biomarkers, pathways, and potential therapeutic targets for heart failure using next-generation sequencing data and bioinformatics analysis
Supplemental material, sj-jpg-3-tak-10.1177_17539447231168471 for Identification of biomarkers, pathways, and potential therapeutic targets for heart failure using next-generation sequencing data and bioinformatics analysis by Prashanth Ganekal, Basavaraj Vastrad, Chanabasayya Vastrad and Shivakumar Kotrashetti in Therapeutic Advances in Cardiovascular Disease
Supplemental Material
sj-jpg-5-tak-10.1177_17539447231168471 – Supplemental material for Identification of biomarkers, pathways, and potential therapeutic targets for heart failure using next-generation sequencing data and bioinformatics analysis
Supplemental material, sj-jpg-5-tak-10.1177_17539447231168471 for Identification of biomarkers, pathways, and potential therapeutic targets for heart failure using next-generation sequencing data and bioinformatics analysis by Prashanth Ganekal, Basavaraj Vastrad, Chanabasayya Vastrad and Shivakumar Kotrashetti in Therapeutic Advances in Cardiovascular Disease
Supplemental Material
sj-jpg-8-tak-10.1177_17539447231168471 – Supplemental material for Identification of biomarkers, pathways, and potential therapeutic targets for heart failure using next-generation sequencing data and bioinformatics analysis
Supplemental material, sj-jpg-8-tak-10.1177_17539447231168471 for Identification of biomarkers, pathways, and potential therapeutic targets for heart failure using next-generation sequencing data and bioinformatics analysis by Prashanth Ganekal, Basavaraj Vastrad, Chanabasayya Vastrad and Shivakumar Kotrashetti in Therapeutic Advances in Cardiovascular Disease
Footnotes
Acknowledgements
I thank Marina Stolina, Amgen Inc., Cardiometabolic Disorders, One Amgen Center Drive, Thousand Oaks, California, USA, very much, the author who deposited their profiling by high throughput sequencing dataset GSE161472, into the public GEO database.
Declarations
Supplemental material
Supplemental material for this article is available online.
References
Supplementary Material
Please find the following supplemental material available below.
For Open Access articles published under a Creative Commons License, all supplemental material carries the same license as the article it is associated with.
For non-Open Access articles published, all supplemental material carries a non-exclusive license, and permission requests for re-use of supplemental material or any part of supplemental material shall be sent directly to the copyright owner as specified in the copyright notice associated with the article.