
Abstract
Background:
The individualized PREdiction of DIsease Control using digital sensor Technology (iPREDICT) program was developed for asthma management using digital technology. Devices were integrated into daily lives of patients to establish a predictive model of asthma control by measuring changes from baseline health status with minimal device burden.
Objectives:
To establish baseline disease characteristics of the study participants, detect changes from baseline associated with asthma events, and evaluate algorithms capable of identifying triggers and predicting asthma control changes from baseline data. Patient experience and compliance with the devices were also explored.
Design:
This was a multicenter, observational, 24-week, proof-of-concept study conducted in the United States.
Methods:
Patients (⩾12 years) with severe, uncontrolled asthma engaged with a spirometer, vital sign monitor, sleep monitor, connected inhaler devices, and two mobile applications with embedded patient-reported outcome (PRO) questionnaires. Prospective data were linked to data from electronic health records and transmitted to a secure platform to develop predictive algorithms. The primary endpoint was an asthma event: symptom worsening logged by patients (PRO); peak expiratory flow (PEF) < 65% or forced expiratory volume in 1 s < 80%; increased short-acting β2-agonist (SABA) use (>8 puffs/24 h or >4 puffs/day/48 h). For each endpoint, predictive models were constructed at population, subgroup, and individual levels.
Results:
Overall, 108 patients were selected: 66 (61.1%) completed and 42 (38.9%) were excluded for failure to respond/missing data. Predictive accuracy depended on endpoint selection. Population-level models achieved low accuracy in predicting endpoints such as PEF < 65%. Subgroups related to specific allergies, asthma triggers, asthma types, and exacerbation treatments demonstrated high accuracy, with the most accurate, predictive endpoint being >4 SABA puffs/day/48 h. Individual models, constructed for patients with high endpoint overlap, exhibited significant predictive accuracy, especially for PEF < 65% and >4 SABA puffs/day/48 h.
Conclusion:
This multidimensional dataset enabled population-, subgroup-, and individual-level analyses, providing proof-of-concept evidence for development of predictive models of fluctuating asthma control.
Keywords
Introduction
Asthma is a heterogeneous disease characterized by chronic inflammation and associated with significant morbidity, mortality, and highly variable therapeutic responses.1,2 When appropriately prescribed and administered, current treatments effectively control asthma symptoms and prevent exacerbations. 3 However, a large proportion of patients experience suboptimal disease management due to infrequent clinical reviews and/or inadequate evaluations and treatment noncompliance.4–6 In the United States (US), 55% of patients with severe, uncontrolled asthma experience symptoms more than once a day. 7 Patients often overestimate their asthma control, as evidenced in the Asthma Insights and Management study in 10,302 patients or parents of adolescents with asthma, which reported that 67% of patients perceived their asthma to be well controlled, although only 9% achieved a well-controlled status based on relevant asthma guidelines. 8 Disease heterogeneity also poses challenges in the accurate identification of asthma triggers, 9 thus limiting self-management. 10
Patients with asthma require better tools to manage their disease, identify triggers, assess treatment responsiveness, and monitor real-time changes in asthma control. Digital tools that enable continuous monitoring of parameters that influence disease control and provide objective evidence of stable or progressive disease over time may reinforce optimal management of chronic diseases such as asthma. Currently available digital tools mainly focus on providing educational support, logging symptoms, delivering reminders to improve medication adherence, and enabling direct communication with healthcare providers.11–14 An ideal digital solution for asthma accurately monitors those parameters that impact asthma control; integrates smart sensors, devices, and mobile applications; performs data collection and analyses; relays personalized assessments to patients to heighten engagement with their disease and improve clinical outcomes; and offers a tool that patients are willing to adhere to over time. However, digital tools with the ability to predict real-time changes in disease state are limited.15–17
The individualized PREdiction of DIsease Control using digital sensor Technology (iPREDICT) program aimed to employ sensors and devices to generate novel, integrated data and facilitate a precise, digitized analysis of disease characteristics, asthma triggers, and health status to establish a prognostic model of disease control by measuring departures from individual, baseline data while imposing minimal device burden. Herein, we report the results of the iPREDICT proof-of-concept study.
Methods
Study design
This was a multicenter, observational, prospective, 24-week pilot study conducted at seven sites in the US between December 2017 and December 2018. The protocol of this study, including the final version of the informed consent form, which was signed and dated by each patient before device onboarding for study initiation, and submission of an investigational device exemption were approved by the Schulman institutional review board (IRB) for each site. The IRB also approved amendments to the protocol and all advertising used to recruit patients for the study, according to local regulations.
This 24-week pilot study was conducted to inform further iterations of the system and to eventually develop a feasible integrated digital health solution. The primary objectives were to establish baseline disease characteristics of the study participants, detect changes from baseline associated with asthma events, and evaluate algorithms capable of identifying triggers and predicting asthma control changes from baseline data. Secondary objectives explored patient experience and compliance with the devices. The reporting of this study conforms to the Strengthening the Reporting of Observational Studies in Epidemiology (STROBE) statement. 18
Patients
Patients (⩾12 years old) with a current diagnosis of severe asthma based on the European Respiratory Society/American Thoracic Society guidelines 19 and considered uncontrolled by either exacerbation criteria of ⩾2 oral corticosteroid (OCS) bursts or ⩾1 emergency room visit or hospitalization in the 2 years prior to enrollment, or an Asthma Control Questionnaire (ACQ) score of >1.5 or Asthma Control Test score of <20 (both indicate poor control) at baseline and currently using a short-acting β2-agonist (SABA) as rescue medication qualified for enrollment. Patients with comorbid conditions associated with symptoms similar to asthma were excluded. Additional criteria are included in the Supplemental Material.
Study coordinators collected baseline patient demographics and disease characteristics during the first visit, and each patient was assigned a unique iPREDICT identifier. During this first visit, the study coordinators also collected data on asthma symptom control using the validated ACQ 20 and Asthma Control Test 21 questionnaires, which were self-administered. During an onboarding home visit, a nurse ambassador trained each patient on digital technology. All participant data were associated with the respective iPREDICT identifier and transferred to a secure data capture platform. Data compiled by the iPREDICT system were monitored daily to allow for immediate communication between a call center and patients with missing or erroneous information. Additionally, providers were able to access information on baseline data, patient compliance, and the status of all devices and patient-reported outcomes (PROs) through a single dashboard, which was monitored daily by a call center. The large volume of data collected from all devices and sensors was processed separately and was not accessible to the study sites in real time.
Enrolled patients were compensated for their introductory visit at the study site, for the at-home onboarding visit, and for each study week successfully completed. At Week 4 and again at Week 20, patients received a short online questionnaire to gauge their experiences with the devices. Refer to the Supplemental Material for additional details.
Data sources
Patient histories were extracted from existing electronic health records (EHRs) and combined with the prospective data collected. Patients interacted with a spirometer (Spirobank II; Medical International Research, Italy); a vital sign monitor (Zephyr BioPatch; Zephyr, Boulder, CO, USA, USA); a sleep monitor (MySleep S+; ResMed, San Diego, CA, USA); 1 or 2 connected inhalers (Adherium SmartTouch, Adherium, Melbourne, Australia), that is, 1 for salbutamol (ProAir® [Teva Pharmaceiuticals, Parsippany-Troy Hills, NJ, USA)/Ventolin® [GlaxoSmithKline, Philadelphia, PA, USA]) or an additional one for budesonide/formoterol (Symbicort®and two mobile applications with embedded PRO questionnaires (Figures 1 and 2). These devices were selected based on characterization of biomarkers and usability testing, 22 which uncovered differences between devices that could influence user compliance in a study setting.

iPREDICT proof-of-concept study design.

iPREDICT devices and data collection.
PRO questionnaires
Enrolled participants self-administered daily questionnaires on the iPREDICT mobile application. The application, which constituted the central data collection hub for the integrated iPREDICT system, was paired with the devices and at least one of two connected inhalers and amassed information on symptom assessments and potential asthma triggers that could not be recorded passively by digital sensors or using global positioning system (GPS) location tracking. The daily questionnaire consisted of 12–14 short statements on symptoms, and additional information was obtained on the number of hours spent outdoors and rescue inhaler or nebulizer use in the previous 24 h (Supplemental Figure 1). Patients were also instructed to ‘Log Event’ whenever they experienced worsening of their asthma symptoms, and data were acquired at the onset and close of an event (Figure 3). This measure was subjective to each individual patient’s choice as some may be more sensitive to changes in their asthma control than others.

iPREDICT mobile application: questionnaires for logging events.
Endpoints
This study aimed to associate noninvasive environmental and physiological biomarkers, PROs, and spirometry data with the timing and duration of associated events of uncontrolled asthma, which could be defined as any of the following:
Subjective assessment of deteriorating asthma control (PRO) or
Peak expiratory flow (PEF) <65% of baseline or
Forced expiratory volume in 1 s (FEV1) <80% predicted or
Increased dose of SABA, either >8 puffs in 24 h or >4 puffs daily over the course of 48 consecutive hours [based on the Global Initiative for Asthma (GINA 2017) 23 and National Asthma Education and Prevention Program (NAEPP 2007) 24 guidelines, which were in place at the time this study was conducted].
Refer to the Supplemental Material for additional information.
Data analyses
Descriptive analyses characterized baseline demographics and patient characteristics. Compliance was measured as a fraction of days on which data were transmitted by a patient per a 28-day data stream, and the average compliance between demographic groups was compared for each data stream and across multiple time windows. A concurrent manual data review was conducted based on the parameters prescribed by the Data Collection Plan. A series of programmed data quality checks conceived to automatically detect missing or atypical information further enhanced the data quality, any modifications to which were subsequently recorded in an audit trail. The application of these standardized processes and procedures continuously ensured that data were as clean and accurate as possible when presented for analysis.
Development of predictive models
The initial steps in analyzing the captured, multimodal information involved data cleaning and integration. Data were collected for patient demographics and baseline variables and information was retrieved from devices, PRO questionnaires, and EHRs. Each of these data streams was cleaned independently, including deletion of nonphysical values and investigation of outliers. Data were then aggregated over calendar units (days, weeks, months) for further analysis.
Data were modeled using asthma events as endpoints (Figure 4). Patient aggregation occurred at three levels. In the population model, a single model was constructed that made predictions for all available data from all patients at once. In the subgroup model, patients were stratified into subgroups by their respective responses to 19 questions as part of the baseline questionnaire completed at the first study visit. In the individual model, asthma endpoints for each patient were treated independently.
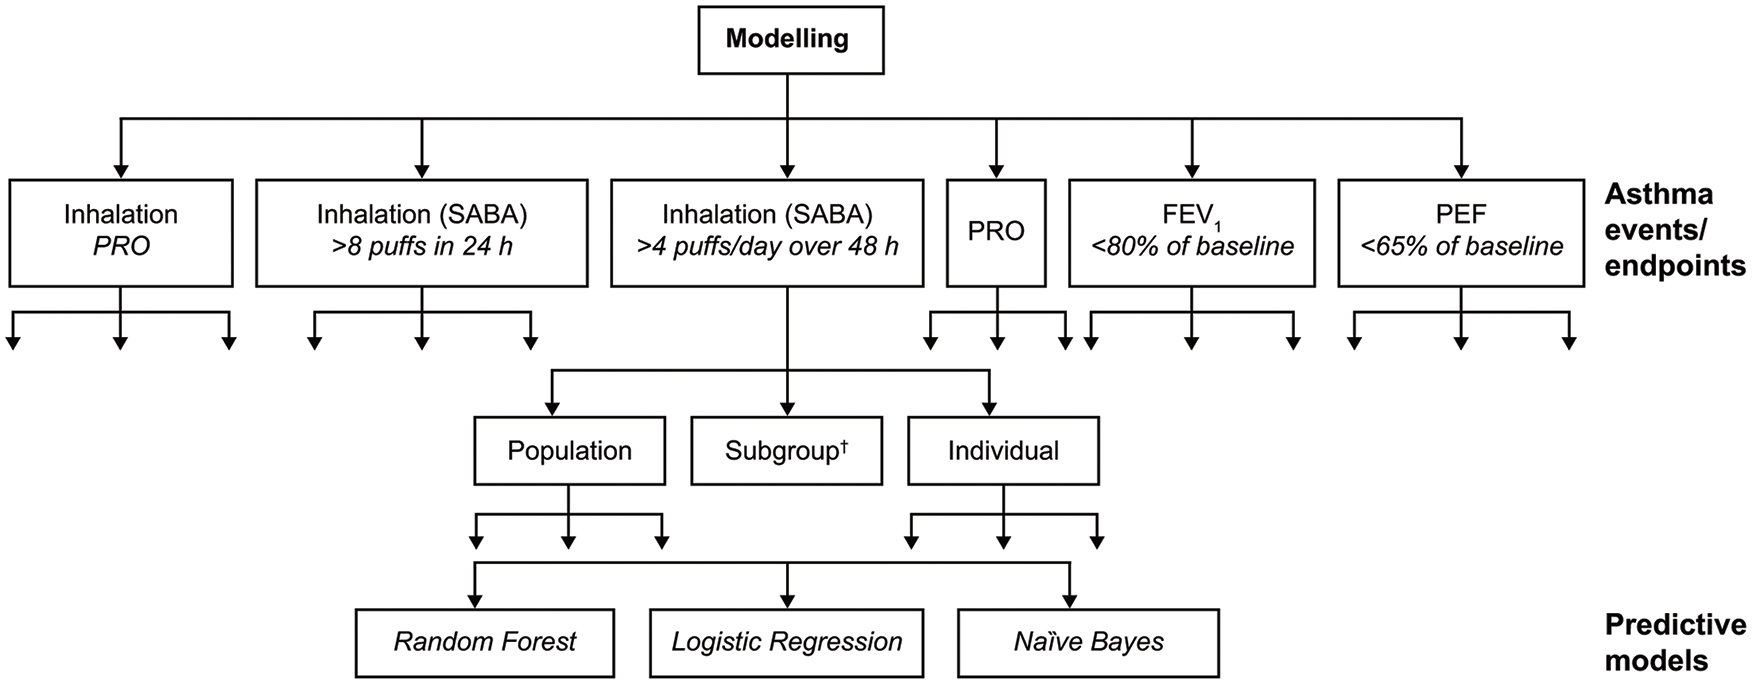
Modeling approach used to build predictive models.
Data were organized into units with inputs (features) and an output prediction indicating whether an asthma event occurred (asthma event: yes/no). Additionally, a rolling time window was defined for all periods of X number of days (according to data stream), and the extracted features were included. Approximately 6000 features were engineered from the five data sources – questionnaire, weather data, vital sign monitor, sleep monitor, and inhaler device. Using the Python programming language, two approaches for selecting a subset of predictive features were applied, namely Least Absolute Shrinkage and Selection Operator (LASSO) 25 and Sequential Forward Selection (SFS). 26 The LASSO feature selection involved identifying globally important features and grouping patients into clusters for each baseline question. Models were constructed for each ‘cluster’, and cluster model performance was compared with all-patient model performance. For SFS, features were selected either per patient or per subgroup, instead of identifying globally important features. Consequently, approximately 6000 global features were shortlisted to ~450 features.
An optimal set of features was then identified for each patient and subgroup through an iterative process involving selection of optimal features during training until model performance worsened. For each day, a unit of an input list of features (defined by a mathematical operation on a time window) and an output value were created. Data were fed into the algorithm and models were trained. To ensure that the models did not over- or under-fit, model development and cross-validation were conducted using a randomly selected subset of training data, which comprised approximately 70% of patient data. An independent, hold-out validation or test set of the remaining patient data was used to assess model performance. Whenever possible, any missing data imputation was performed with the appropriate methods determined upon data inspection. Finalized models were evaluated, and predictive accuracy was determined.
Three main machine learning models were used – logistic regression, Random Forest, and Naïve Bayes with Bernoulli distribution.27,28 Fivefold cross-validation was performed on the all-population and subgroup models, and threefold cross-validation was performed on individual models. For modeling, all available data were used when possible. For population models, all time windows with data were usable. Patients with no events were still usable as negative examples. For individualized models, any patient with ⩾2 identified events and sufficient measurements in proximity to onset and improvement or resolution of the event was considered usable.
Model accuracy was determined from the area under the curve (AUC) and Matthew’s score/correlation coefficient. 29 Matthew’s score reflects true and false positives and negatives and is generally regarded as a balanced measure that can be used even if the classes are of very different sizes. A score of +1 indicates a perfect prediction; 0, no better than random prediction; and −1, total disagreement between prediction and observation. Formal power and sample size estimations were not performed due to the absence of available datasets required to develop predictive models. However, to ensure that this 24-week study generated adequate data to develop reliable models, the aim was to enroll up to 150 patients.
Results
Of 132 patients enrolled, 108 (81.8%) completed training and were onboarded. Sixty-six (61.1%) completed the 24-week follow-up (Figure 5). The largest loss of patients occurred during the first 4 weeks of the study [n = 16 (14.8%)], after which an additional 26 patients (24.1%) withdrew sequentially over the course of the next 20 weeks. The most common reason given for withdrawal was patient burden. After patients received compensation during Weeks 6–7, the withdrawal rate decreased between Weeks 8 and 12 and further declined after receipt of a second payment at Week 12. No patients discontinued study participation between Weeks 18 and 24.

Patient disposition flowchart for the iPREDICT study.
The mean age of the patients was 48 years, and most (74.2%, n = 98) were female, White (43.2%), and had never smoked (70.5%, n = 93; Table 1). Patients reported a history of severe, uncontrolled asthma, with a mean (standard deviation) ACQ score of 2.7 (0.8) at baseline. During the 2 years preceding study enrollment, 98.0% and 44.0% of patients had ⩾1 asthma-related emergency room visit or hospitalization and ⩾2 OCS bursts in outpatient setting for acute exacerbation therapy, respectively.
Demographics and baseline clinical characteristics of patients with severe, uncontrolled asthma included in the iPREDICT pilot study.
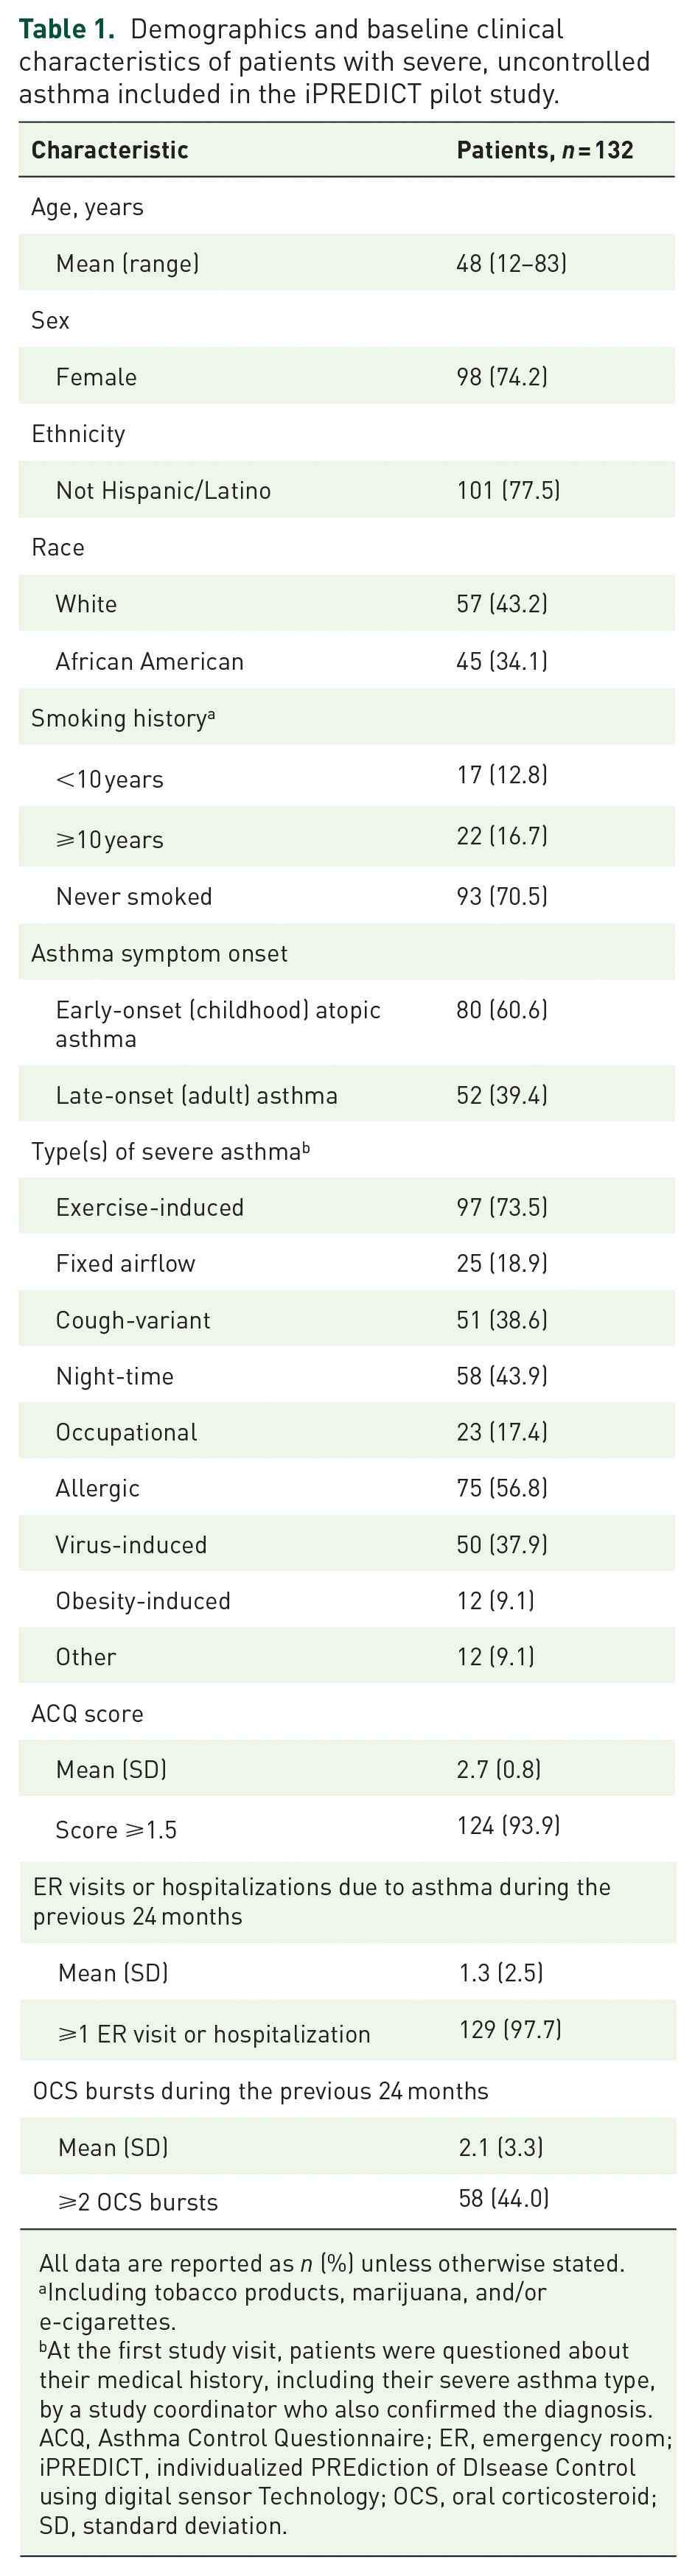
All data are reported as n (%) unless otherwise stated.
Including tobacco products, marijuana, and/or e-cigarettes.
At the first study visit, patients were questioned about their medical history, including their severe asthma type, by a study coordinator who also confirmed the diagnosis.
ACQ, Asthma Control Questionnaire; ER, emergency room; iPREDICT, individualized PREdiction of DIsease Control using digital sensor Technology; OCS, oral corticosteroid; SD, standard deviation.
Patient compliance and experience
Twenty-four weeks of multidimensional data were secured for >60 parameters and >800 million data points were generated. In general, patients were 90.0% compliant when data were collected passively using sensors or GPS and 75.0% compliant with devices and PROs that required greater engagement. For each patient, data capture from all sources throughout the study period is illustrated in Figure 6(a). Significantly better compliance was observed for patients aged >55 years than for those aged <35 years with respect to the spirometer (p = 0.002), vital sign monitor (p = 0.008), and daily questionnaire (p = 0.010) during the 13–24-week timeframe [Figure 6(b)], although the 24-h time burden associated with the devices was approximately 15 min. No significant associations were found with other demographic variables such as ethnicity, race, or sex (data not shown).

Patient compliance in the iPREDICT study. (a) Data capture† for a single patient. (b) Patient compliance by age.
User experience survey findings revealed that patient experience with all devices improved over time except for the spirometer, whose ratings declined from 5.3 at Week 44 (n = 45) to 4.8 at Week 20 (n = 39; Figure 7).
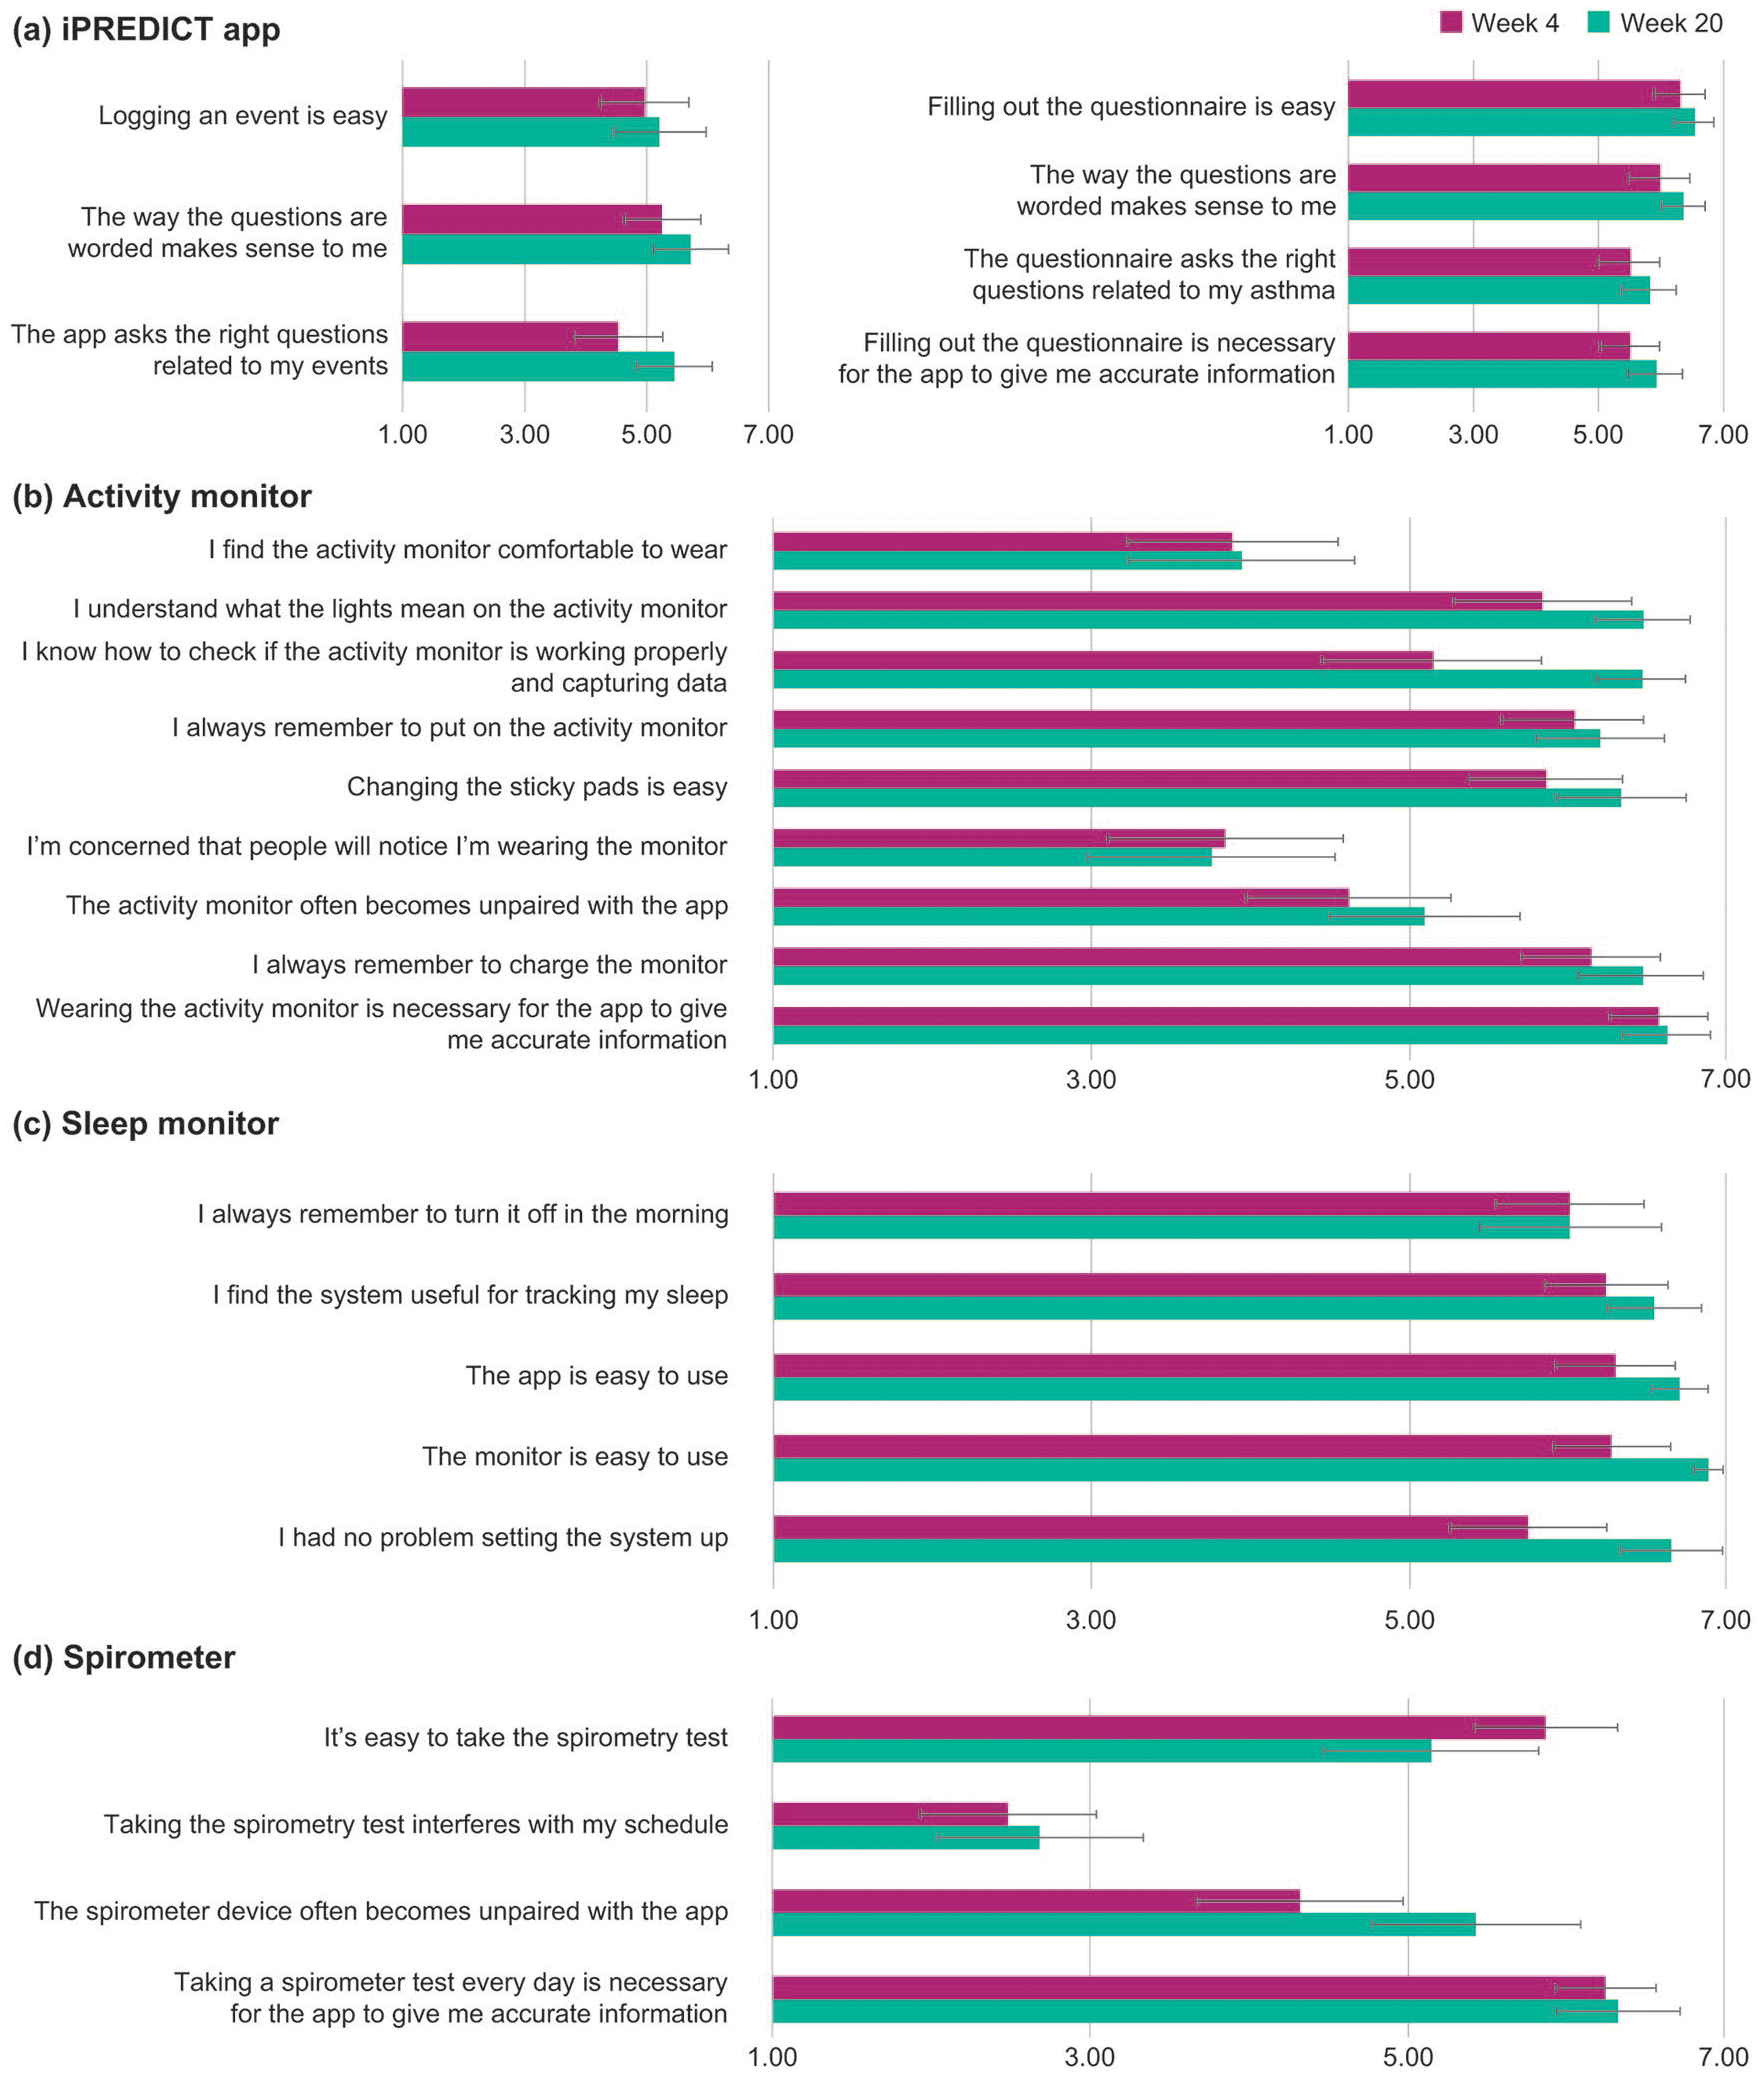
Patient experience survey results. (a) iPREDICT app, (b) Activity monitor, (c) Sleep monitor, (d) Spirometer.
Model accuracy
Quantitative metrics showed the similarity of the endpoints by assessing the extent of endpoint and event overlap across a 4-day period (Figure 8). The number of compiled events varied depending on the endpoint type; FEV1-, PEF-, and inhaler device-based endpoints were highly sensitive, whereas PRO-based rescue inhaler usage and rescue inhaler device-based measurements strongly overlapped.

Overlap/corroboration of endpoints. (a) For each endpoint in a row and for each event of that endpoint, the events of each of the endpoints in the corresponding column for half the range (2 days) before and after the endpoint event occurred were assessed. If ⩾1 event of any of the column endpoints was present within the range, the occurrence of the row endpoint event was considered corroborated by the column endpoint, and a count of 1 was added to that row or column intersection. The diagonal elements are the total number of occurrences across all patients for that row and show the number of unique events (across all patients) based on that endpoint. (b) All rows are normalized by the diagonal element. The red border (bottom right and top left) indicates good corroboration of various inhaled medication endpoints and lung function endpoints observed.
Evaluation of the algorithms revealed that the predictive accuracy of the models estimated using the AUC and Matthew’s score, depended on endpoint selection. In general, population-level models predicted asthma endpoints with relatively low accuracy. For instance, for the endpoint PEF <65%, population-level models demonstrated lower accuracy versus subgroup models [logistic regression model (AUC) 0.64 ± 0.10 versus 0.78 ± 0.16; Figure 9(a)].
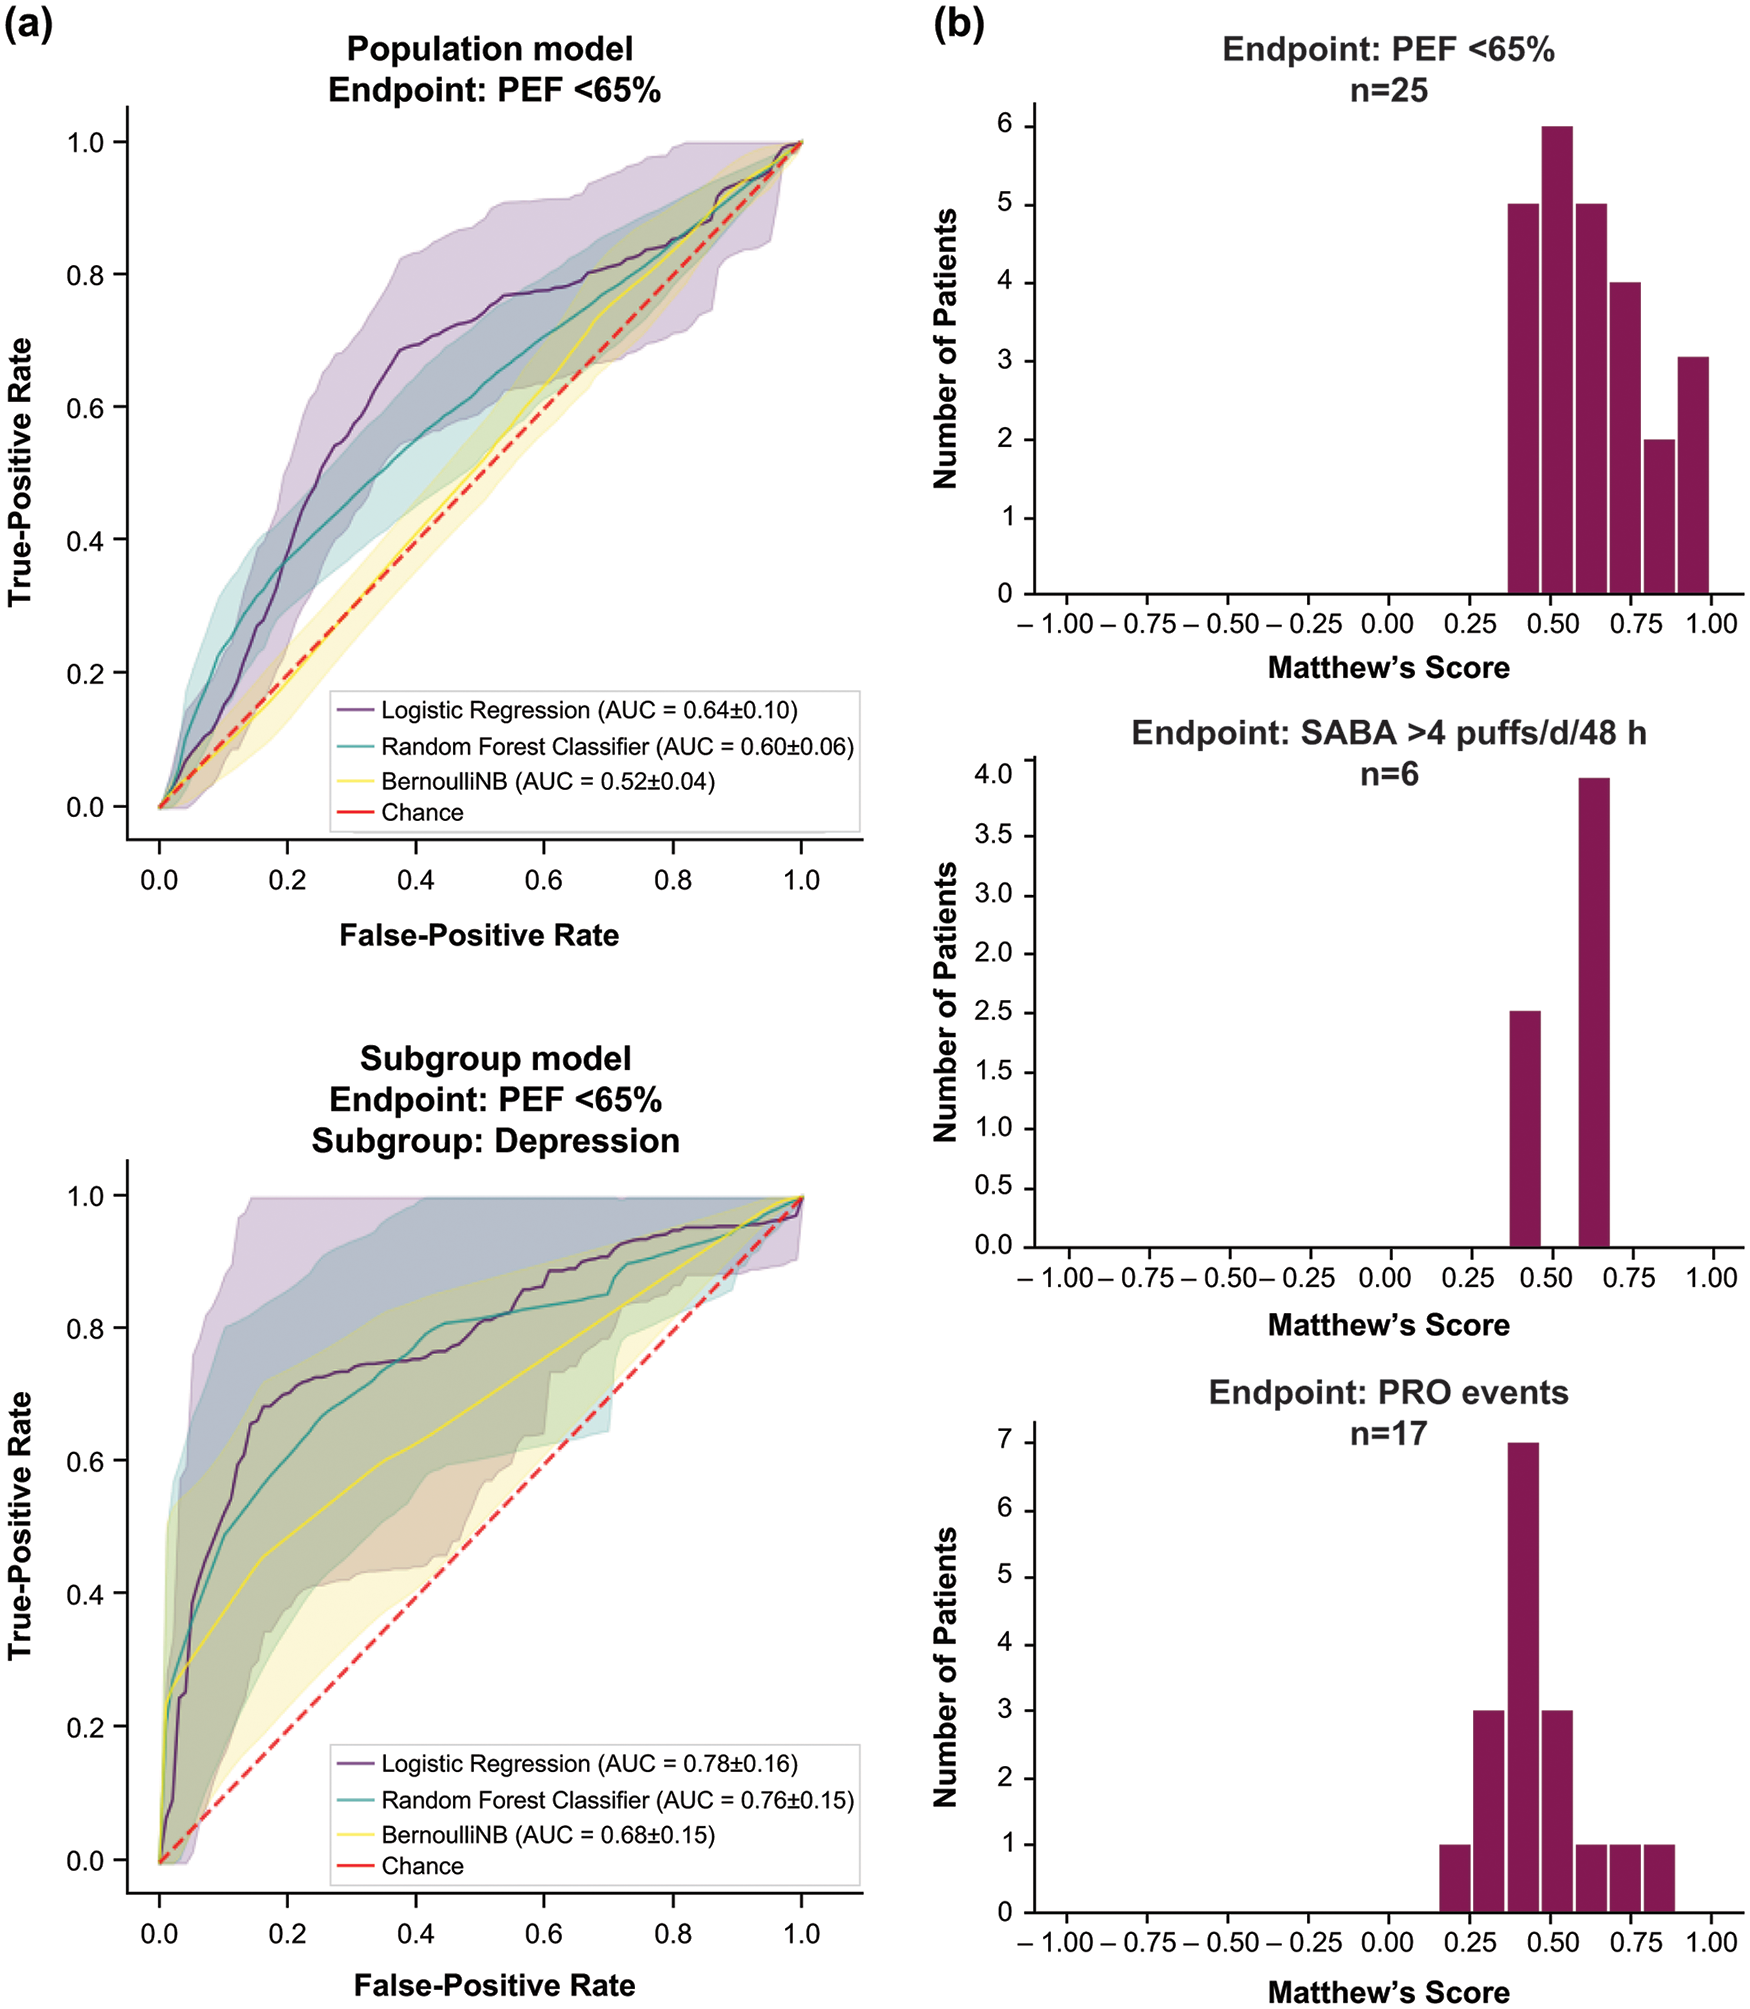
(a) Population models versus subgroup models.† (b) Accuracy of individual models.‡
Subgroup model accuracy varied by subgroup type (Figure 10). Subgroup models exhibited relatively high accuracy for baseline questions related to animal, food, and environmental allergies and asthma triggers; various asthma types including nocturnal and occupational; demographics of age, weight, and smoking status; and medical interventions for asthma exacerbations. The most accurate predictive endpoint for the asthma subgroup model was identified as >4 SABA puffs/day/48 h.

Subgroup model accuracy variation by subgroup type.
Compared with the subgroup models, individual models were constructed on a smaller subset of patients (Table 2), for whom sufficient, high-quality data, as evidenced by the significant overlap of endpoints, were available. Individual models were associated with high predictive accuracy. Figure 9(b) presents histograms of Matthew’s scores for three different endpoints for individuals for whom models could be designed. The most accurate predictive endpoints for individual models were PEF <65% and >4 puffs of SABA per day in 48 h. It was observed that certain parameters such as patient-reported use of rescue medication, feeling sad or low, and chest tightness, as well as pollen levels (weather data) and monitoring of heart rate and activity, were most informative and accurate.
Number of patients per endpoint (for key endpoints) for subgroup and individual models.

FEV1, forced expiratory volume in 1 s; PEF, peak expiratory flow; PRO, patient-reported outcome; SABA, short-acting β2-agonist.
Discussion
iPREDICT is a novel, first-of-its-kind study to generate and analyze vast, rich, multidimensional data from several different digital devices or sensors to predict disease state changes in patients with severe, uncontrolled asthma. The robustness of the data enabled analyses at the population, subgroup, and individual levels. The results suggested a low accuracy of population-level models in predicting asthma events. This weakness may be attributed to the heterogeneity of the disease, which makes its analysis at the population level less precise.
Asthma comprises several phenotypic clusters. 1 As such, subgroup models developed by distinguishing patients based on parameters such as asthma type, treatment(s) received, allergies, and triggers improved their predictive accuracy. Exercise-induced asthma, allergic asthma, older patients with asthma, or obese patients with asthma represent well-characterized asthma phenotypes. 3 The individual models built for patients afforded the greatest level of granularity and, therefore, the highest accuracy. Parameters such as rescue inhaler use and weather data contributed the most information to the development of individual models. This finding is consistent with those in literature, which indicates that SABA overuse is associated with poor asthma control and an increased risk of exacerbations.30,31 Thus, individual models, continuously trained on patient-specific data, could potentially predict asthma events with relatively high accuracy. These results provide proof-of-concept evidence that using a digital system of connected devices and applications, patient-centric, integrated, clinical data can be assembled and applied to develop prognostic models that may alert patients to deteriorating asthma control.
Other endeavors to analyze objective and subjective patient data to predict asthma worsening have been reported. The Asthma Mobile Health Study (AMHS) is a publicly available dataset of nearly 6000 patients with asthma in the US. 16 Applying machine learning techniques to analyze the dataset affirmed that features related to rescue inhaler puffs, diurnal and nocturnal asthma symptoms, and frequency of data entry, but not peak flow measurements, were most useful for the early detection of deteriorating asthma control. 16 While the accuracy of predictive models largely depends on the consistency and quality of the collected data, our findings indicate similarities and some discrepancies. The use of >4 puffs/day of SABA over a 48-h period achieved the greatest model accuracy for both subgroup and individual models. However, for individual patient models, the objective measure of PEF < 65% was found to be most informative. The AMHS dataset included only patient-reported survey information, unlike the multimodal iPREDICT program, which, although derived from a smaller cohort, captures data from multiple sensors, monitors, and applications.
Numerous integrated digital health systems are available, each characterized by a diverse range of devices, sensors, and functionalities.11,15,17,32–37 For instance, AsthmaTuner, an automated electronic clinical decision support system, consists of a patient application (Android or iOS), a cloud-based storage solution, a healthcare interface, and a spirometer connected via Bluetooth. 37 Patients register their symptoms on the application and assess lung function using the spirometer and subsequently receive automated feedback on asthma control and recommendations for medication, including the required dose. 37 Another digital intervention, the kHealth kit, comprises of a tablet with an Android application, fitbit, peak flow meter, indoor air quality monitor, and web services to collect environmental data based on the patient’s postal code. 17 The multimodal data collected with the use of sensors and mobile applications identify seasonal and personalized triggers based on information gleaned from captured data to inform personalized asthma management. 17 However, unlike iPREDICT, real-time prediction of triggers relative to the continuous streaming information on the patient experience and environment is not available. myAirCoach, a home monitoring and mobile health system, which includes a myAirCoach inhaler add-on, an indoor air quality monitor, a physical activity tracker, a home spirometer, and a device measuring fractional exhaled nitric oxide, can be employed to predict episodes of uncontrolled symptoms and the onset of asthma exacerbations. 15 Evidence suggests that patients randomized to myAirCoach experienced greater asthma control, fewer exacerbations, and better quality of life than those assigned to standard of care alone. 38 These encouraging results support the adoption of digital tools to improve clinical outcomes in patients with asthma.
Digital tools amass a larger volume of enriched data than standard clinical trials. However, their performance is only as good as the data they compile. Thus, patient compliance is critical to the practicality and applicability of such technologies. Among patients who were enrolled and completed the 24-week follow-up, compliance with the devices observed in our study (75–90%) was considerably higher than that reported in previous studies (40–60%).39–41 Despite the multimodal iPREDICT system capturing data from multiple sensors and devices, withdrawal rates from this proof-of-concept study decreased over time as patient experience with the devices increased and with patient compensation. Nurse ambassadors trained patients in the comfort and privacy of their own homes to use the devices and the associated technology before study initiation. Considering that dropout rates tend to be high for mobile health self-management studies, 42 such personal instruction may have contributed to the relatively better compliance observed. Compensation to patients for their participation may also have played a role, as withdrawal rates declined by 19% after the initial compensation at Weeks 6–7 and decreased further after the second compensation at Week 12. Therefore, compensation mechanisms may need to be integrated with the application of digital tools to enhance utilization compliance and improve clinical outcomes.
We observed that compliance with devices was greater for older patients. Typically, it has been shown that younger patients are more likely to opt for mobile health applications than older patients.43,44 These results may not apply to the current study, as the iPREDICT system comprises a series of connected devices and sensors, which exacts a greater time commitment than that when simply using a mobile health application. Further research is required to understand the reasons for noncompliance among young patients and how the accessibility of the iPREDICT program may be expanded across all demographics. Additionally, findings from this pilot study showed that data generated from some devices such as the sleep monitor and vital sign monitor had limited predictive value compared with PEF and SABA use data. As such, it is unlikely that these would be carried forward in future iterations of iPREDICT. Thus, data collected in the iPREDICT program can inform future digital health studies to improve recruitment, retention, device selection, and protocol adherence.
The limitations of this pilot study should be acknowledged. First, recruitment through clinical practice rather than the general population may have biased the study toward those who more frequently obtained healthcare services. However, this decision was justified in developing a robust predictive algorithm, as data of a considerable volume were required from patients with severe, uncontrolled asthma and frequent exacerbations. Second, as observed in clinical practice, the potential for misclassification exists in most data elements including diagnosis, severity of disease, and the degree of asthma control documented in our study. Third, the lack of available datasets required for developing a predictive model precluded formal power and sample size estimations. Lastly, while patients were relatively compliant with the digital devices, some data loss occurred owing to issues with device reliability and patient noncompliance with both the equipment and self-administered questionnaires. However, the amount of individualized data accrued far exceeds that achievable in a traditional clinical study. Additionally, PRO questionnaires facilitated the collection of unique patient perspectives enabling a personal assessment of health-related quality of life outcomes, symptom assessments, and other self-reported information that may not be recorded by their physicians. Continuous monitoring, timely reminders through the iPREDICT application, follow-up phone calls, and financial incentives also helped to alleviate information bias.
Conclusion
In conclusion, the iPREDICT pilot program provides proof-of-concept evidence for developing predictive models using identifiable, patient-specific disease parameters to anticipate changes in asthma control. The iPREDICT system will need to be validated in a clinical care environment for its ability to forecast asthma control changes, with the ultimate goal being early intervention in patients with asthma before significant loss of disease control that may precipitate an exacerbation with an attendant increase in healthcare utilization and the need for systemic steroids.
Supplemental Material
sj-docx-1-tar-10.1177_17534666241266186 – Supplemental material for iPREDICT: proof-of-concept study to develop a predictive model of changes in asthma control
Supplemental material, sj-docx-1-tar-10.1177_17534666241266186 for iPREDICT: proof-of-concept study to develop a predictive model of changes in asthma control by Mario Castro, Merrill Zavod, Annika Rutgersson, Magnus Jörntén-Karlsson, Bhaskar Dutta and Lynn Hagger in Therapeutic Advances in Respiratory Disease
Supplemental Material
sj-docx-2-tar-10.1177_17534666241266186 – Supplemental material for iPREDICT: proof-of-concept study to develop a predictive model of changes in asthma control
Supplemental material, sj-docx-2-tar-10.1177_17534666241266186 for iPREDICT: proof-of-concept study to develop a predictive model of changes in asthma control by Mario Castro, Merrill Zavod, Annika Rutgersson, Magnus Jörntén-Karlsson, Bhaskar Dutta and Lynn Hagger in Therapeutic Advances in Respiratory Disease
Footnotes
Acknowledgements
We wish to thank the patients and investigators, including Charles Humphries of Clinical Research of Charlotte, Charlotte, NC, USA; Alexander White of Progressive Medical Research, Port Orange, FL, USA; and Chester Fox of Urban Family Practice, Buffalo, NY, USA, who participated in the iPREDICT pilot study. The participating sites (all in the US) together with their principal investigators are listed in the Online Repository. Editorial support was provided by Michelle Rebello, PhD, CMPP, of Cactus Communications (Mumbai, India), in accordance with Good Publication Practice (GPP3) guidelines (![]() ). This support was fully funded by AstraZeneca. These data were presented at the European Respiratory Society Congress, 28 September to 2 October 2019, in Madrid, Spain, and the American College of Chest Physicians (CHEST) Annual Congress, 19–23 October 2019, in New Orleans, LA, USA.
). This support was fully funded by AstraZeneca. These data were presented at the European Respiratory Society Congress, 28 September to 2 October 2019, in Madrid, Spain, and the American College of Chest Physicians (CHEST) Annual Congress, 19–23 October 2019, in New Orleans, LA, USA.
Declarations
Supplemental material
Supplemental material for this article is available online.
References
Supplementary Material
Please find the following supplemental material available below.
For Open Access articles published under a Creative Commons License, all supplemental material carries the same license as the article it is associated with.
For non-Open Access articles published, all supplemental material carries a non-exclusive license, and permission requests for re-use of supplemental material or any part of supplemental material shall be sent directly to the copyright owner as specified in the copyright notice associated with the article.