
Abstract
Background:
The current available diagnostic criteria for gastroesophageal reflux-related chronic cough (GERC) dominated by non-acid reflux is imperfect. The post-reflux swallow-induced peristaltic wave index (PSPWI) is a parameter reflecting esophageal clearance function.
Objectives:
This study aims to investigate its diagnostic value for non-acid GERC.
Design:
This study sought to compare the diagnostic value of PSPWI in different types of GERC, particularly non-acid GERC, and explore the clinical significance of PSPWI in the diagnosis of non-acid GERC through diagnostic experiments.
Methods:
A retrospective analysis was performed based on 223 patients with suspected GERC who underwent multichannel intraluminal impedance-pH monitoring (MII-pH) in the outpatient clinic of our department from August 2016 to June 2021. Their clinical information, laboratory test results, and treatment responses were assessed and the underlying etiologies of chronic cough were categorized. The predictive value of the PSPWI in diagnosing different types of GERC, especially non-acid GERC, was analyzed and compared.
Results:
A total of 195 patients with chronic cough who met the inclusion criteria underwent MII-pH monitoring. 143 patients had a definitive diagnosis of GERC, including 98 with acid GERC and 45 with non-acid GERC. The diagnostic value of PSPWI alone was moderate for GERC with an area under the working curve (AUC) 0.760, but poor for non-acid GERC with an AUC of 0.569. However, PSPWI < 39.8% combining with acid exposure time (AET) ⩽ 6.2% demonstrated a moderate diagnostic value for non-acid GERC, with an AUC of 0.722. When PSPWI < 39.8% combined with a non-acid reflux ratio >68.75%, the diagnostic value for non-acid GERC was improved (AUCROC = 0.80 versus AUCROC = 0.722, p < 0.05), which was significantly superior to non-acid symptom index (AUCROC = 0.804 versus AUCROC = 0.550, p < 0.05) and non-acid symptom association probability (AUCROC = 0.804 versus AUCROC = 0.571, p < 0.05).
Conclusion:
PSPWI < 39.8% and AET ⩽ 6.2% have demonstrated good diagnostic value for non-acid GERC. The diagnostic value was further improved when combined with non-acid reflux ratio >68.75%.
Keywords
Introduction
Gastroesophageal reflux-related chronic cough (GERC), one of the common causes of chronic cough, is a prevalent extraesophageal manifestation of gastroesophageal reflux disease (GERD).1–4 Based on the nature of reflux, gastroesophageal reflux can be divided into acid reflux and non-acid reflux; the latter includes weak acid and weak base reflux. 5 Thus, GERC can be categorized into acid and non-acid GERC. Multichannel intraluminal impedance-pH monitoring (MII-pH) is currently the primary auxiliary examination for diagnosing GERC. 6 The diagnostic value of its relevant parameters for GERC, including acid exposure time (AET), symptom association probability (SAP), and symptom index (SI), 7 has been suggested by numerous studies and recognized by various guidelines.1,8 AET is a highly reproducible parameter 9 that reflects the severity of acid exposure and has high diagnostic value in GERC, especially in acid GERC. 10 However, there is a lack of validated parameters for the diagnosis of non-acid GERC and currently mainly relies on non-acid SI, non-acid SAP, and responses to the anti-reflux therapy.11,12 The SI and SAP are indicators that reflect the temporal correlation between cough and reflux, and their acquisition depends on the time or frequency of cough recorded by the patient on the diary card during the monitoring process. Their predictive value for GERC is questionable due to their subjective nature and lack of reliability and accuracy, as patients often have poor compliance, varied perceptions of symptoms, and difficulty in distinguishing between dense symptoms. 13
A previous study on non-acid GERC found that the frequency and non-acid reflux ratio had certain diagnostic significance for the diagnosis of non-acid GERC 14 ; however, the diagnostic value was limited by the low area of the receiver operating characteristic (ROC) curve. In recent years, a new impedance pH parameter, the post-reflux swallow-induced peristaltic wave index (PSPWI), has attracted much attention as MII-pH monitoring has been further investigated. 8 This parameter reflects the chemical clearance capacity of the esophagus. 15 Esophageal clearance of refluxate consists of volume and chemical clearance, the former due to a secondary peristaltic wave elicited by esophageal stretch receptors and removing 90% of the refluxate, and the latter due to an esophago-salivary reflex delivering bicarbonate and further incrementing esophageal pH. 15 Low PSPWI values indicate impaired esophageal clearance. 16 Studies have shown that it can enhance the diagnostic value of MII-pH monitoring in GERD and distinguish GERD from non-GERD diseases.17,18 The predictive power of PSPWI in predicting response to anti-reflux therapy has been confirmed in several studies.19–21 However, whether the PSPWI can be a useful tool in the diagnosis of GERC, particularly non-acid GERC, has not been validated. Therefore, in this study, a retrospective analysis of the clinical data and laboratory tests of patients with suspected GERC who underwent MII-pH monitoring over the past 5 years was conducted to investigate the role of PSPWI in the diagnosis of non-acid GERC.
Methods
Patients
Six hundred and fifty-eight patients with chronic cough who visited the Department of Respiratory and Critical Care Medicine of Tongji Hospital between August 2016 and June 2021 were included. The cause of chronic cough was determined after detailed history analysis, thorough physical examinations, combined with laboratory tests such as the capsaicin challenge test, chest X-ray or CT, spirometry, bronchial provocation test, induced sputum cytology, and MII-pH monitoring. None of the patients who underwent MII-pH monitoring took proton-pump inhibitors (PPIs) for more than 2 weeks. The severity of cough was assessed using the cough symptom score developed by Hsu et al. 22 The diagnosis of GERC was based on the diagnostic criteria proposed by the American College of Chest Physicians 1 and the Chinese Medical Association. 23 GERC was considered when patients met the following criteria: (1) chronic cough predominantly daytime, (2) MII-pH monitoring showing positive findings including AET > 6.0%, SI ⩾ 50% and/or SAP ⩾ 95%, and (3) responding to stepwise anti-reflux therapy (cough symptom score reduced by >50%) without positive MII-pH findings. Patients were diagnosed with acid GERC if AET > 6.0%, acid SI ⩾ 50%, and/or acid SAP ⩾ 95%. Non-acid GERC was considered if the patient responded to stepwise anti-reflux treatment with AET ⩽ 6.0%, but non-acid SI ⩾ 50% and/or non-acid SAP ⩾ 95%.24,25 After receiving an adequate and appropriate treatment course for the underlying cause of chronic cough other than GERC, several patients experienced partial improvement in cough symptoms (cough symptom score reduced by <50%). After a cessation of medication for more than 8 weeks, these patients underwent MII-pH monitoring and complete disappearance of the cough after combined anti-reflux therapy. Than they were finally diagnosed with GERC accompanying with other causes.
The exclusion criteria were as follows: (1) failure to record cough symptoms on diary cards as required during MII-pH monitoring or failure to achieve a sufficient length of MII-pH monitoring, resulting in inaccurate results for the relevant impedance-pH parameters; and (2) incomplete clinical data due to loss of visits during the course of the consultation.
The reporting of this study conforms to the STARD reporting guidelines. 26
Laboratory examination
Cough sensitivity was measured according to a modified capsaicin challenge test described by Fujimura et al. 27 The minimum concentration of inhaled capsaicin solution that induced two and five coughs was used as cough thresholds C2 and C5, respectively, to indicate cough sensitivity. Cytology of the induced sputum was performed according to the previously reported methods. 28 Spirometry and bronchial provocation tests were conducted according to the guidelines formulated by the American College of Chest Physicians 29 and the Chinese Medical Association. 30
MII-pH monitoring was conducted based on previous studies. 31 The position of the lower esophageal sphincter was determined by esophageal manometry. A 2.1-mm diameter MII-pH catheter consisting of six impedance channel sensors (K6011-E10632, Unisensor, Attikon, Switzerland) and an antimony pH electrode (819100, Medical Measurement System BV, Enschede, Netherlands), was then inserted nasally into the patient’s esophagus. The impedance channel sensors were located 3, 5, 7, 9, 15, and 17 cm above the lower esophageal sphincter and the pH electrode was positioned 5 cm above the proximal end of the lower esophageal sphincter. A portable data logger (Ohmega, Medical Measurement System BV) was attached to record all data from the seven channels. Patients were required to record the time points of coughing, meal periods, postural changes, etc. on a diary card and pressing an event marker button in the portable data logger during monitoring. The data were analyzed using a specific software (MMS database, v8.7) and the reflux events were manually reviewed. Reflux events were classified as gas, liquid, or mixed reflux according to the impedance and further classified as acidic (pH < 4.0), weakly acidic (pH 4.0–7.0), and weakly alkaline (pH > 7.0) based on pH value.
The relevant pH-impedance parameters were defined as follows: (1) AET referred to the time percentage of esophageal pH < 4 over the whole monitoring time 8 ; (2) DeMeester score was a weighted score calculated automatically by the software, comprising six parameters including total reflux time, upright reflux time, regurgitation time, total number of reflux episodes, number of reflux episodes lasting more than 5 min and maximum reflux duration 32 ; (3) SAP referred to the correlation between the cough recorded by the patient on the diary card and the reflux occurring within the previous 2 min 33 ; (4) SI referred to the percentage of reflux-related coughs relative to the total number of coughs 34 ; (5) a post-reflux swallow-induced peristaltic wave (PSPW) has been defined as an antegrade 50% drop in impedance originating in the proximal esophagus within 30 s after the end of a reflux episode and reaching the distal esophageal lumen. 15 The PSPWI was obtained by diving the number of PSPWs by the total number of reflux events 35 ; and (6) non-acid reflux ratio referred to the ratio of the number of non-acid reflux episodes to the total number of reflux episodes.
Stepwise anti-reflux treatment
The initial therapy was standard anti-reflux treatment, 1 which included oral omeprazole 20 mg, twice daily and mosapride 10 mg, three times daily. Patients who failed to respond to standard anti-reflux therapy were administered a double dose of a PPI (oral omeprazole 40 mg, twice a day) for 8 weeks. If the cough remained unresolved, switched to 4 weeks of oral omeprazole 20 mg, twice daily, and baclofen 20 mg, three times daily for 4 weeks.24,25 If a good response was achieved, treatment was maintained until the cough resolved. Patients were followed up every 2 weeks throughout the treatment period and changes in symptoms and cough symptom scores were recorded.
Statistical analysis
Normally distributed data are expressed as mean ± standard deviation (mean ± SD), and skewed data are expressed as median (25–75% interquartile range). One-way analysis of variance or nonparametric test (Kruskal–Wallis H-test) was used to compare the statistical differences in impedance parameters among the acid GERC, non-acid GERC, and non-GERC groups. The sensitivity, specificity, positive predictive value, negative predictive value, area under the receiver-operating characteristic curve (AUC), and Youden index were obtained by plotting the ROC curve. We obtained the cutoff values when the Youden index was maximized for the experimental parameters. The DeLong text was used to compare the differences between ROC curves. R software (version 4.0.3), RStudio (version 2023.09.0) and SPSS (version 27.0) were used for statistical analysis. p < 0.05 was considered statistically significant.
Results
Basic information
A total of 658 patients with chronic cough were admitted to our department from August 2016 to June 2021. Among them, 223 patients with suspected GERC underwent MII-pH monitoring. A total of 195 patients with chronic cough were included due to the 28 patients with incomplete clinical data were excluded. Their demographic characteristics are presented in Table 1. The baseline differences among the groups were not statistically significant. Of these, 55 underwent gastroduodenoscopy and 15 had erosive esophagitis, but none of them had Barrett’s esophagus. None of the patients had previous fundoplication or foregut surgery. A total of 143 patients were definitively diagnosed with GERC, including 98 patients with acid GERC and 45 with non-acid GERC. A 129 patients had GERC as the sole cause of chronic cough, and 14 cases had GERC combined with other common causes of chronic cough. These included four cases of combined cough-variant asthma, six cases of combined atopic cough, two cases of combined eosinophilic bronchitis, and two cases of combined with upper airway cough syndrome (UACS). GERC was ruled out in 52 patients with further investigations and treatments and was considered to be a chronic cough caused by other etiologies (Table 2).
Demographic characteristics of patients.

The data of age and lung function were expressed as mean ± SD, and other data were expressed as median (25–75% interquartile).
C2, capsaicin solution concentration with ⩾2 coughs; C5, capsaicin solution concentration for ⩾5 coughs; FEV1, forced expiratory volume in 1 s; FVC, forced vital capacity; GERC, gastroesophageal reflux-related chronic cough.
The etiology distribution of chronic cough patients.

AC, atopic cough; ACEI, angiotensin-converting enzyme inhibitor; CVA, cough-variant asthma; EB, eosinophilic bronchitis; GERC, gastroesophageal reflux-induced chronic cough; OSAHS, obstructive sleep apnea-hypopnea syndrome; UACS, upper airway cough syndrome.
Comparison of MII-pH parameters in different types of GERC
We divided the 195 patients into three groups based on the final diagnosis, including acid GERC, non-acid GERC, and non-GERC. The MII-pH-related parameters are summarized and compared in Table 3. Statistical differences were found in the AET and DeMeester scores among the three groups, with the acid GERC group presenting markedly higher AET and DeMeester scores than the non-acid GERC (Z = −8.858, p < 0.001; Z = −8.777, p < 0.001) and non-GERC groups (Z = −9.372, p < 0.001; Z = −9.340, p < 0.001). SAP was significantly higher in the acid GERC group (Z = −7.237, p < 0.001) and the non-acid GERC group than in the non-GERC group (Z = −7.687, p < 0.001). The SI of the acid GERC group and the non-acid GERC group were considerably higher than that of the non-GERC group (Z = −8.245, p < 0.001; Z = −8.354, p < 0.001). The number of reflux events in the non-acid GERC group was significantly higher than those in the non-GERC group (Z = −2.713, p = 0.007). The proportion of non-acid reflux was significantly higher in the non-acid GERC and non-GERC groups than that in the acid GERC group (Z = −6.305, p < 0.001; Z = −5.460, p < 0.001). The PSPWI was comparable between the non-acid GERC and acid GERC groups (Z = −0.308, p = 0.702), but both groups had a significantly lower PSPWI than the non-GERC group (Z = −5.460, p < 0.001; Z = −3.993, p < 0.001).
Comparison of different MII-pH variables between the three groups.

Data were presented as median (25–75% interquartile range).
Versus the non-acid GERC group, p < 0.05.
Versus the non-GERC group, p < 0.05.
AET, acid exposure time; GERC, gastroesophageal reflux-induced chronic cough; MII-pH, multichannel intraluminal esophageal impedance and pH monitoring; MNBI, mean nocturnal baseline impedance; PSPWI, post-reflux swallow-induced peristaltic wave index; SAP, symptom-associated probability; SI, symptom index.
The value of PSPWI for the diagnosis of GERC
Diagnostic value of PSPWI, AET, DeMeester score, SI, SAP for GERC
The AET and DeMeester score have a high diagnostic value for GERC, with AUCs of 0.851 and 0.854 respectively. The PSPWI has a moderate diagnostic value for GERC, with an AUC of 0.760. The diagnostic values of SI and SAP for GERC were low, with AUCs of 0.628 and 0.622, respectively.
There was no statistical difference between the ROC curves of the PSPWI, AET, and DeMeester score in predicting GERC. However, the PSPWI displayed a significantly better diagnostic value than SI (AUCROC = 0.760 versus AUCROC = 0.628, p = 0.019) and SAP (AUCROC = 0.760 versus AUCROC = 0.622, p = 0.024). With a cut-off value of ⩽39.8% and the Youden index of 0.55, PSPWI had a sensitivity of 70.63%, specificity of 84.62%, positive predictive value of 96.66%, and negative predictive value of 51.16%, respectively, for the diagnosis of GERC.
Diagnostic value of PSPWI, AET, DeMeester score, acid SI, acid SAP for acid GERC
The ROC curves of PSPWI, AET, DeMeester score, acid SI, and acid SAP in diagnosing acid GERC are provided in Figure 1. The AET and DeMeester score demonstrated high diagnostic value for acid GERC, with AUCs of 0.964 and 0.961, respectively. The PSPWI had a moderate diagnostic value for acid GERC with an AUC of 0.655. PSPWI demonstrated similar diagnostic value to acid SI (AUCROC = 0.655 versus AUCROC = 0.565, p = 0.153) and acid SAP (AUCROC = 0.655 versus AUCROC = 0.663, p = 0.102) for acid GERC, but still fell short of the diagnostic efficiency of AET (AUCROC = 0.655 versus AUCROC = 0.964, p < 0.001) and DeMeester score (AUCROC = 0.655 versus AUCROC = 0.961, p < 0.001).
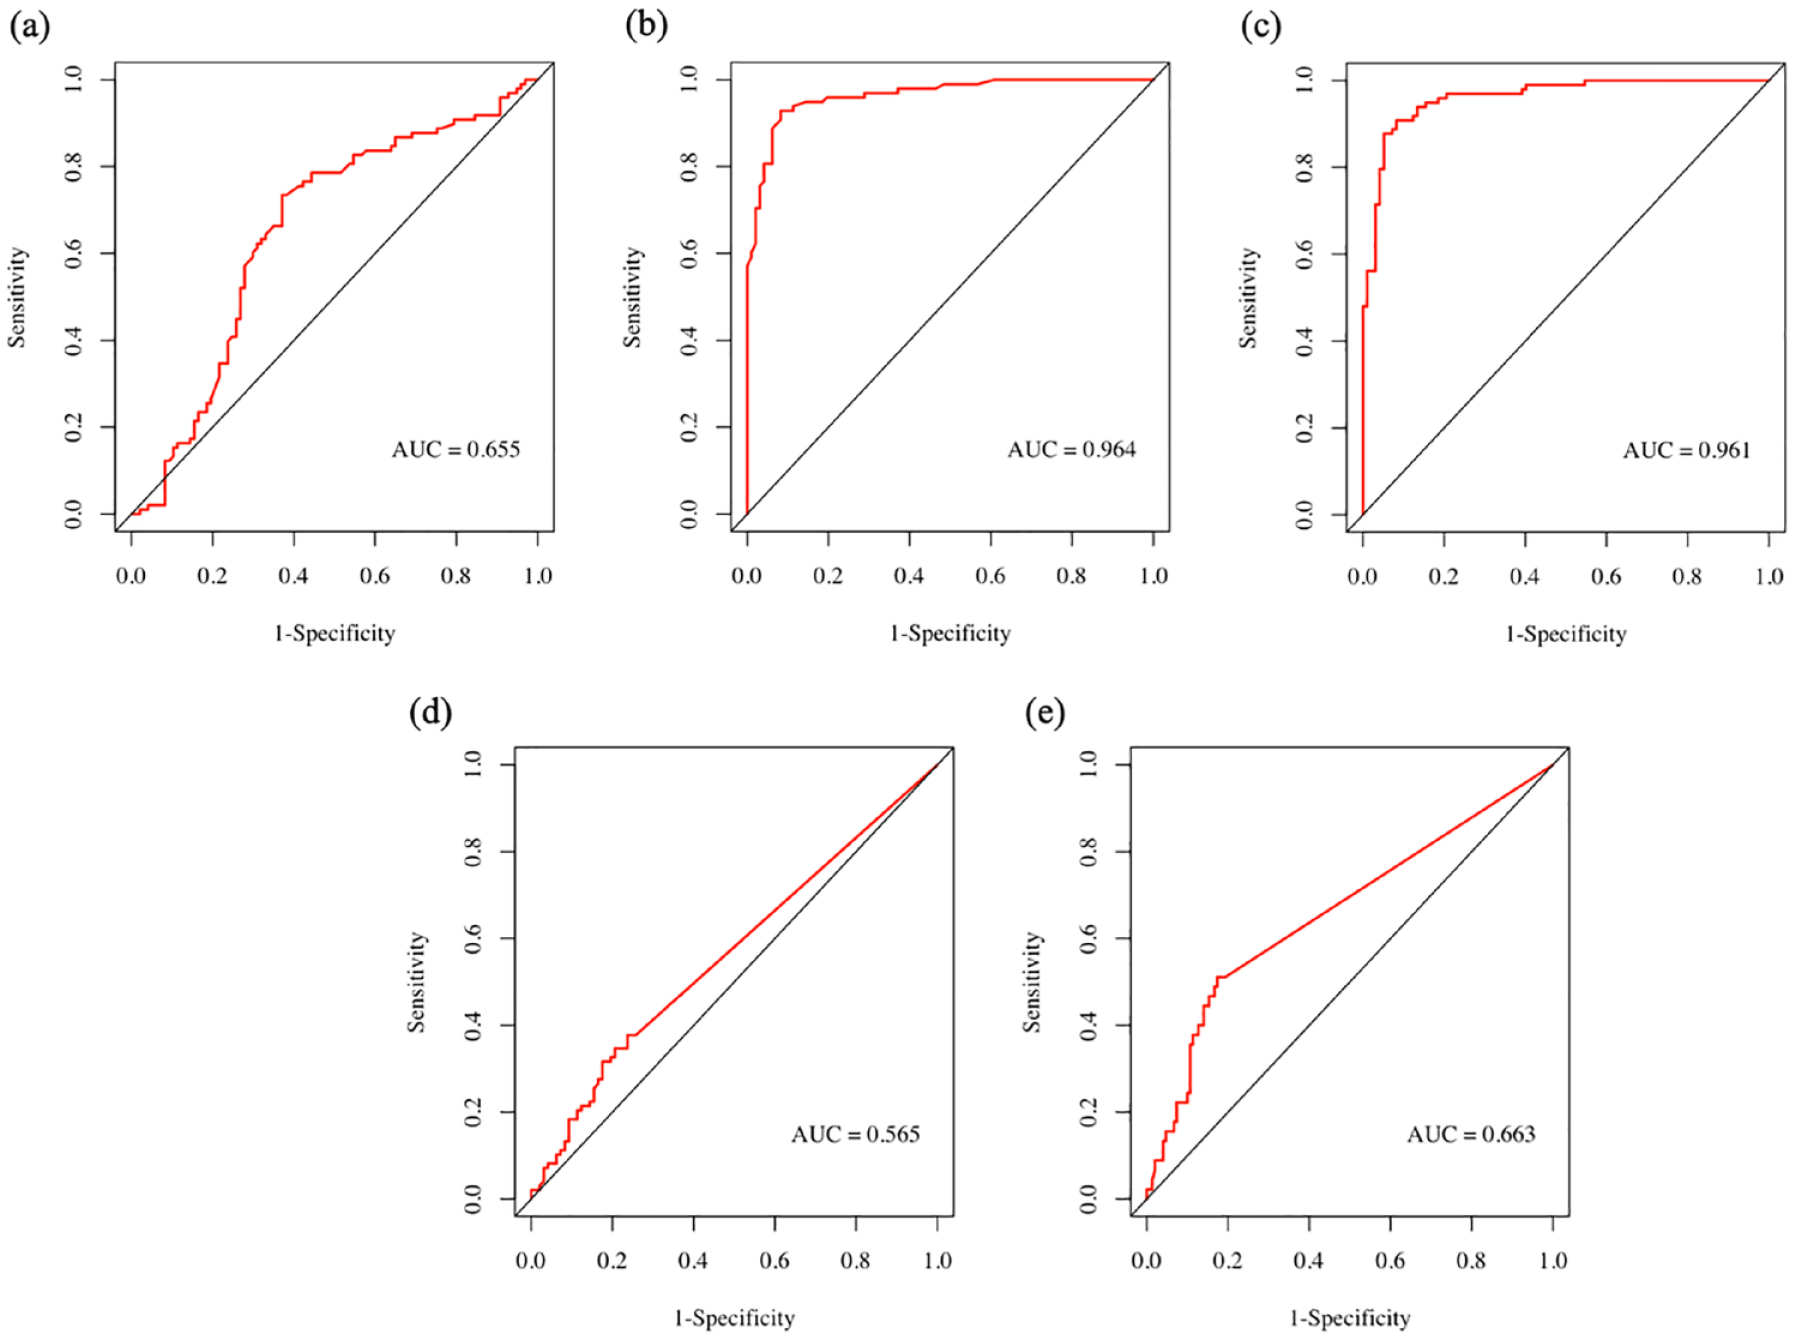
The diagnostic value of PSPWI, AET, DeMeester score, acid-SI and acid-SAP for acid-GERC. (a) ROC curve of PSPWI in predicting acid-GERC. (b) ROC curve of AET in predicting acid-GERC. (c) ROC curve of DeMeester score in predicting acid-GERC. (d) ROC curve of acid-SI in predicting acid-GERC and (e) ROC curve of acid-SAP in predicting acid-GERC.
Diagnostic value of PSPWI, AET, DeMeester score, non-acid SI, non-acid SAP for non-acid GERC
Figure 2 displays the diagnostic value curve for each impedance parameter in relation to the non-acid GERC. The PSPWI alone exhibited poor diagnostic efficacy for non-acid GERC with an AUC of 0.569. The diagnostic performance of the AET and DeMeester scores for non-acid GERC was low, with AUC of 0.616 and 0.606, respectively. Non-acid SI and non-acid SAP demonstrated moderate diagnostic value for non-acid GERC as AUCs were 0.684 and 0.663, respectively. There were no statistically significant differences among the ROC curves of AET, DeMeester score, non-acid SI, and non-acid SAP in predicting non-acid GERC (DeLong text: p > 0.05).

The diagnostic value of PSPWI, AET, DeMeester score, non-acid SI, and non-acid SAP for non-acid GERC. (a) ROC curve of PSPWI in predicting non-acid GERC. (b) ROC curve of AET in predicting non-acid GERC. (c) ROC curve of DeMeester score in predicting non-acid GERC. (d) ROC curve of non-acid SI in predicting non-acid GERC and (e) ROC curve of non-acid SAP in predicting non-acid GERC.
Diagnostic value of PSPWI < 39.8% combined with AET ⩽ 6.2% for non-acid GERC
To obtain a better diagnostic value for non-acid GERC, we combined PSPWI < 39.8% and AET ⩽ 6.2% to reach this. It achieved a high diagnostic value for non-acid GERC with an AUC of 0.722, which was superior to non-acid SI ⩾ 50% and non-acid SAP ⩾ 95% as diagnostic criteria (I) for non-acid GERC.
Combination and comparison of the diagnostic value of PSPWI < 39
8% and AET ⩽ 6.2% with non-acid reflux episodes and non-acid reflux ratio for non-acid GERC.
The AUCs of non-acid reflux episodes and non-acid reflux ratios in predicting non-acid GERC were 0.706 and 0.754, respectively. When non-acid reflux, episodes were >58, the Youden index was 0.31 with a sensitivity of 46.67% and a specificity of 84.67%. When non-acid reflux ratios >68.75%, the Youden index was 0.48 with a sensitivity of 68.89% and specificity of 78.67%.
Therefore, we have established non-acid reflux episodes >58 and non-acid reflux ratios >68.75% as the diagnostic criteria (II) and (III) for non-acid GERC. There was no significant difference in the diagnostic value between (I) PSPWI < 39.8% and AET ⩽ 6.2% for non-acid GERC and (II) or (III) (DeLong test: p < 0.05), which was significantly better than non-acid SI ⩾ 50% and non-acid SAP ⩾ 95% (DeLong test: p > 0.05).
The four permutations of (I) combined with (II) and (III), including (I) and (II), (I) or (II), (I) and (III), and (I) or (III), were further calculated and their respective diagnostic values were compared (Table 4). In terms of diagnostic value, (I) or (III) were superior to (I), (II), and (III) alone in predicting non-acid GERC (DeLong test: p < 0.05) (Figure 3), as well as non-acid SI ⩾ 50% and non-acid SAP ⩾ 95% (DeLong test: p < 0.05).
Comparison of diagnostic value of several items for non-acid GERC.
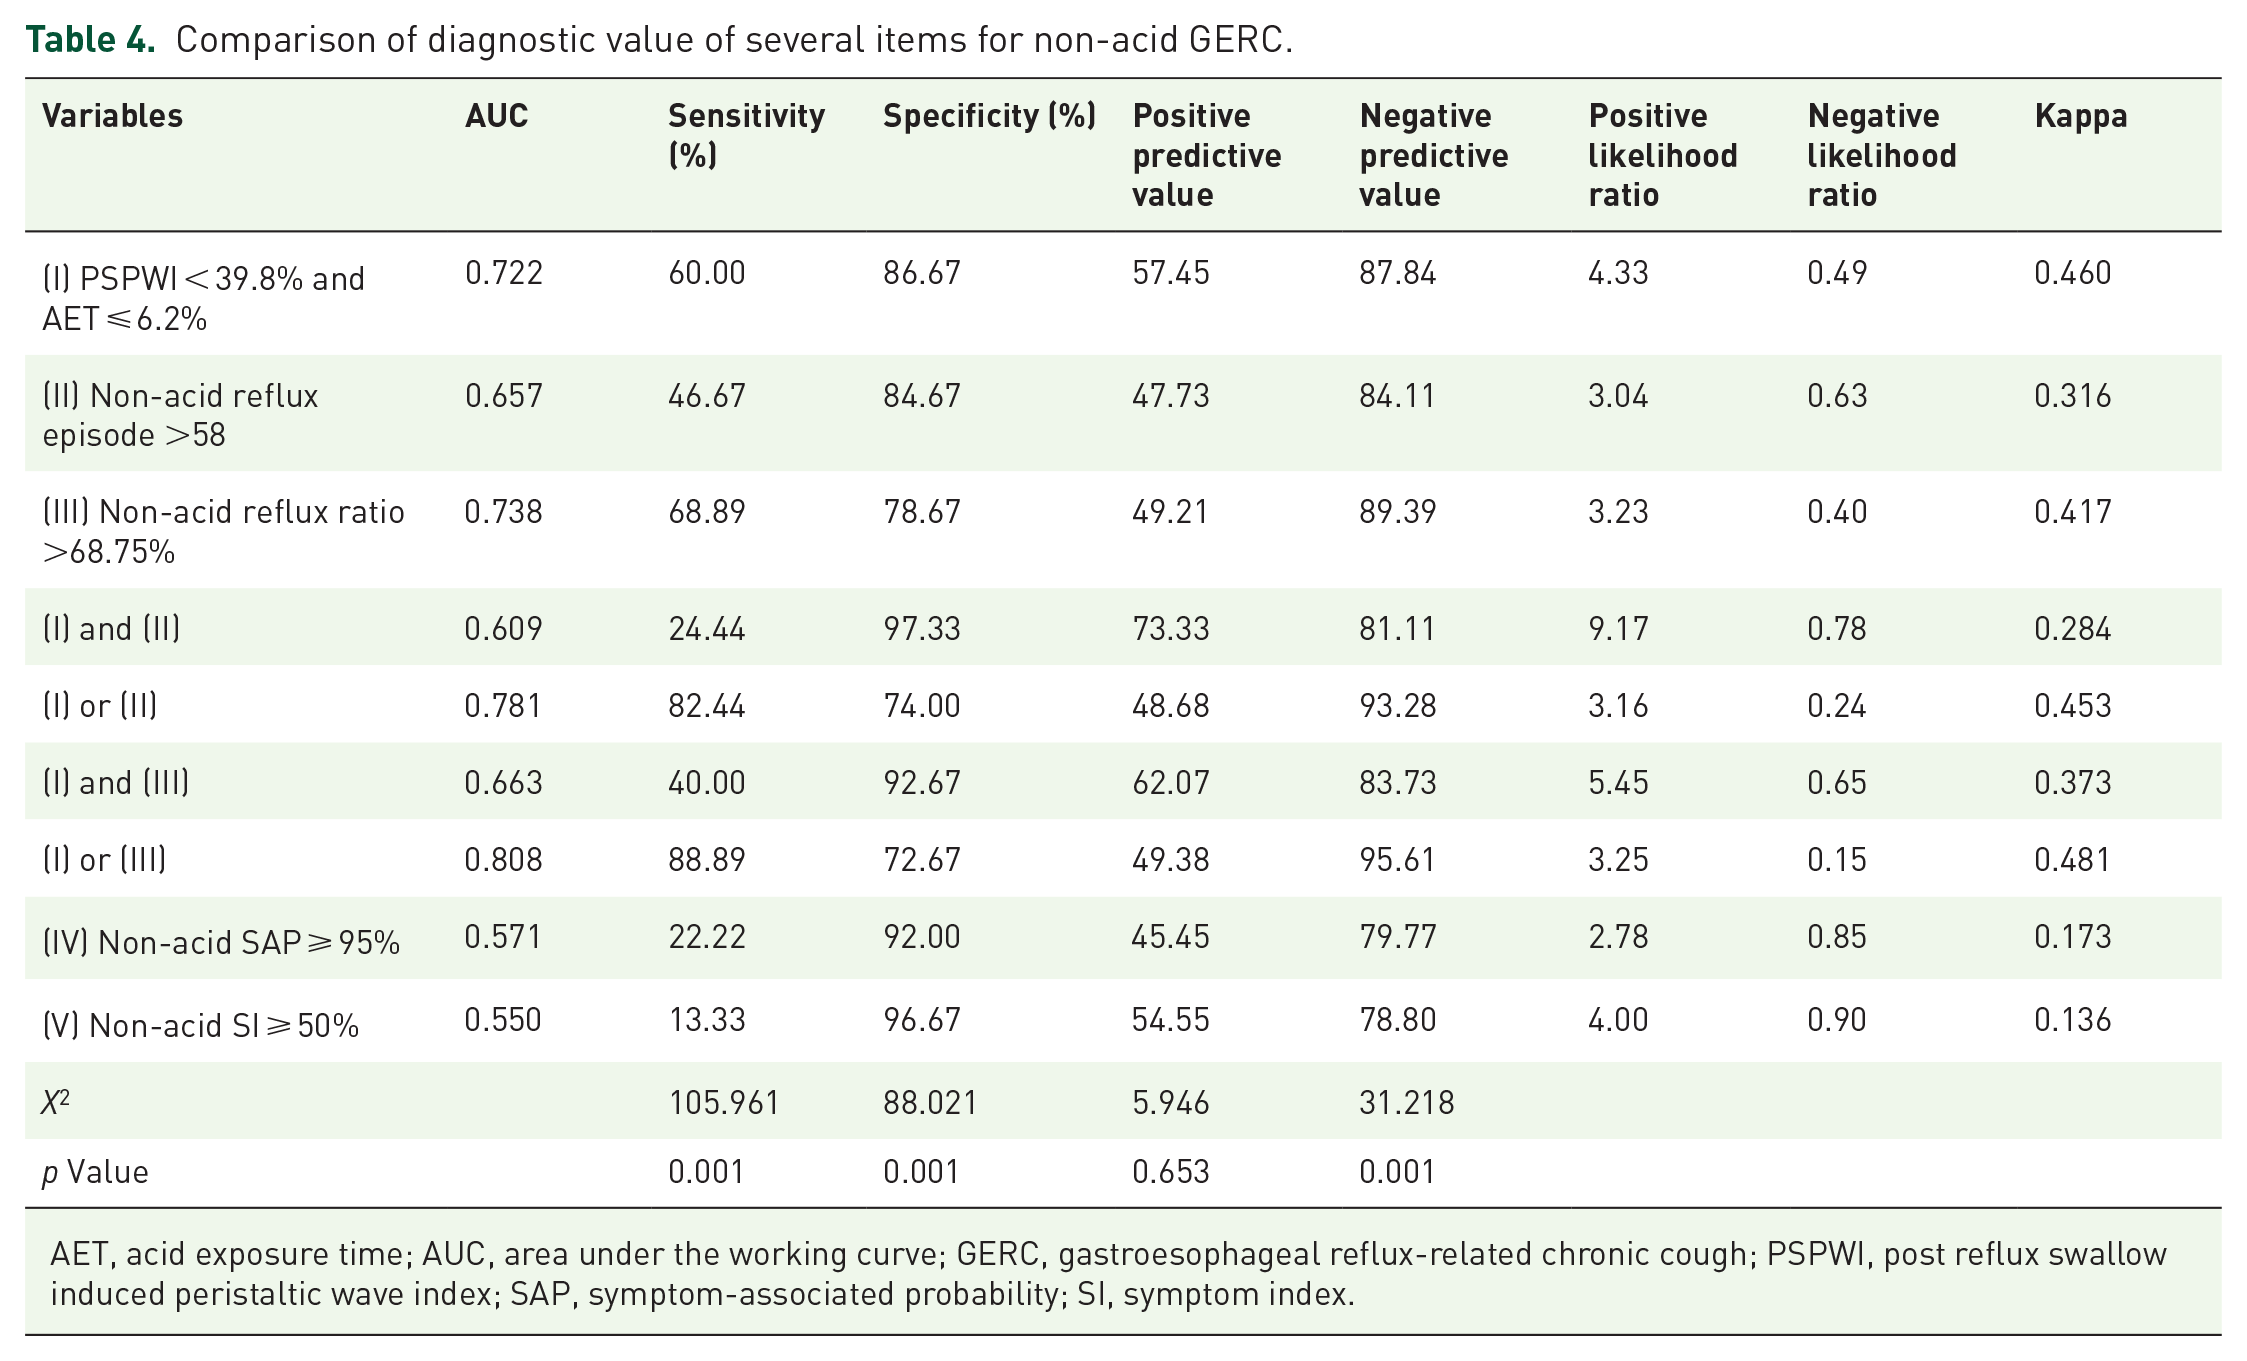
AET, acid exposure time; AUC, area under the working curve; GERC, gastroesophageal reflux-related chronic cough; PSPWI, post reflux swallow induced peristaltic wave index; SAP, symptom-associated probability; SI, symptom index.

The diagnostic value of several items for non-acid GERC.
As mentioned above, AET ⩽ 6.0% with non-acid SI ⩾ 50% or non-acid SAP ⩾ 95% are currently considered parameters for MII-pH monitoring to diagnose non-acid GERC. We used it as a diagnostic condition (VI). In terms of diagnostic value, (I) or (III) was superior to (VI) in the diagnosis of non-acid GERC (AUCROC = 0.808 versus AUCROC = 0.599, p < 0.001). Therefore, the diagnostic criteria be any of the following: (1) PSPWI < 39.8% and AET ⩽ 6.2%; and (2) non-acid reflux ratios >68.75%, which would be more advantageous in diagnosing non-acid GERC.
Discussion
This study found that GERC presented remarkedly lower PSPWI compared to non-GERC, and no significant difference was found between non-acid GERC and acid GERC. The diagnostic value of PSPWI for GERC was similar to that of AET and significantly better than that of SI and SAP. However, the diagnostic yield provided by PSPWI alone was only marginal in GERC, including acid GERC and non-acid GERC. The AET was significantly higher in the acid GERC group than in the other two groups and demonstrated good diagnostic value for acid GERC when it was over 6.2%. Based on our group’s previous discussions on AET and GERC, 10 we believe that AET > 6.2% has a high diagnostic value for acid GERC (partially confirmed by results in 3.1). For the remaining patients with AET ⩽ 6.2%, the combination of PSPWI < 39.8% may help us screen patients with non-acid GERC. The combination of AET ⩽ 6.2% and PSPWI < 39.8% had good diagnostic value for non-acid GERC and was superior to non-acid SI and non-acid SAP. Moreover, the combination with non-acid reflux ratio had a higher diagnostic value for non-acid GERC, which may facilitate the screening of non-acid GERC.
Chronic cough is one of the most special extraesophageal manifestations of GERD.1,2 Two different mechanisms may underlie the relationship between reflux and cough: the reflux pathway leading to micro-aspiration and the reflex pathway triggering vagally mediated airway reactions.1,36 Acid reflux has been the focus of most previous studies due to its determinant role in the perception of reflux-related symptoms. 37 However, recent studies have found that the acidity of the reflux is not a key factor in causing cough, and that cough can also be triggered by weak acid and weak base reflux. 38 A positive association between weak acid reflux and cough symptoms was reported in a group of patients with unexplained chronic cough. 39 These evidences suggests that non-acid reflux may also cause reflux-related symptoms and play an important role in the pathogenesis of GERC. The mechanism may involve the cough hypersensitivity caused by neurogenic airway inflammation and mast cell activation. 31 Reflux in refractory GERC with reflux-related symptoms despite PPI treatment is predominately non-acid reflux.40–42
Our previous studies have shown that the cough symptom scores and capsaicin cough thresholds were comparable in acid GERC and non-acid GERC, making it difficult to differentiate between them using cough questionnaires and capsaicin challenge test. 43 Furthermore, the improvement of cough symptoms in non-acid GERC with anti-reflux therapy is usually delayed, 43 making diagnostic treatment challenging in determining non-acid reflux. Currently, MII-pH monitoring is the main laboratory test for the diagnosis of non-acid GERC. It associates reflux with cough by identifying non-acid reflux and calculating non-acid SI and non-acid SAP based on the cough symptoms recorded on the patient’s diary card.6,7 However, it still has certain limitations. SI and SAP indicate the likelihood of reflux being associated with cough; however, their reliability has been questioned by the fact that patients often omit or mislabel the time of cough onset, and the diary cards record only 40% of the actual coughs and recorded coughs are 30 s delayed from the actual time of onset. 11 In patients evaluated for heartburn, the cardinal symptom of the typical GERD syndrome, several studies have shown the modest clinical value of SAP and SI,17,18,44,45 in agreement with our present results obtained in the clinical context of GERC. Further studies have demonstrated that the positive SI and SAP are largely subject to chance and have a high daily variability, which gives little reliable indication of the relationship between reflux and cough. 13 Therefore, the practical significance of SI and SAP in GERC remains debatable. The number and proportion of non-acid reflux episodes are the simplest and most objective parameters that can be obtained from the MII-pH, which can reflect the degree of non-acid reflux, as confirmed in this study. However, they may be affected by the total number of refluxes. In some acid GERC with a high number of refluxes, the non-acid reflux episodes can be high, whereas in some non-GERC patients with a low number of refluxes, the proportion of non-acid refluxes can be high despite the low numbers of non-acid refluxes. Thus, the number and the proportion of non-acid reflux episodes remain distinctly flawed when used individually in the diagnosis of non-acid GERC. There is no international consensus on the diagnosis of non-acid GERC, which makes it difficult for clinicians.
The main pathophysiological mechanisms of GERD previously reported include weakened anti-reflux barrier function and impaired esophageal clearance. 46 Esophageal clearance is a protective mechanism that reduces the contact time between reflux and the esophageal mucosa during reflux episodes. After the onset of reflux, most refluxate is cleared through the secondary peristaltic wave induced by esophageal traction receptors (volumetric clearance). 47 The residue passes through the lower vagus nerve of the lower esophagus mediating the esophageal-salivary gland reflex, causing a secondary swallowing peristalsis wave to swallow saliva, and neutralize gastric acid, thereby restoring the pH in lower esophagus. 46 PSPWI is a parameter that assesses esophageal clearance and a low PSPWI reflects impaired esophageal clearance function. Some studies have shown that PSPWI has certain diagnostic value in differentiating erosive reflux disease, non-erosive reflux disease, and functional heartburn. 21 Recent studies showed that an off-therapy 50% cut-off of PSPWI significantly improves the diagnostic yield of MII-pH monitoring in establishing GERD diagnosis 45 and in linking PPI-refractory symptoms to reflux, off and on PPI therapy. 44 However, evidence for its clinical use in GERC is lacking. Initially, the chemical clearance shown by PSPW was thought to be caused by significant esophageal acidification 48 ; however, subsequent studies have found that non-acid reflux, especially weak acid reflux, was equally important in causing PSPW events.49,50 In this study, both acid GERC and non-acid GERC patients presented a low PSPWI, suggesting a decreased ability in esophageal clearance, which leads to a prolonged exposure of the lower esophagus to acid or non-acid reflux. AET is highly effective in diagnosing GERD and GERC associated with acid reflux, 51 but it does not identify non-acid reflux. In this study, we used AET to exclude patients with acid GERC, and then distinguished patients with non-acid GERC from non-GERC by PSPWI, by which non-acid GERC can be further effectively diagnosed. By combining the use of PSPWI as a diagnostic indicator, we hope to compensate for the fact that AET is likely to miss the identification of GERC with predominately weak acid and weak base reflux. Compared to SI and SAP, PSPWI is more reliable for GERD diagnosis 15 ; notably, in PPI-refractory GERD PSPWI is scarcely influenced by PPI therapy 52 and by effective surgical treatment,15,53 suggesting that impairment of chemical clearance, as shown by low PSPWI values, is not only a major factor in GERD pathogenesis but also a permanent marker of PPI-refractory GERD. The main treatment for GERC is acid suppressants (preferably PPIs) alone or in combination with pro-gastrointestinal motility drugs,54,55 which can resolve most reflux-related coughs. However, nearly a third of patients,24,25 especially non-acid GERC patients, do not respond to PPI 42 and require further addition use of baclofen. 56 This may prolong the treatment time and place a heavy burden on patients. AET has long been considered as the best predictor of reflux symptoms in patients with GERD underwent PPI treatment or surgery, but its predictive value is limited because a significant proportion of PPI-responsive patients with heartburn are AET-negative. In a retrospective study 57 of the therapeutic response to PPI in patients with heartburn, multivariate logistic analysis suggested that abnormal AET and PSPWI were useful independent predictors of a good response to PPI, and PSPWI alone or in combination with other impedance parameters was superior to AET in predicting the therapeutic response to PPI. 57 Similar results have also been reported in other clinical trials. 16 In this study, PSPWI combined with AET demonstrated effective identification in patients with non-acid GERC; however, further validation is warranted to confirm the predictive value of PSPWI in the anti-reflux therapy.
Certain limitations of this study must be addressed. The PSPWI exhibits promising prospects in the diagnosis and differential diagnosis of diseases related to GERD and GERC. However, manual analysis of pH-impedance tracings is time consuming, resulting in limited use of these novel impedance metrics. Research suggests that the application of artificial intelligence models may potentially change this current situation by enabling accurate measurements of reflux episodes and PSPWs. 58 However, further promotion and validation of these models are still required. In the future, we will further optimize the method of data collection and design a prospective study to further verify the conclusions of this study.
Conclusion
PSPWI is a new parameter with good diagnostic value for GERC. Combining PSPWI < 39.8% and AET ⩽ 6.2% as a diagnostic indicator helps to screen non-acid GERC, and further combination with the proportion of non-acid refluxes may optimize the diagnostic yield of MII-pH monitoring.
Supplemental Material
sj-docx-1-tar-10.1177_17534666231220819 – Supplemental material for Post-reflux swallow-induced peristaltic wave index: a new parameter for the identification of non-acid gastroesophageal reflux-related chronic cough
Supplemental material, sj-docx-1-tar-10.1177_17534666231220819 for Post-reflux swallow-induced peristaltic wave index: a new parameter for the identification of non-acid gastroesophageal reflux-related chronic cough by Bingxian Sha, Wanzhen Li, Haodong Bai, Tongyangzi Zhang, Shengyuan Wang, Linyang Wu, Wenbo Shi, Yiqing Zhu, Li Yu and Xianghuai Xu in Therapeutic Advances in Respiratory Disease
Footnotes
References
Supplementary Material
Please find the following supplemental material available below.
For Open Access articles published under a Creative Commons License, all supplemental material carries the same license as the article it is associated with.
For non-Open Access articles published, all supplemental material carries a non-exclusive license, and permission requests for re-use of supplemental material or any part of supplemental material shall be sent directly to the copyright owner as specified in the copyright notice associated with the article.