
Abstract
Introduction:
Pulmonary hypertension (PH) due to left-sided heart disease (Group 2 PH) is most commonly due to passive backward transmission of elevated left-sided heart pressures. A subgroup of these patients develop pulmonary artery remodeling, resulting in systolic and mean pulmonary artery pressures that are ‘reactive’ or ‘out of proportion’ to the elevated left-sided heart pressures. These patients have historically been identified by a transpulmonary gradient (TPG) > 12 mmHg. However, since diastolic pulmonary artery pressures are less susceptible to changes in pulmonary blood flow, a diastolic pulmonary gradient (DPG) ⩾ 7 mmHg may be a superior indicator of worse clinical function and prognosis.
Methods:
Based on measurements from a right-heart catheterization (RHC) database (Baylor College of Medicine, Houston, TX, USA), comparisons of several clinical parameters were made among three Group 2 PH patients: normal TPG and DPG (Group 2A), elevated TPG and normal DPG (Group 2B), and elevated TPG and DPG (Group 2C).
Results:
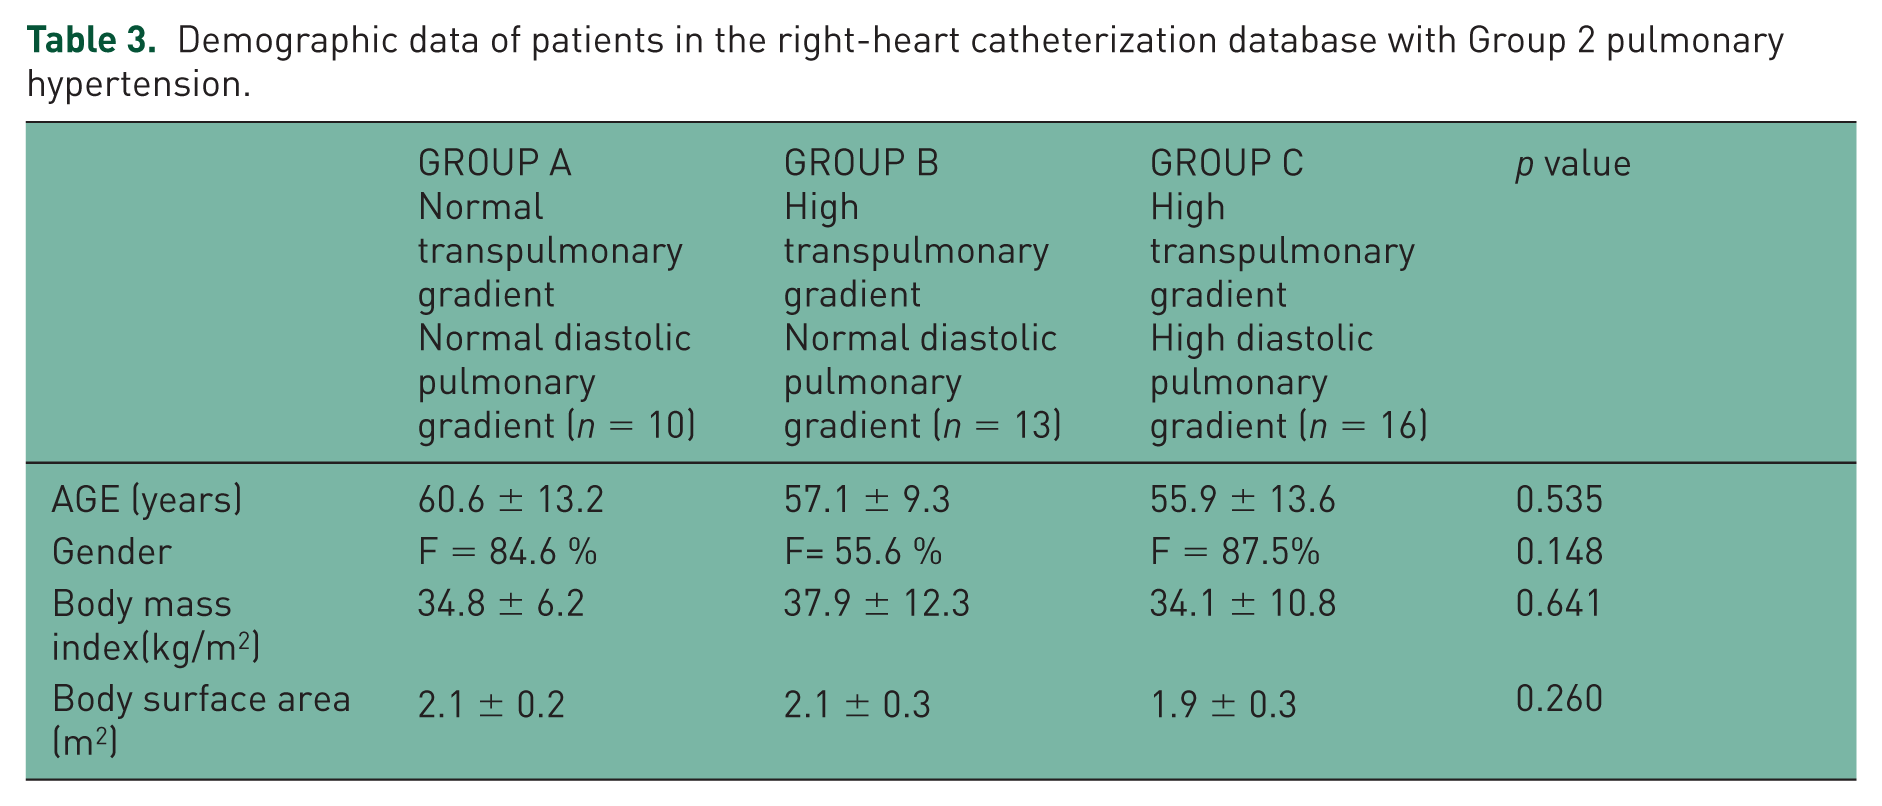
Among 173 RHCs, 39 were found to have Group 2 PH. Among these 39 cases, 10 (32%), 13 (32%), and 16 (36%) cases were categorized into Groups 2A, 2B, and 2C, respectively. Group 2C patients had significantly worse 6-min walk distance (308 ± 69 m) than Group 2A (425 ± 81 m) and Group 2B (350 ± 103 m) (p = 0.038). There was no significant difference in cardiac output, cardiac index, and right atrial pressure among the three subgroups.
Discussion:
Among patients with Group 2 PH, elevated DPG proved to be a more specific indicator of worse functional status than the historically used TPG. International guidelines and protocols for performing RHC for the assessment and diagnosis of PH should include the measurement of DPG.
Keywords
Introduction
Pulmonary hypertension (PH) is characterized by increased vascular resistance across the pulmonary vascular bed usually as a result of vascular remodeling. It is defined by a mean pulmonary artery pressure (PAP) of ⩾ 25 mmHg at rest. Group 1 PH includes those patients who also have a pulmonary arterial wedge pressure (PAWP) of ⩽ 15 mmHg [Hoeper et al. 2013]. PH due to left-heart disease (Group 2 PH) is defined by a combination of mean PAP ⩾ 25 mmHg, PAWP > 15 mmHg, and a normal or reduced cardiac output (CO) [Vachiéry et al. 2013]. It is most often characterized by postcapillary changes as a result of increased pulmonary venous congestion that may be amenable to correction after the cause of left-heart disease has resolved. Over time, the venous congestion of a chronically elevated PAWP from left-sided heart disease, through a number of proposed complex mechanisms, appears to induce an additional secondary increase in mean PAP by way of vascular remodeling [West and Mathieu-Costello 1995; Kerem et al. 2010]. The term ‘reactive’ or ‘out-of-proportion’ PH has historically been used to describe these patients, and has been defined quantitatively by a transpulmonary gradient (TPG) (mean PAP – PAWP) of > 12 mmHg [Galiè et al. 2009]. Another pertinent hemodynamic parameter is the diastolic pulmonary gradient (DPG), which is defined as the difference between the pulmonary artery diastolic pressure and PAWP. Hemodynamic analyses have indicated that DPG can distinguish between pulmonary and cardiac disease [Stevens, 1975], and might be a better indicator of pulmonary vascular disease since it is less sensitive to changes in cardiac pressures and flows than the often used TPG [Naeije et al. 2013; Capomolla et al. 2000]. PH due to left-heart disease is an increasingly common form of PH [Ghio et al. 2001; Lam et al. 2009], and is also an indicator of elevated mortality among patients with left-sided heart disease [Aronson et al. 2011], similar to those with PH in the setting of chronic lung disease such as pulmonary fibrosis and chronic obstructive pulmonary disease [Patel et al. 2007; Thabut et al. 2005]. Despite the suggested physiologic superiority of DPG versus TPG in indicating severity of pulmonary vascular disease in Group 2 PH patients, analyses of the clinical implications of an elevated DPG versus TPG are sparse. The purpose of this analysis was to determine the clinical significance of an elevated DPG, defined as being ⩾ 7 mmHg, among patients with Group 2 PH.
Methods
Hemodynamic data were obtained from the right-heart catheterizations (RHCs) of patients referred for PH evaluation. All consecutive patients undergoing RHC at Baylor College of Medicine (Houston, TX, USA), both outpatient and inpatient, between 2001 and 2007 were included in the study. RHCs were performed by one of two pulmonary hypertension experts during the study period. Baseline demographic data, hemodynamic data, suspected etiology of PH, and outcomes data were collected. Patient data were excluded if profiles had inadequate data, or diagnoses of portopulmonary hypertension, congenital heart disease with intracardiac shunts, pulmonary veno-occlusive disease, or exercise-induced PH. A total of 173 patients underwent RHC, but 40 patients were removed from analysis due to having normal hemodynamics, incomplete data, exercised-induced PH, porto-pulmonary hypertension, pulmonary veno-occlusive disease, or congenital heart disease (Figure 1). Based on clinical and hemodynamic parameters, patients were categorized as normal, or having one of the five groups of PH, according to international PH guidelines [Hoeper et al. 2013]. Patients with PH and PAWP ⩽ 15 mmHg at rest, but with exercise-induced PAWP > 15 mmHg, were included and analyzed as having Group 2 PH. Among those who had exercise-induced Group 2 PH, hemodynamic values during exercise were used for analysis. Among those categorized as having Group 2 PH, patients were further subcategorized as: Group 2A (normal TPG and normal DPG), Group 2B (elevated TPG and normal DPG), or Group 2C (elevated TPG and elevated DPG). Pulmonary artery compliances (PAC) were measured by dividing the stroke volume (CO divided by heart rate) by the pulmonary artery pulse pressure (pulmonary artery systolic minus diastolic pressure).

Breakdown of right-heart catheterization data into pulmonary hypertension groups.
Statistical analysis
The means of basic demographic, hemodynamic, and clinical parameters were calculated for each group and subgroup of PH and then compared for statistically significant differences (data are presented as mean ± standard deviation). Significance testing was performed using the Mann–Whitney/Wilcoxon signed-rank test, with p values < 0.05 considered to be statistically significant. For Group 2 PH patients, Spearman’s rank correlation coefficient/linear regression was used to determine the correlation between pulmonary vascular resistance (PVR) and DPG, and PVR and TPG. All statistical analyses were performed using Epi Info 7.1.20.
Results
A total of 133 patients were included in the analysis and placed into PH Groups 1–5: 80 patients were categorized as Group 1 PH, 39 as Group 2 PH, and 14 combined into Groups 3–5 PH. The basic demographics of each group are described in Table 1. Approximately one-third (14 out of 39, 35.9%) of the patients with Group 2 PH met such criteria based on exercise-induced hemodynamic measurements. (Exercise testing included having patients perform 3–5 min of recumbent cycling, in order to achieve an increase in heart rate of 30–40 beats/min above baseline.) When comparing the basic demographics of patients among groups with normal hemodynamics (n = 20), Group 1 PH (n = 80), Group 2 PH (n = 39), and Groups 3–5 PH (n = 14), there was a significant difference in age, gender, and body mass index (BMI)/body surface area (BSA) (Table 1). Table 2 shows the hemodynamic and clinical data of patients in the database that had normal hemodynamics or had Group 1 PH or Group 2 PH. Among those with Group 2 PH, 10, 13, and 16 patients had hemodynamic values consistent with Groups 2A, 2B, and 2C, respectively (Table 3). Among the subgroups of Group 2 PH, there was no significant difference in age, gender, or BMI/BSA. When comparing the hemodynamic parameters among the three subgroups of Group 2 PH patients, there was no significant difference in heart rate, blood pressure, or right atrial pressure (Table 4). However, those with elevated TPG and DPG designated as Group 2C had significantly higher pulmonary pressures and PVR (consistent with definition of these two parameters). There was no difference in PAWP, CO/cardiac index (CI), left ventricular ejection fraction (LVEF), or mixed venous saturation (SvO2). Group 2C patients had significantly worse 6-min walk distance (6MWD) (308 ± 69 m) than Group 2A (425 ± 81 m) and Group 2B (350 ± 103 m) (p = 0.038). Although there was a trend towards Group 2C patients having a lower PAC, it did not reach statistical significance. The mean DPG among Group 2C patients was 13.6 ± 6.4. Figure 2 demonstrates that among Group 2 PH patients in the RHC database, there was a significant correlation between PVR and both DPG and TPG. The correlation between PVR and DPG was stronger than that between PVR and TPG.
Demographic data of patients in the right-heart catheterization database.

Hemodynamic and clinical data of patients in the right-heart catheterization database.

Demographic data of patients in the right-heart catheterization database with Group 2 pulmonary hypertension.
Hemodynamic and clinical data of patients in the right-heart catheterization database with Group 2 PH.

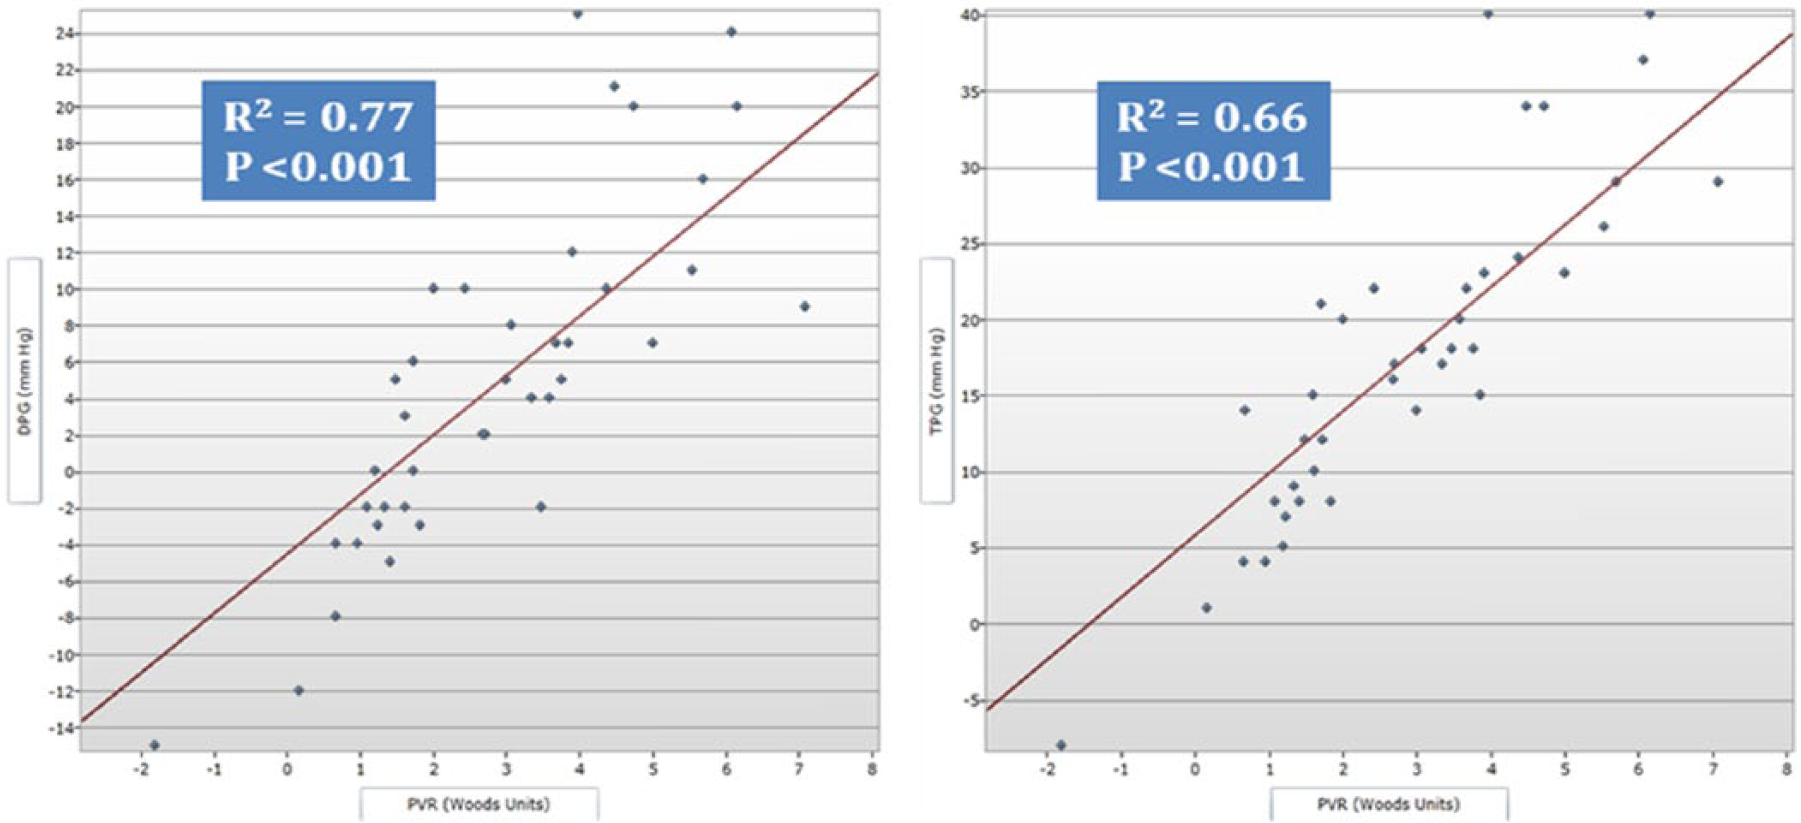
Correlation between pulmonary vascular resistance and diastolic pulmonary gradient versus transpulmonary gradient among pulmonary hypertension Group 2.
Discussion
This analysis indicates that in patients with Group 2 PH, DPG is a more specific indicator of worse clinical performance status compared with TPG, as demonstrated specifically by correlating with a significantly lower 6MWD. Despite the historical concerns about lack of consistency and specificity of the 6MWD as a testing modality, it remains one of the most important parameters for managing and monitoring disease severity in patients with PH. This superiority of DPG over TPG is significant because, among Group 2 PH patients, TPG has historically been a primary indicator of severity of disease and an identifier of patients who also have a component of precapillary PH.
DPG also showed other unique and important characteristics. For example, when compared with patients with only elevated TPG, patients with an elevated DPG exhibited similar vascular dynamics to Group 1 PH patients in terms of PVR and pressure gradients. Those with a high DPG had a significantly higher PVR than other Group 2 PH patients, but otherwise had similar hemodynamics (PAWP, CO/CI, SvO2, and LVEF).
In addition, based on the DPG range in our Group 2C patients (95% confidence interval 7.2–20.0 mmHg), a gradient ⩾ 7 mmHg appears to be an appropriate cutoff for specifying an elevated DPG. This cutoff is consistent with recently updated international guidelines [Vachiéry et al. 2013], which are partly based on a previous report indicating the same DPG-level cutoff as predictive of elevated mortality [Gerges et al. 2013].
One limitation cited in the recently updated guidelines for using DPG was that no patients with elevated DPG but normal TPG were available for analysis. However, our study addresses this concern in that there were no patients in this database with an elevated DPG but a normal TPG. This indicates that a high DPG reflects severity of disease along a spectrum in Group 2 PH patients, as opposed to an independent pathologic entity. Although these findings need to be confirmed with future studies, we recommend that DPG be routinely measured during RHCs and used for the identification of Group 2 PH patients with pre- and postcapillary PH.
The limitations of this study include the inherent and well-known challenges of measuring hemodynamics during RHCs, even when performed by experts. Also, due to the retrospective methodology of this analysis, the duration, severity of disease, suspected etiology, and treatment regimens could not be prospectively evaluated or adjusted for completely. In addition, in reference to using exercise-induced measurements, exercise challenges were not routinely performed during all RHCs, and it is possible that among Group 2 PH patients, those that also have exercise-induced precapillary disease may not be the same as those with similar pathophysiology at rest.
Footnotes
Acknowledgements
Part of this study was presented at the American Thoracic Society Meeting, San Diego 2014 as an abstract format.
Conflict of interest statement
The authors declare no conflicts of interest in preparing this article.
Funding
This research received no specific grant from any funding agency in the public, commercial, or not-for-profit sectors.