
Abstract
Background
Globally, colorectal cancer (CRC) is among the most prevalent malignant tumors. It is characterized by unlimited proliferation, invasion, and metastasis. MicroRNA-126 (miR-126) has been shown in many studies to play a significant role in CRC, but data regarding its role in CRC Egyptian patients are limited.
Objectives
This case-control study aimed to investigate the miR-126 as a potential marker in CRC Egyptian patients and to correlate its expression levels with CRC tumor, node, metastasis (TNM) stage, distant metastasis, and tumor size.
Methods
The study included 50 adult Egyptian participants (30 patients with CRC, 10 patients with colorectal adenoma as a pathological control, and 10 healthy controls). MiR-126 expression levels were detected using Real-Time Quantitative PCR (qPCR) along with the endogenous reference gene hsa-miR-103a in all participants.
Results
MiR-126 expression was significantly decreased in CRC patients than both control groups. It was associated with advanced TNM stage (p = 0.001) and distant metastasis (p = 0.002). However, it was not correlated with tumor size (p = 0.980), carcinoembryonic antigen (CEA) (p = 0.397), and cancer antigen 19-9 (CA19-9) (p = 0.236). The best cut-off point of miR-126 to discriminate CRC from both controls was 0.7 and to discriminate metastatic CRC from non-metastatic CRC was 0.3.
Conclusions
Our results suggest that miR-126 could be used as an early marker for CRC detection among Egyptian patients and a good prognostic indicator associated with metastasis.
Introduction
Globally, colorectal cancer (CRC) is the third most frequent malignancy, with the second-highest death rate of 50–60%.1,2 Patients with CRC are being diagnosed at younger ages these days. 3 In Egypt, approximately 6.5% of all diagnosed malignant tumors are CRCs. 4 The stage status typically determines the prognosis of CRC patients. Therefore, early CRC identification has become a primary worldwide concern to lower its high death rate. 1 Nowadays, there are multiple methods for screening for CRC, including colonoscopy and the fecal occult blood test (FOBT). Although FOBT is inexpensive and non-invasive, its sensitivity to CRC is restricted. 5 Given its high specificity of over 95%, colonoscopy is considered the gold standard for CRC screening. However, it is an invasive procedure that necessitates intestinal preparation and can occasionally result in serious complications. 6 Moreover, established serum tumor markers for CRC, carcinoembryonic antigen (CEA), and cancer antigen 19–9 (CA19-9), have only limited value in early cancer detection. 7 Therefore, finding practical, non-invasive biomarkers to aid in proper diagnosis and therapy is essential.
MicroRNAs (miRNAs) are short (18–22 nucleotides), endogenous, non-coding RNAs, crucial for controlling target gene post-transcriptional activity, and have a role in the etiology of several malignancies, including CRC. Because of their good stability, easy accessibility (in blood and body fluids), and differences in the expression level between normal and cancerous tissues, miRNAs can be employed as non-invasive biomarkers in CRC. 2 MiR-126 is located within the intron 7 of the epidermal growth factor (EGF)-like domain 7 (EGFL7) gene. Depending on the type of cancer, it has been demonstrated to have both oncogenic and tumor suppressor functions. Through its negative regulation of cell survival, invasion, migration, and proliferation, it can inhibit the advancement of cancer. 8 In contrast, miR-126 can function as an oncogene and may also contribute to the advancement of cancer by stimulating the development of blood vessels and inflammation at the activation site. 7 Several studies investigated the function of miR-126 in cancers, including CRC, but the results were conflicting. Since data regarding miR-126 in CRC Egyptian population are limited, the current study aimed to examine the clinical relevance of miR-126 as a potential marker in CRC Egyptian patients and to correlate its expression levels with CRC clinicopathological features.
Methodology
Sample size calculation
Using the PASS 15 program for sample size calculation, setting power at 80% and alpha error at 0.05, and according to Yan et al. 2016, 9 miR-126 has an area under the receiver operating characteristic (ROC) curve of 0.77 for differentiation between CRC and healthy controls. A sample size of 30 CRC cases and 10 controls was needed to detect the diagnostic ability of the marker.
Study participants
This case-control study was conducted on 50 adult Egyptian participants (30 patients with CRC, 10 patients with colorectal adenoma as a pathological control, and 10 healthy controls). The three study groups were matched in age and gender. Diagnosis of CRC and adenoma was based on histopathologic examination of colonoscopy-guided biopsy. CRC staging was done according to the American Joint Committee on Cancer (AJCC) tumor, node, metastasis (TNM) staging system. 10 Patients who treated with chemotherapy or radiotherapy and those who had other types of malignancy were excluded from this study. All participants were subjected to full history taking, clinical examination, and appropriate radiological investigations. Table 1 displays the demographic and clinical details of all participants.
Demographic and clinical characteristics of the study groups.
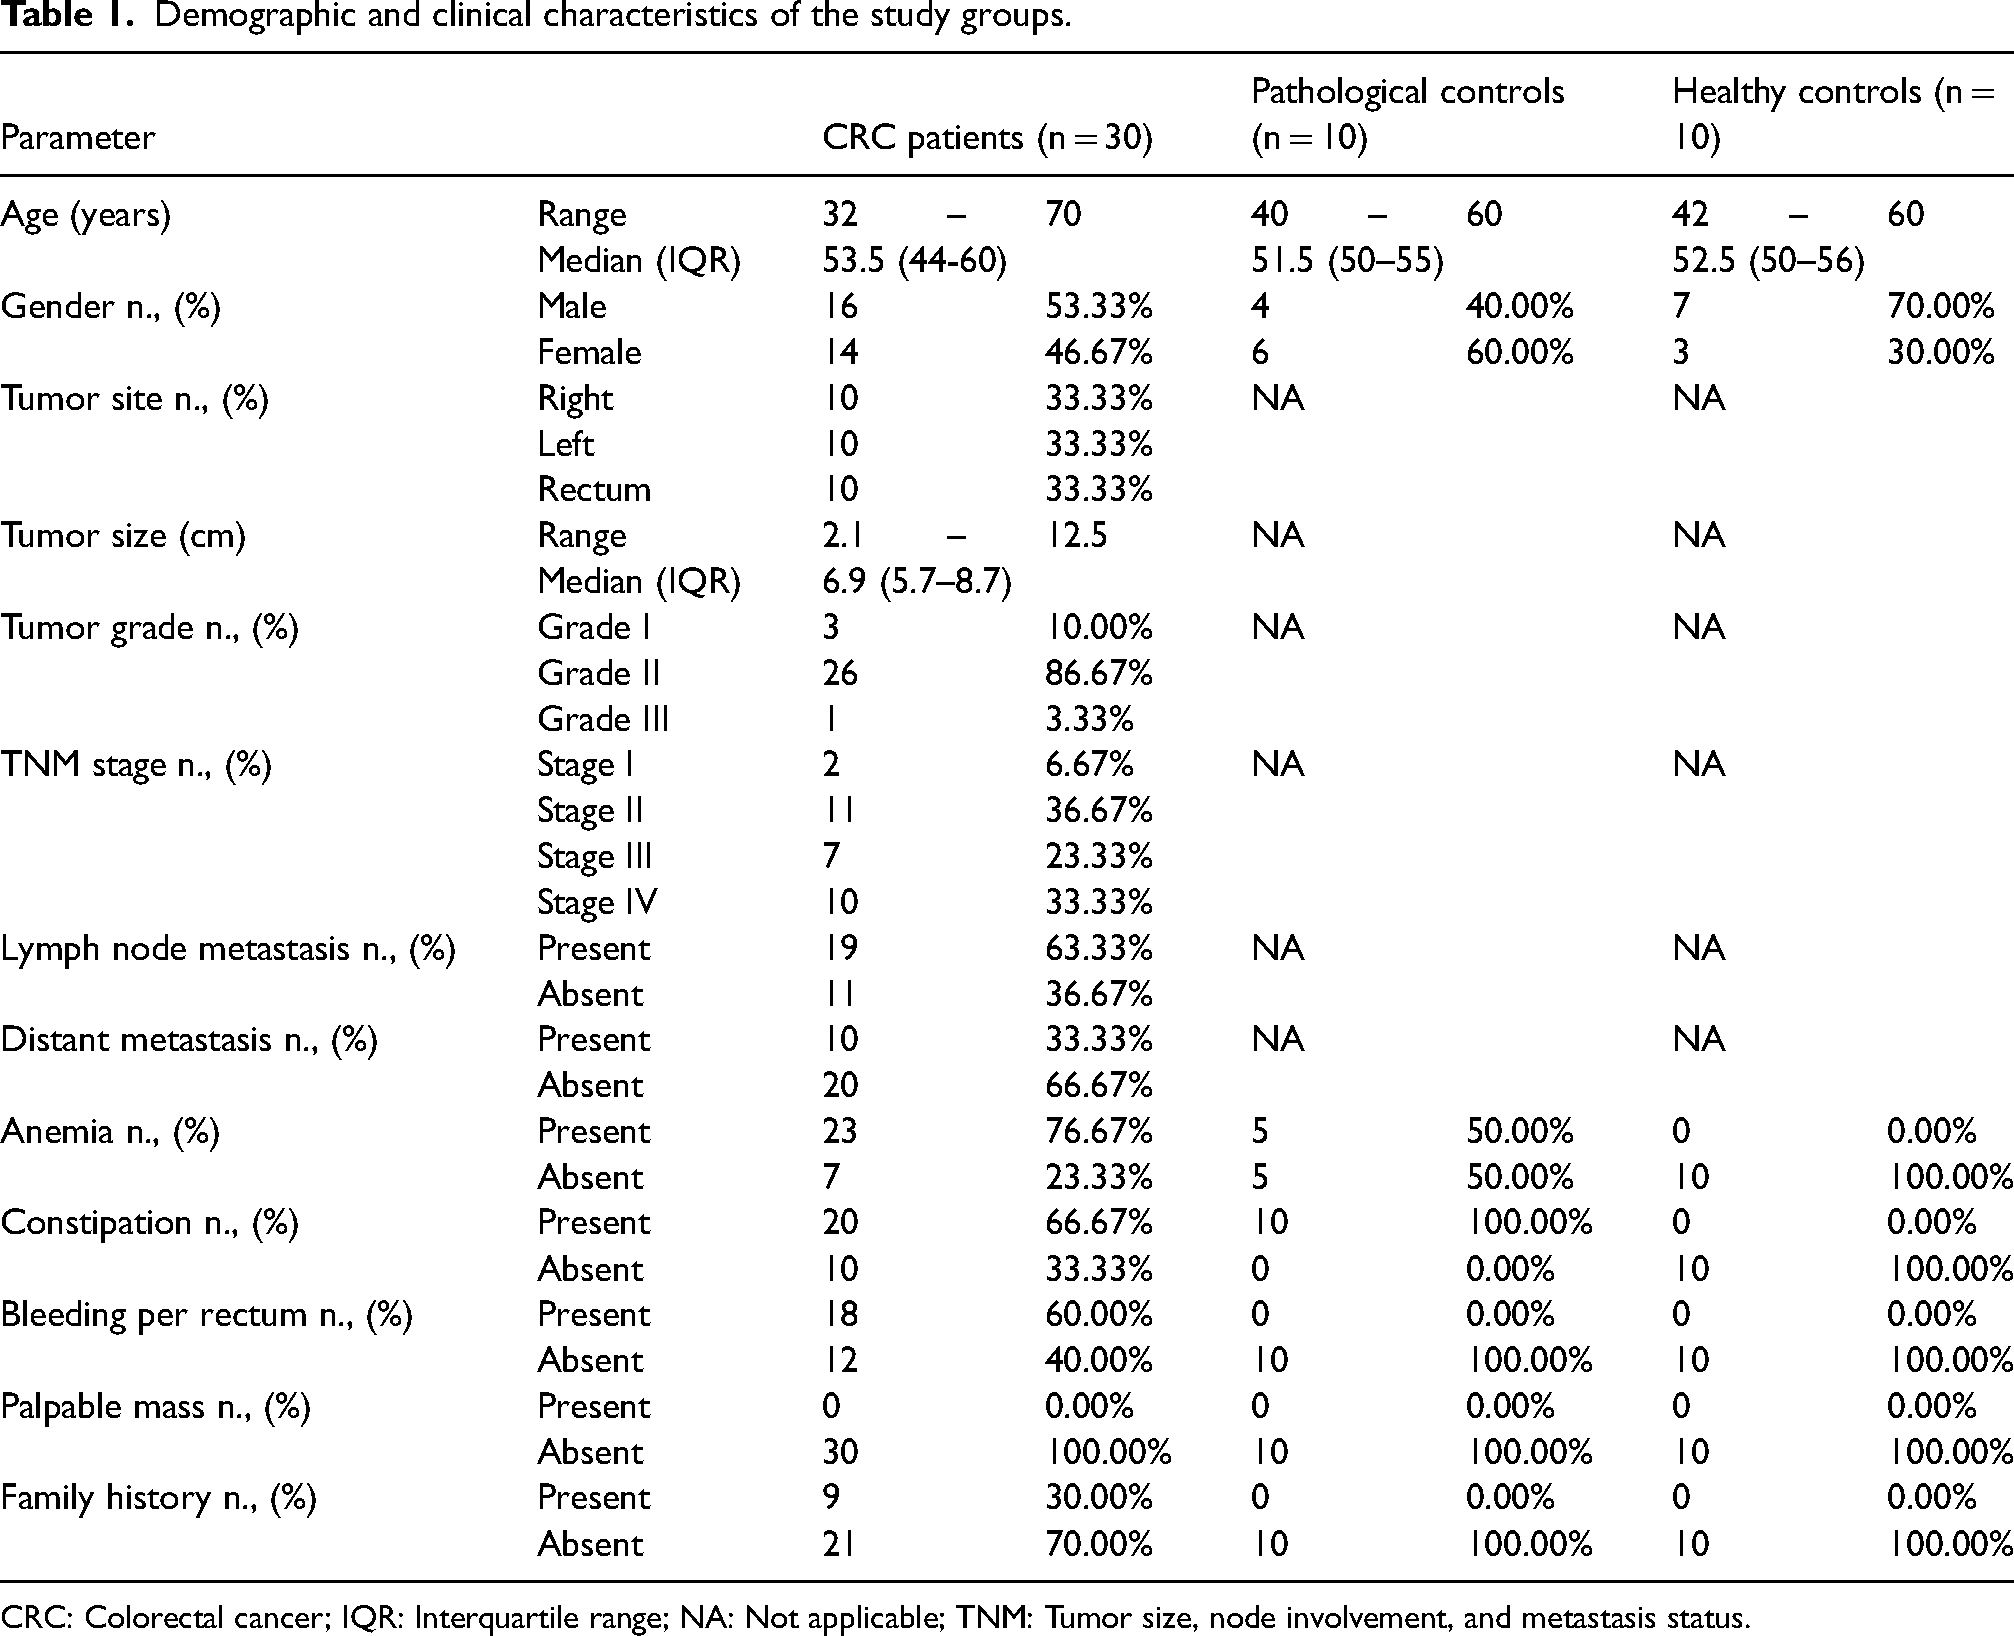
CRC: Colorectal cancer; IQR: Interquartile range; NA: Not applicable; TNM: Tumor size, node involvement, and metastasis status.
Before the study began, each participant gave their written, informed consent. The Research Ethics Committee, Faculty of Medicine, Ain Shams University, Cairo, Egypt, approved the project under IRB permission number FMASU R132/2024.
Blood sampling
Five milliliters of venous blood were withdrawn from each participant under complete aseptic precautions and divided as follows: 2 ml blood was dispensed into a gel vacutainer tube in which the blood was centrifuged after complete clotting at 4000 rpm for 10 min, and the separated serum was used for the measurement of CEA and CA19-9 tumor markers using Cobas e411 analyzer (Roche Diagnostics, Switzerland). The remaining 3 ml of blood was dispensed into an EDTA vacutainer tube for the PCR analysis. Double centrifugation was performed within 1 h of collection of the EDTA samples. The initial centrifugation was at 1900×g for 10 min, and the plasma supernatant that was produced was cautiously collected into a different plain, sterile tube and exposed to a second centrifugation at 16,000×g for 10 min. Plasma was stored frozen at −80 °C until miRNA extraction.
MiRNA extraction
Using the miRNeasy serum/plasma Kit (Qiagen, Germany), miRNA was extracted from 200 µL of plasma in accordance with the manufacturer's instructions.
Reverse transcription PCR (Rt-PCR) and mir-126 real-time quantitative PCR (qPCR)
MiRCURY Locked Nucleic Acid (LNA) miRNA PCR Starter Kit (Cat. No.:339320, Qiagen, Germany) was used for both reverse transcription reaction to complementary DNA (cDNA) and amplification of the target miR-126 and the endogenous reference gene hsa-miR-103a.
The reverse transcription reaction was set to 10 µL total volume as follows: 2 µl of 5x miRCURY SYBR® Green RT Reaction Buffer, 1 µL of 10x miRCURY RT Enzyme Mix, 2 µL of extracted RNA and 5 µL of RNase-free water. The RT-mixture reaction was then incubated at 42 °C for 60 min, followed by an inactivation reaction at 95 °C for 5 min and a final hold at 4 °C. The obtained cDNA was then diluted at 1:30 prior to the qPCR reaction.
Two qPCR reaction sets were done for each cDNA sample. The first reaction set was for amplification of the target miR-126, and the second reaction set was for amplification of the reference gene hsa-miR 103a. Each reaction set was according to the following protocol: 5 µL of 2x miRCURY SYBR® Green Master Mix, 1 µL of resuspended LNA primer assay, 3 µL of cDNA (diluted 1:30) and 1 µL of RNase-free water to form 10 µL final reaction volume.
DT-Lite Real-Time PCR system (DNA technology, Russia) was used for amplification according to the following protocol: initial heat activation at 95 °C for 2 min followed by 40 cycles of denaturation at 95 °C for 10 s and annealing/extension at 56 °C for 60 s. Finally, miR-126 expression was normalized to hsa-miR-103a expression, and relative quantification in each sample was calculated using the delta-delta Ct (2−ΔΔCT) method.
Statistical methodology
With IBM SPSS statistics (V. 22.0, IBM Corp., USA), data analysis was carried out. For qualitative data, numbers and percentages were displayed; for numerical non-parametric data, the median and interquartile range (IQR) were used. The Mann-Whitney and Kruskal-Wallis tests were used to compare the groups. To evaluate the correlation between the variables, Spearman's rank correlation coefficient (rs) was employed. Plotting the ROC curve allowed for the evaluation of the diagnostic ability of miR-126. The significance level was at p < 0.05.
Results
Comparison of CEA, Ca 19-9 and mir-126 between the three studied groups
Between the three groups under study, there was a significant variation in CEA levels (p = 0.002), CA19-9 levels (p = 0.001), and miR-126 expression levels (p = 0.001). Regarding CEA and CA19-9, post hoc analysis revealed a significant increase in CRC patients than healthy controls (median (IQR) CEA: 2.4 (1.7–4.1) vs 1.00 (0.5–1.9) ng/mL and CA19–9: 10.85 (8.7–15.4) vs 6.5 (3.5–7.9) U/mL; p = 0.001 for both). On the other hand, there were no significant differences in CEA and CA19-9 levels between CRC patients and the pathological controls (p = 0.065 and 0.057, respectively), as well as between the pathological controls and the healthy ones (p = 0.096 and 0.058, respectively). In the pathological control group, the median (IQR) CEA was 1.6 (1.2–2.5) ng/mL and the median (IQR) CA19-9 was 8.65 (7–10) U/mL (Figure 1(a) and (b)).
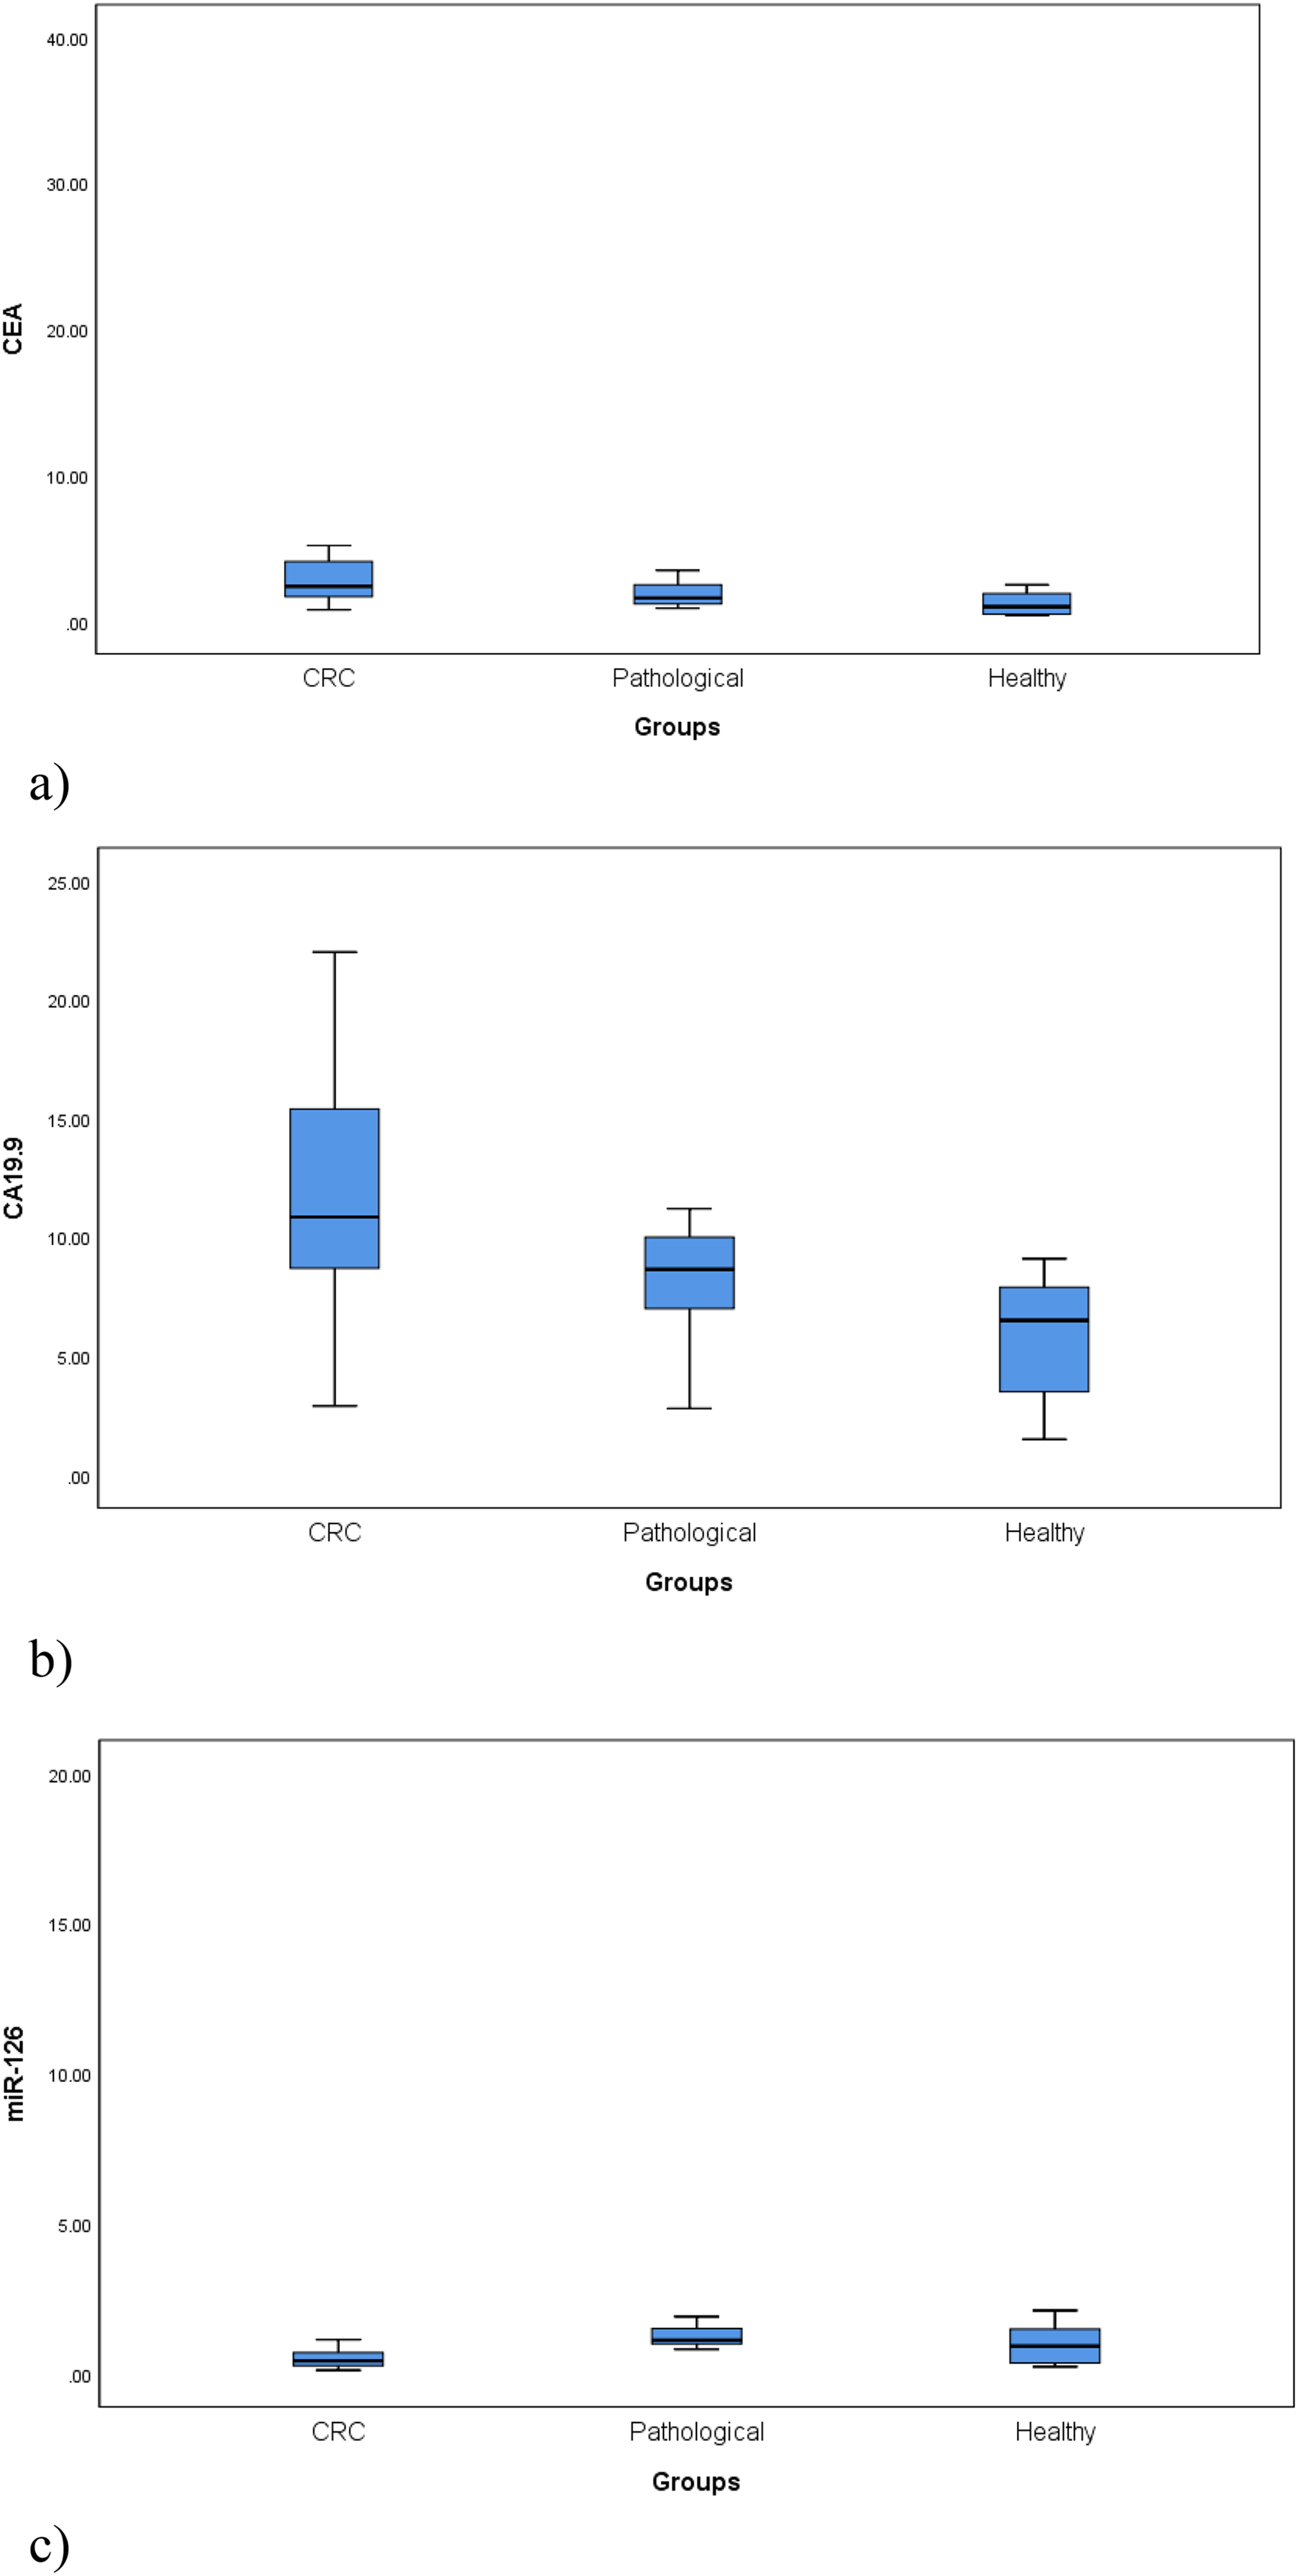
Comparison of (a) CEA levels (ng/mL), (b) CA19-9 levels (U/mL) and (c) miR-126 expression levels between the three studied groups. (a) p-value = 0.002. (b) p-value = 0.001. (c) p-value = 0.001.
Regarding miR-126, significantly lower levels were observed in CRC patients compared to the healthy controls (median (IQR): 0.43 (0.26–0.7) vs 0.92 (0.35–1.48); p = 0.045) and the pathological controls (median (IQR): 0.43 (0.26–0.7) vs 1.12 (0.99–1.5); p < 0.001). No significant difference in miR-126 was found between the pathological controls and the healthy ones (p = 0.290) (Figure 1(c)).
Comparison of CRC patients according to TNM stage
We compared CEA, CA19–9 levels, and miR-126 expression levels among CRC patients according to the TNM stage. Levels of CEA and CA19-9 were significantly higher in the CRC patients in late stages (stages III and IV) than those in early stages (stages І and II) (median (IQR) CEA: 3.30 (2.60–20.40) vs 1.70 (1.50–2.10) ng/mL; p = 0.001 and median (IQR) CA19-9: 13.80 (10.90–17.60) vs 7.90 (4.70–9.40) U/mL; p < 0.001) (Figure 2(a) and (b)).
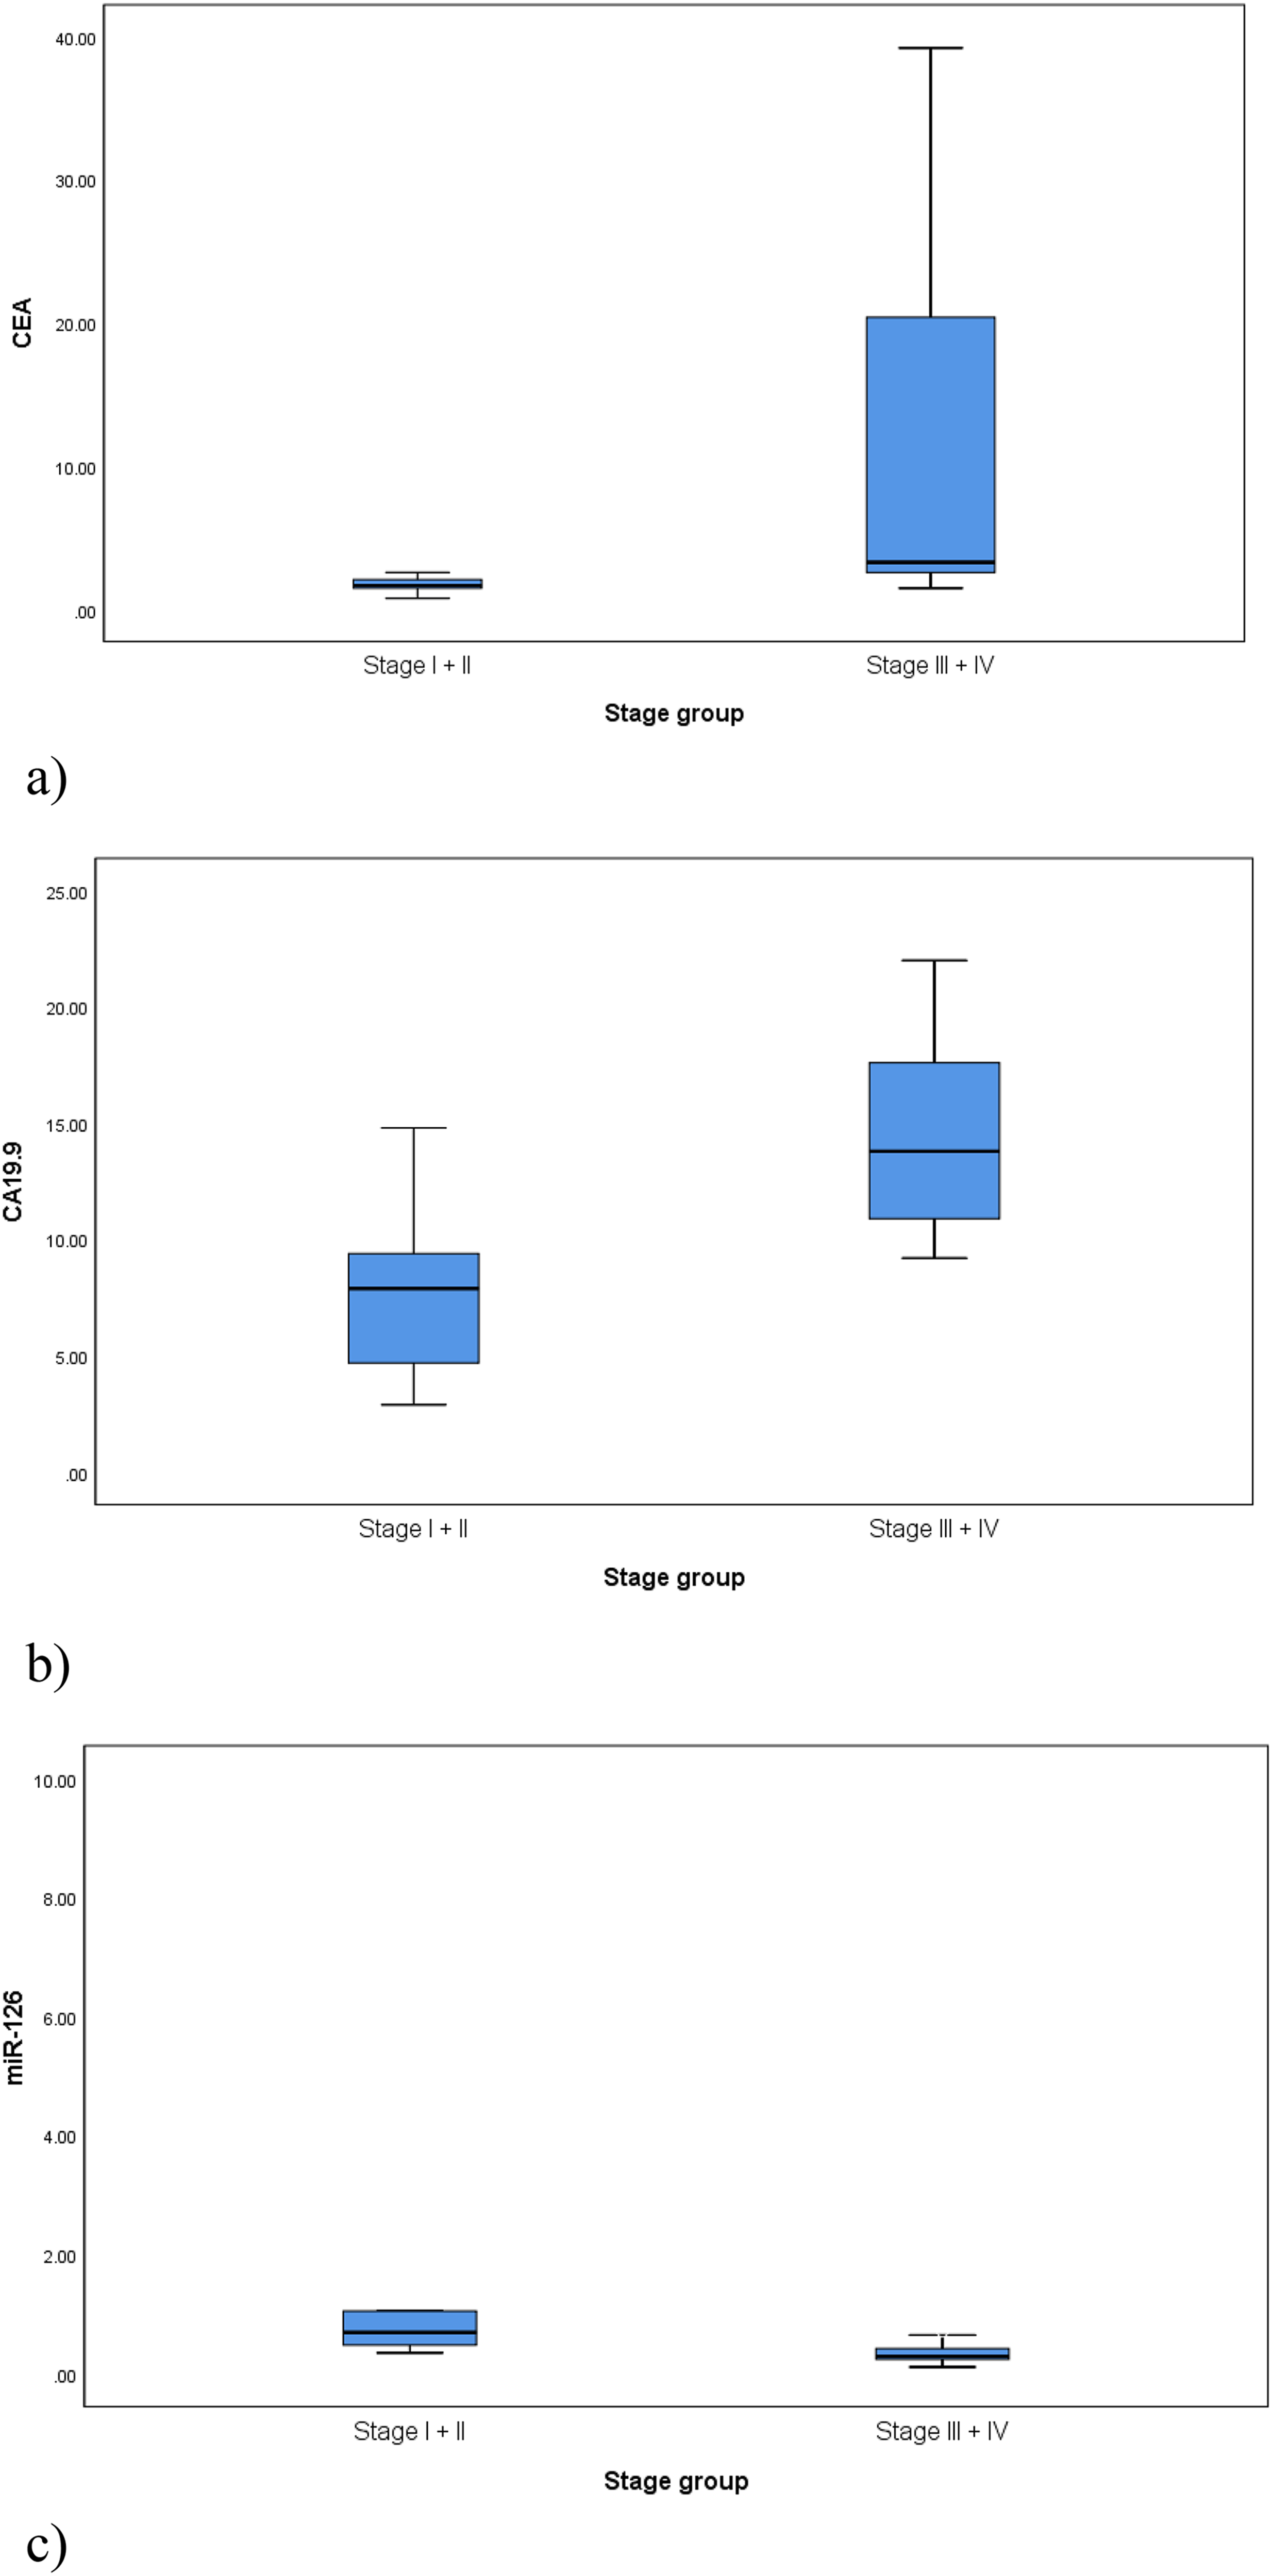
Comparison of (a) CEA levels (ng/mL), (b) CA19-9 levels (U/mL) and (c) miR-126 expression levels among the CRC patients according to the TNM stage; early stages (I + II), late stages (III + IV). (a) p-value = 0.001. (b) p-value < 0.001. (c) p-value = 0.001.
However, miR-126 expression level significantly decreased in CRC patients with late stages than those with early stages (median (IQR): 0.29 (0.24–0.42) vs 0.69 (0.48–1.05); p = 0.001) (Figure 2(c)).
Comparison of CRC patients according to distant metastasis
Levels of CEA and CA19-9 were significantly higher in the metastatic CRC patients than those with no metastasis (median (IQR) CEA: 15.25 (2.60–27.20) vs 2.00 (1.60–2.65) ng/mL; p = 0.002 and median (IQR) CA19-9: 13.90 (10.90–17.60) vs 9.70 (6.20–3.75) U/mL; p = 0.035) (Figure 3(a) and (b)).
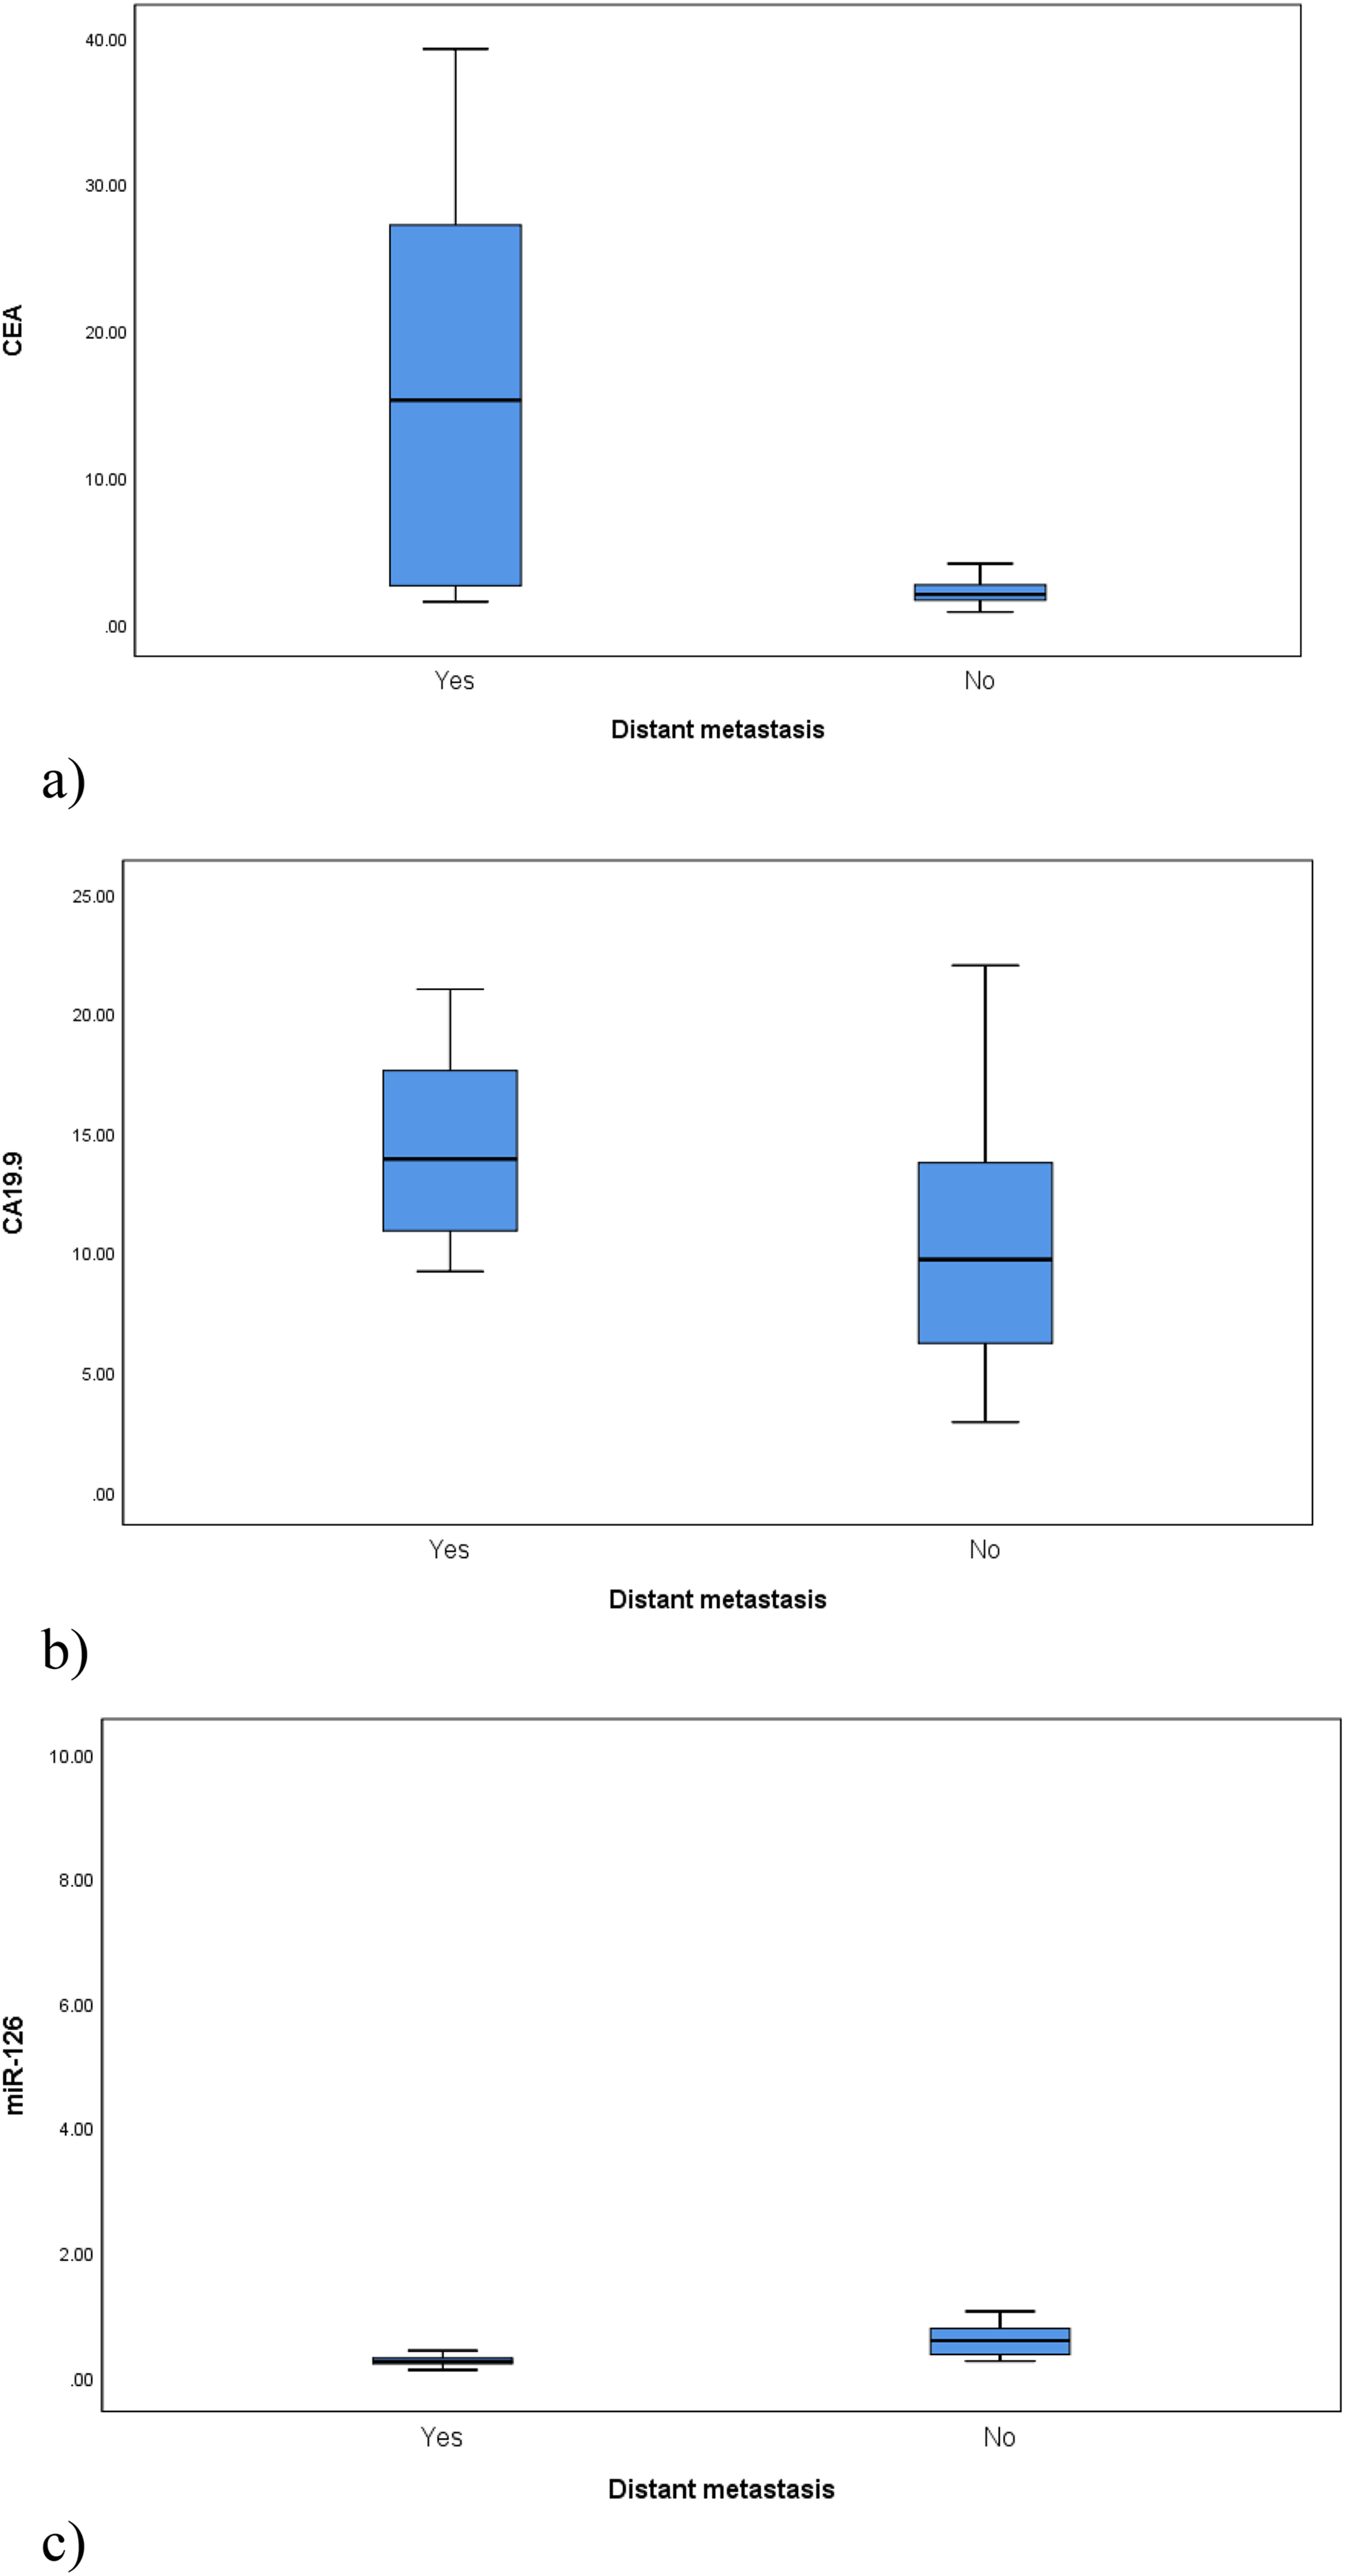
Comparison of (a) CEA levels (ng/mL), (b) CA19-9 levels (U/mL) and (c) miR-126 expression levels among the CRC patients according to the presence of distant metastasis. (a) p-value = 0.002. (b) p-value = 0.035. (c) p-value = 0.002.
In contrast, miR-126 expression level significantly decreased in CRC patients with metastasis than those with no metastasis (median (IQR): 0.25 (0.21 −0.30) vs 0.58 (0.36–0.78); p = 0.002) (Figure 3(c)).
MiR-126 correlation with tumor size, CEA and CA19-9
The correlation study revealed statistically insignificant negative correlations between miR-126 expression levels and tumor size (rs = −0.005; p = 0.980), CEA (rs = −0.161; p = 0.397), and CA19-9 (rs = −0.223; p = 0.236).
The ability of mir-126 to distinguish between CRC patients and controls
The diagnostic efficacy of miR-126 in differentiating between CRC patients and all controls was assessed using ROC curve analysis. The optimal cut-off point was 0.7, with a diagnostic sensitivity of 80.0%, specificity of 80.0%, positive predictive value (PPV) of 85.7%, and negative predictive value (NPV) of 72.7%. The area under the curve (AUC) was 0.798 (Figure 4(a)).
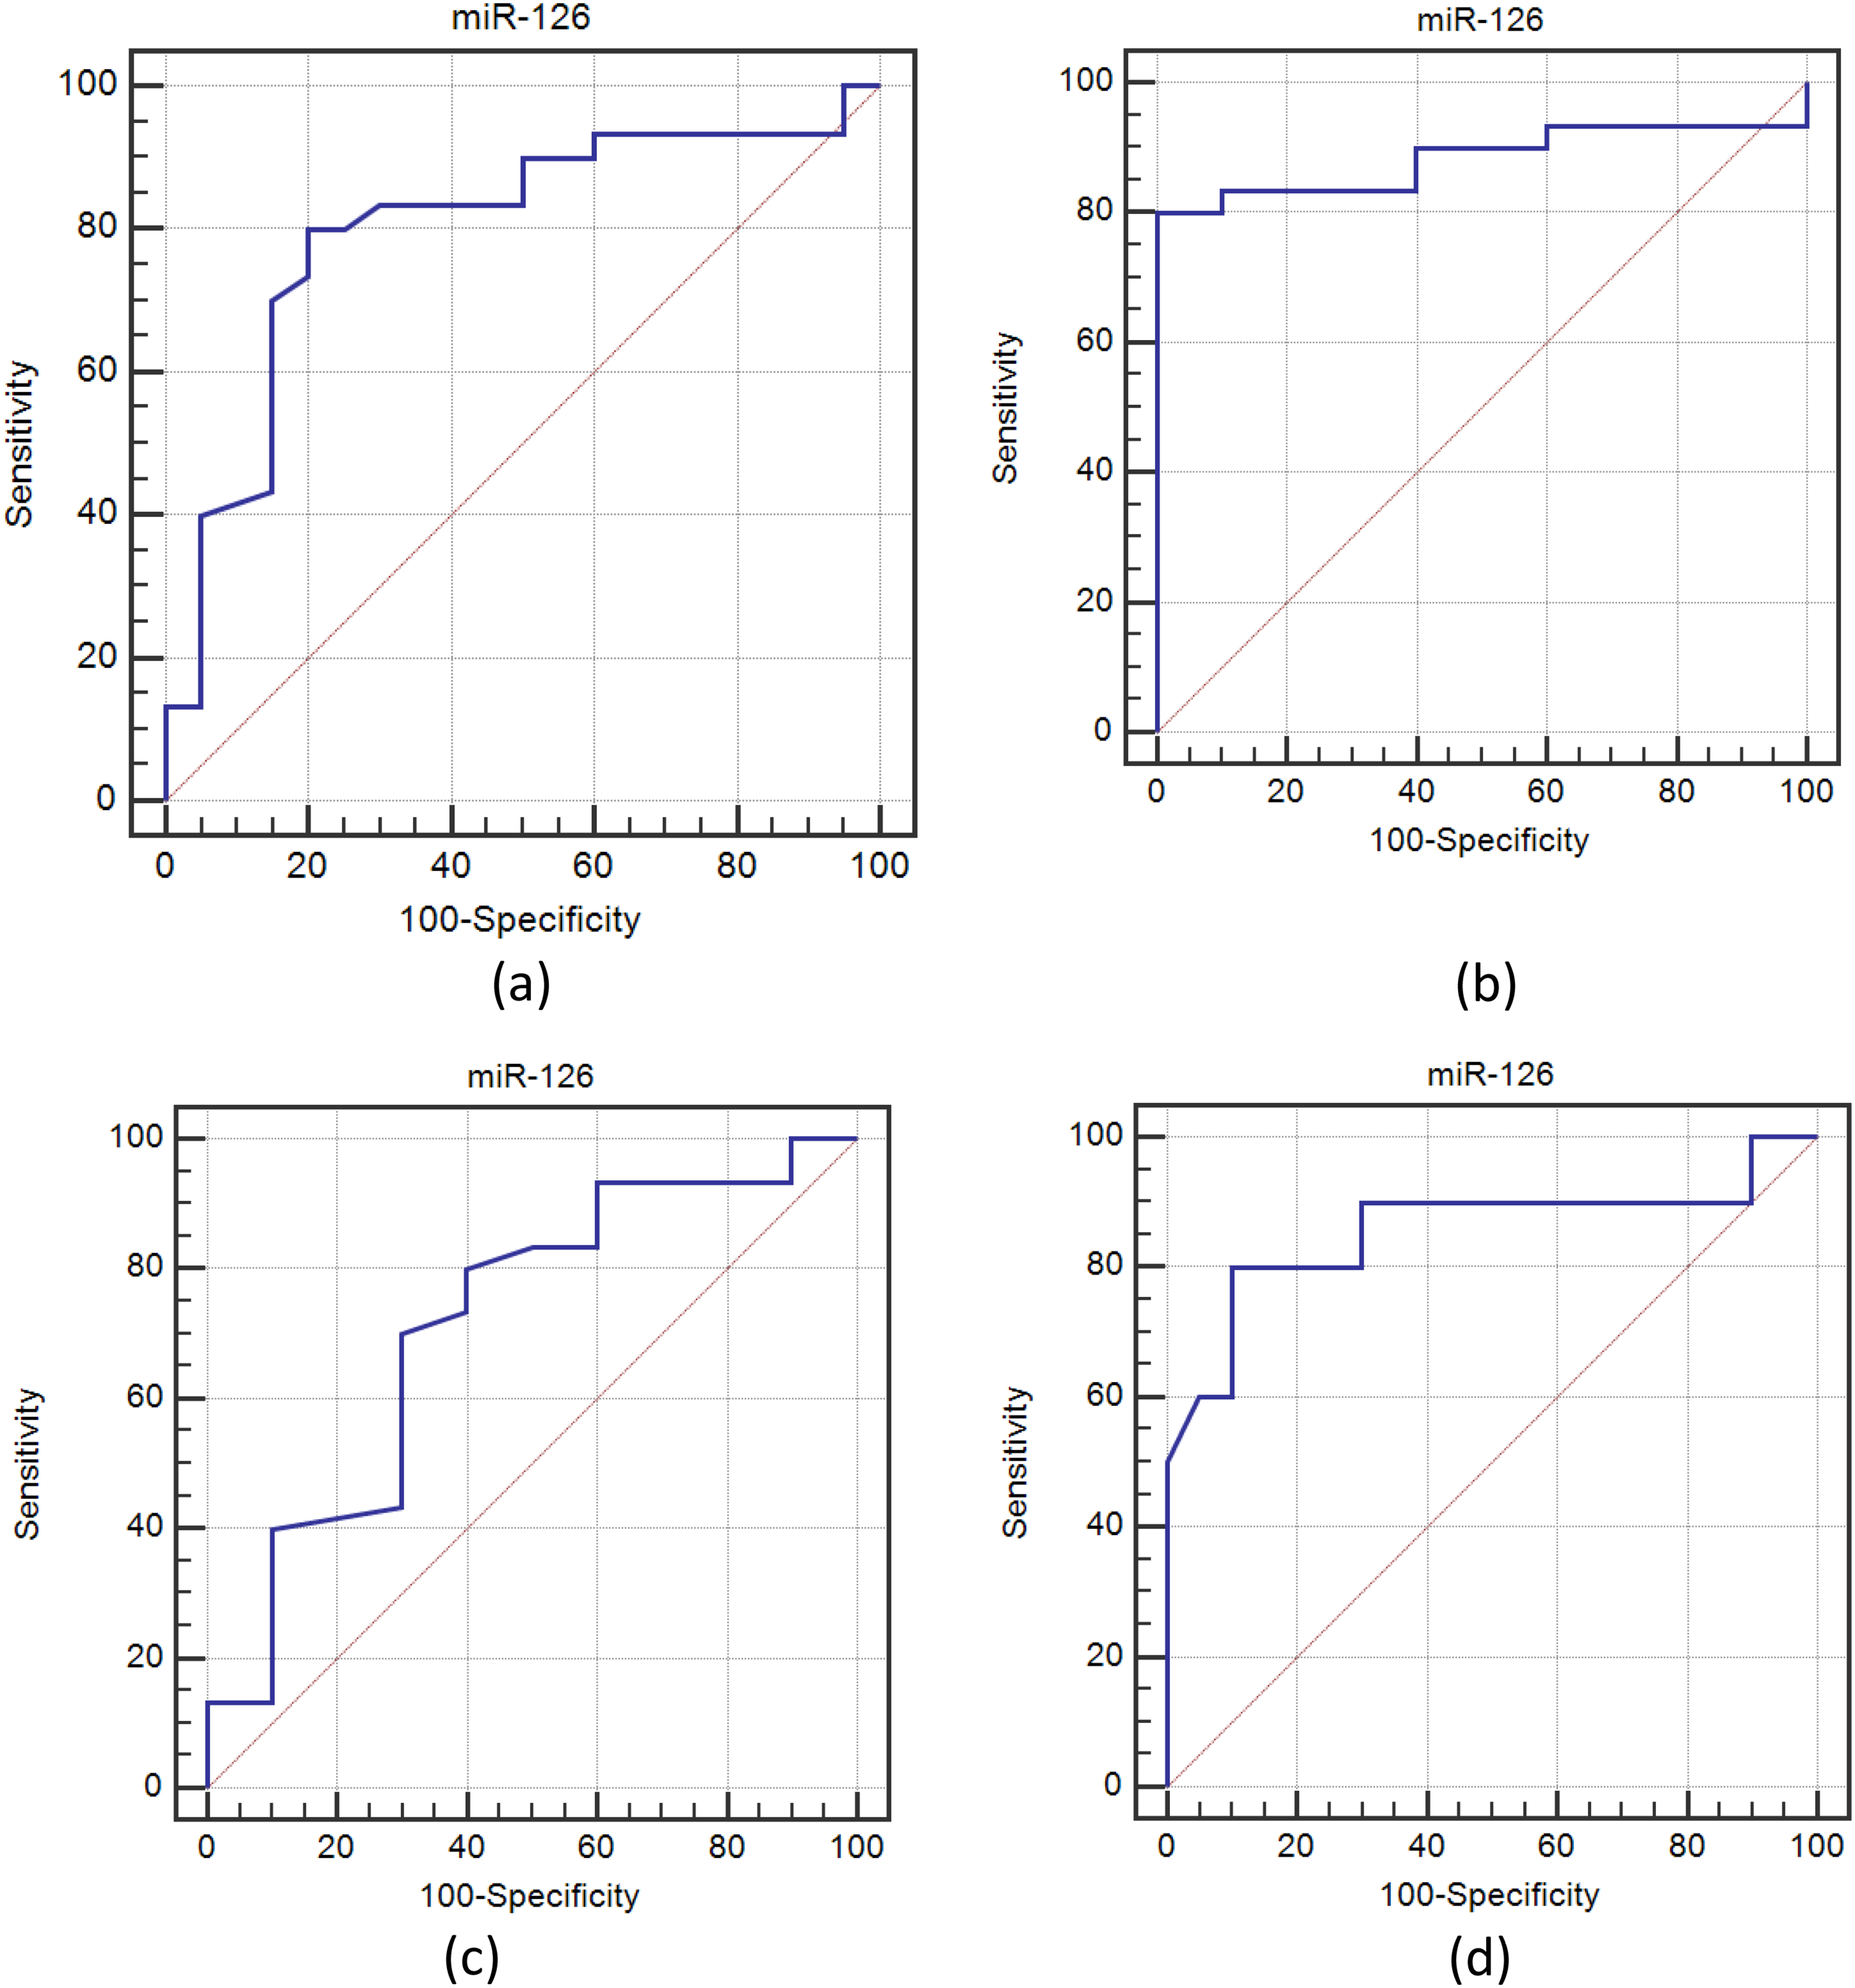
ROC curve for miR-126 for discriminating between (a) CRC patients and all controls (pathological + healthy), (b) CRC patients and pathological controls, (c) CRC patients and healthy controls, and (d) CRC patients with metastasis and CRC patients without metastasis.
The optimum cut-off value for miR-126 to distinguish between CRC patients and pathological controls was 0.68, with a diagnostic sensitivity of 80.0%, specificity of 100.0%, PPV of 100.0%, and NPV of 62.5%. Its AUC was 0.883 (Figure 4(b)).
The optimal cut-off value for miR-126 to distinguish between CRC patients and healthy controls was 0.7, with a diagnostic sensitivity of 80.0%, specificity of 60.0%, PPV of 85.7%, and NPV of 50.0%. Its AUC was 0.713 (Figure 4(c)).
The ability of mir-126 to distinguish CRC patients according to distant metastasis
To ascertain the diagnostic efficacy of miR-126 in differentiating between patients with metastatic and non-metastatic CRC, another ROC curve analysis was carried out. With a diagnostic sensitivity of 80.0%, specificity of 90.0%, PPV of 80.0%, and NPV of 90.0%, the optimal cut-off value was 0.3. Its AUC was 0.858 (Figure 4(d)).
Discussion
CRC is a major public health burden worldwide. Its pathogenesis is heterogeneous and associated with different molecular mechanisms. CRC patients usually refuse to have colonoscopies because of their invasiveness, a limitation that can result in delayed early diagnosis and makes CRC discoverable only when metastases occur. 11 MiRNAs can regulate the translation of messenger RNA (mRNA) during gene expression by binding to the 3′ untranslated region (3′ UTR) of their target transcripts. Consequently, their dysregulation may be closely associated with alterations in the pathological milieu of numerous malignancies, such as CRC. 12 As there are not many published reports about circulating miRNAs in CRC Egyptian patients and with the purpose of providing an alternative, non-invasive, early, and accurate diagnostic method for CRC to lower its morbidity and mortality, we investigated the expression level of circulating miR-126 in patients with CRC compared to healthy controls and pathological controls (patients with benign adenoma). We found that miR-126 expression level significantly decreased in CRC patients than in both the healthy and pathological controls, and lower levels were associated with late TNM stages and distant metastasis. However, the miR-126 expression level in the current study showed no correlation with tumor size.
Du et al. 2022, reported that miR-126 is among the top four miRNAs that can accurately identify CRC, along with miR-654-5p, miR-10b, and miR-144. 10 The current study supports the findings of earlier research that reported downregulation of miR-126 in CRC patients, and this decrease was associated with poor prognosis and negatively correlated with TNM stage and metastasis.13–16 In line with our results, Huang et al. 2016, reported that miR-126 downregulation was associated with CRC development, metastasis, and resistance to chemotherapy. They concluded that miR-126 screening can be an early diagnostic tool and an indicator of cancer progression and metastasis. They also suggested that miR-126 can be a possible target of therapy against CRC by restoration of its expression. 17
Similarly, Ebrahimi et al. 2015, supported the tumor-suppressive role of miR-126 in CRC. They found that the downregulation of miR-126 expression in CRC was associated with advanced TNM stages, tumor metastasis, and poorer survival. 18 Partially similar to our results, Li et al. 2011, revealed that miR-126 expression was associated with tumor grade but not associated with tumor size and stage. 19
The protective effect of miR-126 in cancers can be explained by its ability to enhance apoptosis and autophagy and decrease cell proliferation. MiR-126 can target many genetic pathways, including BCL-2 and p53.20–22 Moreover, miR-126 can inhibit the regulatory proteins of signal transduction pathways linked to the vascular endothelial growth factor (VEGF) receptor. Additionally, by targeting pro-angiogenic genes and lowering the recruitment of mesenchymal stem cells in primary tumors, it can inhibit the recruitment of metastatic endothelial cells and angiogenesis.18,23 Moreover, previous studies showed that over-expression of miR-126 decreases tumor cell infiltration and cell cycle arrest through downregulation of insulin receptor substrate-1, suppression of AKT and ERK1/2 activation, and repression of the CXCR4 gene and the RhoA/Rho-associated protein kinase (ROCK) signaling pathway.24–26
In contrast to our study, Díaz et al. 2008, reported that miR-126 expression did not have any correlations with CRC grade, vascular invasion, and stages. 27 In addition, Schepeler et al. 2008, reported a high level of miR-126 expression which correlated to cancer recurrence in those patients with stage II CRC (without lymph node metastases). 28 The disparity in ethnic groupings, which can differ genetically and behave differently in carcinogenic environments, may account for the inconsistency between studies. This mismatch may also be due to the varied miR-126 detection sites (tissue, cell line, or plasma), methods of assays, and the target miRNA, either premature miRNA, the 5P or 3P miRNA mature strands. Also, different sample sizes with different stages and molecular CRC subtypes can contribute to this discrepancy.
In the current study, miR-126 expression level showed no correlation with CEA and CA19-9 levels, which were associated with CRC late stages and distant metastasis as well, but their increased concentrations did not show any significant difference except between patients with CRC and the healthy controls. However, the dependence on routinely used tumor markers for diagnosis and prognosis of CRC is not significant, and they cannot be used alone as they can also be elevated in other benign conditions like inflammatory bowel diseases. 29
By applying ROC curve analysis, the current study also showed that miR-126 could function as a reliable, independent predictor of CRC and its associated distant metastasis. The best cut-off point of miR-126 that discriminated between CRC and all controls in the current study was 0.7, and the best cut-off point that discriminated between metastatic and non-metastatic CRC was 0.3. Similarly, Sabry et al. 2019, demonstrated that at a cut-off point of 0.294, miR-126 can differentiate colorectal adenocarcinomas and adenomas from controls with a sensitivity and specificity of 88.6% and 50.5%, respectively. 16 Similarly, Yin et al. 2014, reported that at a cut-off point in log10 relative quantity = -0.2005 (the antilog = 0.630231346), miR-126 could be used as a diagnostic tool for liver metastases in CRC with 77.78% sensitivity and 68.97% specificity. 30
In conclusion, the current study confirms the results of previous research that miR-126 functions as a tumor suppressor in CRC, and its downregulation is linked to CRC's advanced clinical stages and metastasis. Our results suggest that miR-126 can be a promising non-invasive marker for CRC early diagnosis, screening, and prognosis prediction. By comprehending the molecular mechanisms via which miRNAs impact cancer and their functions in regulating various signaling pathways, we may be able to decrease the incidence of CRC and halt its course among Egyptian patients. To prove if it can be implemented into standard clinical practice, more prospective studies with larger sample sizes are necessary.
Footnotes
Acknowledgements
None.
Availability of data and materials
All the data needed to support the findings will be provided upon request.
Consent for publication
Not applicable.
Declaration of conflicting interests
The authors declared no potential conflicts of interest with respect to the research, authorship, and/or publication of this article.
Ethical approval and consent to participate
The current study protocol was approved by the Research Ethics Committee (REC) of Ain Shams University Faculty of Medicine (FMASU R132/2024). All procedures were explained to all participants, and their written informed consent was obtained before any of them could participate in the study. This study adheres to the Declaration of Helsinki.
Funding
The authors received no financial support for the research, authorship, and/or publication of this article.