
Abstract
Polymorphonuclear neutrophils (PMNs) are the most important determinants in the acute inflammatory response. Pathologically increased numbers of PMNs in the circulation or specific tissues (or both) lead to neutrophilia. However, the genes expressed and pathways involved in neutrophilia have yet to be elucidated. By analysis of three public microarray datasets related to neutrophilia (GSE64457, GSE54644, and GSE94923) and evaluation by gene ontology, pathway enrichment, protein–protein interaction networks, and hub genes analysis using multiple methods (DAVID, PATHER, Reactome, STRING, Reactome FI Plugin, and CytoHubba in Cytoscape), we identified the commonly up-regulated and down-regulated different expressed genes. We also discovered that multiple signaling pathways (IL-mediated, LPS-mediated, TNF-α, TLR cascades, MAPK, and PI3K-Akt) were involved in PMN regulation. Our findings suggest that the commonly expressed genes involved in regulation of multiple pathways were the underlying molecular mechanisms in the development of inflammatory, autoimmune, and hematologic diseases that share the common phenotypic characteristics of increased numbers of PMNs. Taken together, these data suggest that these genes are involved in the regulation of neutrophilia and that the corresponding gene products could serve as potential biomarkers and/or therapeutic targets for neutrophilia.
Keywords
Introduction
Polymorphonuclear neutrophils (PMNs) are extremely important response cells of the innate immune system in humans. They represent the first line of defense against invading pathogens (e.g., bacteria and fungi) and have the most important role in the acute inflammatory response.1,2 They are the most abundant blood leukocytes and have a very short lifecycle (24–48 h in the peripheral circulation and 1–4 d in tissue). The number of PMNs renewed daily in peripheral blood is about 0.8–1.6 × 10⁹ cells/kg body mass.1,3
“Neutrophilia” refers to an abnormal increase in the number of mature neutrophils. Neutrophilia is the most common cause of leukocytosis, and is often associated with bacterial infection and some hematologic diseases (e.g., leukemia and polycythemia vera (PV)). 4
Increasing the number of PMNs is essential to attack invading pathogens, but increasing their number in an inappropriate manner can cause tissue damage.1,2 Several intracellular and extracellular modulators can regulate the neutrophil count. For instance, intracellular cAMP can activate protein kinase A (PKA) and increase the number of neutrophils by reducing apoptosis and prolonging neutrophil survival through downstream signaling of PKA. 5 Caspases can increase PMN death by a cascade reaction, DNA cleavage, and protein kinase C delta (PKC-δ) activation. 6 Recombinant human granulocyte-macrophage colony-stimulating factor (GM-CSF) and red blood cells, as anti-apoptotic factors, are extracellular modulators. GM-CSF can increase the number of neutrophils by up-regulating anti-apoptotic pathways such as phosphoinositide 3-kinase/protein kinase B (PI3K/Akt) and subsequently regulating the gene expression of several other apoptosis-related factors.1,3
Neutrophilia is a common manifestation of sepsis, PV, or healthy neutrophils stimulated by GM-CSF or PKA agonists. Microarray analysis has revealed that some genes and pathways can regulate the number of neutrophils. Nevertheless, thorough analysis of differential expression of the key genes and pathways involved in neutrophilia has not been carried out. In this work, we analyzed three microarray datasets using multiple methods synergistically to identify key differentially expressed genes (DEGs) and pathways and revealed additional further molecular mechanisms involved in neutrophilia.
As machine-learning technology has entered bioinformatics, several computational methods have been developed to predict the functions of genes, 7 protein–protein interactions, 8 microbe–disease associations, 9 microbe–drug associations, 10 and drug–target interactions. 11 Through the corresponding bioinformatics tools, we wished to reveal further the molecular mechanisms of neutrophilia. We analyzed the key genes and pathways expressed differentially in PV and healthy neutrophils stimulated by GM-CSF, as well as the PKA agonists associated with neutrophilia, using systematic and integrated bioinformatics analysis.
Materials and methods
Microarray data
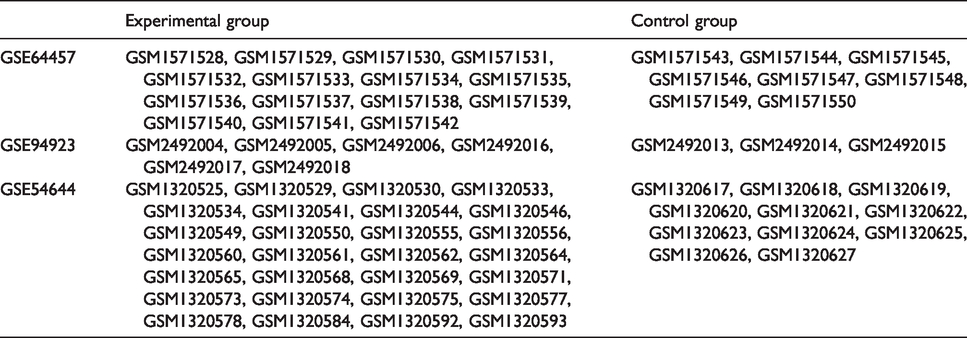
Expression of the genes in samples associated with sepsis, myeloproliferative neoplasms (MPNs), or healthy neutrophils stimulated by GM-CSF or a PKA agonist (GSE64457, 12 GSE54644, 13 or GSE949235) from the Gene Expression Omnibus (GEO) database (www.ncbi.nlm.nih.gov/geo) was measured.
Neutrophilia samples were screened for analyses. GSE64457 and GSE94923 datasets were sequenced on the platform of the GeneChip Human Genome U133 Plus 2.0 Array (GPL570; Affymetrix, Santa Clara, CA, USA). GSE54644 was sequenced on the platform of the GeneChip HT-HG_U133A Early Access Array (GPL4685; Affymetrix).
GSE64457 comprised 15 samples from patients suffering from septic shock and eight samples of healthy neutrophils. According to the clinical data of patients detailed by Demaret and colleagues, 12 all the 15 patients with septic shock had a white blood cell count >12,000/mm3, and their neutrophil count was increased significantly compared with that of healthy individuals. In our study, nine human-neutrophil samples were screened from GSE94923: three samples underwent 4-h incubation with GM-CSF; three samples underwent treatment with a PKA agonist; and three samples were unstimulated.
GSE54644 contained samples from 28 patients with PV and 11 samples of healthy granulocytes. Thomas and colleagues demonstrated that < 5% of contaminating leukocytes contribute very little to the overall gene-expression profile of neutrophils in neutrophil preparations. 14 Most granulocytes are neutrophils, so we used the data from GSE54644. All the gene-expression data of our study were downloaded from a public database. Table 1 lists the information of the samples that we used.
Samples used in our study.
Data preprocessing and screening of DEGs
Raw data were processed in R v3.5.0 (www.r-project.org). The Affy package (www.bioconductor.org/packages/release/bioc/html/affy.html) 15 and the impute package (www.bioconductor.org/packages/release/bioc/html/impute.html) 16 were utilized to process data, including background adjustment based on the robust multi-array average (RMA) algorithm, data normalization, and processing of missing values. We transformed the probe name of each series matrix into a gene symbol based on the corresponding annotation files of the Affy probe, and then filtered the DEGs of each dataset into R software using the limma package (www.bioconductor.org/packages/release/bioc/html/limma.html) 17 by constructing a comparison model and the Bayes test. The limma package is a reliable choice for DEG discovery through analyses of DEGs of microarray datasets. It uses a particular class of statistical methods (“parametric empirical Bayes”) that has been demonstrated to be particularly advantageous in experiments with small sample sizes, thereby ensuring that inference is reliable and stable even if the number of replicates is small. 17 DEGs were defined with a cut-off of P < 0.05, which was adjusted using the method of Benjamini and Hochberg using a false discovery rate (FDR) 18 and fold-change > 2. Subsequently, we screened the intersection of DEGs from every two datasets using an “up-regulated” group and a “down-regulated” group, respectively.
Hierarchical clustering analysis
Hierarchical clustering analysis can group similar elements in a binary tree. Using the gplots 19 and RColorBrewer 20 packages in R software, expression of the DEGs in each dataset was extracted for hierarchical clustering analysis, and then visualized in heatmaps.
The intersections of up-regulated or down-regulated DEGs from every two datasets were considered as candidate DEGs for advanced analyses. Gene Ontology (GO) and pathway enrichment of candidate DEGs were analyzed using up-regulated candidate DEGs and down-regulated candidate DEGs, respectively, employing multiple online databases and software: DAVID v6.7 (https://david-d.ncifcrf.gov/),7,21 PANTHER v13.1 (www.pantherdb.org), 22 Reactome (http://reactome.org), 23 and the ReactomeFIPlugIn application24,25 in Cytoscape v3.6.1. 26 DAVID, PANTHER, and Reactome are online databases providing many functional annotation tools for investigators to understand the biological importance behind a long list of genes. The P value for the significance of the gene-enrichment term listed by DAVID was examined with a modified Fisher’s exact test, 7 whereas that for PANTHER and Reactome was obtained through over-representation analysis by Fisher’s exact test,22,23 and the results were corrected for the FDR using the Benjamini–Hochberg method. In addition, based on a binomial test, the ReactomeFIPlugIn application undertook pathway enrichment analysis on a list of genes. 25 Synergetic analysis was conducted using results with an FDR < 0.05, P < 0.05, and gene count >2.
Construction of a protein–protein interaction (PPI) network
The interaction network among proteins encoded by candidate DEGs was researched by importing all the candidate DEGs into the STRING database v10.5 (http://string-db.org) 27 and calculating it online. Then, the STRING network was loaded into Cytoscape for analysis of hub genes using the CytoHubba application v0.1. 28 CytoHubba provides 12 analytical methods to identify hub objects and sub-networks from a complex interactome. 28 We extracted the top 30 results analyzed by these 12 methods. Then, we counted the frequency of the genes that appeared together in ≥ 5 methods: 34 genes were documented. Finally, we calculated the mass of each of these 34 genes and visualized a PPI network of proteins encoded by the top 29 genes by mass in Cytoscape. Conversely, up-regulated candidate DEGs, down-regulated candidate DEGs, and all candidate DEGs were loaded in Cytoscape for functional interaction (FI) gene-set analysis using the ReactomeFIPlugIn application (version 2017). 25 Subsequently, we obtained the PPI network. Next, we calculated and visualized hub genes using CytoHubba in Cytoscape through the maximal clique centrality (MCC) method (one of the 12 methods mentioned above).
Results
Screening of DEGs
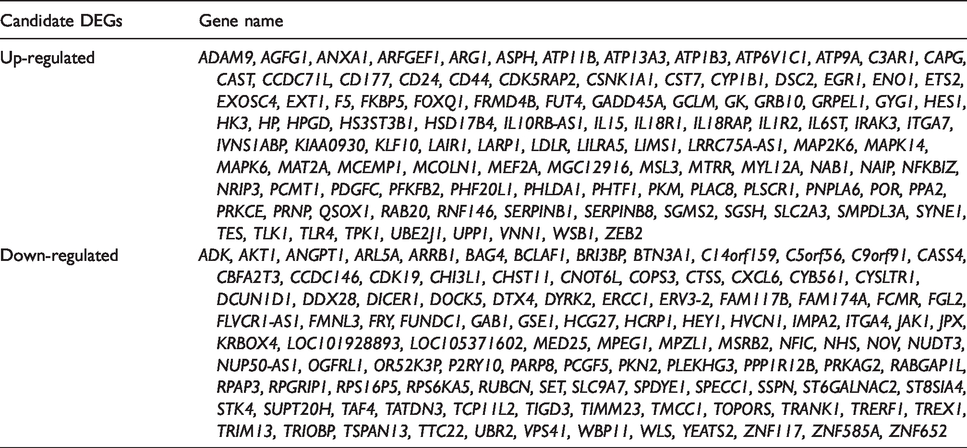
Using P < 0.05 and fold-change >2 as cut-off criteria, we had gained 766 (366 up-regulated and 400 down-regulated), 982 (259 up-regulated and 723 down-regulated), and 539 (394 up-regulated and 145 down-regulated) DEGs from the expression-profile datasets GSE64457, GSE94923, and GSE54644, respectively (online Supplemental File S1). After ascertaining the intersection of DEGs from the up-regulated-DEGs group and the down-regulated-DEGs group from each of the two datasets, we screened 110 up-regulated DEGs and 108 down-regulated DEGs as candidate DEGs for advanced analyses (Figure 1 and Table 2). Moreover, in the intersection of three datasets, there were 13 up-regulated DEGs (IL18R1, ATP13A3, CD44, LAIR1, ATP6V1C1, ATP11B, ADAM9, IL6ST, LDLR, EXOSC4, IL18RAP, PPA2, and HES1) and five down-regulated DEGs (FCMR, SET, NOV, FGL2, and TSPAN13).
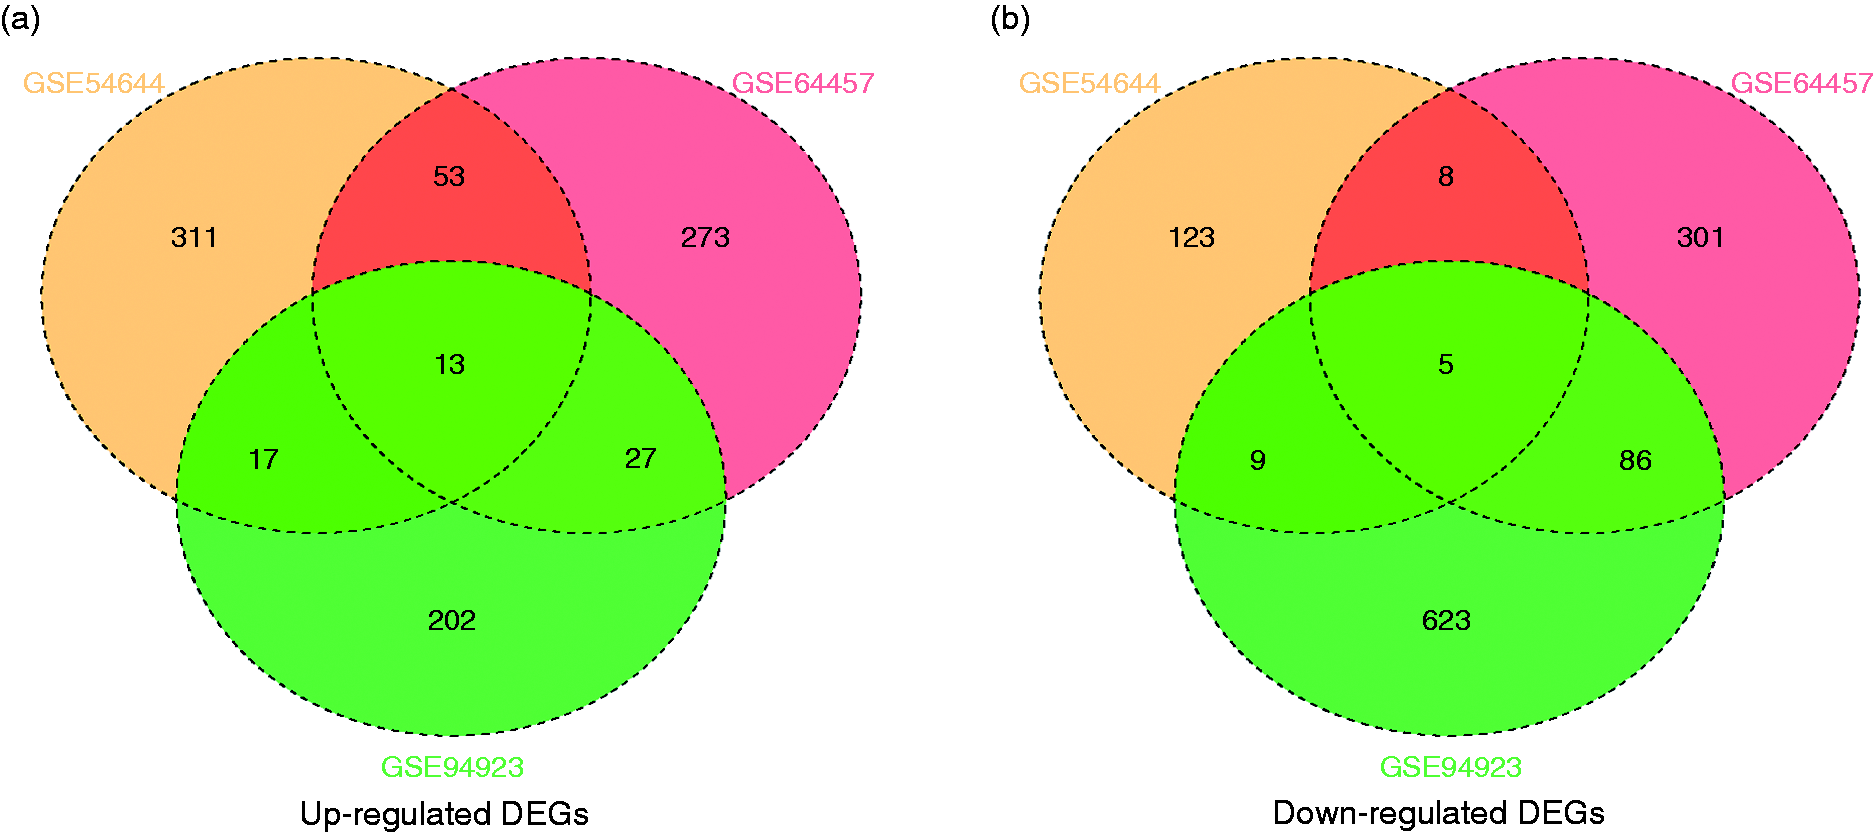
Intersection of (a) up-regulated DEGs and (b) down-regulated DEGs.
Candidate DEGs screened for advanced analysis: 110 up-regulated and 108 down-regulated DEGs (gene names are shown in alphabetical order).
Hierarchical clustering analysis of DEGs
Hierarchical clustering analysis was conducted for DEGs after ascertaining expression of the DEGs (Figure 2). As shown in the heatmaps of Figure 2, the DEGs of three datasets could clearly distinguish experimental samples from control samples.
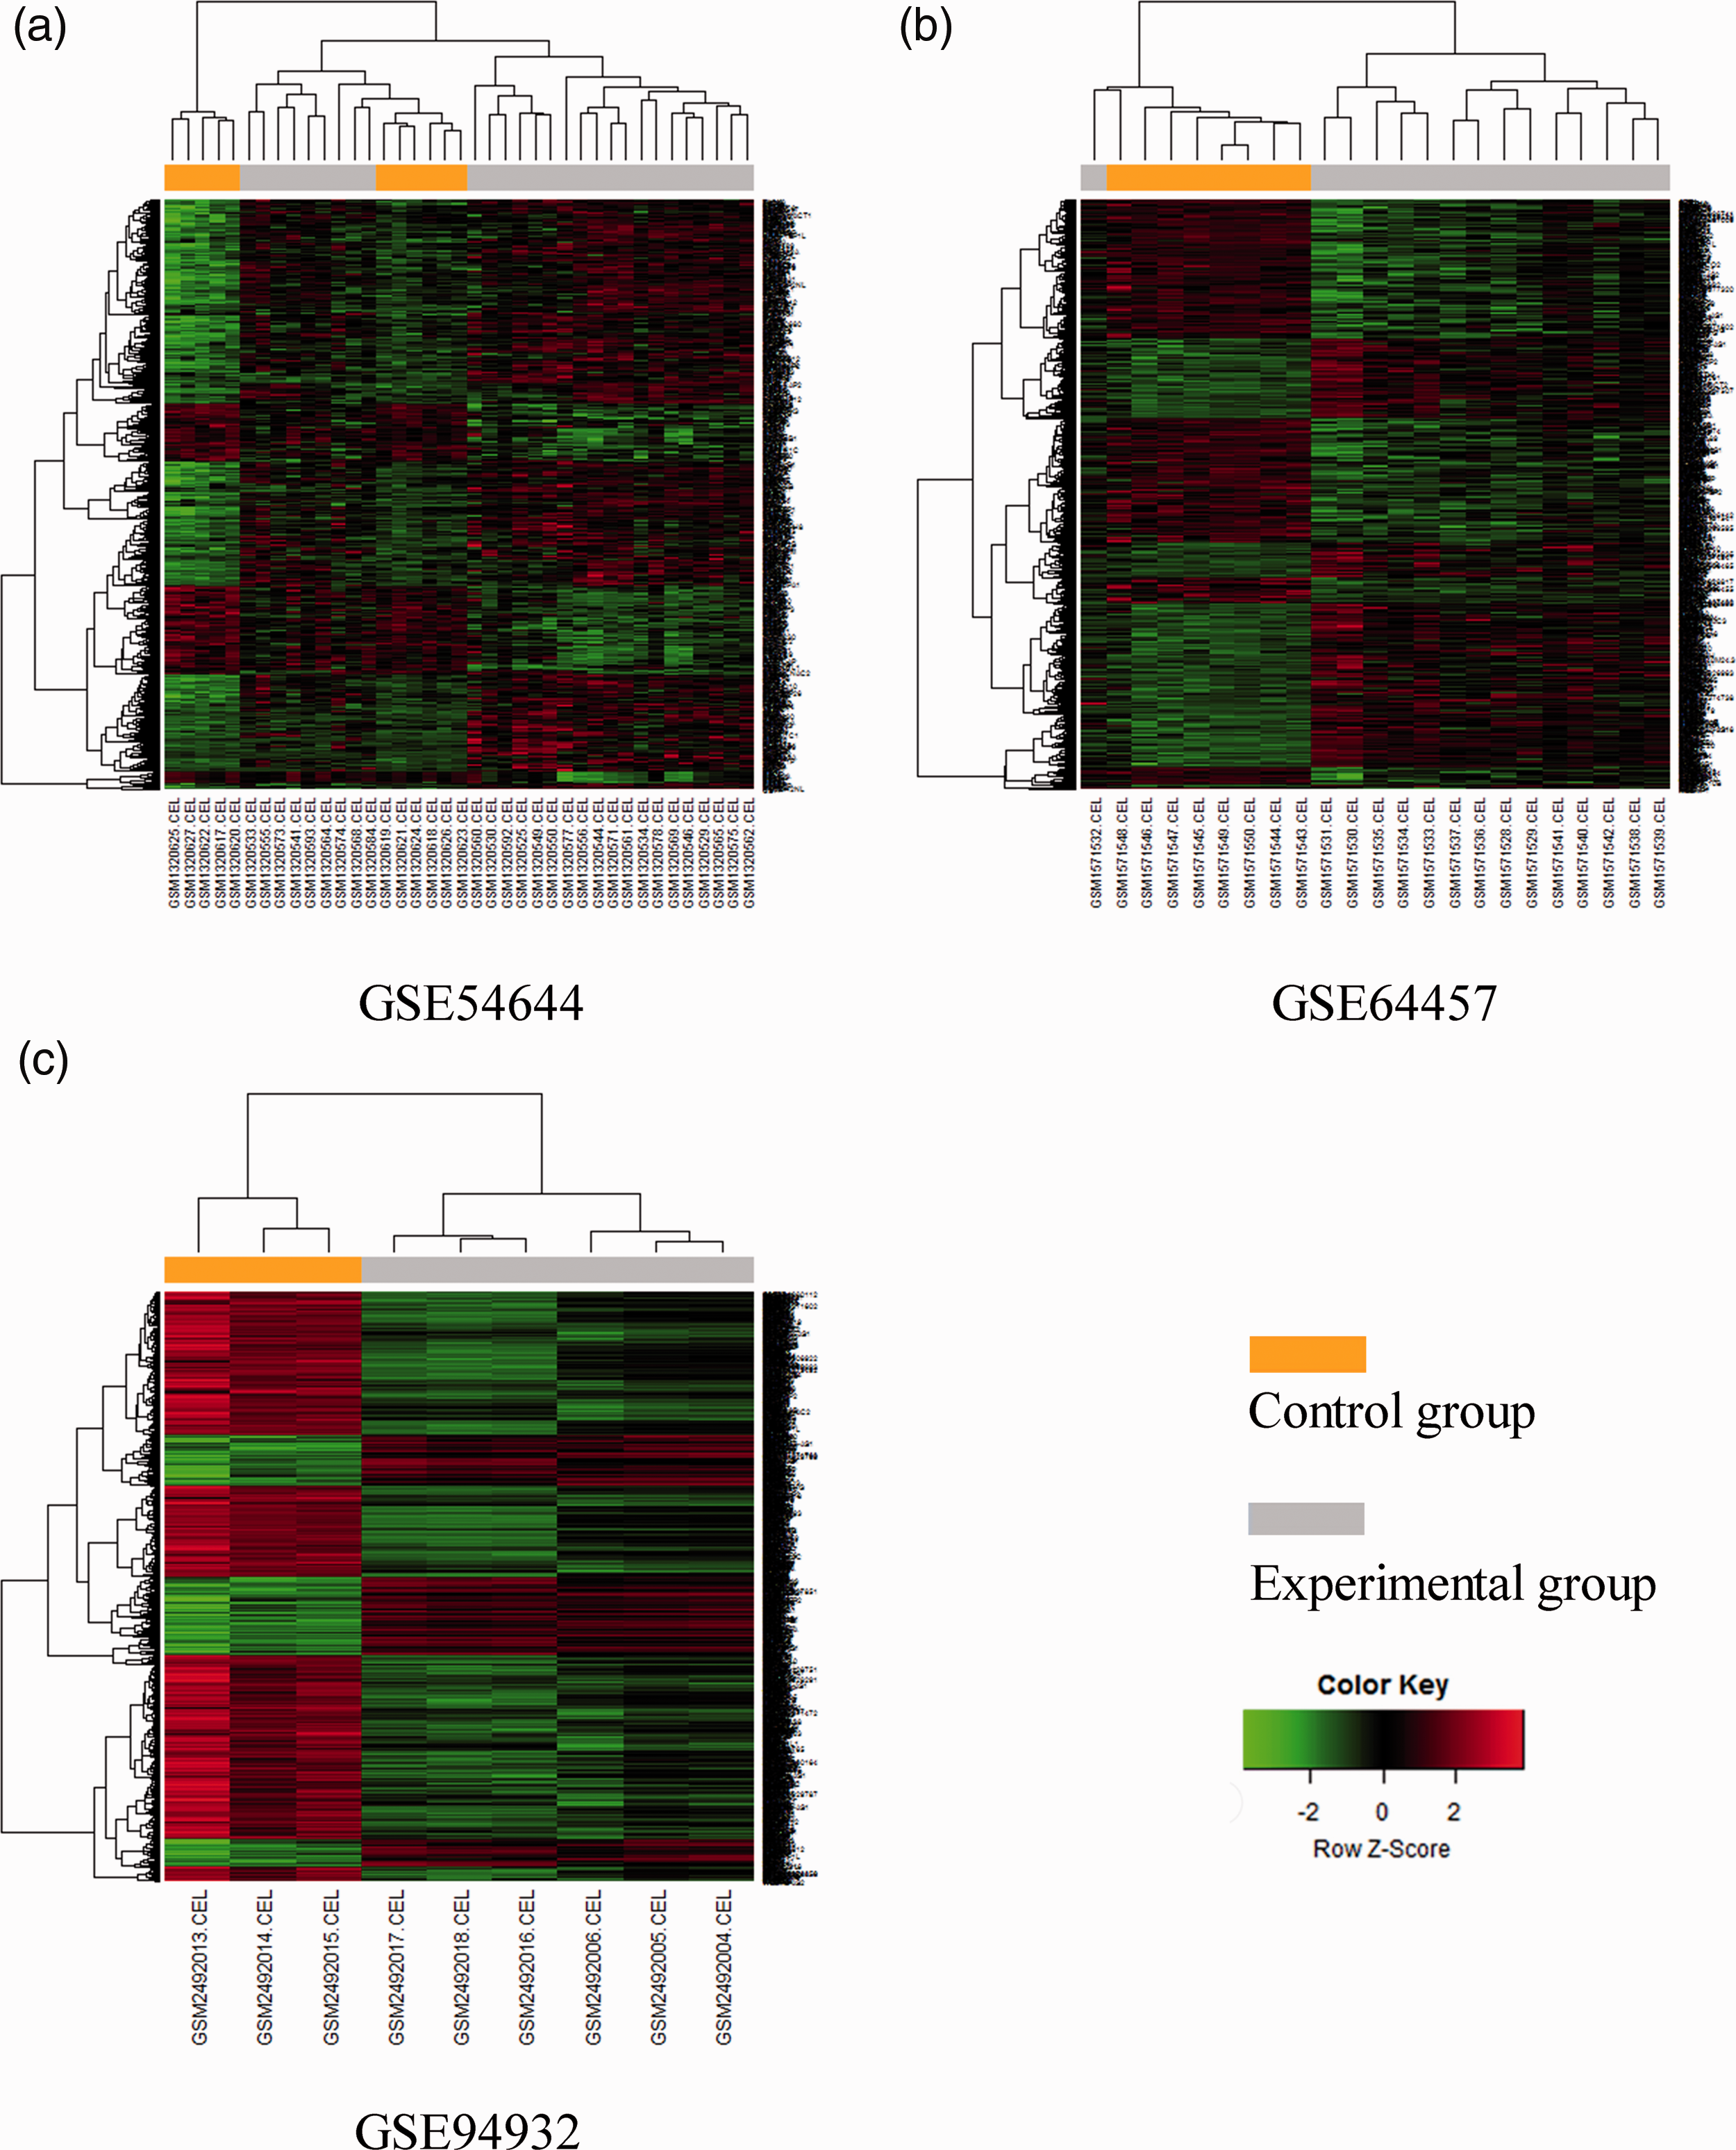
Heatmaps of the three GEO datasets.
GO and pathway enrichment analysis of candidate DEGs
Using multiple online databases and software (DAVID, PANTHER, Reactome, and ReactomeFIPlugIn application in Cytoscape), the GO and pathway enrichment of candidate DEGs were analyzed synergistically. The results before integration contained “biological process,” “cellular component,” “molecular function,” and “pathway.” The first three terms were analyzed by DAVID, PANTHER, and Reactome FI node function analysis in Cytoscape, and the pathway enrichment was analyzed by PANTHER, Reactome, and Kyoto Encyclopedia of Genes and Genomes (KEGG) pathways in DAVID, and Reactome FI node function analysis in Cytoscape. The top 15 integrated results were visualized and are listed in Figures 3 to 5 and Table 3, and detailed results are shown in online Supplemental File S2.
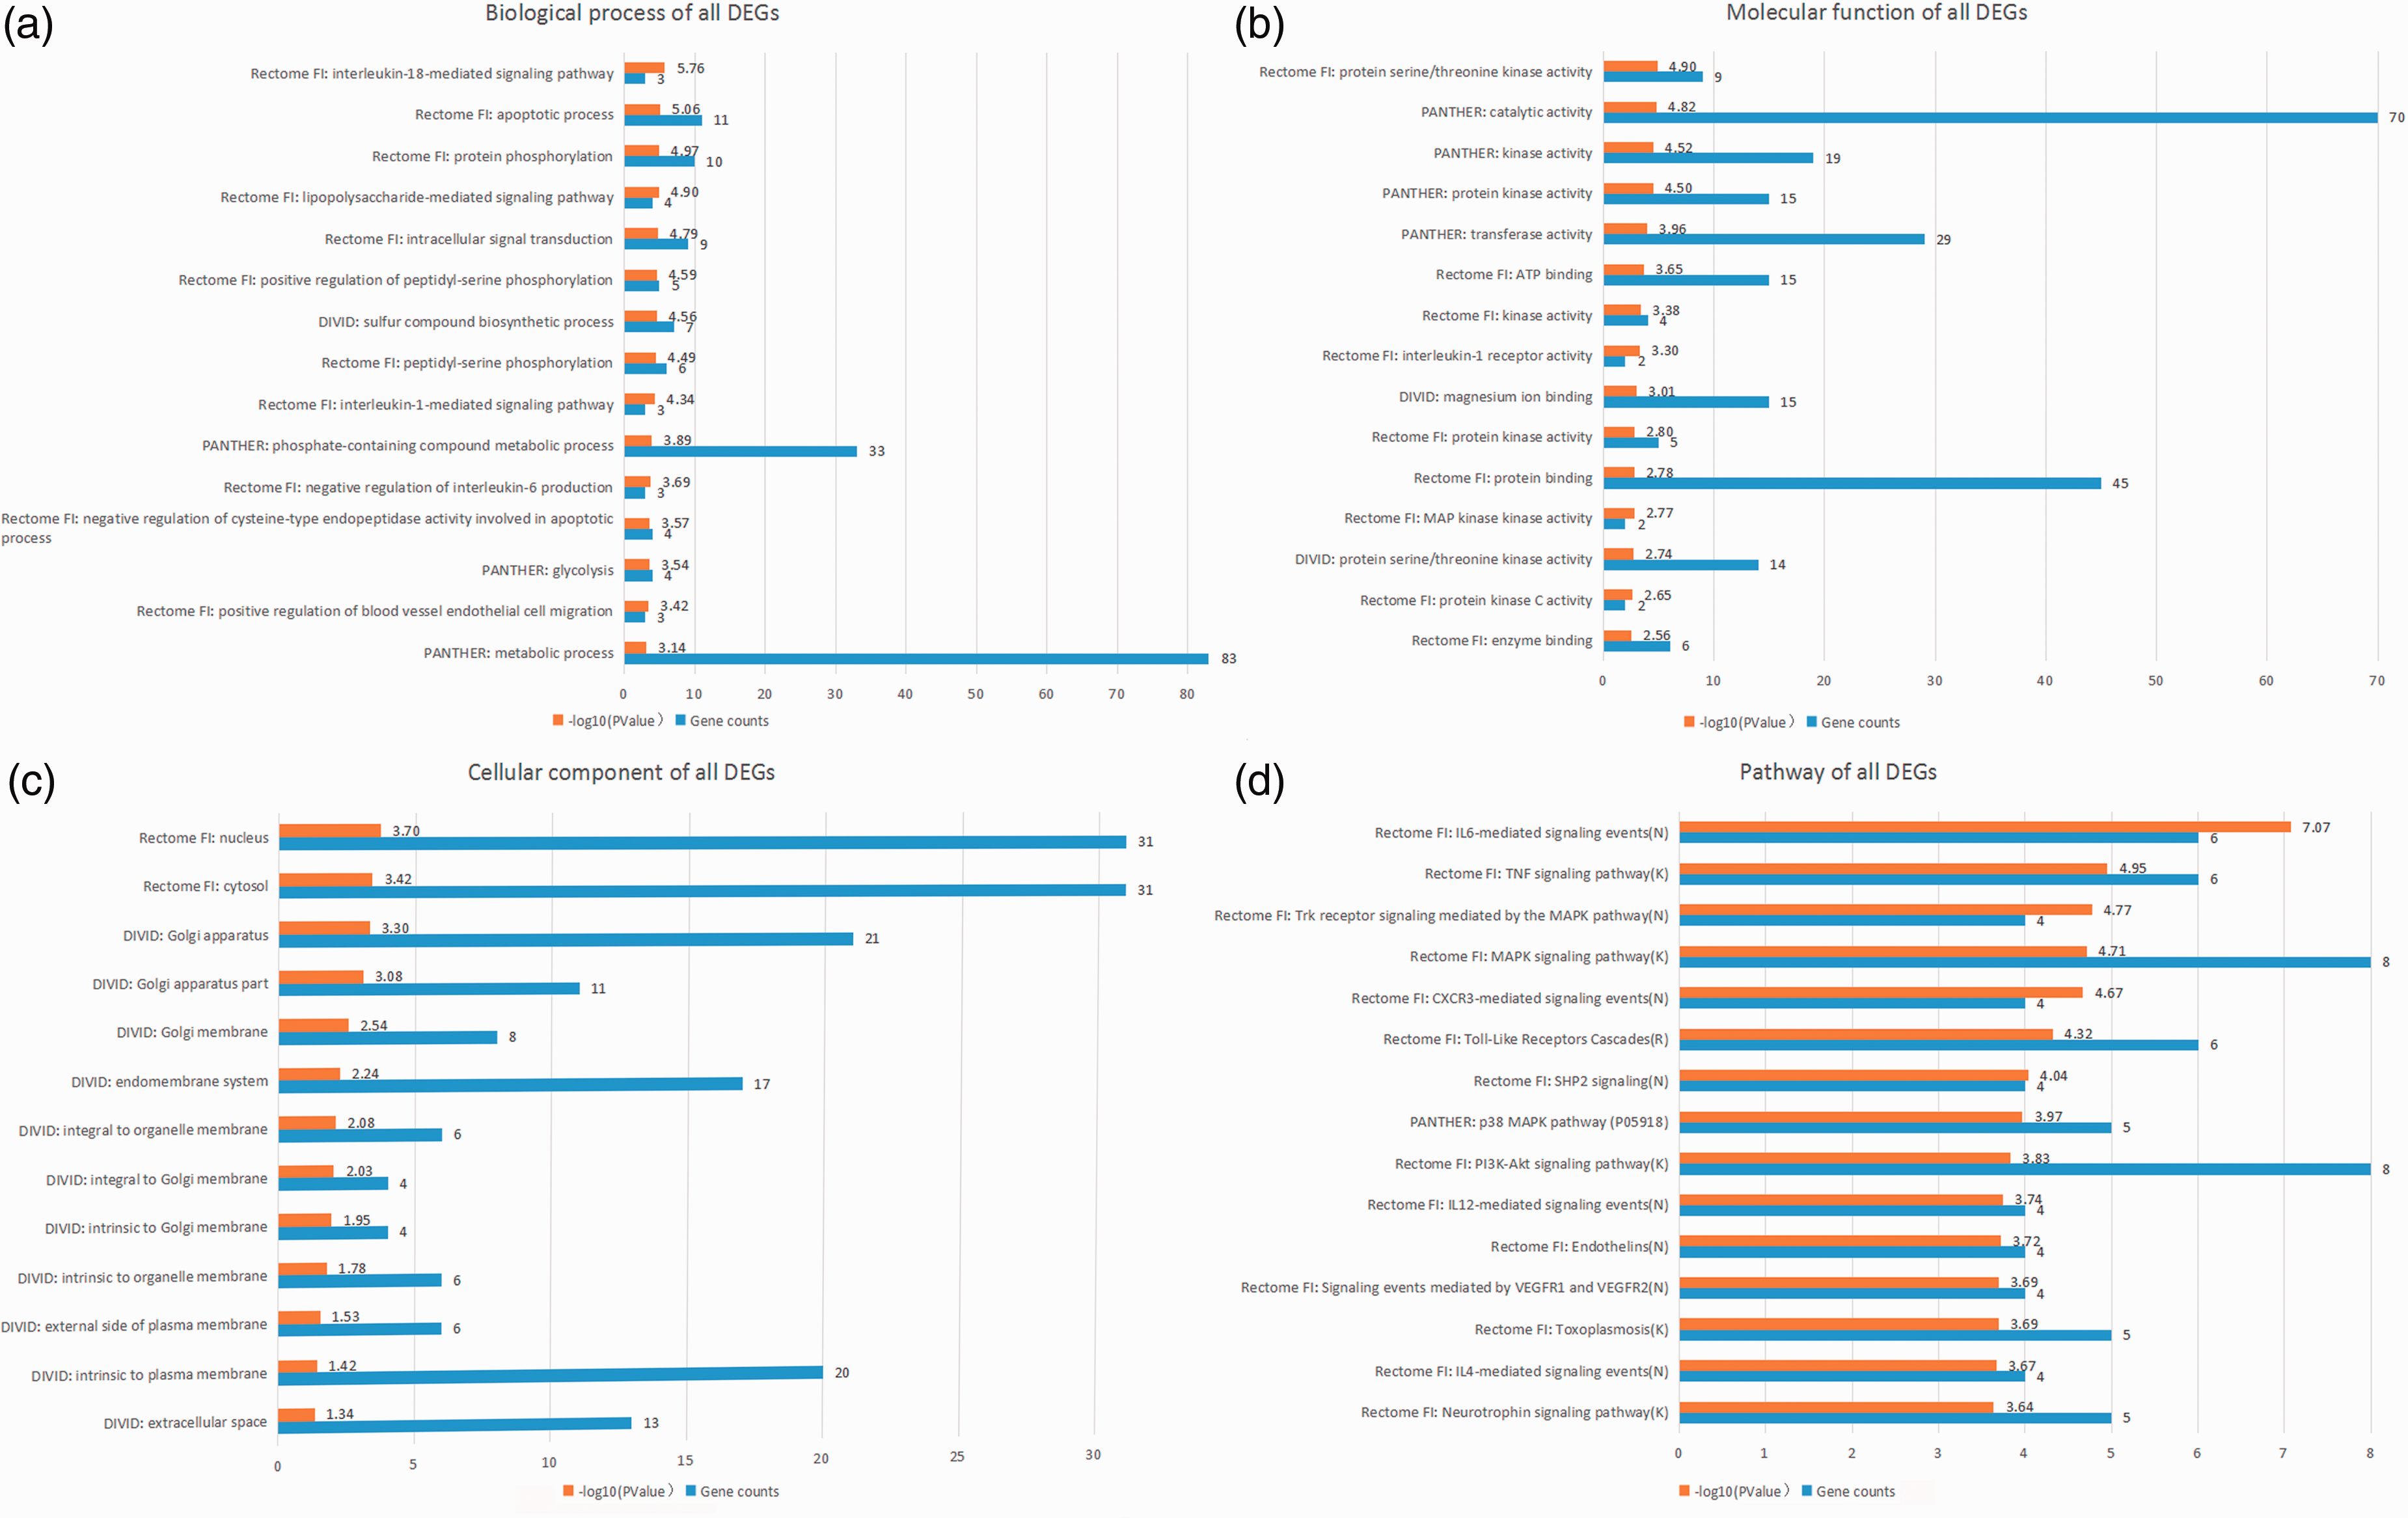
Top 15 integrated results of gene ontology and pathway enrichment analyses using all candidate DEGs.
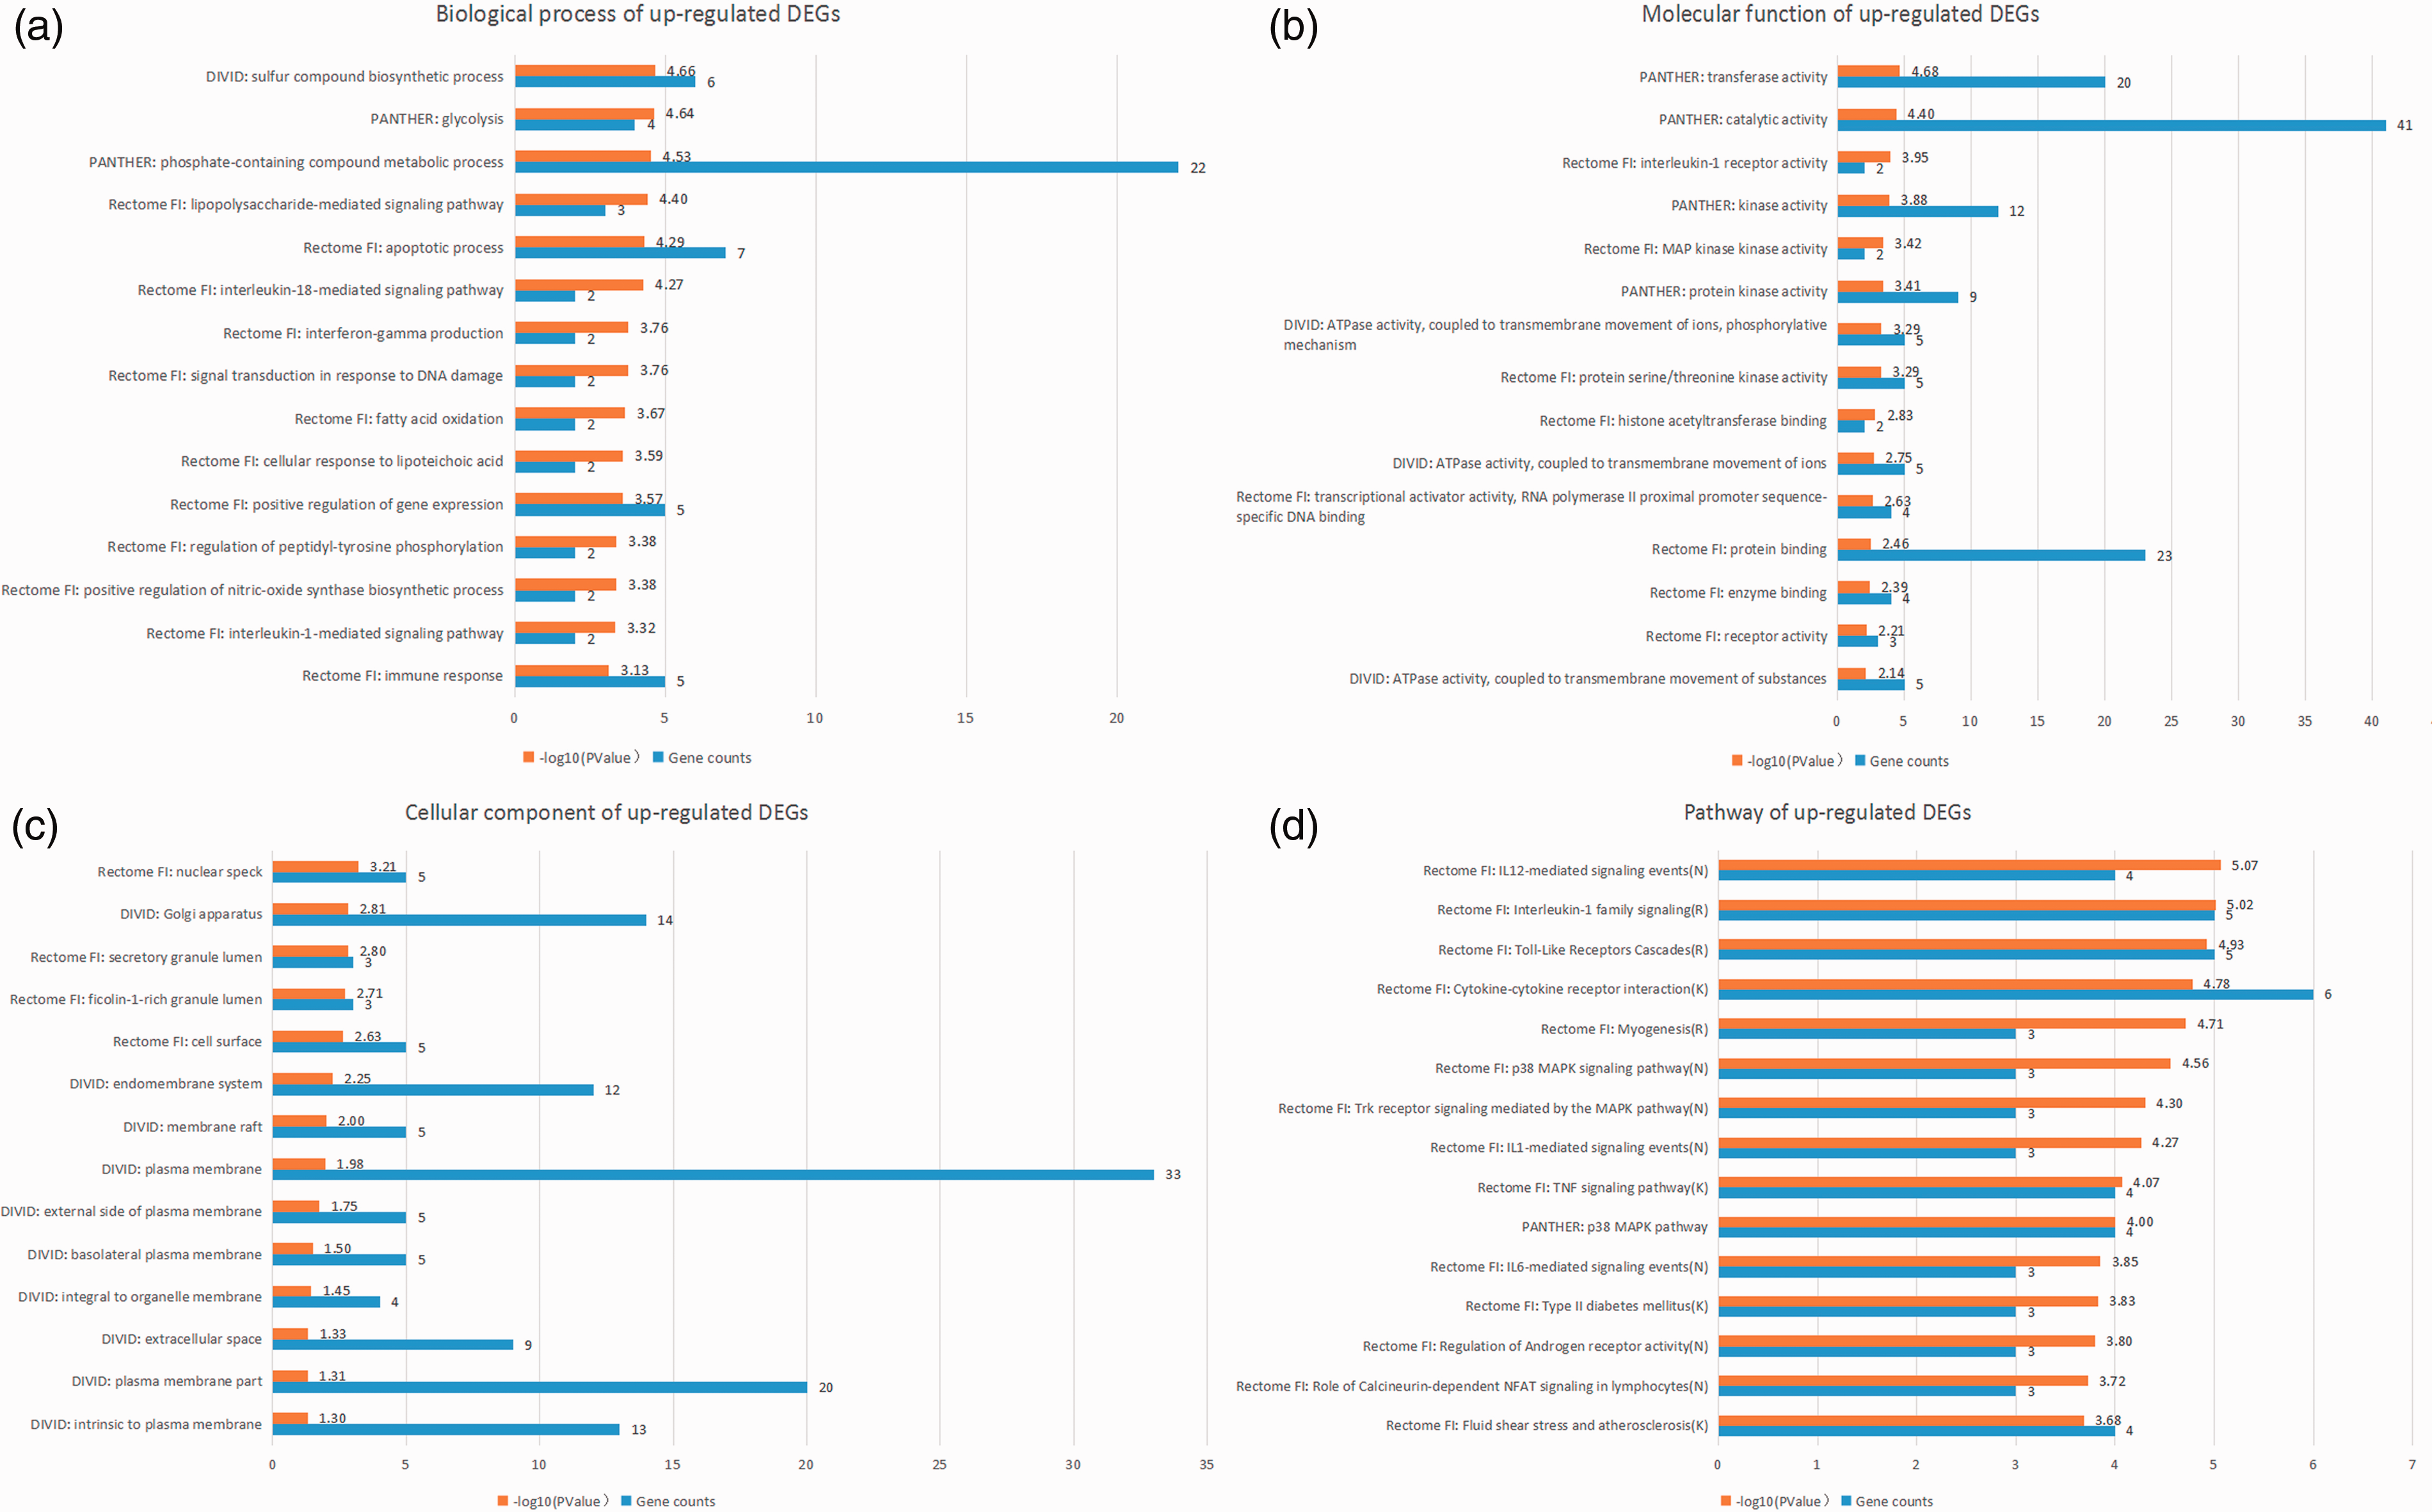
Top 15 integrated results of gene ontology and pathway enrichment analyses using up-regulated candidate DEGs.
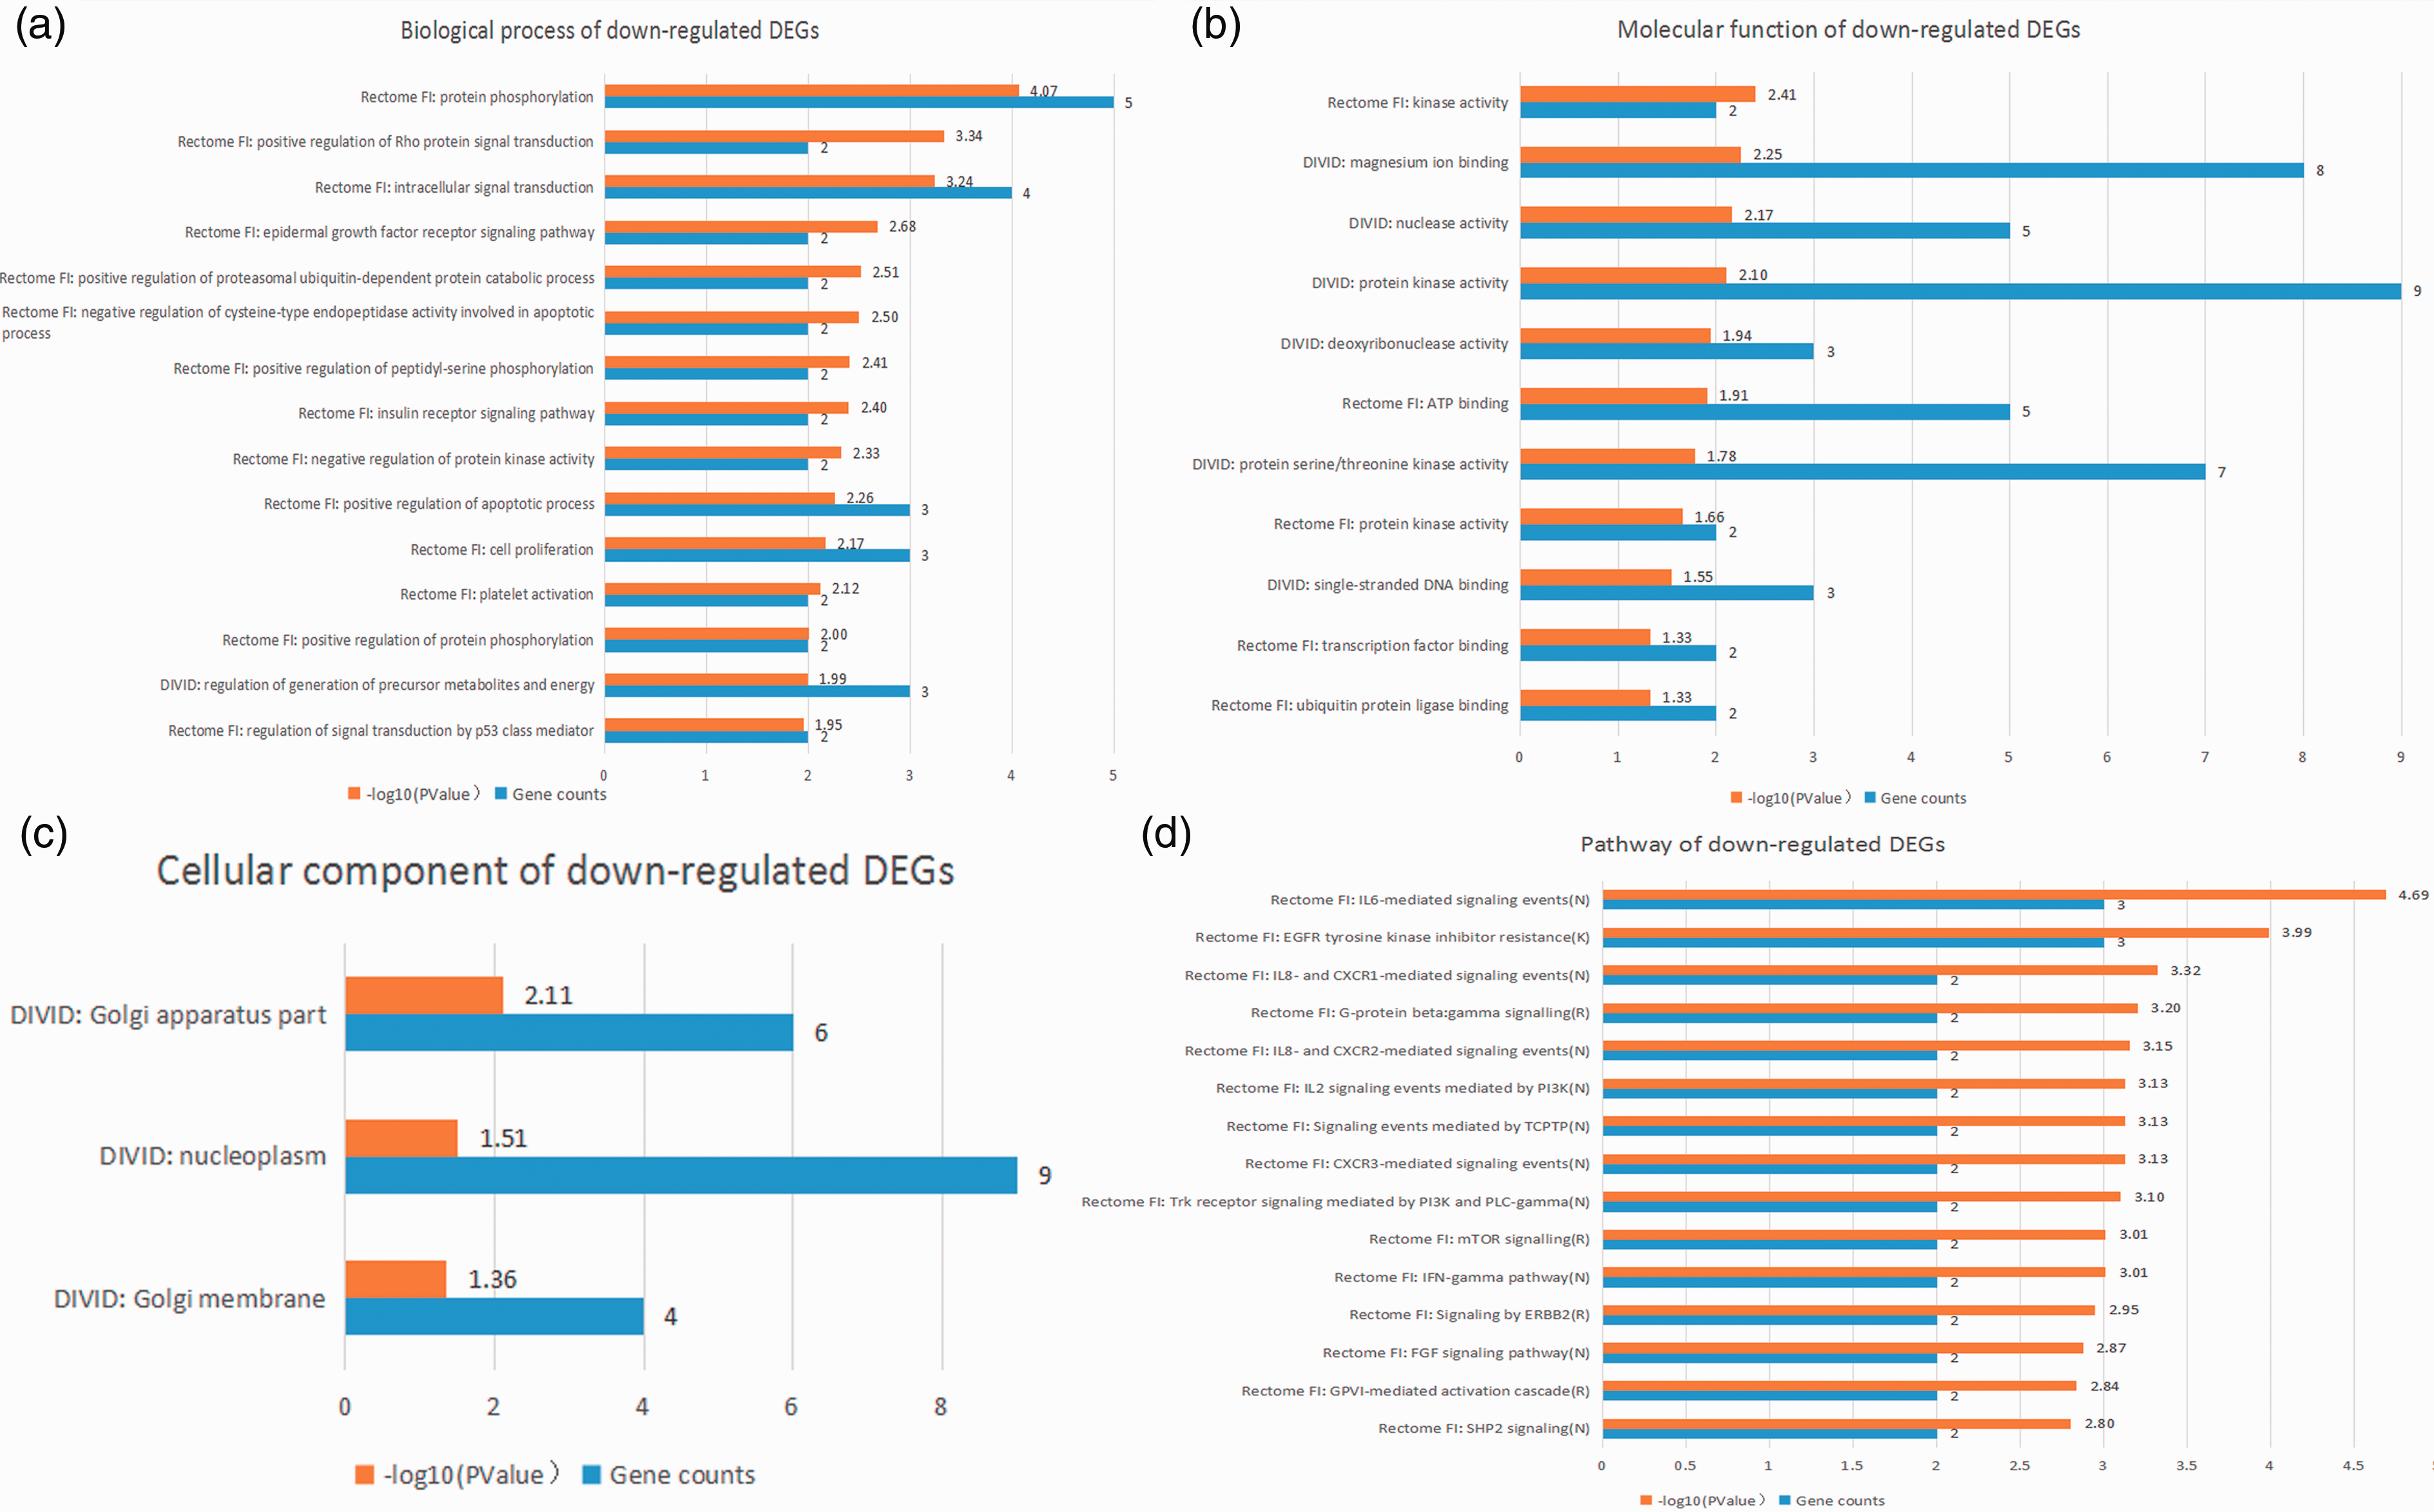
Top 15 integrated results of gene ontology and pathway enrichment analyses using down-regulated candidate DEGs.
Top 15 GO terms and pathways enriched for DEGs.
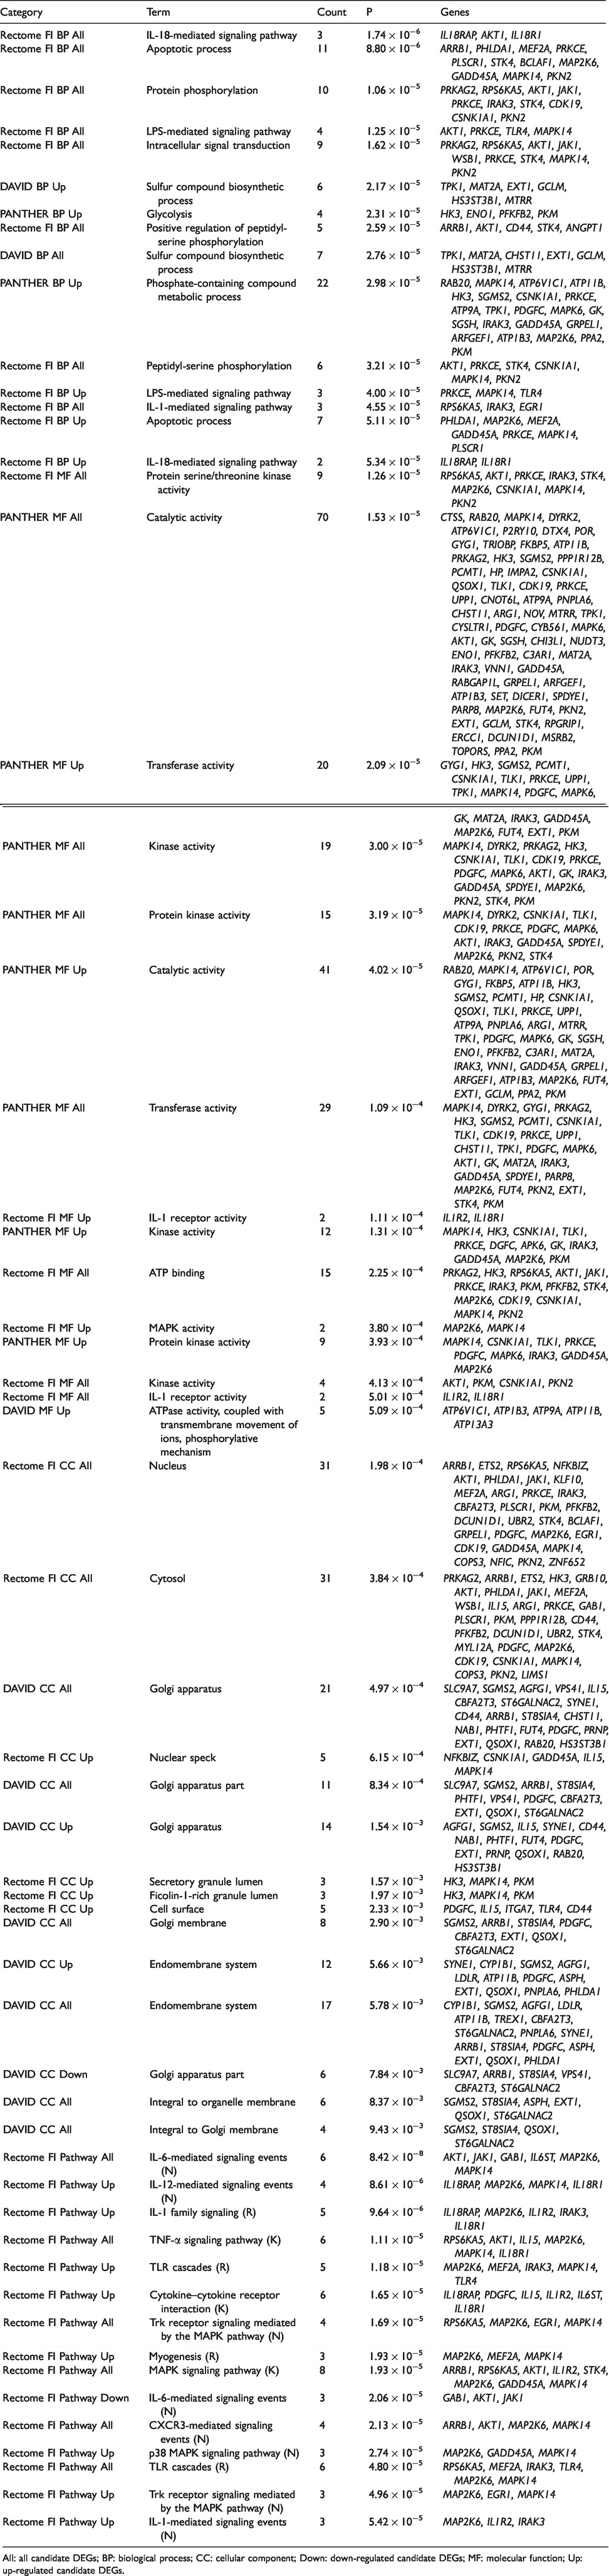
All: all candidate DEGs; BP: biological process; CC: cellular component; Down: down-regulated candidate DEGs; MF: molecular function; Up: up-regulated candidate DEGs.
As shown in Table 3, the top five GO biological processes were “IL-18-mediated signaling pathway,” “apoptotic process,” “protein phosphorylation,” “LPS-mediated signaling pathway,” and “intracellular signal transduction.” The top five GO molecular functions were “protein serine/threonine kinase activity,” “catalytic activity,” “transferase activity,” “kinase activity,” and “protein kinase activity.”. The top five enriched pathways were “IL-6-mediated signaling events,” “IL-12-mediated signaling events,” “IL-1 family signaling,” “TNF-α signaling pathway,” and “TLR cascades.” The P value of GO biological processes, molecular functions, and the enriched-pathway terms stated above was lower than 10−5.
Analyses of PPI networks and hub genes
First, we imported all candidate DEGs into the STRING database, loaded the STRING network in Cytoscape, and calculated the hub genes using the methods mentioned above. We found that 112 DEGs (70 up-regulated and 42 down-regulated genes) of 218 candidate DEGs were filtered into the PPI network of DEGs and contained 112 nodes and 159 edges (Figure 6a). Also, 106 of those 218 candidate DEGs did not fall into the PPI network of DEGs. Subsequently, the top 29 hub genes were obtained using CytoHubba in Cytoscape by integrating the results analyzed by the 12 methods (Figure 6b).
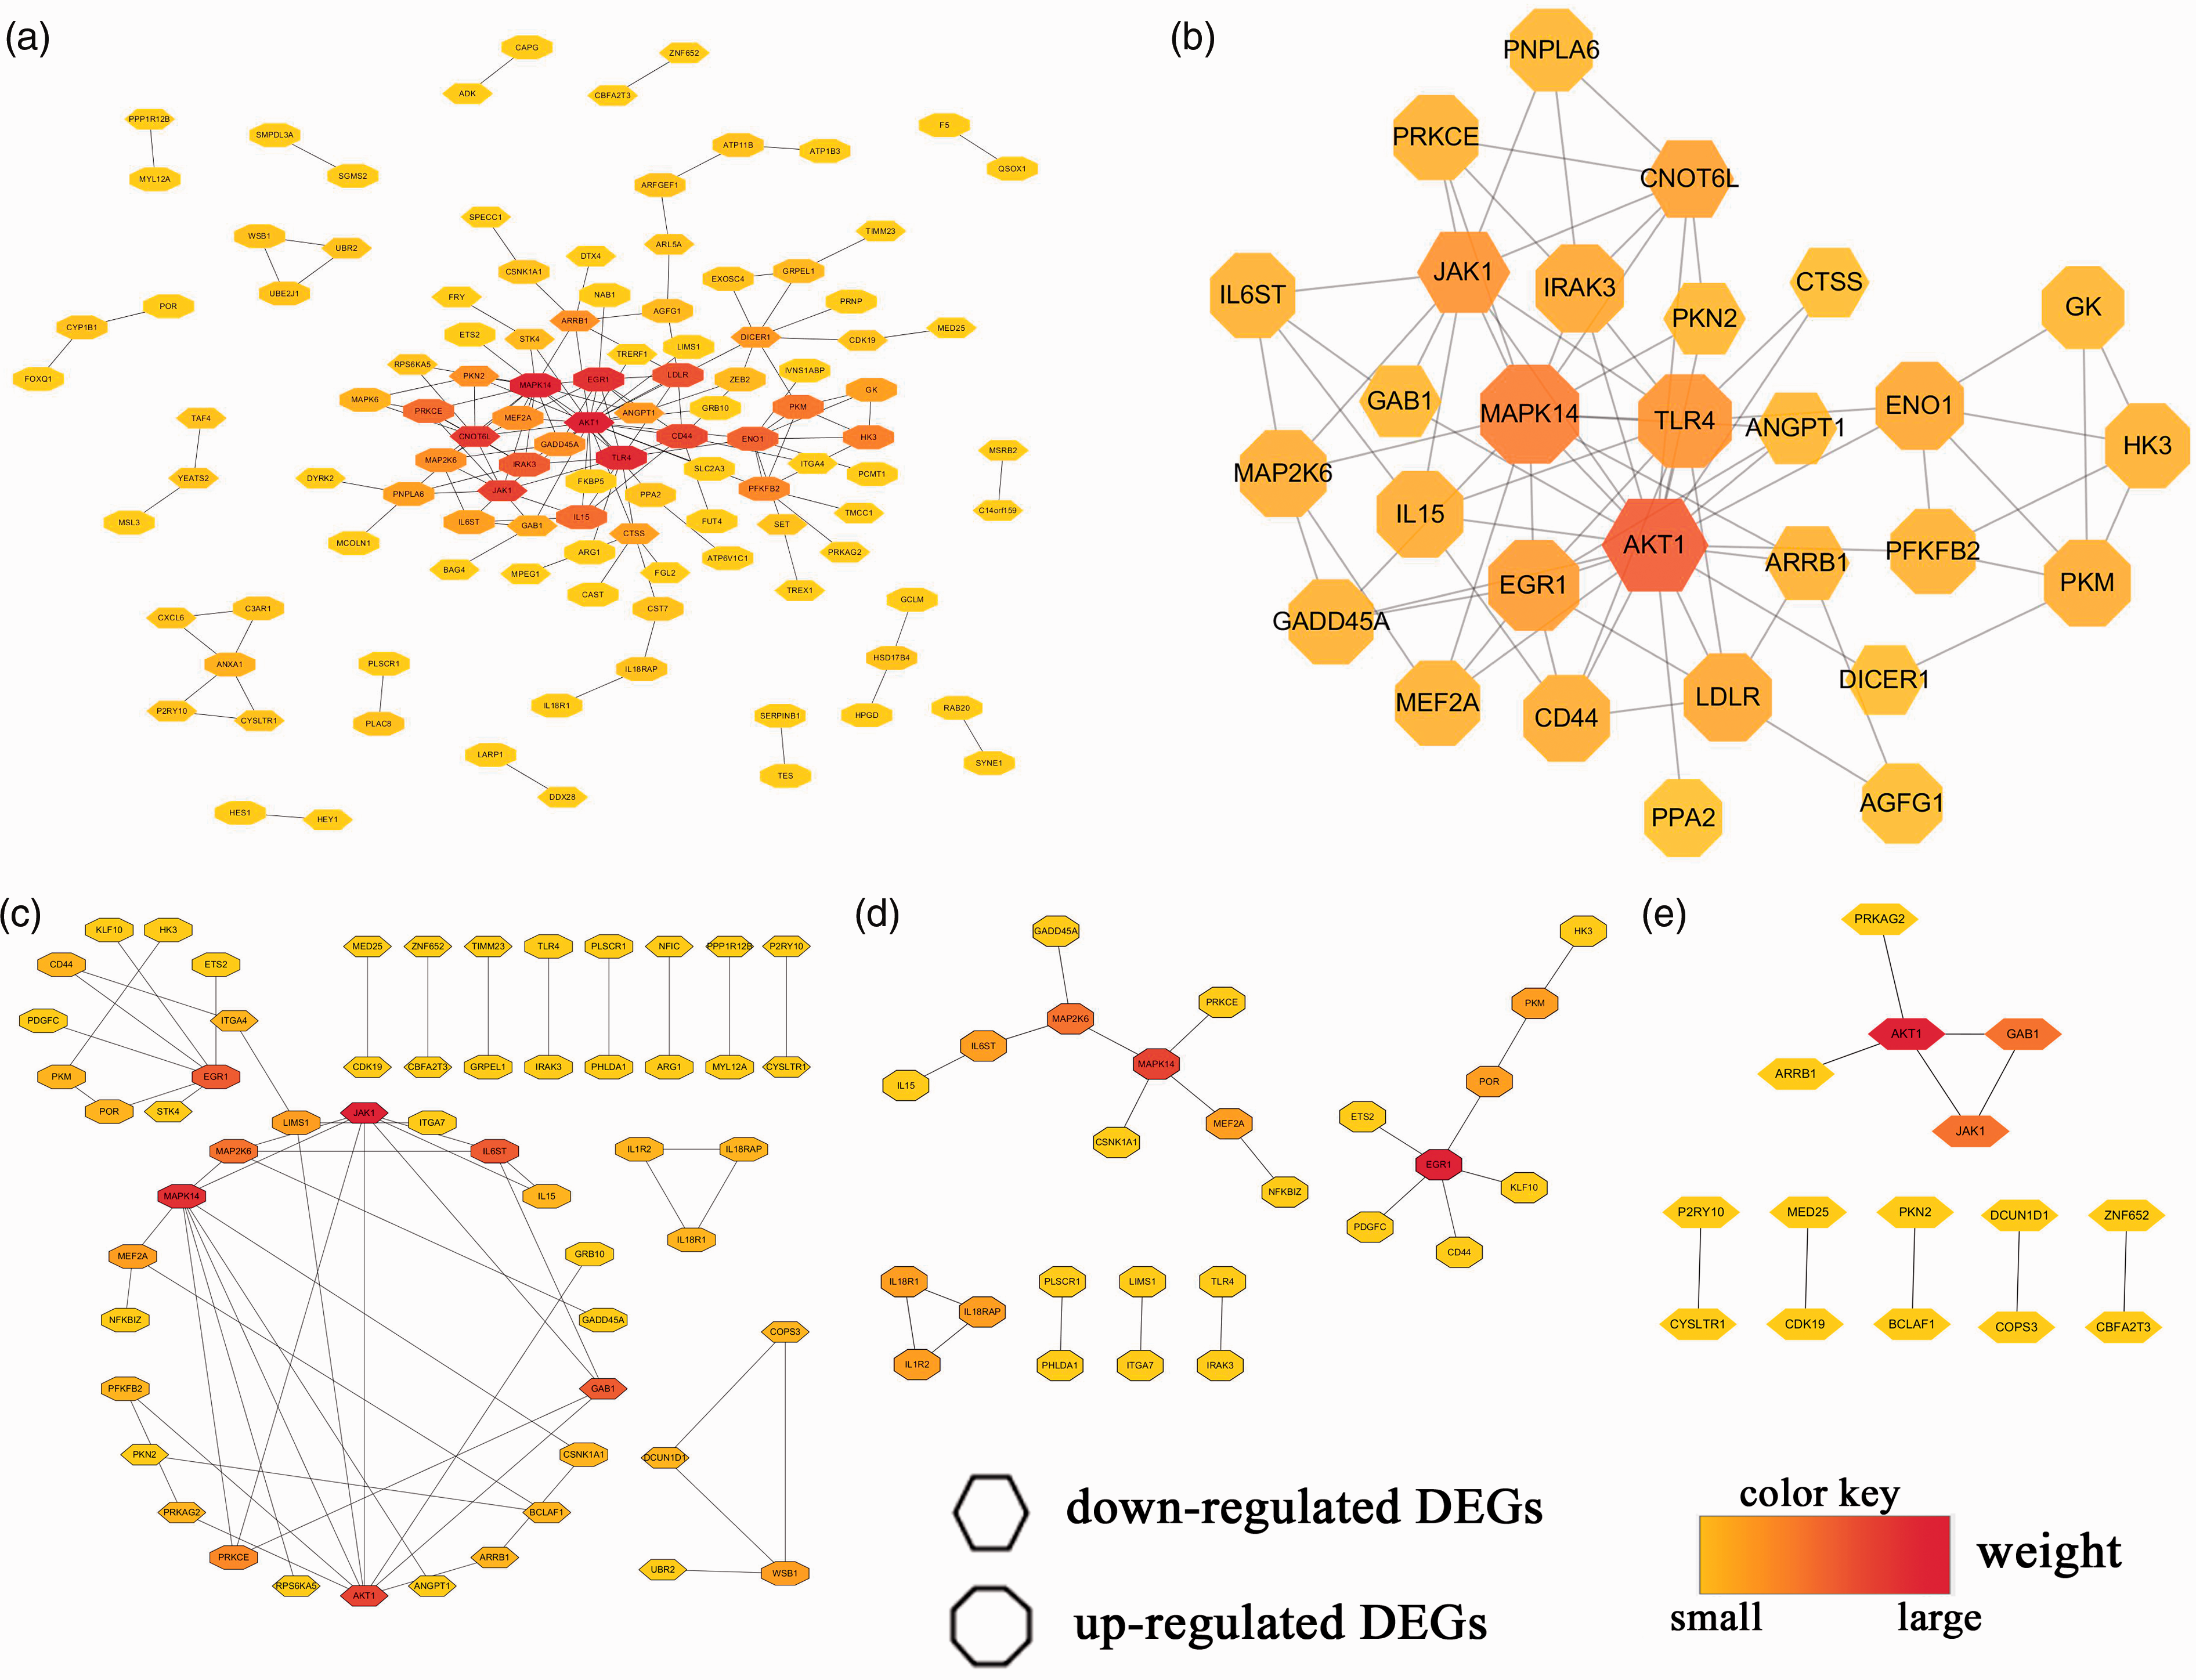
PPI networks and hub genes.
Second, through Reactome FI gene-set analysis in Cytoscape, we obtained PPI networks that included 55 DEGs (32 up-regulated and 23 down-regulated genes) from all 218 candidate DEGs (Figure 6c), 26 DEGs from 110 up-regulated candidate DEGs (Figure 6d), and 15 DEGs from 108 down-regulated candidate DEGs (Figure 6e). The hub-gene analysis of those PPI networks was conducted, and the results are visualized in Figure 6, with different colors in the corresponding octagon (representing up-regulated DEGs) or hexagon (representing down-regulated DEGs). Finally, using the results from Figure 6, we listed the top 10 of those hub genes in Table 4. The logFC and P value of the top 10 hub genes in Table 4 are shown in online Supplemental File S3.
Top 10 hub genes in Figure 6 (sorted by mass from large to small).
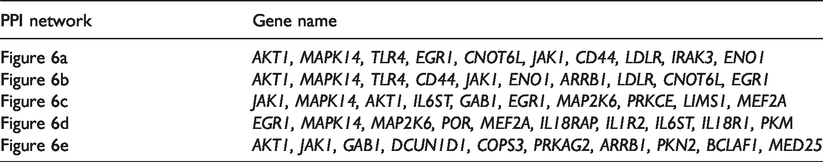
Taken together, these results showed that the most significant hub DEGs were AKT1, MAPK14, JAK1, EGR1, TLR4, CNOT6L, CD44, LDLR, ENO1, ARRB1, IL6ST, GAB1, and MAP2K6 (sorted by the frequency of occurrence in Table 4 from 4 to 2). In addition, CD44, LDLR, IL6ST, IL18RAP, and IL18R1 were present in both the top 10 of hub genes and the intersection of the three datasets.
Discussion
We screened DEGs by analyzing neutrophil samples that most probably showed neutrophilia as well as control samples from GSE64457, GSE94923, and GSE54644 datasets. As shown in the heatmaps obtained via hierarchical clustering analysis, the DEGs of these three datasets could clearly distinguish experimental samples from control samples. By intersecting DEGs from the up-regulated-DEGs group and down-regulated-DEGs group of every two datasets, we obtained 110 up-regulated DEGs and 108 down-regulated DEGs as candidate DEGs for analyses of GO, pathway enrichment, PPI networks, and hub genes.
Functional enrichment analysis showed that IL-mediated (IL-1, IL6, IL-12, and IL-18) signaling pathways, LPS-mediated signaling pathways,29,30 TNF-α signaling pathways,31,32 TLR cascades,33,34 MAPK signaling pathways,32,35,36 PI3K–Akt signaling pathways,36–38 and biological processes or molecular functions (e.g., apoptotic process, protein phosphorylation, intracellular signal transduction, kinase activity, catalytic activity, and transferase activity) were involved in neutrophils when neutrophil counts were increased in peripheral blood.
Several studies have demonstrated that the pathways, biological processes, and molecular functions mentioned above are implicated in neutrophil apoptosis and the pathogenesis of inflammatory diseases, some autoimmune diseases, and hematologic diseases.29–43 For example, IL-18 is a member of the IL-1 family and can be processed by caspase 1 to a biologically active mature form of size 18 kDa. 43 IL-1, IL6, IL-12, and IL-18 are pro-inflammatory cytokines that can promote the response of the immune system, induce local and systemic inflammation, and eliminate the microorganisms associated with tissue damage.39,41–43 All these pro-inflammatory cytokines have been found to be involved in the pathogenesis or etiology of various infections, gout, rheumatoid arthritis, inflammatory-induced bone destruction, periodontitis, and other inflammatory or autoimmune diseases. The IL-1 family also has important roles in the pathogenesis of several myeloid and lymphoid hematologic malignancies. 40 Besides, therapeutic targeting of the IL-1 pathway in patients with hematologic malignancies, autoinflammatory diseases, gout, and cancer therapy–related complications has been studied recently.39,40 IL-1 (as well as other cytokines or factors) may prove to be a very promising and useful target against diseases in the near future. Moreover, signaling pathways involving LPS,29,30 TNF-α,31,32 MAPK,32,35 TLR,33,34 and PI3K–Akt36–38 have been shown to be associated with PMN apoptosis.
Analyses of PPI networks and hub genes revealed the most important hub DEGs to be AKT1, MAPK14, JAK1, EGR1, TLR4, CNOT6L, CD44, LDLR, ENO1, ARRB1, IL6ST, GAB1, and MAP2K6. Besides, CD44, LDLR, IL6ST, IL18RAP, and IL18R1 were present in both the top 10 hub genes and the intersection of the three datasets. These genes may have important roles in inflammatory diseases as well as some autoimmune and hematologic diseases via the corresponding molecular functions or signaling pathways.30,44–61
In fact, some of these hub genes have been shown to be associated with such diseases because they influence the number of neutrophils by regulating the recruitment and apoptosis of neutrophils in peripheral blood or tissues.30,44,45,51,58,60,62 Moreover, some of these genes have been utilized as therapeutic targets in inflammatory diseases as well as some autoimmune and hematologic diseases.49,50,55,56,59,61,63
A study in mice by Liu and colleagues showed that protein kinase AKT1 was the dominant isoform expressed in neutrophils and that its expression was down-regulated following bacterial infection and neutrophil activation. 44 The expression trend of AKT1 in that study was in accordance with our results. The migration and bactericidal capacity of neutrophils with AKT1 deficiency is enhanced in the acute inflammatory response and mechanistically. The AKT1–signal transducer and activator of transcription (STAT)1 signaling axis can negatively regulate the recruitment and activation of neutrophils in acute inflammatory lung injury and Staphylococcus aureus infection in mice. 44 However, Di Lorenzo and co-workers found that the loss of AKT1 in vivo reduced the microvascular permeability markedly, which could suppress neutrophil efflux and then decrease the number of PMNs in tissues. 58 Moreover, several studies have demonstrated that AKT1 is involved in neutrophil apoptosis, 45 the inflammatory response, 46 and hematologic disease. 47 Consequently, the exact role of AKT1 in neutrophils merits further research.
The JAK1 gene is a critical effector of signaling of pro-inflammatory cytokines. The proliferation and differentiation of neutrophils are regulated by granulocyte-specific colony-stimulating factor (G-CSF) through tyrosine phosphorylation and activation of JAK1 and members of the SATA family. 57 Conversely, JAK1 inhibitors can cause a reduction in the number of neutrophils and exert anti-inflammatory activity, and could be used against rheumatoid arthritis (RA) and other autoimmune diseases. 56 Indeed, abnormal activity of JAK1 has been linked to immunologic and neoplastic diseases. 48 JAK1 inhibitors have been applied against rheumatoid arthritis,49,61 chronic neutrophilic leukemia, 50 and other immune-inflammatory diseases or hematologic diseases. Thus, JAK1 may be a very promising and useful target for treating those diseases in the near future.
MAPK14, also known as p38, still has the greatest weight in the interactions shown in Figure 6. The MAPKs act as integration points for multiple biochemical signals and are involved in the proliferation, differentiation, transcription regulation, and development of cells. Meanwhile, MAPK14 has important roles in inflammatory diseases and could be a target for autoimmune and other diseases. 59 Some reports have suggested that p38 MAPK may be involved in the apoptosis and recruitment of neutrophils. For instance, through activation of the p38/MAPK pathway, 1,25-dihydroxyvitamin-D3 can promote neutrophil apoptosis in the peripheral blood of patients with type 2 diabetes mellitus and periodontitis, 60 whereas IL-33 can regulate cytokine production and neutrophil recruitment. However, the association between MAPK14 and neutrophilia is incompletely understood and is an important issue for future research.
Besides, the number of PMNs could be regulated by other hub genes screened in our study. Murray and colleagues indicated that neutrophil apoptosis can be suppressed by TLR4 activation. 30 Several studies have demonstrated that the gene for cluster of differentiation (CD)44 is critically involved in neutrophil apoptosis, 51 inflammation, 52 and hematologic diseases.53,54 Furthermore, anti-CD44 mAbs have been studied for treatment of the aggressive forms of chronic lymphocytic leukemia. 55
In summary, the reports mentioned above support the results of our bioinformatics study. Nevertheless, some molecules need to be validated and researched further, for example, using quantitative polymerase chain reactions. Although we identified several key genes and pathways, some may have been missed. Experimental verification of our findings is important.
Conclusions
A total of 218 candidate DEGs were studied using multiple online databases and software: DAVID, PANTHER, Reactome, ReactomeFIPlugIn, and CytoHubba in Cytoscape. AKT1, MAPK14, JAK1, EGR1, TLR4, CNOT6L, CD44, LDLR, ENO1, ARRB1, IL6ST, GAB1, MAP2K6, and other hub genes might cause neutrophilia and be implicated in the pathogenesis of inflammatory diseases, as well as some autoimmune and hematologic diseases, through various signaling pathways.
Our findings provide new insights into the pathogenesis of some diseases and lay the foundation for selection of targets related to the diagnosis, treatment, and prognosis of those diseases.
Supplemental Material
INI887411 Supplementary material1 - Supplemental material for Identification of the key differentially expressed genes and pathways involved in neutrophilia
Supplemental material, INI887411 Supplementary material1 for Identification of the key differentially expressed genes and pathways involved in neutrophilia by Chengcheng He, Yingchun Zhang, Hongwei Luo, Bo Luo, Yancheng He, Nan Jiang, Yu Liang, Jingyuan Zeng, Yujiao Luo, Yujun Xian, Jiajia Liu and Xiaoli Zheng in Innate Immunity
Supplemental Material
INI887411 Supplementary material2 - Supplemental material for Identification of the key differentially expressed genes and pathways involved in neutrophilia
Supplemental material, INI887411 Supplementary material2 for Identification of the key differentially expressed genes and pathways involved in neutrophilia by Chengcheng He, Yingchun Zhang, Hongwei Luo, Bo Luo, Yancheng He, Nan Jiang, Yu Liang, Jingyuan Zeng, Yujiao Luo, Yujun Xian, Jiajia Liu and Xiaoli Zheng in Innate Immunity
Supplemental Material
INI887411 Supplementary material3 - Supplemental material for Identification of the key differentially expressed genes and pathways involved in neutrophilia
Supplemental material, INI887411 Supplementary material3 for Identification of the key differentially expressed genes and pathways involved in neutrophilia by Chengcheng He, Yingchun Zhang, Hongwei Luo, Bo Luo, Yancheng He, Nan Jiang, Yu Liang, Jingyuan Zeng, Yujiao Luo, Yujun Xian, Jiajia Liu and Xiaoli Zheng in Innate Immunity
Footnotes
Declaration of conflicting interests
The author(s) declared no potential conflicts of interest with respect to the research, authorship, and/or publication of this article.
Funding
The author(s) disclosed receipt of the following financial support for the research, authorship, and/or publication of this article: This study was supported by the National Natural Science Foundation of China (31470041), Foundation of Science and Technology Office in Luzhou (2016-S-65 (7/9)), and the Bureau of Economic Informatization and Science and Technology of Zhongjiang County, Deyang city (the Science and Technology Project of Zhongjiang County in 2018).
Supplemental material
Supplemental material for this article is available online.
References
Supplementary Material
Please find the following supplemental material available below.
For Open Access articles published under a Creative Commons License, all supplemental material carries the same license as the article it is associated with.
For non-Open Access articles published, all supplemental material carries a non-exclusive license, and permission requests for re-use of supplemental material or any part of supplemental material shall be sent directly to the copyright owner as specified in the copyright notice associated with the article.