
Abstract
Proteus spp. strains are some of the most important pathogens associated with complicated urinary tract infections and bacteremia affecting patients with immunodeficiency and long-term urinary catheterization. For epidemiological purposes, various molecular typing methods have been developed for this pathogen. However, these methods are labor intensive and time consuming. We evaluated a new method of differentiation between strains. A collection of Proteus spp. strains was analyzed by attenuated total reflectance Fourier transform infrared (ATR FT-IR) spectroscopy in the mid-infrared region. ATR FT-IR spectroscopy used in conjunction with a diamond ATR accessory directly produced the biochemical profile of the surface chemistry of bacteria. We conclude that a combination of ATR FT-IR spectroscopy and mathematical modeling provides a fast and reliable alternative for discrimination between Proteus isolates, contributing to epidemiological research.
Keywords
Introduction
Fourier transform infrared (FT-IR) spectroscopy is a fairly new, high-resolution technique used to study the entire molecular composition of microbial cells. The basis of FT-IR spectroscopy is the interaction of infrared radiation with the bacterial isolate, providing a highly specific pattern of the cell and detecting even minimal cellular compositional changes that other methods fail to reveal.1–5 This is possible because all functional groups of organic molecules are able to absorb IR light. 6 FT-IR analyzes the chemical bonding in the total biochemical composition of the cell, including the cell wall, membrane (composed of phospholipid bilayer, peptidoglycan and LPS) and the cytoplasm (fatty acids, water, nucleic acids, proteins and polysaccharides).4–8
The most commonly used method is the attenuated total reflectance FT-IR technique (ATR FT-IR). When using this, it is not required in samples to suspend and then dehydrate colonies, which results in simpler (direct) sample preparation, is easy to implement, allows the analysis of small quantities of biomass, and requires no consumables or reagents, and reduces costs.2,4,9 ATR FT-IR has created new opportunities for epidemiological studies, allowing the identification of bacteria strains, evaluation of their relationships and monitoring of clone dissemination. 10
The detection, identification and classification of bacterial strains are routinely carried out using serological tests, as well as biochemical analysis, based on their growth and nutritional properties. 4 In the former technique, the serological specificity of bacteria is determined by structural differences in the O-specific polysaccharide (OPS) of LPS. 11 Greater effectiveness is achieved by means of molecular methods based on DNA fingerprints, such as PCR-based molecular markers, RAPD (random amplified polymorphic DNA) and repetitive sequence-based PCR genomic fingerprinting, including repeated sequences ERIC (enterobacterial repetitive intergenic consensus sequence), REP (repetitive extragenic palindromic sequence) and BOX (repetitive intergenic sequence elements of Streptococcus).10,12,13 Ribotyping with pulsed-field gel electrophoresis has also been used for Proteus characterization at the species level. 12 However, these methods are laborious, expensive and time consuming, and mostly based on genotypic discrimination and less on phenotypic discrimination. 4 Spectroscopic techniques coupled with chemometric tools demonstrate interesting potential for the identification and typing of pathogenic bacteria, analyzing their phenotypic differences. 14 The interpretation of ATR FT-IR spectra requires the use of pattern recognition methods, such as cluster analysis and principal component analysis (PCA), to disclose relationships. Random forest (RF), differential index and Kohonen network can be used to create classification functions able to identify unknowns. 4
The Gram-negative bacterium Proteus spp., belonging to the Enterobacteriaceae and widespread in the natural environment, are common human pathogens. 15 Proteus mirabilis accounts for up to 10% of uncomplicated urinary tract infections (UTIs), is the third most common cause of nosocomial UTIs [after Escherichia coli (52%) and Enterococcus spp. (12%)],16–18 and may also cause wound infections and sepsis in hospitalized individuals. 19 UTIs may also be caused by P. mirabilis species affecting patients with anatomical abnormalities, immunodeficiency and long-term urinary catheterization.12,19 Proteus infections can cause complications such as bladder and kidney stone formation, 20 catheter obstruction by the formation of encrusting biofilms, and bacteremia. 18 What is also important is that Proteus strains may manifest resistance to several antimicrobial agents, including extended-spectrum cephalosporins, fluoroquinolones and aminoglycosides. 21 Owing to the increasing clinical relevance of P. mirabilis, 22 the development of efficient identification methods is of great epidemiological significance.
Proteus mirabilis pathogenicity is mainly due to virulence factors such as hemolysin, swarming, adhesins, fimbriae, proteases, urease and LPS. 19 As in many Gram-negative bacteria, P. mirabilis LPS consist of three domains: a toxic glycolipid (lipid A), a core oligosaccharide (OS) region and the OPS.19,23,24 The chemical structures of Proteus OPS were determined completely, and on this basis of immunospecificity 78 serogroups have been classified. 24 Core oligosaccharides, as well as lipid A structures, were also established. 25
As P. mirabilis strains are most relevant clinically among the genus Proteus, 32 representative strains were the objective of this study, including the LPS deep rough mutant R45 (Re chemotype) and completely DNA-sequenced strain ATCC 29905. The aims were to check the feasibility of ATR FT-IR spectroscopy as a typing method for P. mirabilis strains. The databases of IR spectra of 32 Proteus strains with defined LPS were the subject of five different chemometric analyses. Finally, based on the mathematical modeling of laboratory strains, IR spectra of 14 clinical P. mirabilis strains, isolated from human UTIs, were compared in order to a degree of theirs phenotypic diversity.
Materials and methods
Bacterial strains
Proteus species laboratory strains were obtained from the Czech Collection of Type Cultures, Institute of Microbiology and Epidemiology, Prague, Czech Republic. Proteus mirabilis strains S1959 and R45 were obtained from the Institute of Microbiology and Immunology, University of Lodz, Lodz, Poland, and ATCC 29905 strain came from the American Type Culture Collection. Fourteen clinical isolates of P. mirabilis were from the Department of Urology, Swietokrzyskie Oncology Center, Kielce, Poland. All strains were cultured independently in 10 replicates for 18 h at 37℃ on LB agar medium.
ATR FT-IR
The biochemical profile of a bacterial sample was measured by ATR FT-IR spectroscopy. Sample preparation procedures included direct transfer of bacterial colonies from agar plates using a plastic loop, taking care not to disrupt the agar. A background measurement was done prior to the placement of each sample on the crystal. The crystal was cleaned with 70% ethanol and then acetone prior to examining subsequent samples. 9 ATR FT-IR spectra were recorded on a Spotlight 400 FTIR Imaging System (Perkin Elmer, Waltham, MA, USA). Ten individual colonies of each strain were tested at room temperature (18℃). 10
Spectral preprocessing
Spectra were collected over the wavelength range of 4000–900 cm−1. 26 Spectra were acquired with a resolution of 1 cm−1, and 50 spectra were co-added and averaged to improve the signal to noise ratio. The spectra are displayed in terms of absorbance. Preprocessing was done by baseline correction (GIFT linear) and smoothing (Savitsky–Golay algorithm/Quintic with a window of 51) of the total spectral region. The spectra were normalized so that the smallest recorded absorbance was set to 0 and the highest to 1 for each spectrum, and then the first derivatives (Savitzky–Golay with a window of 9) were used for mathematical analysis. First-order derivatization was used to increase the number of discriminant features present in the spectra.
Mathematical modeling
The data were explored with a set of statistical techniques including measures based on the Pearson correlation coefficient, hierarchical cluster analysis (HCA), principal component analysis (PCA), random forest (RF), and self-organizing maps. In some analyses, the concept of average spectra (AS) was used. An AS for a given bacterial strain was estimated on the basis of all replicates of that strain in such a manner that the arithmetic mean of absorbance was calculated for each wave number.
To measure the degree of similarity between two bacterial strains, we used the differentiation index D expressed as D = (1 − r) × 1000, where r indicates the Pearson correlation coefficient. 10 Smaller D values indicate more similar strains (for identical strains D = 0). The computation was performed on AS.
Moreover, the mean value of D indexes evaluated for all pairs of spectra within a given strain served as a measure of stability of bacterial strains. The objective of HCA is to group similar objects (in our case, bacterial strains) into clusters. A cluster is a group of objects that are similar in some sense, while objects in different clusters are dissimilar in the same sense. The grouping of strains into clusters was performed using Ward’s hierarchical agglomerative algorithm based on Euclidean distance measure. In this algorithm clusters are formed with the intention to minimize within-cluster variation and maximize between-cluster variation. The result of hierarchical classification is represented by a hierarchical tree diagram (dendrogram). 1 In our analyses, we used HCA to determine clusters in laboratory strains and to evaluate a given clinical strain according to its similarity to the laboratory strains. PCA is another exploratory tool for multivariate data. PCA offers the possibility of projecting multivariate data onto a lower-dimensional space without losing important features of the data. This is done by replacing the original variables by principal components, which are linear combinations of the initial variables. Principal components are created with the idea that they must be uncorrelated with one another, with the first one describing as much variability in the data as possible, the second one explaining the maximum amount of the remaining variability, and so on. 1 In our analysis, we used PCA for graphical inspection of the potential grouping of bacterial strains. HCA and PCA (both known as unsupervised learning methods) were performed on AS. RF is a modern statistical technique for classifying objects into predefined classes. In the first step, RF is ‘trained’ using data with known classification (in our case, the laboratory strains), while in the next step the ‘trained’ RF is used to classify new data (in our case, the clinical strains). 1
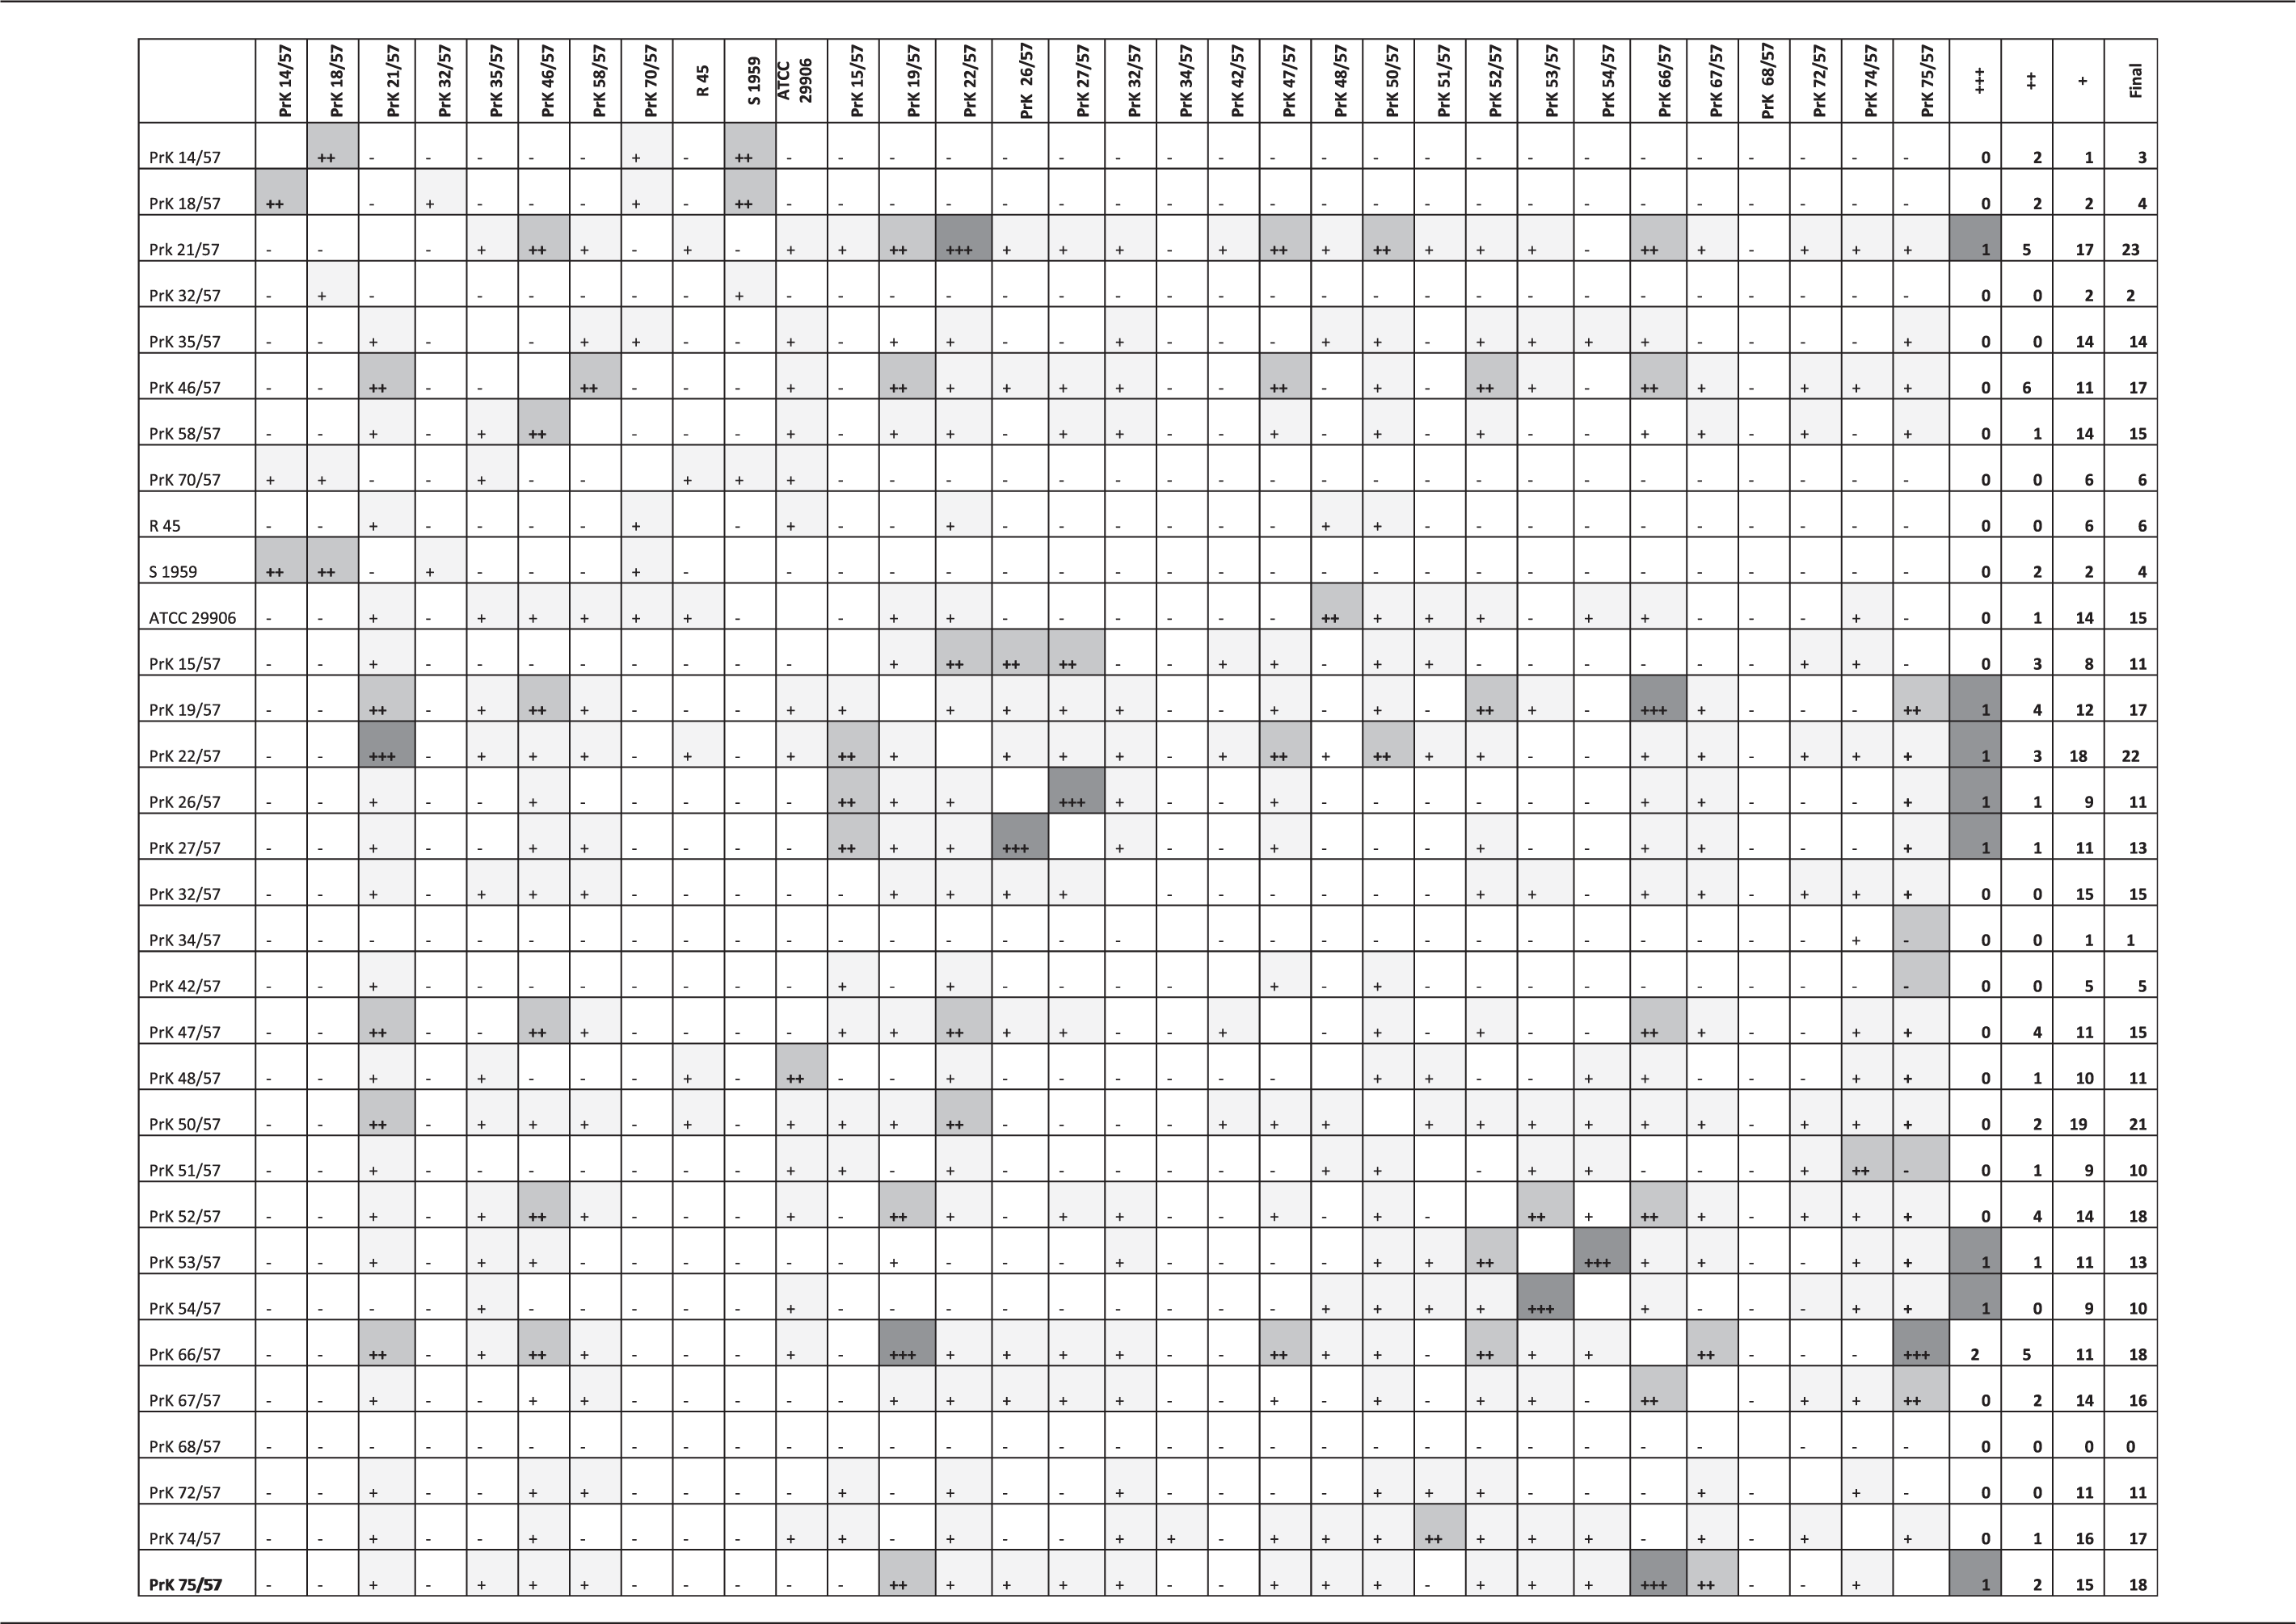
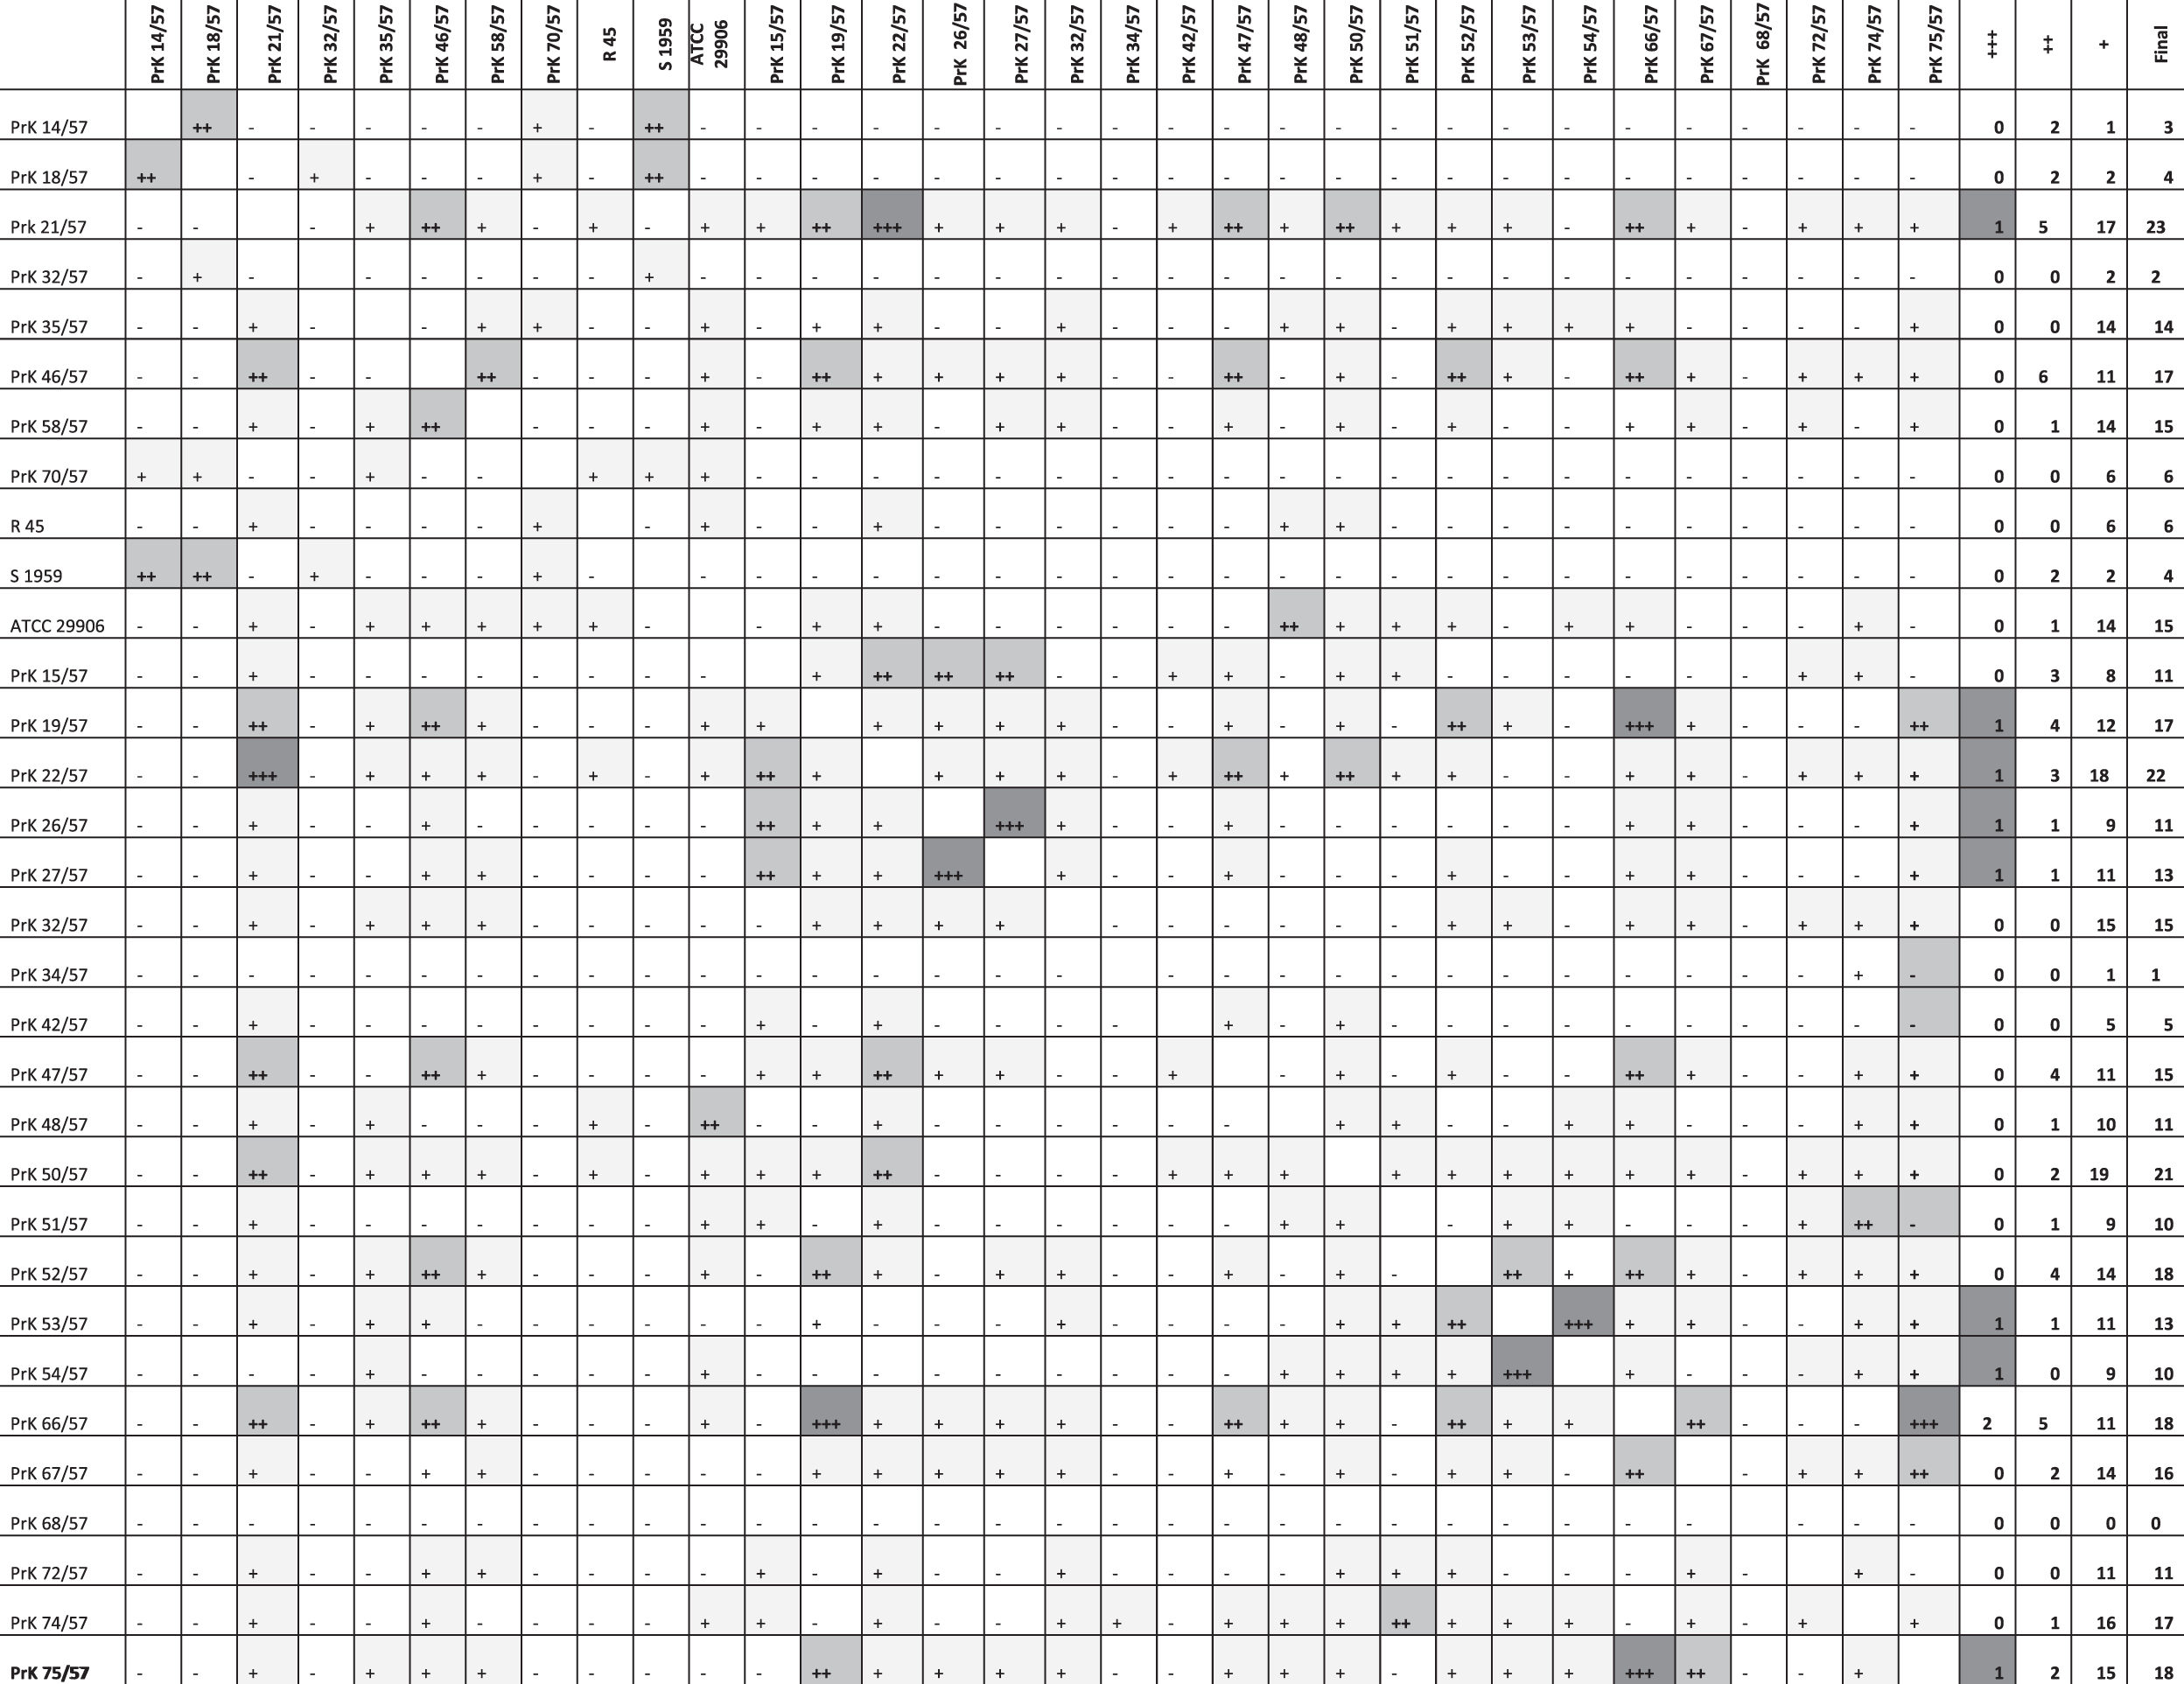
Differentiation index (D), as determined for the averaged IR spectra of particular bacterial strains. The smaller the value of D, the more similar the strains (for identical strains D = 0); these values are marked ‘+ + +’ for D ≤ 5 (very strong similarity), ‘+ +’ for 5 < D ≤ 10 (strong similarity) and ‘+’ for 10 < D ≤ 20 (moderate similarity).
All statistical computations were carried out using R version 3.2.3 software. 27 The R package ‘randomForest’ version 4.6-7 and the ‘Kohonen’ version 2.0.19 package were also used. 28
Results
The purpose of this ATR FT-IR analysis was to check the feasibility of this technique to typing Proteus isolates using different chemometric methods. A data set of 460 spectra representing selected laboratory Proteus spp. strains was analyzed. The isolates studied have defined OPS structure, and they showed a degree of phenotypic diversity.23,29 Preprocessing of the ATR FT-IR spectra was required before modeling. The Savitzky–Golay filter was applied to reduce noise, and the first derivative was considered. The filter parameters were a 9-cm−1 filter window and the first derivative was calculated. The preprocessed spectra were also mean-centered prior to mathematical modeling. Initially, the entire spectral range (4000–900 cm−1) was considered in the analysis (Figure 1a).
(a) First derivative spectra of 18 h culture of Proteus mirabilis S1959, R45, and PrK 19/57. The spectra were normalized on the amide I band at 1,655 cm−1; (b) The polysaccharide region of Proteus mirabilis S1959, R45, and PrK 19/57. Each strain was tested using ten independent cultures.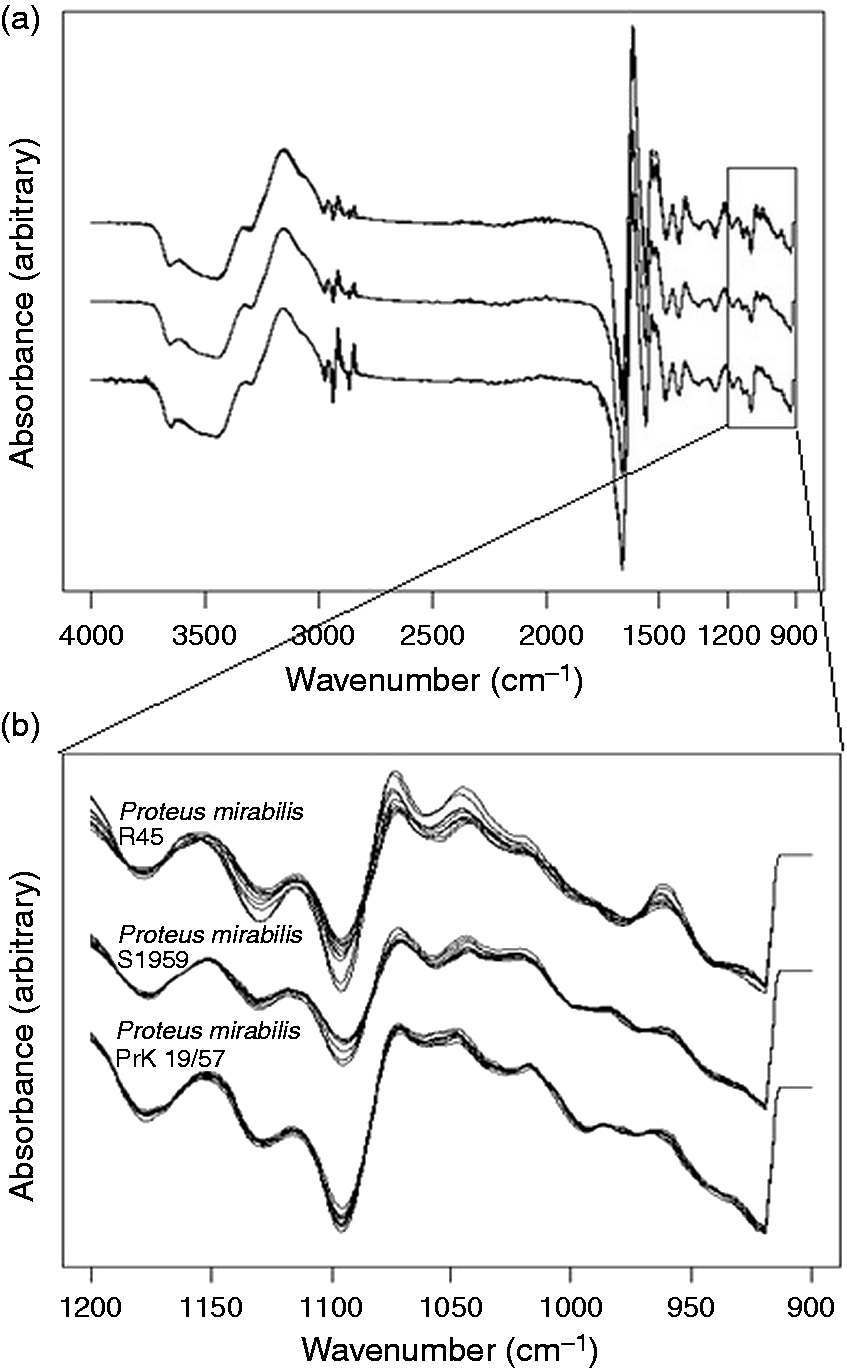
Analysis performed using the entire wavenumber region did not allow for the differentiation of Proteus strains. In order to better assess the importance of different spectral regions in the discrimination models, analysis was repeated for intact cell ATR FT-IR spectra by considering different subsets of the spectral range. ATR FT-IR spectra of bacteria contain information from all chemical structures of the cells. However, it is common to subdivide the spectral range according to some of the principal biological building blocks, including fatty acids (3000–2800 cm−1), proteins and amides I and II (1700–1500 cm−1), phospholipids, DNA, RNA (1500–1200 cm−1), polysaccharides (1200–900 cm−1) and true fingerprinting (900–700 cm−1).4,9 To determine whether better discrimination could be obtained by considering each spectral window separately, mathematical models were built using intact cell spectra. The rates of correct predictions were then compared with the rates obtained for the entire spectral range. The results revealed that the best model was obtained using the 1200–900 cm−1 spectral range (Figure 1b). Thus, our further analysis concerned the 1200–900 cm−1 spectral range. 30
Using the information contained in this spectral range as input for cluster analysis, a distinct clustering was observed according to the dendrogram (Figure 2). This dendrogram clearly showed the presence of main clusters according to the grouping scheme suggested by O serotyping. Moreover, we randomly selected one replicate for each laboratory strain and performed HCA on many sets of data obtained in this way. To validate these results, we constructed many sets of data, including randomly selected replicates. HCA received two clusters A and B.
Hierarchical cluster analysis of Proteus spp. laboratory strains by ATR FTIR spectroscopy.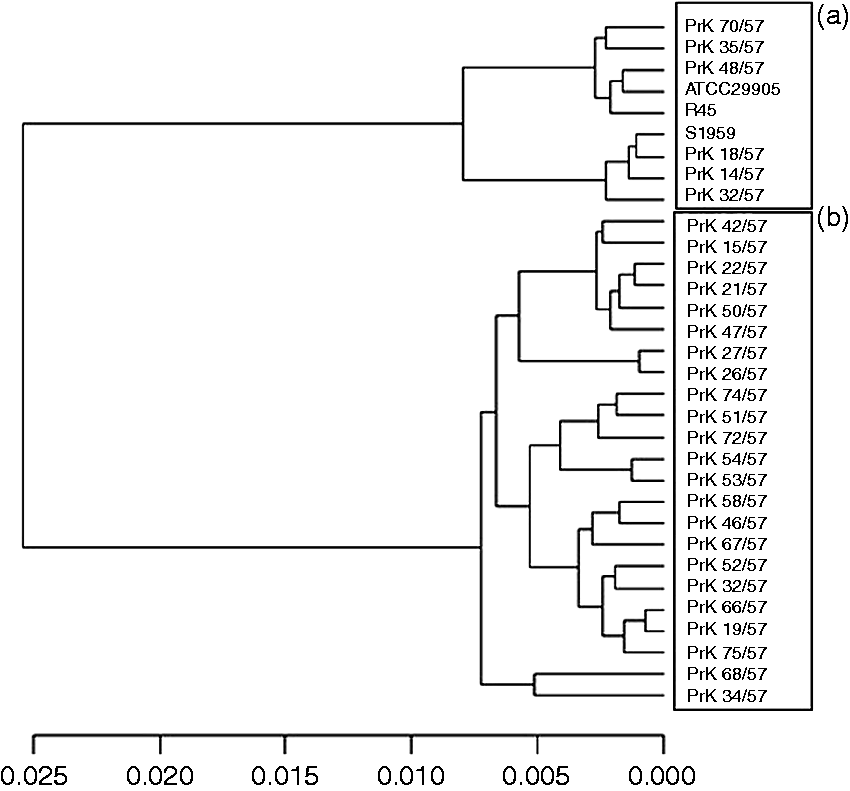
Cluster A (n = 9) included the following Proteus spp. strains: PrK 14/57 (O6), PrK 18/57(O9), PrK 32/57 (O17), PrK 35/57(O19), PrK 70/57 (O44), R 45 (O3), S1959 (O3), ATTC 29905 (O1) and PrK 48/57 (O25). Cluster B (n = 23) included the following strains: PrK 21/57 (O10), PrK 46/57(O24), PrK 58/57(O32), PrK 15/57 (O7), PrK 19/57(O10), PrK 22/57 (O11), PrK 26/57(O13), PrK 27/57(O13), PrK 32/57 (O17), PrK 34/57 (O18), PrK 42/57 (O23), PrK 47/57 (O24), PrK 50/57 (O27), PrK 51/57 (O28), PrK 52/57 (O29), PrK 53/57 (O30), PrK 54/57 (O30), PrK 66/57 (O40), PrK 67/57 (O41), PrK 68/57 (O42), PrK 72/57 (O37), PrK 74/57 (O48), PrK 75/57 (O49).
PCA did not reveal new distinct groups but confirmed that the above-mentioned strains tend to group together (Figure 3).
Principal component analysis of Proteus spp. laboratory strains by ATR FTIR spectroscopy.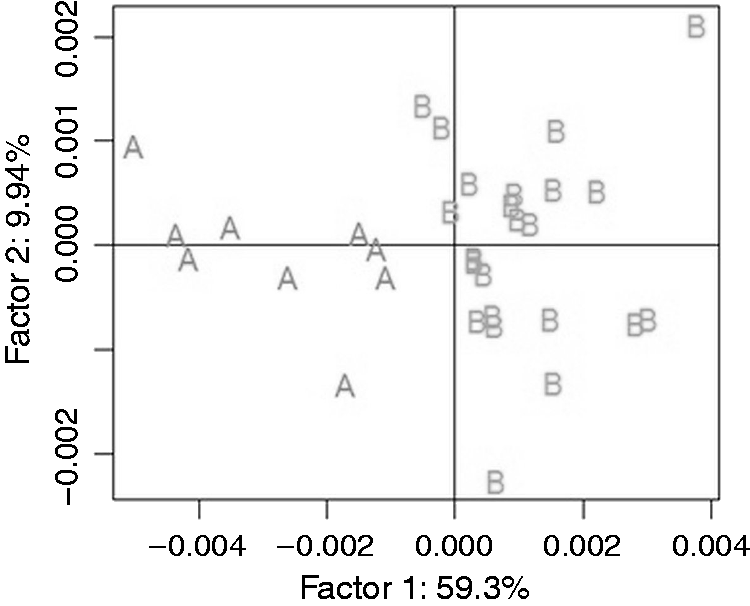
The differentiation index, D, determined for the averaged IR spectra of particular bacterial strains, is a measure of similarity of laboratory strains. The smaller the value of D, the more similar the strains (for identical strains D = 0); these values are marked as follows: ‘+ + +’ for D ≤ 5 (very strong similarity), ‘+ +’ for 5 < D ≤ 10 (strong similarity) and ‘+’ for 10 < D ≤ 20 (moderate similarity) (Table 1).
Strain PrK 68/57 (O42) differs from the others by the fact that it does not show similarity to any other strain [a comparable absence of similarity to other strains is shown by PrK 32/57 (O17) and PrK 34/57 (O18)]. There is a very strong similarity between PrK 66/57 (O40), PrK 19/57(O10) and PrK 75/57 (O49); PrK 26/57(O13) and PrK 27/57(O13); PrK 53/57 (O30) and PrK 54/57 (O30); and PrK 21/57 (O10) and PrK 22/57 (O11) (which was confirmed by other methods). As many as 75% of the strains have at least moderate similarity to at least six other strains, and 25% of the strains have at least 17 close ‘neighbors’. In this regard, the record-holding strains are PrK 21/57(O10), PrK 22/57 (O11) and PrK 50/57 (O27) (their IR spectra are extremely similar to each other). Only seven of the analyzed strains exhibited fewer than five close neighbors. Owing to this fact, one should not expect an explicit cluster, because most strains are related.
Creation of the Proteus spp. strains model involved 3200 spectra, and 32 different Proteus strains were used in creating the spectral library. The next step in our analysis was to test if clinical Proteus strains would be classified as corresponding laboratory strains and to compare the technique used. To this end, the clinical strains were examined individually using the matrix obtained from the laboratory strains by dendrogram, index D, RF methods and SOM. Each clinical strain was classified by each method, and the results that were repeatedly produced by the different chemometric methods were considered final.
Identification of Proteus spp. collection strains by ATR FT-IR spectroscopy and multivariate analysis.

Discussion
FT-IR spectroscopy can be used to classify bacteria at different levels of taxonomic discrimination.1,8,31 FT-IR spectroscopy of intact bacterial cells provides information on the biochemical composition and structure of the whole cell.1,5,31 These spectra are complex and unique spectroscopic patterns encoding the signals of thousands of bands that cannot be resolved easily. Thus, pattern recognition techniques are generally used to extract the essential information. As all cell components depend on the expression of smaller or larger parts of the genome, the FT-IR spectra of microorganisms display specifically a complete phenotypic and genetic fingerprint of the cells under study. 30
The purpose of this FT-IR analysis was to group the Proteus isolates according to their O-antigenic properties that reside in the structure of O-specific side chains of LPS. We found that ATR FT-IR technology can be used to distinguish accurately several different Proteus species. This discrimination is, however, achievable only when multivariate statistical techniques are applied to the analysis of complex spectral data. However, such spectral differences cannot be interpreted in terms of biochemical and/or chemical structure. The five classification models elaborated in this study prove that the information contained in microbial FT-IR spectra is sufficient to differentiate phenotypically between the different Proteus strains. The potential of FT-IR spectroscopy for differentiating Proteus species from other bacteria has already been shown. 32 The present study is the first example of the application of ATR FT-IR spectroscopy to the discrimination of Proteus at below the strain level. Subgrouping within strains proves the presence of strain-specific substructures within the classification scheme and demonstrates that FT-IR spectroscopy may be used as a fingerprinting-like method in further studies. The scarcity of data on the diversity of Proteus strains does not allow for a broad comparative analysis of these results.
A very clear correlation between IR spectra and serotypes was obtained for the 1200–900 cm−1 wavenumber range. 30 As it was expected that differences in OPS would primarily be expressed in the spectral range where the vibrational modes of cellular carbohydrates dominate, data analysis was confirmed that hypothesis. 1 In this window we also observed the phosphate vibrations at 1082–1064 cm−1 in the studied bacteria, linked to the symmetric stretching of the phosphodiester groups of nucleic acids, possibly show structural differences in the DNA backbone between species. 4 This was corroborated by the bands shifted around 970 cm−1, and related to C–O and C–C vibrations of the deoxyribose moiety of DNA. So, it seems that we may treat the convergence of serological membership within pathogenic strains as a result of the clonal structure of Proteus strains. Using the information contained in this spectral range as input for multivariate analysis we observed presence of clusters according to the grouping scheme suggested by O serotyping.
One can postulate that within the IR spectra of whole cells, P. mirabilis strain structures of OPS might be reflected. For example, in ATR FT-IR spectroscopy based on D index (Table 1), two strains from the same serogroups, O10 PrK 19/57 and PrK 21/57, grouped by D ≤ 5, which indicates very strong similarity. To the same cluster belonged a strain from serogroup O11 (P. mirabilis Prk 22/57). In both O10 and O11 OPS structures 1–3 substituted GalA and GlcNAc residues are present. 24 In order to correlate ATR FT-IR methods with LPS structures, IR spectra of isolated complete, as well as chemically defined, parts of P. mirabilis LPS are under current investigation.
In conclusion, reliable discrimination of bacteria at the clonal level by infrared methodology combined with mathematical analysis indicates that it can be useful as a rapid and versatile diagnostic tool for screening large numbers of bacterial isolates in the context of epidemiology and outbreaks.7,8,13,33
Footnotes
Declaration of conflicting interests
The author(s) declared no potential conflicts of interest with respect to the research, authorship, and/or publication of this article.
Funding
The author(s) disclosed receipt of the following financial support for the research, authorship, and/or publication of this article: This work was supported by a grant from the National Science Center, Poland issued on the basis of decision number DEC-2012/07/N/NZ6/04118. Some of the experiments were run on apparatus purchased with European Union grant 307 under 2.2 Innovation Industry.