
Abstract
Circadian omics analyses present investigators with large amounts of data to consider and many choices for methods of analysis. Visualization is crucial as rhythmicity can take many forms and p-values offer an incomplete picture. Yet statically viewing the entirety of high-throughput datasets is impractical, and there is often limited ability to assess the impact of choices, such as significance threshold cutoffs. Nitecap provides an intuitive and unified web-based solution to these problems. Through highly responsive visualizations, Nitecap enables investigators to see dataset-wide behavior. It supports deep analyses, including comparisons of two conditions. Moreover, it focuses upon ease-of-use and enables collaboration through dataset sharing. As an application, we investigated cross talk between peripheral clocks in adipose and liver tissues and determined that adipocyte clock disruption does not substantially modulate the transcriptional rhythmicity of liver but does advance the phase of core clock gene Bmal1 (Arntl) expression in the liver. Nitecap is available at nitecap.org and is free-to-use.
Keywords
The ability of an organism to schedule its biological processes throughout the day is so important to survival that nearly all plants and animals have evolved an intrinsic circadian mechanism that is synchronized to the day/night cycle (Zhang et al., 2014; Sehgal, 2017; Patke et al., 2020). Many biological functions are coupled to this rhythm, and there is fast growing awareness of the importance of taking these rhythms into account (Takahashi, 2017). Modern high-throughput circadian rhythm omics datasets are typically too large for a researcher to examine by hand through traditional means. Yet circadian experiments are inherently complex and inadequately captured by any simple set of statistics. Instead, they are best investigated visually. It is therefore important to assist researchers in fully examining their dataset.
Typically, investigators choose certain thresholds, such as separating “rhythmic” from “non-rhythmic” features by a p-value cutoff. These choices impact subsequent analyses, yet there is generally no systematic procedure for these steps—choices are often made arbitrarily without fully assessing the impact on downstream analyses and without visualization of those features just above or below these thresholds. Therefore, tools to better enable the investigator to understand the impacts of these decisions are needed.
As circadian research has matured, researchers have begun using more complex study designs. Recent work has focused on comparisons of rhythmicity across different conditions (Thaben and Westermark, 2016; Singer and Hughey, 2019), but these methods report only p-values for an aggregate change in rhythmicity and cannot isolate changes in amplitude or phase specifically. While the theory for doing so is well developed (Bingham et al., 1982), tests of these differences have only recently had modern implementations (Moskon, 2020; Parsons et al., 2020; Ding et al., 2021; Weger et al., 2021). Investigators still lack exploratory tools for visualization and understanding these studies or for running these analyses without informatics training.
We have developed Nitecap (nitecap.org), a website interface to visualize, detect, quantify, and compare rhythms and circadian behavior in time series high-throughput data. Nitecap provides highly responsive visualizations tailored for the problem of circadian omics data. This makes it possible to easily assess data quality, rhythmicity, and differences between conditions. Nitecap incorporates common rhythmic analyses, including JTK_CYCLE (Hughes et al., 2010), cosinor linear models, analysis of variance (ANOVA), and any user-provided statistics. Expression or concentration time series can be re-sorted by any of the various statistics and then scanned and assessed using a slider bar. Users may create accounts and save their datasets for later use and share data and analyses via copy-and-pastable links. Nitecap allows users to perform pathway analyses that update in real time to changes of parameters such as significance cutoffs or filters. This allows one to assess the impact of the full range of cutoffs on the pathway results. Visualizations include principal component analysis (PCA) and heatmaps. Finally, Nitecap provides analytic tools for differential analysis, to compare time courses in two different conditions, using permutation and cosinor-based comparative statistical tests to assess differential rhythmicity, phase, or amplitude between conditions. This is all made accessible to users without specialized bioinformatics skills, requiring only a spreadsheet as input. Nitecap thereby streamlines the initial investigation of a new dataset, enabling researchers to build immediate intuition for the condition under examination while providing a stepping-stone for deeper investigations.
Methods and Materials
Web Interface
The nitecap.org website provides a simple interface for end-users. Users may submit a spreadsheet in csv, tab-separated, or Excel formats with one row per feature (where features could include genes, proteins, transcripts, or any other measurable unit) and one column per independent sample (technical replicates should be combined beforehand). The user specifies a few study design questions (e.g., how many timepoints were measured per day or cycle) and is then asked to specify the individual columns’ meanings. There should be at least one column of feature IDs, several columns of sample data, and (optionally) user-provided metrics or statistics. Sample columns can have their timepoint automatically inferred from the column header if it matches one of the several common naming schemes (such as including “ZT” followed by a number) and otherwise can be set manually. Columns of user-provided statistics are saved and later displayed alongside Nitecap-computed statistics.
Uploaded datasets are stored on the server and, if the user is logged in, saved to their account for future reference. As soon as the dataset is loaded, the server automatically performs several default statistical tests: the JTK_CYCLE, ARSER, Lomb-Scargle and RAIN tests of rhythmicity (Hughes et al., 2010; Thaben and Westermark, 2014; Wu et al., 2016), a cosinor test (Cornelissen, 2014), and ANOVA. The data are then displayed to users and can be sorted according to any statistic.
Nitecap is designed with the most common circadian omics experiments in mind and so requires a known cycle length, typically 24 h. Moreover, it assumes a fixed spacing between timepoints. Nitecap currently does not support repeated measurement experiments in its statistical analyses since it assumes independence of timepoints (which is the case when, for example, each sample is from a distinct organism).
Visualizations
A key feature of Nitecap is its responsiveness. The user may scan through their entire dataset with a slider bar, which updates the plotted data instantaneously, see Figure 1. This enables a visual impression of how well rhythmicity (or other desired properties) hold up near any cutoff value, by quickly scanning dozens or hundreds of features near the cutoff using the slider bar. Multiple different graph types are available to give different perspectives. Nitecap also provides easy ways to generate heatmaps and time-annotated PCA plots of samples to investigate the overall properties of the dataset. The combination of thresholding and PCA appears to have definite advantages, see case studies.
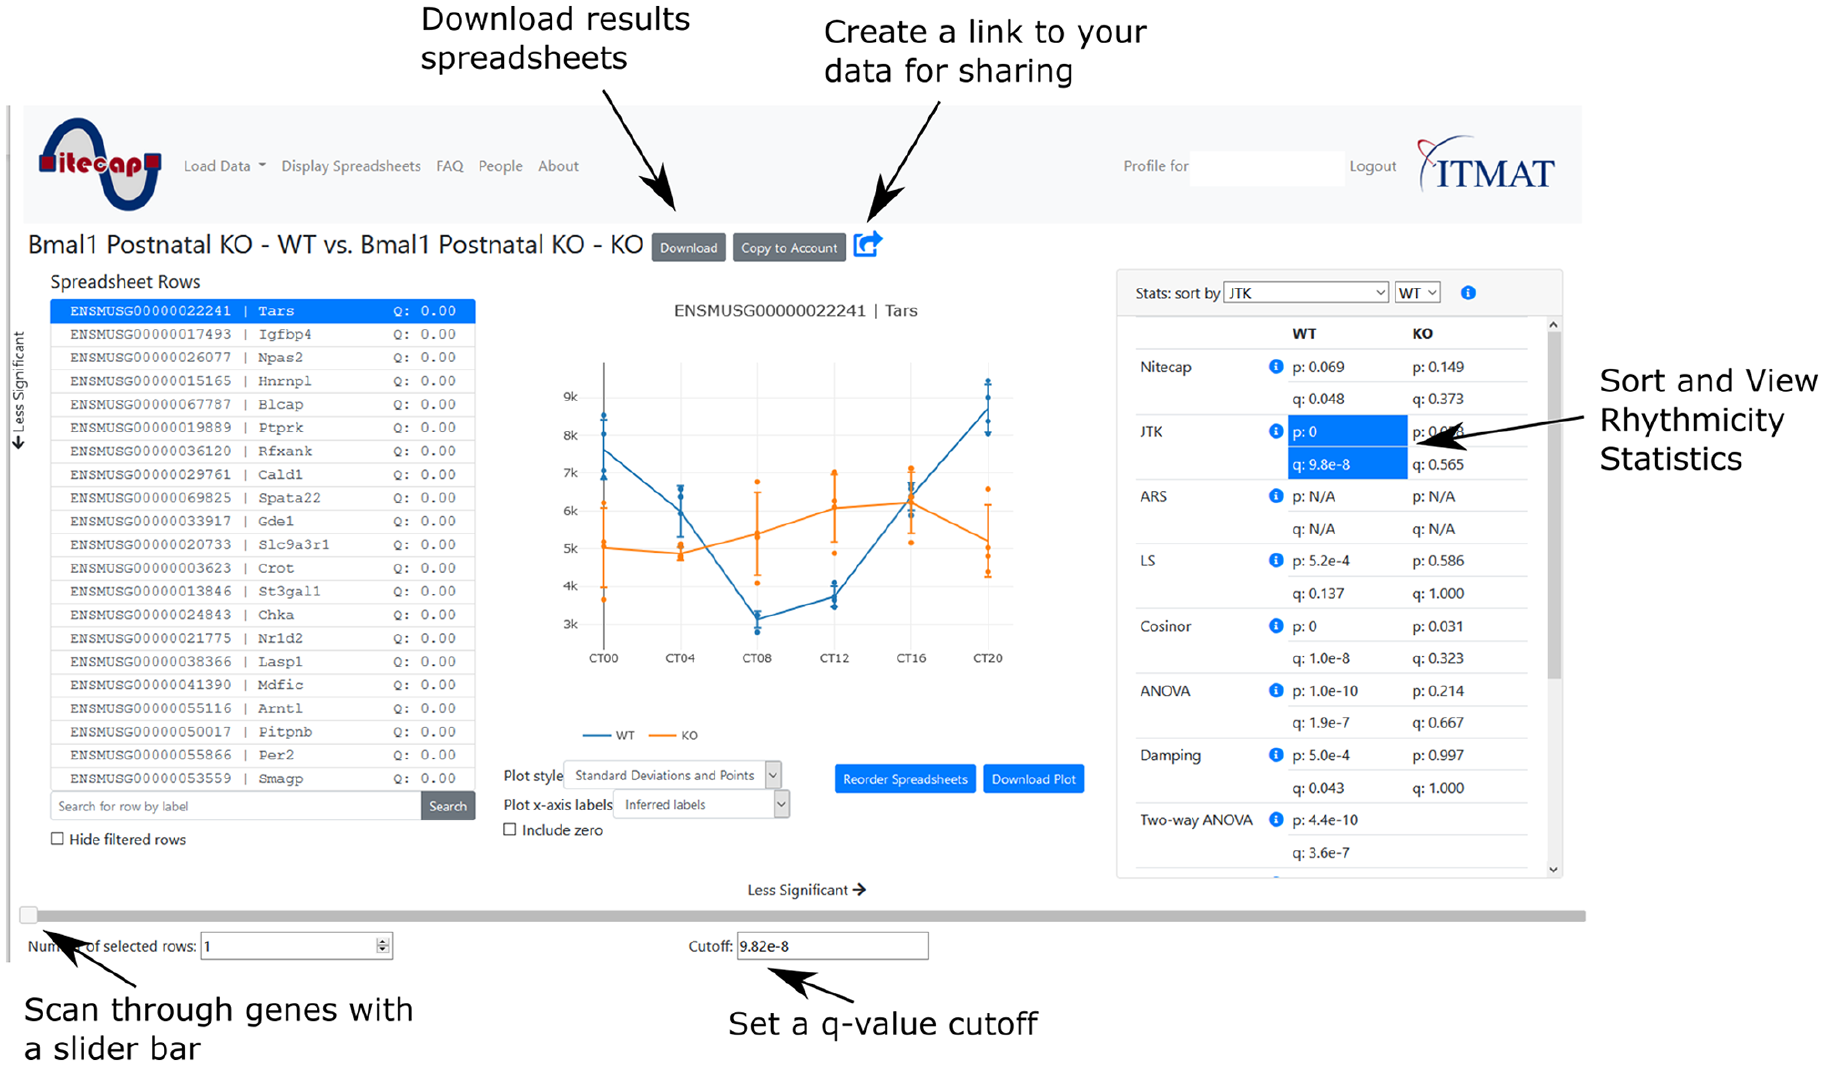
Nitecap interface. The main Nitecap spreadsheet-viewing page allows investigators to quickly see profile plots and computed statistics. The displayed plot and statistics update in real time as the user scans through the list of spreadsheet rows (containing genes, transcripts, proteins, etc.), allowing investigators to obtain quick intuition about their dataset, such as the robustness of rhythmicity at various cutoffs. The spreadsheet rows can be sorted by any chosen statistic, including user-provided ones, by selecting it from the statistics panel on the right. Abbreviations: KO = knock-out; WT = wild-type.
Feature profile plots can be sorted by any statistic, such as significance of rhythmicity. They can also be filtered by any statistic, such as removing low-expressed genes from an RNA-seq dataset or dropping features with large amounts of missing data.
Dataset Comparisons
Nitecap introduces an easy way to compare both visually and statistically any two (compatible) datasets that a user has uploaded. For example, a time course taken in wild-type (WT) mice and another in knock-out (KO) mice can both be uploaded, then selected and compared. Both conditions are plotted together, and additional statistics are automatically computed to compare them: a cosinor-based test for differential phase or differential amplitude (Bingham et al., 1982), a permutation-based test for damping of rhythm amplitude called UPSIDE (Paschos et al., 2012), and a two-way ANOVA test for differential time dependence. Importantly, the cosinor-based approach gives p-values specifically for a difference in phase and specifically for a difference in amplitude. This contrasts with approaches that provide only an aggregate differential p-value that cannot distinguish between phase and amplitude differences (Thaben and Westermark, 2016; Singer and Hughey, 2019).
Pathway Analysis
Pathway enrichment analysis is a common operation in high-throughput analyses. To shed light on the dependence of the pathway analysis results on a selected set of genes, Nitecap performs a standard hypergeometric test and updates it in real time as one changes the selected gene set. For example, the p-value cutoff determining the set of “significant” genes can be scanned through and the pathway enrichment updates to reflect the changing gene set.
The benefit of such an approach is that pathway enrichment hypergeometric tests are known to include false positives for complex reasons (de Leeuw et al., 2016; Simillion et al., 2017). For example, we may intend to select for the most rhythmic genes but end up finding significant pathways that are enriched simply for expression levels due to higher power of the test in highly expressed genes. An enriched pathway may merely have been enriched for being highly expressed in this condition without any association to rhythmicity per se. However, such pathways likely are also enriched under other orderings or at less stringent cutoffs. While Nitecap does not provide a remedy to this problem, it helps users understand their pathway results better and be more aware of potential problems.
Pathways are generated using the biomaRt R package (Durinck et al., 2005, 2009) for Gene Ontology (GO) terms (Ashburner et al., 2000; GO Consortium, 2021) and the KEGGREST R package (Tenenbaum and Maintainer, 2021) for Kyoto Encyclopedia of Genes and Genomes (KEGG) gene sets (Kanehisa and Goto, 2000; Kanehisa, 2019; Kanehisa et al., 2021). We provide generated lists for Homo sapiens, Drosophila melanogaster, and Mus musculus for features identified by Ensembl gene ID, National Center for Biotechnology Information (NCBI) gene ID, or gene symbol. Since H. sapiens is particularly well annotated for GO terms, we also provide GO term lists based off homology to H. sapiens for other species. By default, genes measured in the provided spreadsheet form the background set, excluding genes appearing in no annotated pathways or any genes that have been removed by the user-specified filters. Users may choose to disable either of these exclusion criteria.
Implementation
The nitecap.org website consists of a web server and a serverless computational backend. The web server is developed in Python using the Flask framework, running on Apache through mod_wsgi. The server is deployed as a containerized service via Amazon Elastic Container Service (ECS) and is fronted by an application load balancer. Users are encouraged to register accounts, but most functionality is available even without one.
Nitecap’s front end is written in JavaScript with the Vue.js framework. Visualizations are performed with the Plotly.js library, which enables near instantaneous rendering of complex plots as the user changes parameters or scans through the list of features. To deliver high-performance visualizations, the entire dataset is loaded into memory on the client side. Intensive computations take place on the backend and are loaded seamlessly as the user views their results.
Nitecap’s serverless computational backend is responsible for running algorithms. We found this serverless approach necessary since some algorithms have a long running time and can easily overwhelm the server. Our architecture uses AWS Lambda service to run algorithms and the computational workflow is orchestrated by AWS Step Functions. The user interface shows progress bar which informs the user on the status of computations. This feature is implemented using the WebSocket protocol. Figure 2 shows the essential parts of our architecture. Lambda functions are written in Python. We execute algorithms written in R using rpy2, an interface to R running embedded in a Python process. Finally, we followed the infrastructure-as-code principle and specified the infrastructure described above in TypeScript using AWS Cloud Development Kit (CDK).
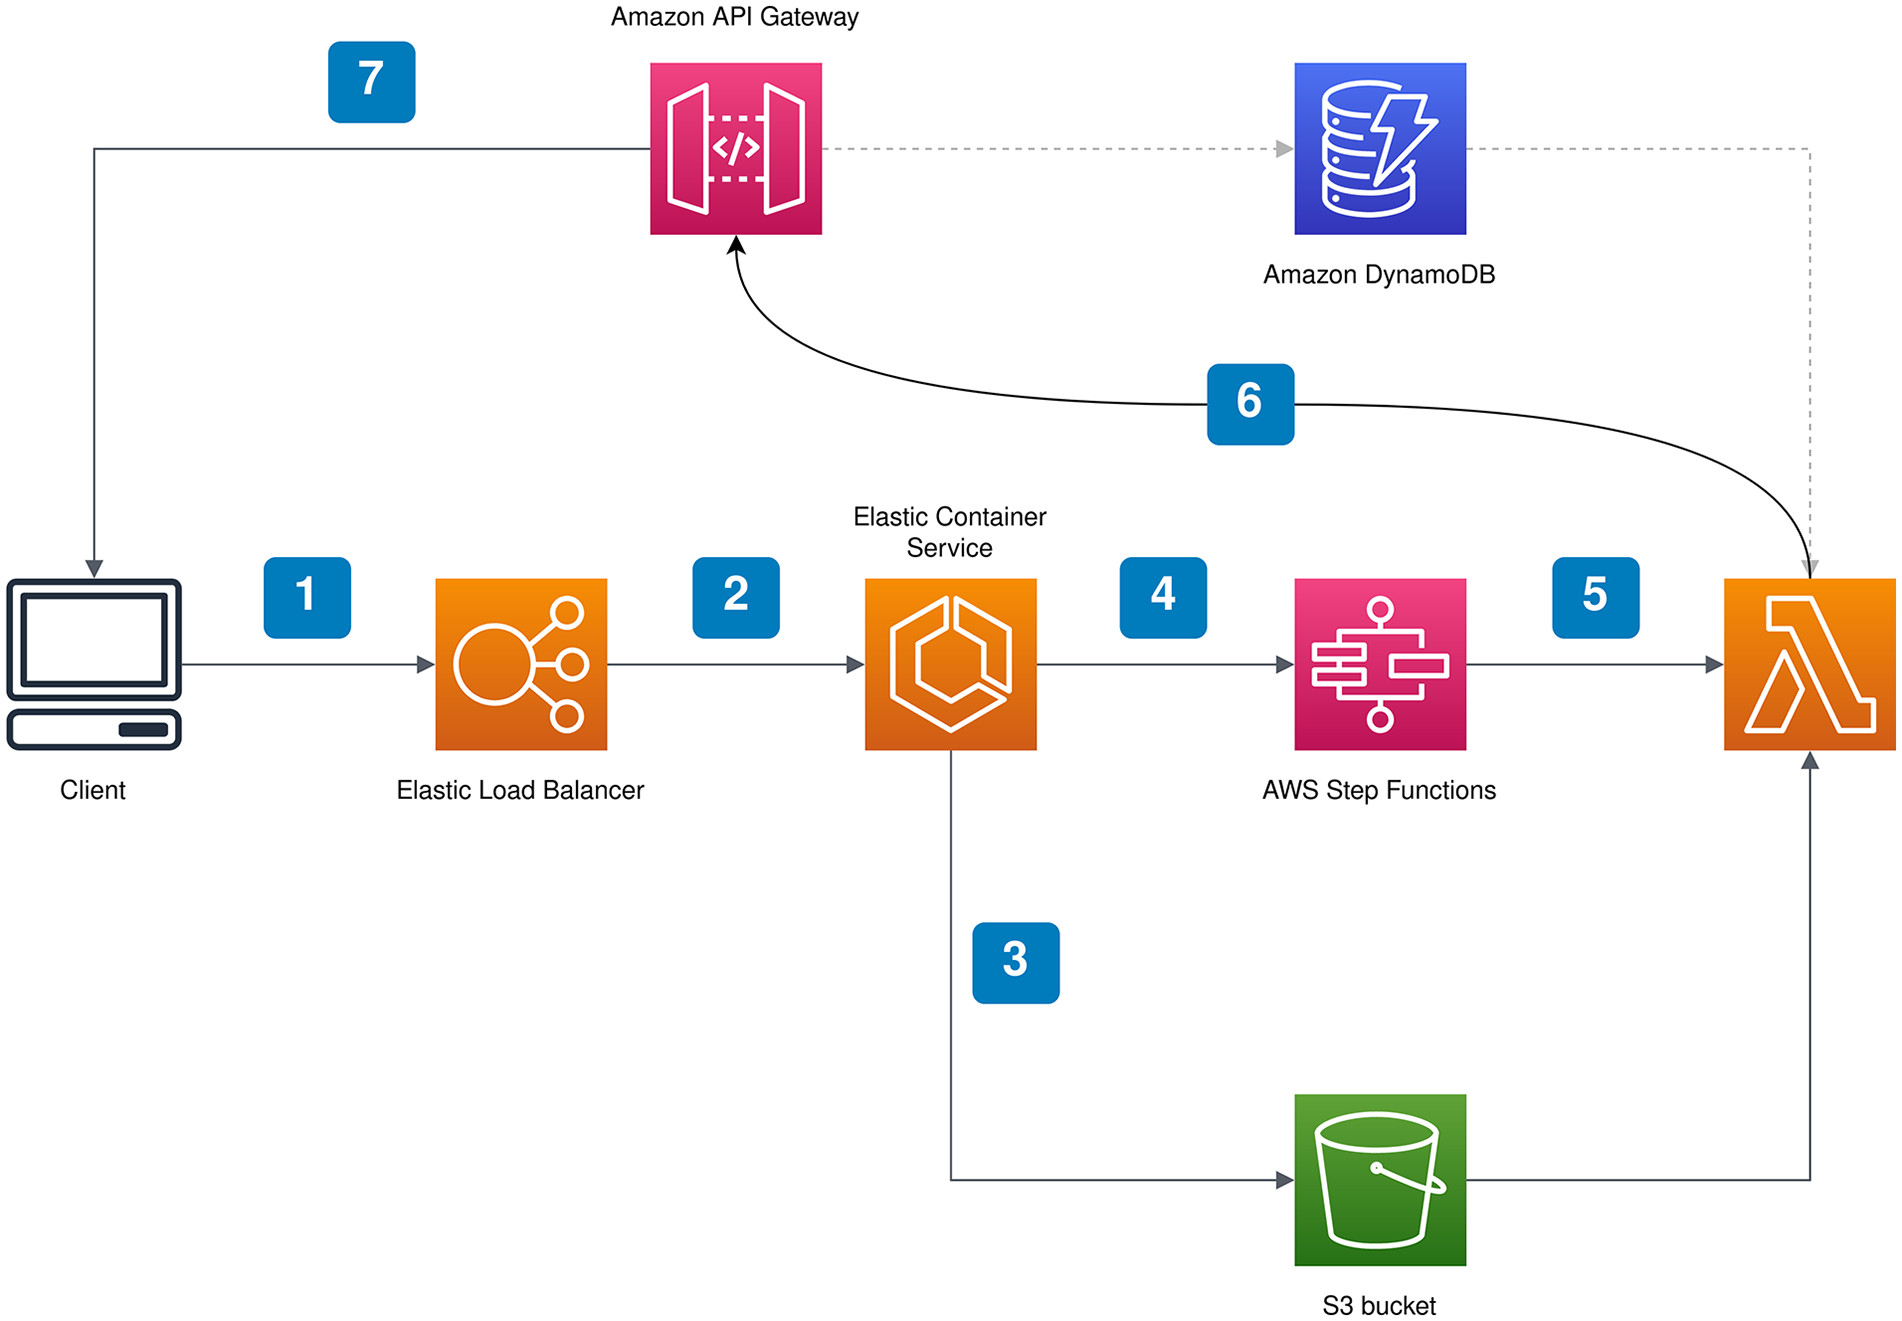
Nitecap implementation. Typical workflow in Nitecap. First, the front end sends the request to run an algorithm (1). This request passes through the load balancer and is received by the Nitecap server (2) which is deployed as a containerized service in Amazon ECS. The server puts the data needed for the algorithm in the S3 bucket (3) and instructs the orchestrator to run the desired algorithm (4). The orchestrator then starts the appropriate Lambda function (5) where the algorithm is run. During the run, the status notifications are sent to the API Gateway (6) which pushes them to the front end (7)via the WebSocket protocol. The Amazon Dynamo database is used to keep track of which users are actively connected to Nitecap via the WebSocket protocol. Abbreviations: API = application programming interface; ECS = Elastic Container Service.
The source code for nitecap is available under a GPL3 license at github.com/itmat/nitecap.
Adipocyte-specific Bmal1 KO
Mice were kept under constant darkness for 36 h and then sacrificed. Mice had ad libitum access to food and water. Four aP2-Cre Bmal1 fx/fx mice and 4 littermate controls were sacrificed in darkness every 4 h for 20 h (6 timepoints). Liver samples were excised and RNA-seq was performed on each. See Supplemental Methods for details.
Results
Case Studies
We perform three case studies demonstrating the use of Nitecap in exploratory circadian omics. The datasets investigated here, and others, are shared for easy viewing at nitecap.org/gallery. Unless otherwise specified, p-values are from JTK.
Case Study 1—Time-restricted Feeding in Mice
A recent study (Xin et al., 2021) performed RNA-seq on mouse liver, heart, visceral adipose tissue (VAT), and kidney samples taken from two conditions: night-restricted feeding (NRF) or day-restricted feeding (DRF) both under 12:12 h light-dark cycles. Each condition had 4 mice in each of the 7 timepoints spaced 4 hours apart. We obtained the data from GEO accession GSE150385, uploaded this dataset to nitecap.org, and were able to quickly perform a meaningful analysis of the different conditions, despite having little prior knowledge of the experiment.
Examining mouse liver, many cycling genes are identified in both condition (8864 in NRF and 8181 in DRF with JTK q < 0.05). Selecting the top 500 cycling genes in NRF and constructing the PCA plot, using just these genes, shows that samples in both conditions cluster by time of day and form a remarkably regular circle, indicating the cyclic nature of the data, see Figure 3a. However, the DRF samples cluster closest to the NRF samples that are 12 h offset in time, indicating the entrainment of liver tissue to the inverted feeding schedule. Moreover, the size of the circle formed by DRF genes is smaller than that of the NRF condition, indicating a bulk shift toward lower amplitudes in these selected genes. Repeating with the top 500 cyclic DRF genes instead, we observe a similar plot but with comparable radius (and hence comparable rhythmicity) in each condition, see Figure 3b, indicating that genes that cycle in DRF have comparable rhythmicity in NRF. Performing a PCA plot on all 25,415 genes gives a less informative picture, see Figure 3c. This illustrates the value of combining thresholding to choose gene sets and PCA. Confirming these visual findings, Nitecap identifies 731 genes with phase changes and 1933 with amplitude changes at the q < 0.1 level, between NRF and DRF conditions. Examining other tissues, we see the clearest entrainment to feeding schedules in liver, see Supplemental Figure 1a-1c. Thereby, Nitecap has enabled the rapid reproduction of some major findings of Xin et al. (2021) and provided intuitive visualizations of these properties, particularly in liver.
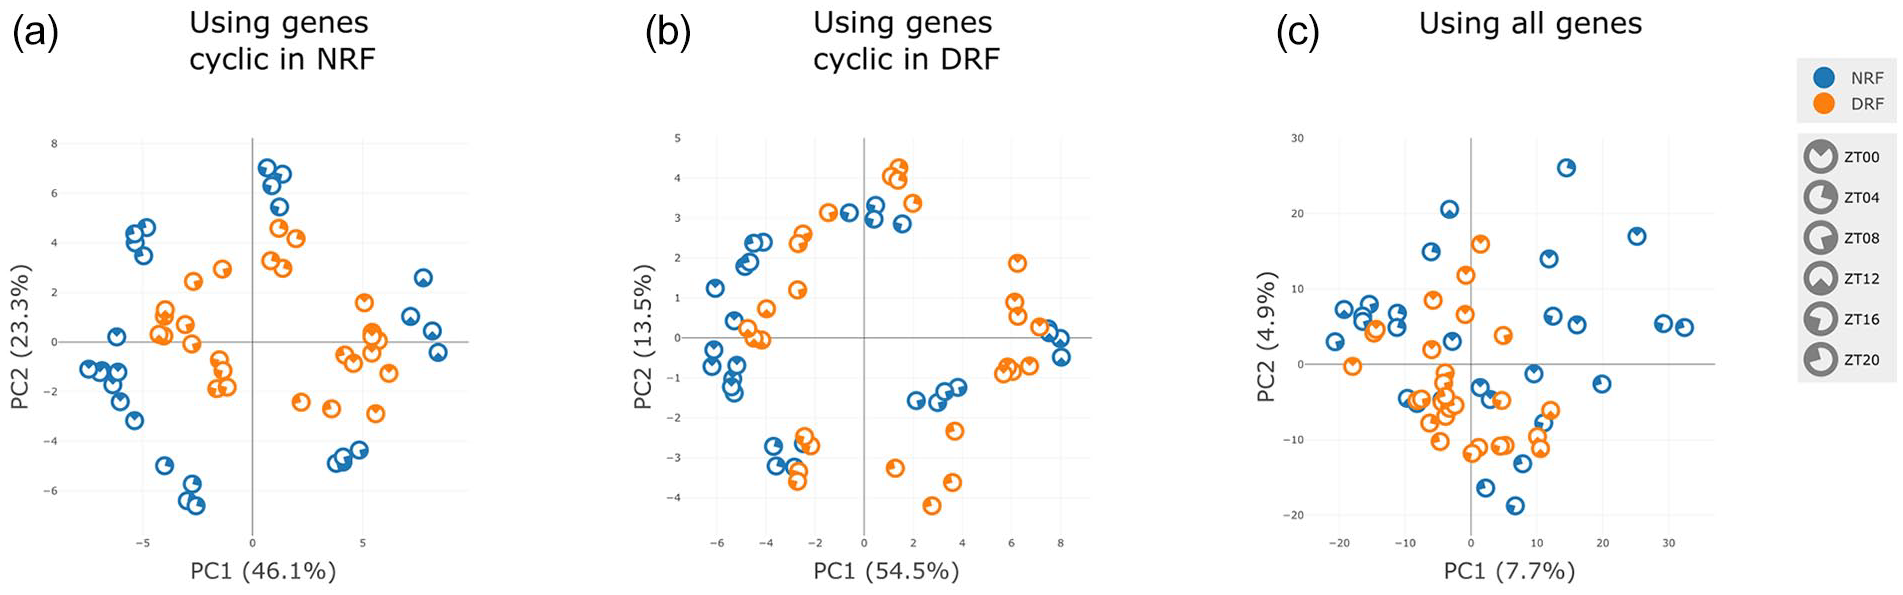
PCA comparison—DRF vs NRF. RNA-seq from mouse liver tissue under DRF and NRF. PCA of the samples using (a) the top 500 rhythmic genes in NRF, (b) the top 500 rhythmic genes in DRF, or (c) all genes. In all cases, expression values were log-transformed and z scored prior to taking the PCA. Rhythmicity testing by JTK_CYCLE. Abbreviations: PCA = principal component analysis; DRF = day-restricted feeding; NRF = night-restricted feeding.
Finally, we analyzed the liver metabolomics dataset from the same study. This dataset has NRF and DRF timeseries with 7 timepoints every 4 h and 4-5 replicates per timepoint. Out of 243 metabolites in total, we identify 43 metabolites with JTK p < 0.05 under NRF. A PCA plot of these samples restricted to 43 metabolites shows clustering by timepoints with similar behavior for NRF and DRF conditions, see Supplemental Figure 1d. Compared to RNA-seq, metabolomics has far fewer measurements and so Nitecap’s responsive visualizations are less essential. However, we still find Nitecap convenient for this and even a few hundred measurements are difficult to examine by hand without such a tool.
Case Study 2—Bmal1 KO
Next, we accessed GEO accession GSE70497. This dataset has RNA-seq of liver samples from postnatal Bmal1 (Arntl) KO and WT C57BL/6 mice over the course of 24 h under dark-dark conditions, with 4 biological replicates every 4 h, for each genotype (total 48 samples) (Yang et al., 2016). Since the Bmal1 KO is known to impair, if not completely disable, the circadian clock of mice, we expect to see a broad reduction of rhythmicity. Using Nitecap, we generated a PCA plot based on the top 500 genes found rhythmic in WT, see Figure 4a. While WT mice cluster by time-of-day, and indeed form a “loop” through the course of the day, the KO mice cluster near the center, regardless of sample time. Since KO mice do not cluster with any WT timepoint, KO mice do not have the expression values of any fixed time-of-day in WT mice. By inspecting gene plots, we can see that most genes instead have constant expression levels approximately equal to the average of the WT expression levels. In Figure 4b, we use the least cyclic genes (with p > 0.5 in WT) and see that the separation is instead by genotype.
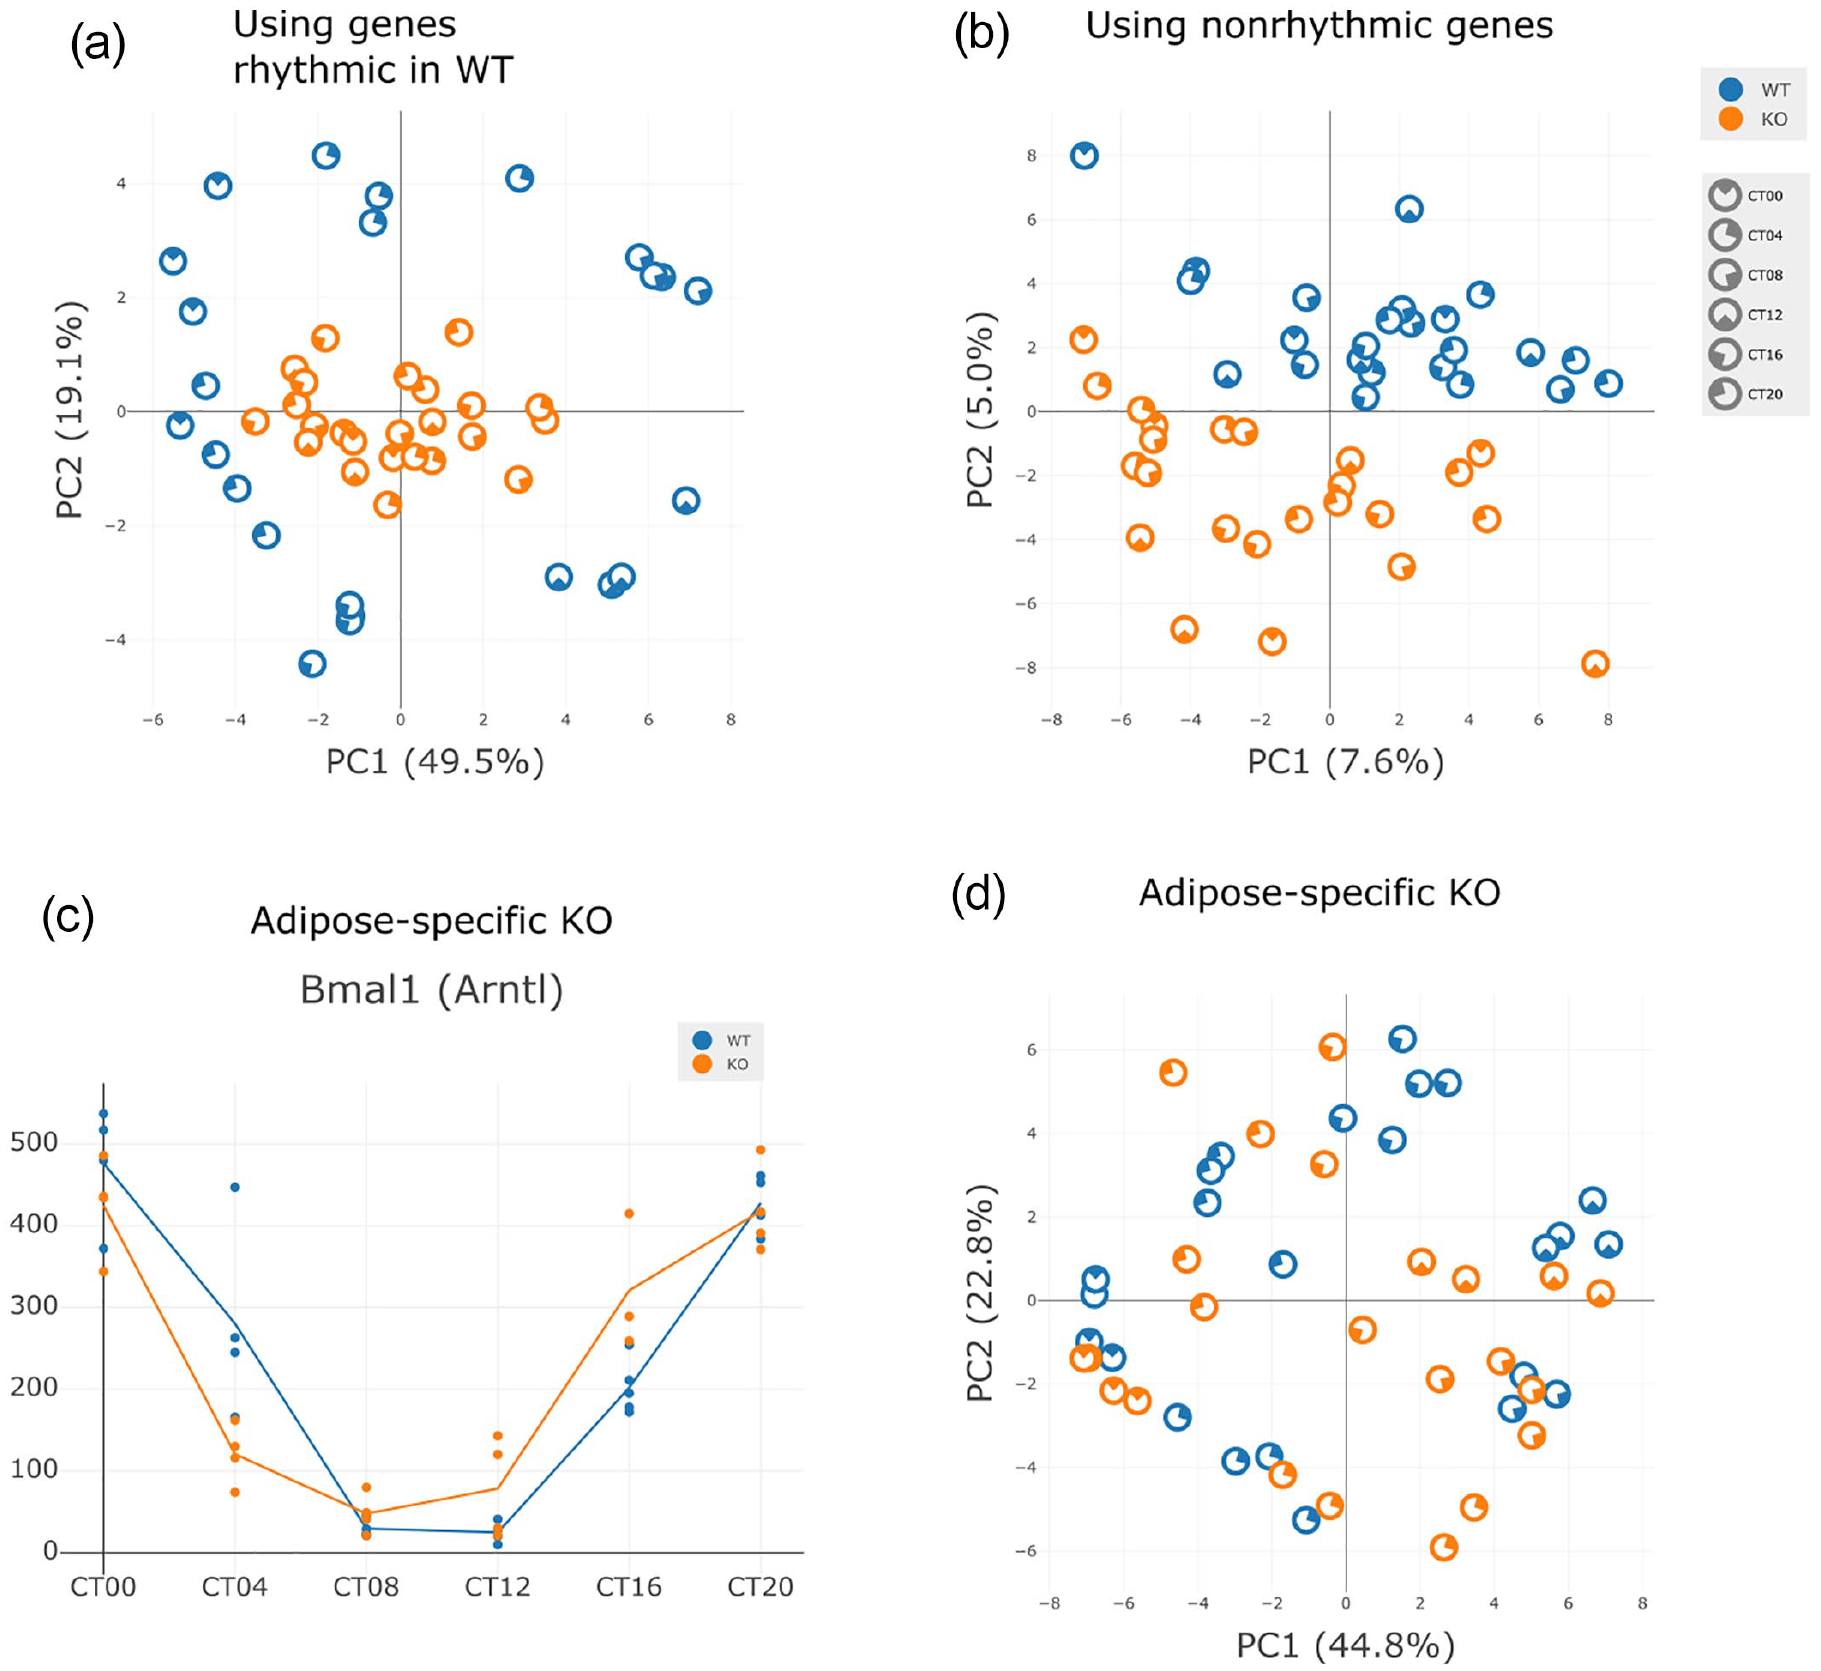
PCA comparison—Bmal1 KO. (a-b) RNA-seq was performed on liver samples from postnatal Bmal1 KO and WT mice over the course of 24 h under dark-dark conditions, with 4 samples taken every 6 h in each genotype. (a) PCA plot of the samples’ top 500 genes found rhythmic in WT. (b) PCA plot of the 12,067 genes with p > 0.5 in WT. (c-d) RNA-seq was performed on liver samples from adipocyte-specific Bmal1 KO and WT. (c) Bmal1 expression levels in WT and KO. (d) PCA plot among top 500 genes found rhythmic in WT, after filtering out low-expressed genes (mean expression <3). Rhythmicity testing by JTK_CYCLE. Abbreviations: PCA = principal component analysis; KO = knock-out; WT = wild-type.
Using Nitecap’s comparative tests, we identified 1418 genes (q < 0.1) specifically as being dampened in the KO, 1882 were identified (q < 0.1) as having an amplitude change between the 2 genotypes, and no genes were identified as having a phase difference (all have q > 0.9). This confirms the expectation that a clock KO primarily confers a reduction in rhythmicity rather than a shift in phases. This demonstrates the importance of a phase-specific test.
We performed a pathway analysis on the selection of top rhythmic genes using the GO terms mapped by homology to H. sapiens GO annotations in the WT mice. At more stringent cutoffs (n = 500 genes), the top GO term is “circadian regulation of gene expression” (enrichment p = 2.9 × 10⁻¹⁰). At higher cutoffs (q < 0.05, n = 6055 genes), the top GO term is “cytosol” (enrichment p = 1.9 × 10⁻¹⁰). Since cutoffs and pathway analyses update in real time, it is easy to see that in fact the cytosol pathway remains highly enriched as we progress to extremely high cutoffs, such as at q < 0.5 (n = 10,299 genes out of 15,744 total), cytosol increases in significance to p = 3.0 × 10⁻¹⁵, while the circadian regulation of gene expression term has p = 2.0 × 10⁻³. This illustrates that the cytosol enrichment at the cutoff q < 0.05 is likely not biologically significant and should be considered with caution. This illustrates the value of considering the full range of cutoffs in a pathway analysis, which would be very time-consuming without nitecap.
Case Study 3—Adipocyte-specific Bmal1 KO
Circadian clocks in peripheral tissues are autonomous and responsible for the rhythmic expression of a percentage of the genes expressed in any given tissue. Rhythmic behavior, and cross tissue interactions also drive the rhythmic expression of genes in tissues. It is known that hepatocyte clock disruption alters rhythmicity in other peripheral tissues, including white adipose tissue (Manella et al., 2021). In this case study, we used Nitecap to investigate the effect of the circadian clock in adipose tissue on the rhythmic expression of genes in liver. RNA-seq was performed on mouse liver in both WT mice and in adipocyte-specific Bmal1 KO mice. Examining only core clock genes, we see a phase advance of liver Bmal1 in KO (phase difference p = 4.3 × 10⁻⁴), see Figure 4c, and trends toward phase advancements in other core clock genes, see Supplemental Figure 2.
Examining all genes in a WT-KO comparison, none are significantly modulated according to an amplitude difference test, an UPSIDE damping test, or a phase difference test after correcting for multiple testing (q > 0.9). By a two-way ANOVA test, one gene (Pxdn) has q < 0.1, yet all others have q > 0.5. To visualize this, we select the 500 top rhythmic genes in WT and plot the PCA, see Figure 4d, which shows no large difference between conditions, though timepoints cluster slightly less tightly in KO. We conclude that there is little detected difference in basal liver rhythmicity after disruption of the clock in adipose tissue in mice that maintain activity and behavioral rhythms.
It is common in circadian analyses to compare rhythmicity across conditions by comparing p-values generated in each condition, which is known to both overestimate and underestimate differences between conditions by overinterpreting nonsignificant p-values (Pelikan et al., 2020). This dataset illustrates this pitfall. By applying filters in Nitecap, we can easily find that there are 329 genes which have JTK q < 0.1 in 1 condition and JTK p > 0.5 in the other. However, none of these genes have significant comparative statistics (amplitude or phase differences, damping, or two-way ANOVA), indicating that there is insufficient evidence to conclude differences. This highlights the importance of rigorous comparative test statistics rather than simple p-value comparisons in circadian omics.
Discussion
The Nitecap interface provides unparalleled visualization ease and speed for rhythmic datasets, which enables researchers to see the entirety of their dataset. The Nitecap interface demonstrates that responsive and nearly instantaneous visualizations help significantly to overcome the difficulty of examining high-throughput datasets. Since it does not attempt to provide a full experimental pipeline, Nitecap remains flexible and compatible with a wide range of experimental types such as RNA-seq, proteomics, and metabolomics. Its ease-of-use makes it possibly the simplest way to run existing tests like JTK_CYCLE without using command-line tools or scripting, putting these tools directly in the hands of the bench investigators. Moreover, users may provide their own precomputed statistics if desired.
Nitecap has exceptional support for comparisons of rhythmicity between multiple conditions, and the utility of Nitecap is perhaps even more evident when doing such comparisons. It is the first user-friendly way to run tests that provide p-values specifically for phase or amplitude differences. Recent libraries also implement such tests: CosinorPy (Moskon, 2020), CircaCompare (Parsons et al., 2020), and diffCircadian (Ding et al., 2021). But these do not have comparable useability for omics data. Nitecap also provides a “dampening” metric to determine a directional dampening of rhythmicity (Paschos et al., 2012), such as a loss or reduction in rhythmicity in a KO mouse compared to a WT mouse. Moreover, it makes visual comparisons of datasets extremely simple and therefore facilitates the generation of more complex hypotheses for future investigation.
In addition to visualizations, Nitecap provides pathway analyses that compute in real time, allowing users to assess the global effects of significance cutoffs, method choice, and filtering choices. While we would still encourage all users to use a dedicated, carefully curated pathway analysis tool such as Ingenuity Pathway Analysis (Kramer et al., 2014) for their final analysis, Nitecap gives users a powerful way to determine the optimal inputs to use for that analysis. Typically, one run of IPA can take 20 min, so users cannot explore many possibilities. After a preliminary Nitecap exploration, a user is better informed to use IPA or another tool to perform a final, publication-ready pathway analysis, with appropriate caution in interpreting pathway results.
In our application to the adipocyte-specific Bmal1 KO mouse in case study 3, we demonstrated that while clock disruption in adipocytes has a minimal impact upon basal rhythmicity in the liver transcriptome, there is a distinct but small phase advancement in liver Bmal1 expression. This complements the findings of Manella et al. (2021), where adipocyte-expression was assayed in a hepatocyte-specific Bmal1 KO and similarly found few differences at the level of transcriptomic rhythmicity but identified slight phase shifts in core clock gene.
Existing web-based circadian tools include CircaDB (Pizarro et al., 2013), CircadiOmics (Ceglia et al., 2018), CircMetDB (Xin et al., 2021), and CGDB (Li et al., 2017) which all provide easy viewing of reference circadian datasets but do not support user-uploaded data. CircaCompare (Parsons et al., 2020) has a ShinyR web interface to compute phase and amplitude-specific p-values, but only supports a single measurement and therefore is not applicable to high-throughput datasets. CIRCADA (Cenek et al., 2020) is a ShinyR web app that allows exploration of the differences between rhythmic analysis methods in either a select experimentally derived dataset or a configurable synthetic dataset. However, it is not intended for user-provided analysis. Meta2D provides a ShinyR app as well that a user may run themselves (Wu et al., 2016). DiscoRhythm (Thaben and Westermark, 2016) provides a web interface with extensive filtering and quality control options. Nitecap is the first site to allow scanning through thousands of feature plots in real time, the first to provide phase and amplitude-specific p-values for omics data, and the first to allow investigators to share their data to collaborators and colleagues.
Limitations
Nitecap only supports the most common high-throughput study designs. While it supports missing data and variable replicate numbers across timepoints, Nitecap requires known periods and evenly spaced timepoints. Investigators looking for differential rhythmicity in more complex studies will likely be better served by methods such as PyCosinor, dryR, CircaCompare or LimoRhyde that supports multiple conditions or complex linear models. To identify unknown periods, alternative tools include using BioDare2 (Zielinski et al., 2014) or MetaCycle. Datasets with unevenly spaced timepoints can be accommodated by PyCosinor or MetaCycle. Regardless of the statistical test performed, the results may still be visualized using Nitecap by uploading spreadsheets with precomputed feature-level statistics. However, datasets with high-resolution sampling of many timepoints may be more appropriate for BioDare2.
Nitecap’s design presents two possible problems with multiple hypothesis testing. First, Nitecap is designed to incorporate an investigator’s visual intuition into the cutoff selection process which could bias toward visually appealing but nonstatistically significant choices. Second, allowing tunable parameters with quickly updating results may allow investigators to pick-and-choose to get the results they want when doing, for example, pathway analysis. We recognize both of these problems, but both exist with or without Nitecap and high-throughput experiments are generally designed to be exploratory, expected to be followed up with replication regardless. As a web-based resource, Nitecap does not currently support sensitive data. While it would be possible to run one’s own webserver within a secure intranet for use with patient data, Nitecap has not yet been designed to be easily installable as a local webserver.
Nitecap has been well tested within the circadian community at the Institute for Translational Medicine and Therapeutics at the University of Pennsylvania, and it has been applied to a broad range of experimental designs beyond its original intentions, such as blood pressure time courses taken on several hundred individuals. The simplicity and speed of visualization make it applicable to many studies even if a rhythmicity test is not needed. Indeed, an in-development sister site is in beta testing that provides that same interface but for general highly parallel omics studies such as RNA-seq direct comparisons, possibly with categorical conditions, such as genotype and sex.
Conclusion
Nitecap provides an advancement in the ease of visualizing large, high-throughput circadian datasets, by means of an extremely responsive interface. Investigators are enabled to see orders of magnitudes more data than previously was practical, thus allowing them to assess the overall behavior of their dataset in a comprehensive way. Moreover, it provides for easy collaboration and sharing of datasets and visualizations. Rigorous comparison of circadian parameters between conditions is increasingly common and Nitecap provides the first web-based interface of such tests suitable for high-throughput datasets. Since Nitecap supports user-supplied statistics, it is flexible enough to cooperate with nonstandard pipelines, future statistical methods, or novel study designs.
Nitecap is available for free use at nitecap.org. The software code is available under the GPL v3 license at github.com/itmat/nitecap.
Supplemental Material
sj-pdf-1-jbr-10.1177_07487304211054408 – Supplemental material for Nitecap: An Exploratory Circadian Analysis Web Application
Supplemental material, sj-pdf-1-jbr-10.1177_07487304211054408 for Nitecap: An Exploratory Circadian Analysis Web Application by Thomas G. Brooks, Antonijo Mrčela, Nicholas F. Lahens, Georgios K. Paschos, Tilo Grosser, Carsten Skarke, Garret A. FitzGerald and Gregory R. Grant in Journal of Biological Rhythms
Footnotes
Acknowledgements
We would like to thank Cris Lawrence for substantial help developing the webserver, Michael Grant for assisting with web hosting, and Dimitra Sarantopoulou for creating our logo. We thank Amita Seghal and the members of her lab for useful feedback during development. The author(s) disclosed receipt of the following financial support for the research, authorship, and/or publication of this article: This work was supported by funding from the National Center for Advancing Translational Sciences Grant [5UL1TR000003] and National Institute of Mental Health (NIMH) T32 Training grant [5T32MH106442-04].
Author Note
Georgios K. Paschos and Tilo Grosser are now affiliated to Department of Systems Pharmacology and Translational Therapeutics, University of Pennsylvania, Philadelphia, Pennsylvania. Carsten Skarke is now affiliated to Department of Medicine, University of Pennsylvania, Philadelphia, Pennsylvania.
Author Contributions
TGB, NFL, GRG, and GAF conceived of and designed the study. TGB and AM developed the software. GKP, TG, GAF, and GRG performed and analyzed the RNA-seq experiment in case study 3. All authors contributed to discussions. TGB drafted the major part of the article and all authors contributed to the writing.
Conflict of Interest Statement
The author(s) have no potential conflicts of interest with respect to the research, authorship, and/or publication of this article.
Ethics Approval and Consent to Participate
All animals in this study were housed according to the guidelines of the Institutional Animal Care and Use Committee (IACUC) of the University of Pennsylvania. All experimental protocols were approved by the IACUC.
Availability of Data and Materials
Data generated from the adipocyte-specific Bmal1 knock-out experiment are available on the Gene Expression Omnibus (GEO) at GSE115264. Data for case studies 1 and 2 were obtained from GEO accessions GSE150385 and GSE70497, respectively.
Notes
References
Supplementary Material
Please find the following supplemental material available below.
For Open Access articles published under a Creative Commons License, all supplemental material carries the same license as the article it is associated with.
For non-Open Access articles published, all supplemental material carries a non-exclusive license, and permission requests for re-use of supplemental material or any part of supplemental material shall be sent directly to the copyright owner as specified in the copyright notice associated with the article.