
Abstract
Foodborne salmonellosis costs the US $2.7 billion/year, including $100.0 million in annual losses to pork producers. Pigs colonized with Salmonella are usually asymptomatic with varied severity and duration of fecal shedding. Thus, understanding the responses that result in less shedding may provide a mechanism for control. Fifty-four pigs were inoculated with Salmonella enterica serovar Typhimurium (ST) and clinical signs, fecal ST shedding, growth performance, peripheral cytokines and whole blood gene expression were measured. Persistently shedding (PS) pigs had longer pyrexia and elevated serum IL-1β, TNF-α and IFN-γ compared with low shedding (LS) pigs, while LS pigs had brief pyrexia, less shedding that decreased more rapidly and greater serum CXCL8 than PS pigs. The PS pigs up-regulated genes involved with the STAT1, IFNB1 and IFN-γ networks on d 2, while up-regulation of genes involved in immune response regulation were only detected in LS pigs. This is the first study to examine host responses to ST infection at a clinical, performance, cytokine and transcriptomic level. The results indicated that pigs with different shedding outcomes developed distinct immune responses within the first 2 d of ST infection, and elucidated alternative mechanisms that could be targeted to reduce Salmonella shedding and spread.
Introduction
Bacterial contamination of meat from an infected animal during processing presents a major threat for animal disease and foodborne illness. Salmonellosis was the leading cause of foodborne-associated hospitalizations and deaths in the USA in 2011, 1 costing $2.7 billion annually. 2 Consumption of Salmonella-contaminated pork contributes $82.0 million to those costs, from 99,430 cases of human salmonellosis, on average. 3 In addition to human disease, salmonellosis in swine is one of the top 10 most common diseases in weaning and grower/finisher pigs, 4 costing pork producers an estimated $100.0 million annually. 5 Swine salmonellosis can be symptomatic or asymptomatic, and, as a result, disease is difficult to diagnose and is often not confined to the farm. 6 Further, infected pigs exhibit costly decreases in growth performance. 7 Transport, comingling and holding prior to slaughter increase the risk of infection spread. 8 Minimizing initial infection and reducing disease transmission are viable intervention strategies, as diagnosis is difficult and segregating infected pigs is costly. 9 As world production of pork is highest among major livestock species, 10 limiting swine salmonellosis would result in improvements in both livestock production and human food safety.
Salmonella enterica serovar Typhimurium (ST) is one of the 10 most frequently isolated serovars from both pigs and humans, and mediates a self-limiting gastroenteritis in both species. 11 The porcine immune response to ST is characterized largely by the local production of pro-inflammatory mediators that result in the pyrexia and neutrophil influx considered hallmarks of ST infection. 12 Sensing of bacterial components by PRRs leads to cytokine production and stimulates disruption of tight junctions between intestinal epithelial cells, 13 resulting in a loss of epithelial barrier function. Enhanced intestinal permeability, in combination with neutrophil influx, mediates increased fluid entering the gut lumen resulting in the diarrhea characteristic of porcine salmonellosis. However, the severity, duration of disease and appearance of clinical signs vary greatly from pig to pig, as does the amount of ST shed during the course of infection. Previous work from our laboratory correlated increased circulating IFN-γ levels with increased ST shedding in pigs following challenge, 14 and, using transcriptomic analysis, demonstrated an up-regulation of IFNG response pathways in the blood of pigs that shed greater amounts of ST. 15 This study was designed to further elucidate the differential responses to ST challenge using a systems approach that combined clinical data, growth performance data, multiple peripheral cytokine measurements, transcriptomics and bioinformatics to identify key host responses associated with rapid control of ST infection. We hypothesized that pigs that differ in ST shedding characteristics will present with different early immune responses, as determined by cytokine secretion and transcriptomic analysis. We demonstrated differences in ST fecal shedding between low-shedding (LS) and persistently shedding (PS) pigs by 1 d post-inoculation (DPI), fever at 2 DPI and distinct cytokine profiles in response to inoculation. Further, both groups of pigs up-regulated pro-inflammatory genes in response to ST challenge, but LS pigs also up-regulated genes involved in regulation of inflammation at 2 DPI. By identifying these responses on multiple levels, the porcine immune response to ST and the variability in shedding was further characterized. This valuable information will, in turn, provide the potential to assist in diagnostic development, reduce swine disease and limit food safety risk.
Materials and methods
Animals
Six sows (crossbred or Yorkshire) were bred to boars of different breeds and treated with antibiotics three times prior to farrowing in isolation facilities at the United States Department of Agriculture Agricultural Research Service (USDA-ARS)-National Animal Disease Center (NADC) in Ames, IA, USA. All sows tested fecal-negative for Salmonella twice prior to induced farrowing, and piglets were weaned at 2 wk of age. All piglets tested fecal-negative for Salmonella at 3 and 6 wk of age, and were raised in climate-controlled, fully-enclosed isolation facilities. Fifty-four piglets were divided into two groups and, at 7–8 wk of age, were inoculated intranasally with 1 × 10⁹ CFU S. enterica serovar Typhimurium χ4232. Six piglets (one from each sow) were housed separately from ST-inoculated piglets, and were inoculated with PBS alone, as described previously. 15 Data were collected at 0, 1, 2, 7, 14 and 21 DPI. Bacteriology for qualitative and quantitative analysis of Salmonella from rectal swabs was performed as described previously. 14 Peripheral blood was collected on 0, 2 and 21 DPI (via jugular venipuncture) into serum tubes for cytokine analysis, EDTA tubes for complete blood count (CBC) analysis and PAXgene Blood RNA tubes for RNA extraction, according to the manufacturer’s protocol (Cat. No. 762164; Qiagen, Valenica, CA). A standard CBC analysis was performed for blood from each pig at 0 and 2 DPI (including lymphocyte, monocyte, neutrophil, eosinophil and basophil counts). Body masses were collected and fecal scores were assigned based on the following scale, as previously reported: 1 = dry; 2 = solid, but moist; 3 = very moist; 4 = very fluid/watery with particles; 5 = fluid/watery. 16 All animal procedures were approved by the USDA-ARS-NADC Animal Care and Use Committee.
Sixteen pigs were selected for subsequent analysis based on the extremes of total ST fecal shedding for the population throughout the study period, as described previously. 15 Briefly, CFU/g feces from each collection time point was normalized logarithmically and plotted to calculate the cumulative area under the plotted log curve (AULC) to determine total ST shedding for each pig for the course of the study. Based on total ST shedding, eight pigs were identified at each of the two shedding extremes of the population as LS or PS.
RNA preparation, microarray hybridization and quantitative PCR
Total RNA was extracted via the PAXgene Blood RNA kit (Cat. no. 762164; Qiagen) from approximately 4.5 ml solution (blood and kit stabilizing solution), as described in the manufacturer’s protocol. Samples from 0 DPI and 2 DPI were utilized for analysis in order to characterize the response in peripheral blood early in ST infection. Further, we have previously determined that there is little difference in gene expression in peripheral blood sampled at 20 DPI for LS and PS pigs. 15 RNA was purified by DNase I digestion and the RNeasy Mini Elute Cleanup Kit as recommended by the manufacturer (Qiagen). RNA samples were confirmed to be DNA-free by lack of genomic DNA on PCR amplification. RNA quantity and quality was assessed using an Agilent Bioanalyzer (Agilent Technologies, Santa Clara, CA, USA), and samples with an RNA integrity number < 7 were excluded from the experiment. The porcine SNOWBALL Gene chip was used as previously described. 17 In brief, microarrays were purchased from Affymetrix (Santa Clara, CA, USA), and RNA labeling, chip hybridization, washing and signal detection were performed at the GeneChip Facility, Iowa State University, Ames, IA, USA.
Quantitative PCR (qPCR) analysis was used to assess differential expression of genes selected from cytokine and microarray results. Probes and primers were obtained from the Porcine Immunology and Nutrition Database. 18 Synthesis of cDNA was performed with SuperScript Reverse Transcriptase II (Invitrogen, Carlsbad, CA) and oligo-dTqPCR amplification was implemented using the Brilliant Kit (Agilent Technologies) with 25 ng of RNA equivalent of cDNA in an ABI Prism 7500 Sequence Detector System (Life Technologies, Carlsbad, CA). Assays were performed in duplicate. The amplification conditions are described by Royaee et al. 19 Ct values were obtained from each individual amplification curve using a standardized baseline value for each gene and averaged for each gene to determine the Ct values, as previously described. 18 Average Ct for RPL32 (housekeeping gene) in each sample was subtracted from each corresponding average target gene Ct, producing ΔCt values.
Serum cytokine analysis
Blood collected into serum tubes was centrifuged at 2000 g and the resulting serum was frozen at −80℃ until further analysis. Samples were then thawed only once and analyzed via a multiplex magnetic bead assay as described previously. 20 Briefly, magnetic microspheres of a unique spectral address were covalently coupled with capture mAbs against porcine IL-1β, CXCL8, IL-10, IL-12p40, IFN-γ or TNF-α. Microspheres were added to each well of a 96-well magnetic plate (Bio-Rad Laboratories, Hercules, CA, USA) and washed twice in wash buffer (PBS, 0.7% Tween-20) on a Bio-Plex Pro Washing Station (Bio-Rad Laboratories). Serum samples were diluted 1:2 in assay buffer (PBS, 1% BSA, 0.05% NaN3), and 50 μl of diluted samples were analyzed. Plates were incubated at room temperature (21–23℃) in the dark for 2 h on a plate shaker at a rotation speed of 3000 rpm, followed by washing three times. Pooled biotinylated mouse anti-porcine cytokine detection mAbs were then added for 1 h with the same incubation conditions and washed three times, followed by incubation with a streptavidin phycoerythrin conjugate for 30 min. Plates were washed three times, and microspheres re-suspended in 125 µl of assay buffer. The mean fluorescence intensity for 100 microspheres was measured in conjunction with a Bio-Plex 200 array system (Bio-Rad Laboratories) and analyzed with the Bio-Plex Manager software, version 6.0. A standard curve was generated, and cytokine concentrations were calculated. For indeterminable concentrations that fell below the lower limit of quantitation, a value was determined and assigned for each cytokine by calculating one half of the lowest detectable value, as described previously (IL-1β, 1.175 pg/ml; CXCL8, 2.175 pg/ml; IL-10, 3.35 pg/ml; IL-12p40, 1.56 pg/ml; IFN-γ, 25.46 pg/ml; TNF-α, 5.90 pg/ml). 21
Annotation of microarray and gene function
A National Center for Biotechnology Information RefSeq ID was assigned to SNOWBALL probe sets using the AffymetrixGenechip annotation as described. 17 RNA transcript fold change for 2 DPI over 0 DPI was chosen to indicate up-regulation (≥ 1.5) or down-regulation (≤ 0.667), and only those comparisons with a q-value of ≤ 0.05 were included. The Functional Annotation Tool of the DAVID Bioinformatics Database 6.7 was used to assign gene ontology (GO) terms and functional clusters. Only those terms with a false discovery rate (FDR) ≤ 0.1 and a P-value ≤ 0.05 were accepted as over-represented. Functional clusters were identified based on the similarity of the function of their biological process with the stringency set to high. Enrichment scores were calculated by the geometric mean of the P-values for GO terms in a corresponding annotation cluster. Only those with an enrichment score > 1.3 were considered to have biological significance and included. Enriched clusters were assigned a functional name, based on the collaborative function of each term within the cluster. Pathway Studio 9.0 (Ariadne Genomics, Rockville, MD, USA) was used to find relationships between differentially expressed (DE) genes and to elucidate intersections between response pathways. The text-mining tool MedScan Reader was employed by the Pathway Studio software to scan manuscripts from multiple biomedical web resources to establish known relationships. The data sets were interrogated using sub-network enrichment analysis (SNEA) to find statistically significant entities connecting the genes in each uploaded list (up- and down-regulated in both LS and PS pigs).
Statistical analysis
The Affymetrix GeneChip data were normalized using the Robust Multi-array Average method. 22 Linear model analysis, as implemented in the limma R package, 23 was conducted to identify significant expression level changes from d 0 to d 2 within LS and PS pigs. For each gene, the change in log-scale expression within each pig from d 0 to d 2 was used as a response variable, and the mean response was allowed to depend on pig status (LS or PS). Each LS or PS mean was tested for a difference from 0 to obtain two P-values for each gene. Both sets of P-values (LS and PS) were converted separately to Q-values 24 using the approach of Nettleton et al. 25 to estimate the number of true null hypotheses. These Q-values were used to identify LS or PS expression changes from d 0 to d 2, while controlling the FDR at approximately the 5% level by considering results with a Q-value ≤ 0.05 to be statistically significant. Additional linear model analyses showed no significant interactions between shedding phenotype and day, and no significant differential expression between LS and PS within day for each gene when controlling FDR at approximately the 5% level. For clarity, DE SNOWBALL probe sets will be referred to as DE genes henceforth.
For each CBC value, the natural log of the response was modeled using a linear mixed-effects model with random pig effects and fixed effects for groups, shedding statuses (LS versus PS), days (0 versus 2) and status-by-day interaction. Because all interactions were non-significant at P < 0.05, we estimated the difference between status main effects and the difference between day main effects and tested whether each of these estimates were significantly different from zero using the method described by Kenward and Roger 26 for approximating degrees of freedom.
Because we analyzed responses on the log scale, these are estimates of the log fold change across the levels of each factor. The inverse logarithm of estimates and associated 95% confidence interval endpoints were calculated to obtain point and interval estimates of fold changes across the levels of each factor.
The change in log CBC value from d 0 to d 2 was tested for correlation with the change in log expression from d 0 to d 2 for each combination of CBC variable and gene via simple linear regression. The resulting 47,880 P-values for each CBC value were converted to Q-values, 24 as explained for the Affymetrix data. Even when allowing a relatively high FDR of 15%, only two genes (SNOWBALL_035461, no gene name; SNOWBALL_023935, CYBRD1) had log expression changes that were significantly associated with log lymphocyte levels. Upon examination of these two genes, they were found to be either not significantly differentially expressed or had little functional relevance, and so they were excluded from subsequent analysis. No other combinations of CBC value and expression were statistically significant at a FDR of 15%.
Average daily gain correlations were calculated by Pearson’s correlation coefficient (r), and statistical significances were determined using GraphPad Prism version 6.0 (GraphPad Software, San Diego, CA, USA). ST CFU/g feces were log transformed, and all masses, and clinical, cytokine and qPCR data were analyzed by the GLIMMIX procedure of SAS (version 9.2; SAS Institute, Cary, NC, USA) with fixed effects of shedding phenotype and day, and pig as the subject of repeated measures, assuming Gaussian distribution. For cytokine analysis, the random effect of assay plate was added. Least square means were calculated and compared using the SLICE and SLICEDIFF procedures, and a Tukey correction was used to adjust for multiple comparisons among shedding phenotypes and time points. Differences were considered significant at P ≤ 0.05.
Results
Identification of LS and PS phenotypes within the Salmonella challenge population
All challenged pigs were quantitatively positive for Salmonella shedding in fecal swabs at 1 DPI, with the exception of one, which was qualitatively positive. All control pigs remained negative for ST throughout the course of the study. As described by others,14,15 a wide range in CFU of ST shed across the challenge population was observed: CFU/g of feces ranged from qualitatively and quantitatively undetectable (one LS pig, 21 DPI) to 1×10⁷ (one PS pig, 2 DPI). The calculated total ST shedding for the 21-d study period averaged 84.43 ± 3.16 for the LS group and 158.8 ± 6.16 for the PS group (Figure 1A). The highest measured level of shedding in LS pigs occurred on d 1, and was significantly elevated when compared with all other time points (P ≤ 0.0001), except for when compared with d 2 (P ≤ 0.44) (Figure 1B). Peak shedding for the PS pigs occurred at 2 DPI, and was significantly greater than all other days (P ≤ 0.0001), except for when compared with d 1 (P ≤ 0.71). Statistically significant differences in shedding levels were observed between the LS and PS populations on 1 (P ≤ 0.005), 2, 7, 14 (P ≤ 0.0001) and 21 DPI (P ≤ 0.01).
Salmonella fecal shedding and clinical data for LS and PS pigs. (A) Total ST shedding as calculated by AULC for LS and PS pigs, displayed as means ± SEM; hash marks (#) indicate statistically significant difference from the unmarked group at P ≤ 0.05. (B) Fecal shedding CFU/g (log10) for LS and PS pigs. All pigs were qualitatively negative for ST prior to inoculation, and all non-inoculated control pigs remained so throughout the course of the study. Means are plotted ± SEM; hash marks (#) indicate statistically significant difference between the groups at P ≤ 0.05 for comparisons of shedding type within day. (C) Rectal temperatures for LS, PS and non-inoculated control pigs. Data are represented as means ± SEM; hash marks (#) indicate statistically significant difference from unmarked groups at P ≤ 0.05 for comparisons of shedding type within day; asterisks (*) indicate statistically significant differences from 0 DPI at P ≤ 0.05 for comparisons across time points within shedding type. (D) Fecal scores to assess diarrhea for LS, PS and non-inoculated control pigs assigned on a scale of 1–5, with 5 being the most watery. Means are represented ± SEM; means are plotted ± SEM; hash marks (#) indicate statistically significant difference from indicated groups at P ≤ 0.05 for comparisons of shedding type within day; asterisks (*) indicate statistically significant differences from unmarked days at P ≤ 0.05 for comparisons across time points within shedding type.
Clinical differences were observed between LS and PS pigs
At 1 DPI, the mean rectal temperatures of both LS and PS pigs were significantly elevated from controls and 0 DPI, and reached the highest level measured (Figure 1C). By d 2, however, LS pig temperatures dropped significantly (P ≤ 0.001) compared with 1 DPI and were not statistically different from controls or from temperatures taken prior to inoculation. Conversely, PS temperatures at 2 DPI remained elevated above controls (P ≤ 0.0001) and were not statistically different from 1 DPI. At d 7, the rectal temperatures of all challenged pigs were not elevated above non-inoculated controls; however, the PS pigs had a higher rectal temperature when compared with the PS rectal temperature on d 0 (P ≤ 0.05). By 14 and 21 DPI, no significant difference in rectal temperature relative to d 0 was observed for any pig group.
CBCs were measured for all pigs on d 0 and d 2 (Supplementary Table 1). Blood neutrophils and eosinophils were increased (P < 0.0001 and P < 0.05), and blood lymphocytes were decreased (P < 0.0001) in response to infection. The number of circulating monocytes was higher in LS pigs when compared with PS pigs (P < 0.05), and no other differences were significant between LS and PS pigs.
Fecal scores were assigned on 1, 2 and 7 DPI, and ranged from 1.0 (control pig, 7 DPI) to 4.5 (PS pig, 2 DPI). Both LS and PS pigs had scores significantly higher than controls on d 2, but only PS scores still remained higher than controls on d 7 (P ≤ 0.05) (Figure 1D).
Body mass was also measured, and average daily gain (ADG) calculated for the 21-d study period as a measure of growth performance (Supplementary Table 2). There was no significant difference in body masses between LS, PS or control pigs prior to inoculation on d 0. There was a significant negative correlation between ADG and total ST shedding (r = −0.2760, P ≤ 0.05) for all pigs in the study population. The ADG for PS pigs was also significantly lower than that of control pigs (control mean = 0.290 kg, LS mean = 0.249 kg, PS mean = 0.195 kg) (P ≤ 0.05) at the end of the 21-d study period. Body mass for PS pigs was significantly lower than control pigs on d 21 (control mean = 25.837 kg, LS mean = 22.643 kg, PS mean = 21.264) (P ≤ 0.05).
Together, these data indicated that clinical differences observed as early as d 1 and 2 after inoculation were predictive of a significant difference in ST shedding over time. Moreover, PS pigs maintain clinical differences from LS pigs for longer periods of time and exhibit decreased ADG as a measure of growth performance.
Peripheral cytokine profiles identified for LS and PS pigs
We measured serum concentrations of IL-1β, TNF-α, IL-12p40, IFN-γ, IL-10 and CXCL8 as biomarkers of inflammation to identify potential immune response differences between LS and PS pigs following ST challenge. Prior to challenge, serum samples from both LS and PS pigs contained similar concentrations of these six cytokines when compared with control pigs (Figure 2). However, at 2 DPI, distinct differences emerged between LS and PS pigs when compared with each other and to control pigs. Sera collected on 2 DPI from PS pigs had elevated IL-1β and TNF-α concentrations when compared with all other days, as well as compared with serum samples from LS and control pigs (P ≤ 0.05). The PS pigs also had increased concentrations of IL-12p40 when compared with control pigs at 2 DPI (P ≤ 0.05) and had greater IFN-γ levels than both the LS pigs and controls at 2 DPI (P ≤ 0.05). When compared with concentrations before inoculation, IFN-γ levels in PS pigs were increased at 2 DPI, and remained elevated at 21 DPI (P ≤ 0.01). At 2 DPI, both PS and LS pigs had significantly enhanced levels of IL-10, a classic anti-inflammatory cytokine, when compared with controls (P ≤ 0.05) on d 2 or to their respective pre-inoculation levels (P ≤ 0.01). At 2 DPI, the cytokine response of LS pigs was further characterized by a significant increase in CXCL8 (P ≤ 0.05), which was elevated above control levels on the same day. Together, these results indicated that while the PS pigs had a cytokine response at 2 DPI dominated by pro- and anti-inflammatory cytokines, only elevated CXCL8 and IL-10 were detected in the serum of LS pigs.
Peripheral blood cytokine concentrations in LS, PS and non-inoculated control pigs. Serum cytokine levels were measured prior to challenge and at 2 and 21 DPI using a multiplex bead assay. Means are plotted ± SEM; hash marks (#) indicate statistically significant difference from indicated groups at P ≤ 0.05 for comparisons of shedding type within day; asterisks (*) indicate statistically significant difference from unmarked days at P ≤ 0.05 for comparisons across time points within shedding type.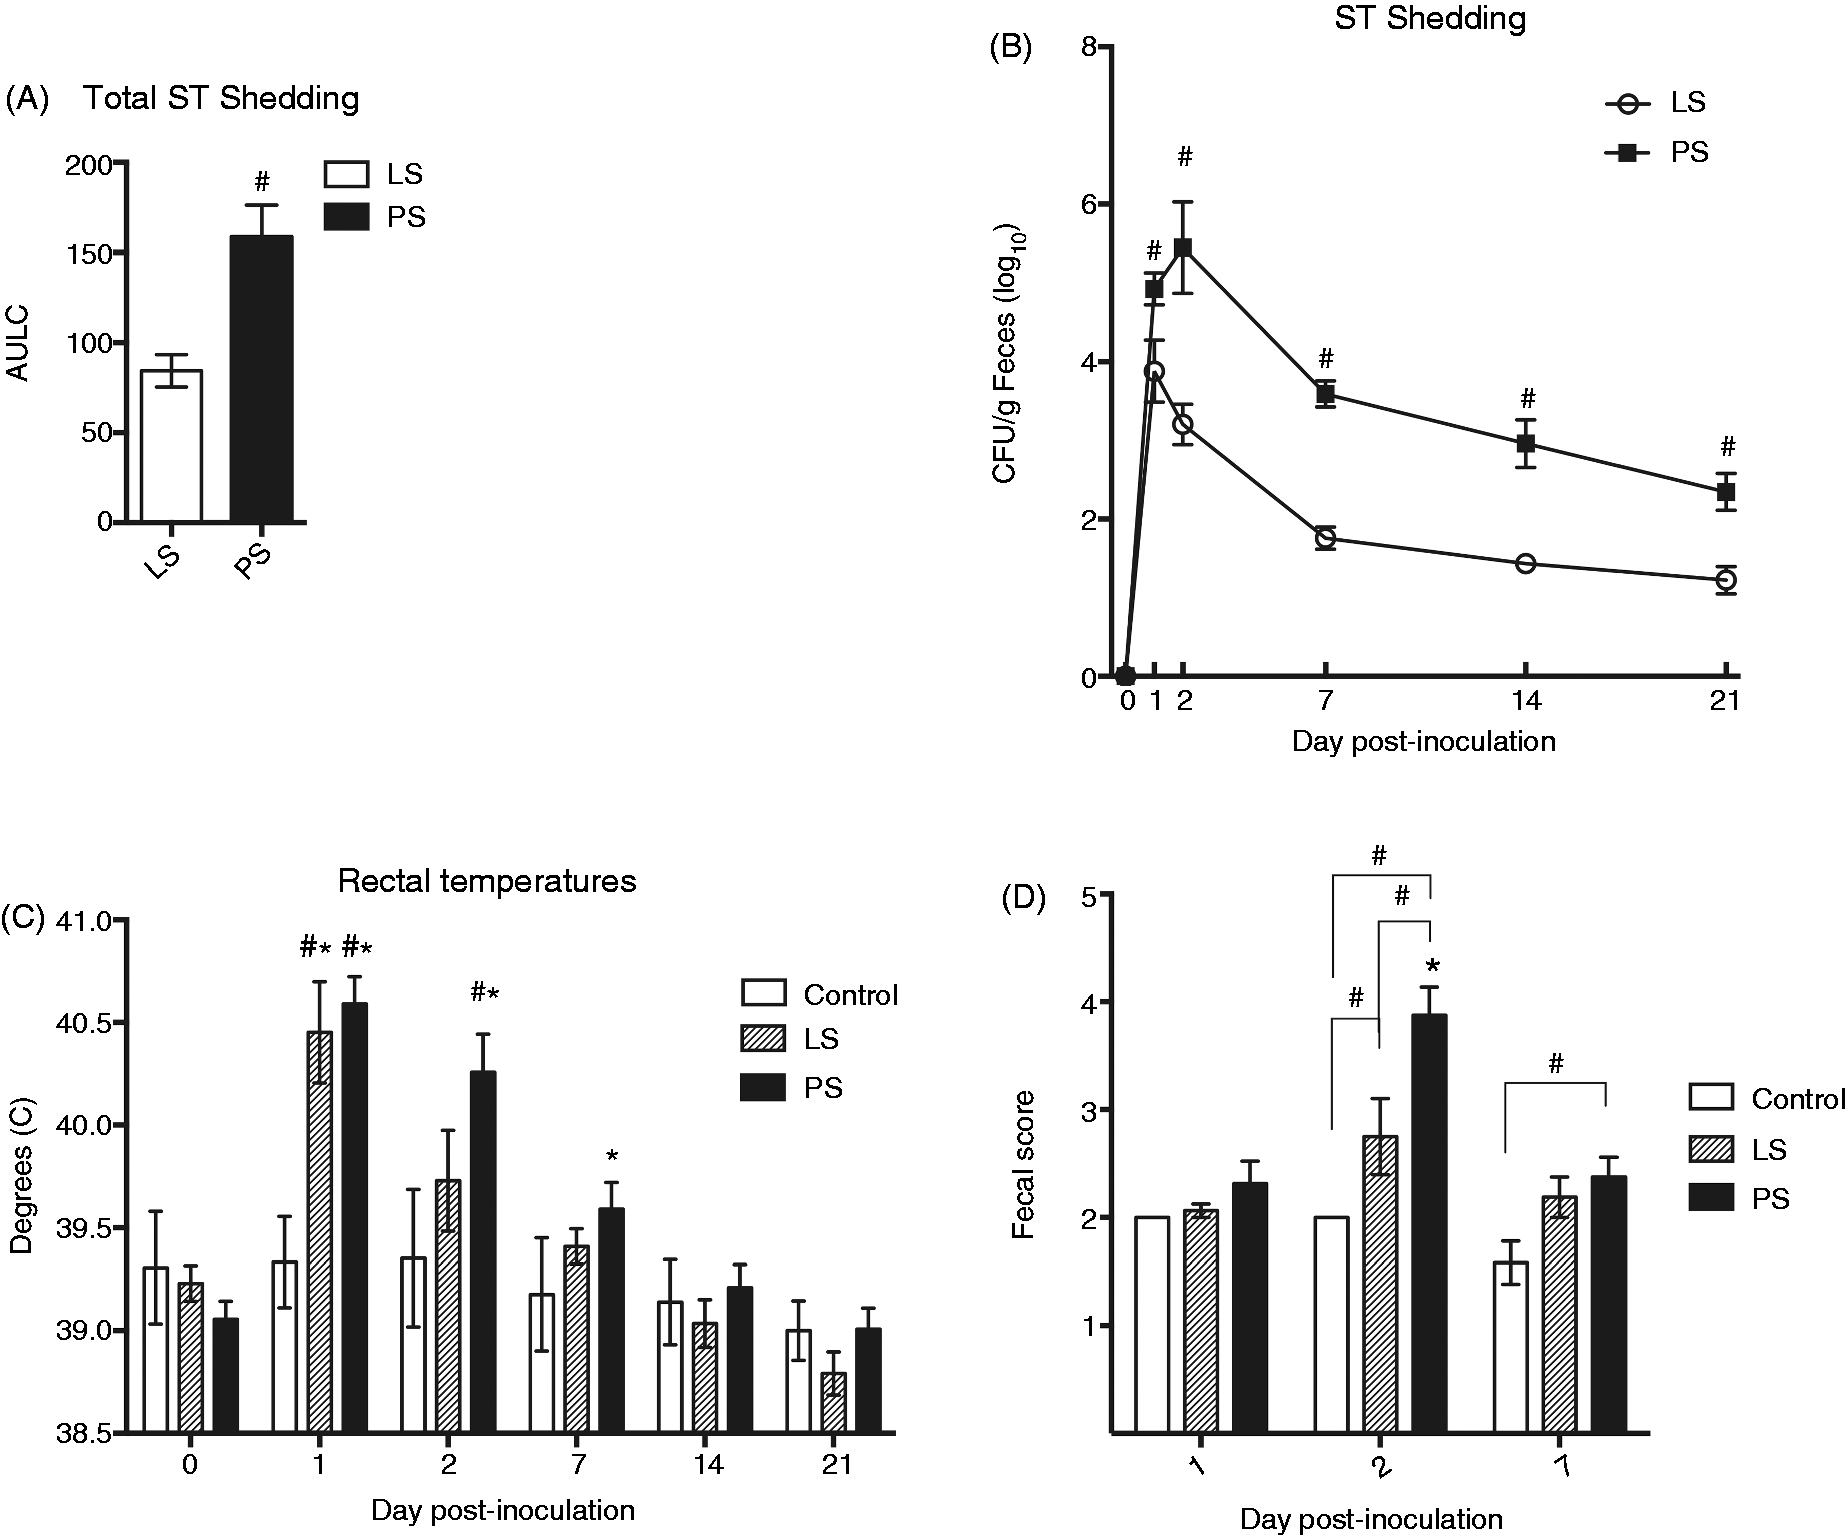
Expression of immune genes are enhanced in response to ST challenge
We chose to compare gene expression between samples collected at 0 and 2 DPI to characterize the response in peripheral blood early in ST infection. Gene expression was measured in the whole blood by qPCR analysis for CASP1, IL1B, TNF, IFNG, IFNAR1, IL8, IL10, CCR1, IL12B and CCR5. The expression of CASP1 was elevated at d 2 compared with before challenge for both LS and PS pigs (P ≤ 0.0001) as demonstrated by a lower ΔCt. At 2 DPI, the PS pigs had significantly higher levels of CASP1 expression than the LS pigs (P ≤ 0.05) (Figure 3). Levels of IL1B RNA were also increased in response to inoculation for both groups (P ≤ 0.05), although they were not different between LS and PS on day 2. Similarly, RNA levels of TNFA, IL10, IFNAR1 and CCR1 were also increased on d 2 for both LS and PS groups (P ≤ 0.01). The expression levels of IFNG and IL8 were not significantly different for the peripheral blood samples collected on d 0 versus 2 DPI for either LS or PS pigs. For both LS and PS pigs, levels of CCR5 and IL12B RNA were undetectable on d 0, and expression was not significantly different for either cytokine on d 2 compared with d 0 (data not shown).
Peripheral blood RNA gene expression in response to ST inoculation. Gene expression was measured as Ct values and ΔCt values calculated by subtracting the average Ct for the housekeeping gene RPL32 from the average Ct for each gene for each pig. Mean ΔCts are plotted ± SEM; hash marks (#) indicate statistically significant difference from unmarked groups at P ≤ 0.05 for comparisons of shedding type within day; asterisks (*) indicate statistically significant difference from unmarked days at P ≤ 0.05 for comparisons across time points within shedding type.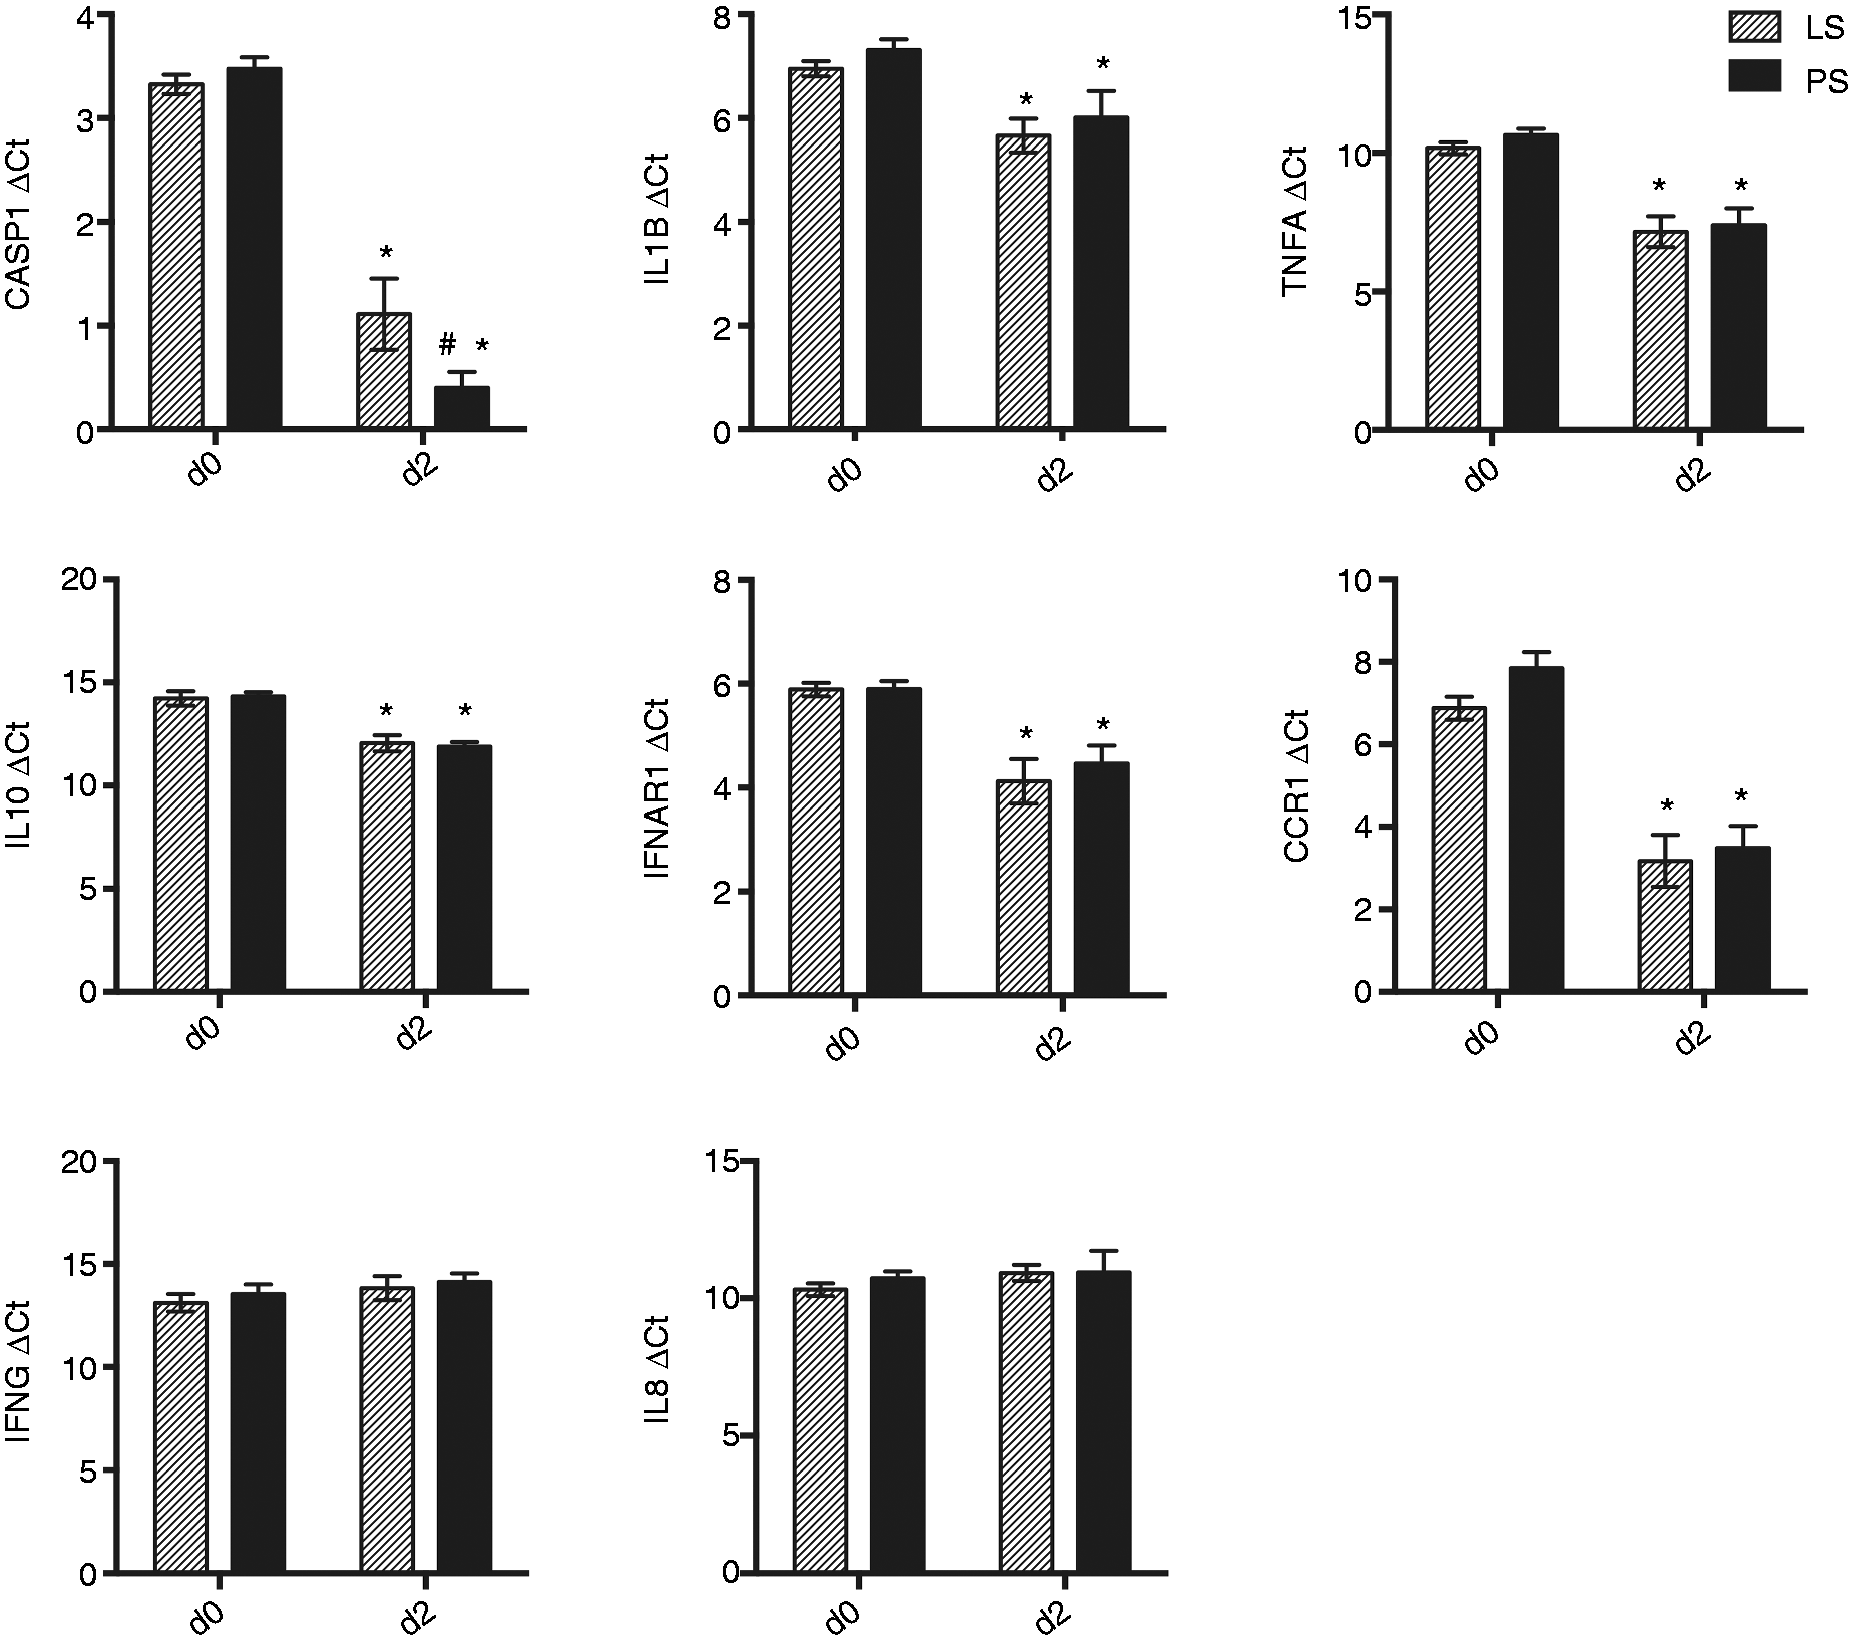
PS pigs elicited a more extensive transcriptional response
To further characterize the response following ST infection, we conducted microarray analysis of gene expression in whole blood samples. Comparison of transcript expression before and 2 d after ST inoculation revealed that LS pigs had 4153 DE genes (Q < 0.05), while PS pigs had 8952 such DE genes, indicating a more extensive response to infection. Lists of these DE genes are shown in Supplementary Table 3. However, statistical analysis revealed no significant interaction of shedding phenotype and time for any specific gene when controlling for multiple testing. Thus, individual genes whose expression responses differed significantly between LS and PS pigs were not evident.
We utilized qPCR results from the cytokine genes to validate the microarray data. Five of the six genes that were significantly different by microarray displayed the same significant expression patterns via qPCR analysis (IL1B, IL10, TNF, CCR1, and IFNAR1; Figure 3).
Upon functional annotation of these DE genes, several functional GO terms were over-represented in both the PS and LS responses to ST challenge, including ‘immune response’ and ‘NK cell-mediated cytotoxicity’ (Supplementary Table 4). Differential RNA expression indicated either up- or down-regulation, and thus a fold change of ≥ 1.5 or ≤ 0.667, in addition to Q ≤ 0.05, were used to declare up- or down-regulation from d 0 transcripts respectively. The numbers of DE genes for these criteria, as well as the number of overlapping genes among these four classes, are shown in Figure 4. A comparison of the numbers of up- or down-regulated genes in each of the classes demonstrated that PS pigs had more down-regulated genes (2425 versus 4044; Figure 4). The gene LOC100525629 of unknown function was the only gene that was regulated in an opposite direction between LS and PS pigs (Figure 4). Because there was no significant interaction between shedding phenotype and day for any specific genes, we interrogated the gene lists for up- or down-regulated genes within LS or PS pigs. From these lists, there were no significantly over-represented GO terms or functional clusters. All of the top 10 genes with the highest fold change in LS pigs were increased twice as much in PS pigs, with some gene expression increases being three times as high as those seen in the LS pigs. The number of DE genes, as well as the level to which they were expressed, indicate that PS pigs responded to ST infection more extensively than LS pigs at 2 DPI.
Up- and down-regulated DE genes (d 2 versus d 0) in LS and PS pigs. RNA was extracted from the whole blood and hybridized to Affymetrix Genechips for microarray data collection. Transcripts were categorized as up-regulated from d 0 on d 2 by a fold change in expression of ≥ 1.5 (UP) or down-regulated from d 0 on d 2 by a fold change in expression of ≤ 0.667 (DN). The FDR limit was set at a Q-value ≤ 0.05.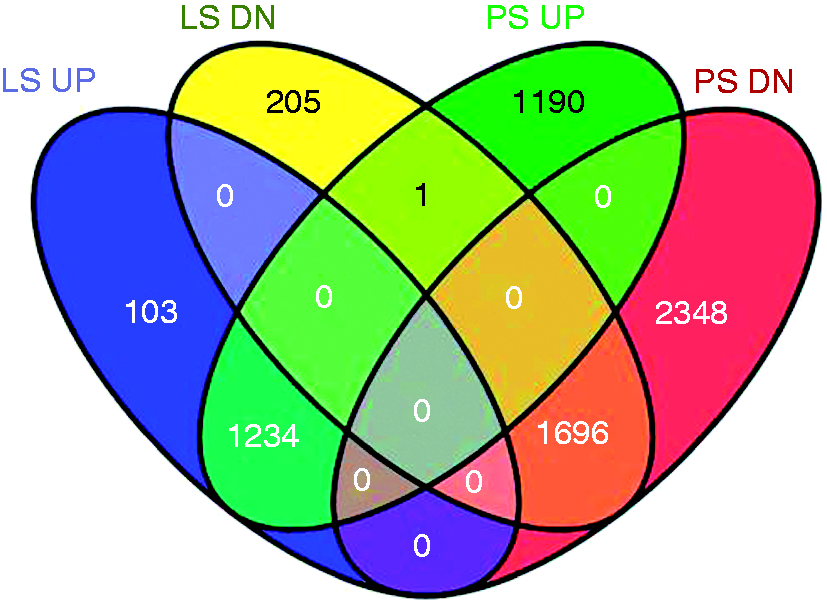
There were also distinct differences in function of the up- or down-regulated genes between the shedding phenotypes, as identified by over-represented GO terms (Supplementary Table 5). In addition to terms that are related to inflammation, such as ‘cytokine binding’, the 1337 up-regulated LS genes also mapped to regulatory terms such as ‘regulation of inflammatory response’ and ‘regulation of cellular/leukocyte/lymphocyte activation’. Alternatively, the 2425 up-regulated PS genes mapped to GO terms such as ‘chemokine signaling’ and ‘NK cell-mediated cytotoxicity’, suggested a more inflammatory transcriptional response. There were 1190 up-regulated genes in the PS pigs that were not represented in the LS pigs, and these included genes with additional inflammatory annotations. Grouping these terms into biological process clusters further demonstrated differences between the LS and PS transcriptional response, as LS clusters demonstrated an up-regulated response to immune stimuli, such as ‘response to bacteria’, as well as negative regulation, such as “negative regulation of leukocyte activation” (Figure 5). ‘Regulation of leukocyte/mononuclear cell/lymphocyte proliferation’ was also an over-represented term in the PS response; however, there were no enriched terms to indicate regulation of cellular activation.
Biological process clustering characterizing functional annotation of the transcriptional response in LS and PS pigs. The DAVID Functional Annotation Clustering tool (http://david.abcc.ncifcrf.gov) was used to cluster terms based on overlapping genes and functional similarity, and to assign an enrichment score for calculating biological significance. Only those clusters with a significant enrichment score of >1.3 are shown. (A) Functional clusters for genes with a fold change in expression of ≥1.5 (up-regulated) for LS pigs or (B) for PS pigs. (C) Functional clusters for genes with a fold change in expression of ≤0.667 (down-regulated) for LS pigs or (D) for PS pigs.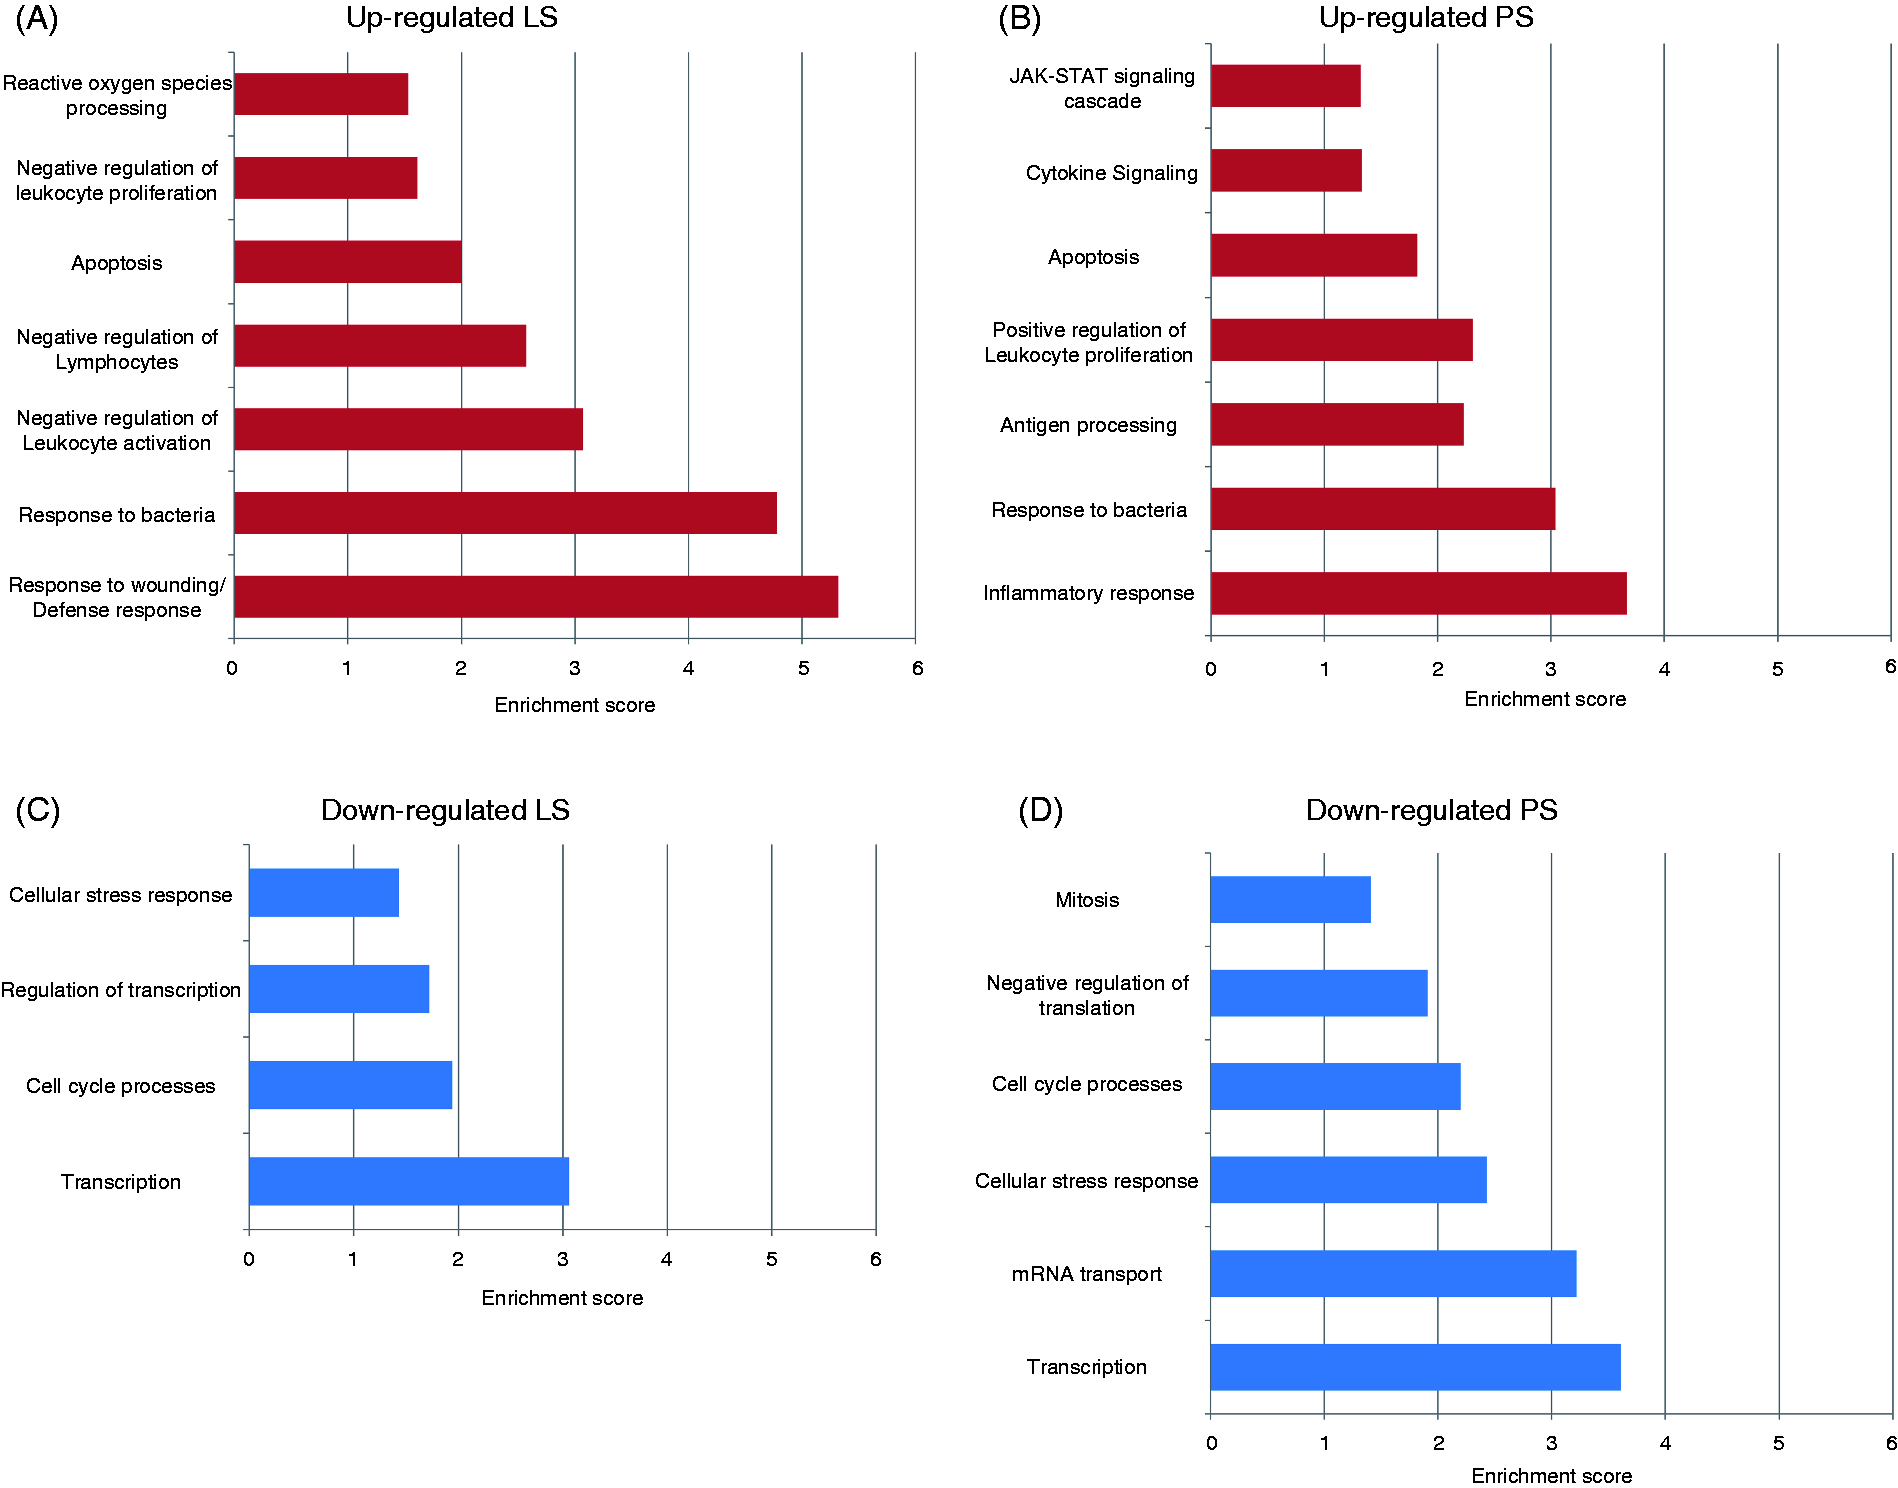
The down-regulated genes for both LS and PS pigs mapped to more broad GO terms such as ‘nucleus’, as represented by the biological process clusters ‘cell cycle process’ and ‘transcription’. Taken together, these results indicate that the PS pigs expressed more RNA with inflammatory functions than LS pigs did at 2 DPI. In contrast, LS pigs at this same time point express RNA with more regulatory functions as a component of their response.
To visualize potential regulators and networks involved in the gene expression responses of LS and PS pigs, an SNEA was used to generate over-represented regulation networks for up-regulated genes in both classes. Previous research has demonstrated an increase in serum IFN-γ in response to ST that it is correlated with greater ST shedding.
14
For this data set, the IFNG response pathway and the STAT1 and IFNB1 regulation networks were evaluated, as these were the most significantly over-represented networks for this class of genes. This SNEA analysis revealed 66 genes in the STAT1 network, 67 genes in the IFNB1 network and 226 genes in the IFNG network. For clarity, a subset of these genes was selected for representation in the pathways based on functional relevance (Figure 6). We demonstrate that although qPCR analysis showed IFNG was not significantly changed in the PS pigs at 2 DPI, many of the genes known to respond to IFNG signaling were up-regulated. The overlapping nodes of the IFNG, IFNB1 and STAT1 networks illustrate a complex pro-inflammatory profile, indicating potential mechanisms for the enhanced inflammatory response seen in PS pigs.
Up-regulated genes in the inflammatory response of PS pigs in the peripheral blood on d 2. SNEA was conducted on the up-regulated genes in the inflammatory response of PS pigs. The up-regulated genes present in the IFNG, IFNB1 and STAT1 (yellow) response networks are represented. Genes that were present in all three pathways, present in functional annotation GO terms, or those with functional relevance are shown. Green lines indicate promoter binding, lavender lines indicate expression, gold lines indicate protein modification, gray solid lines indicate direct regulation and gray dotted lines indicate regulation. Symbols indicate protein classification as shown in the legend.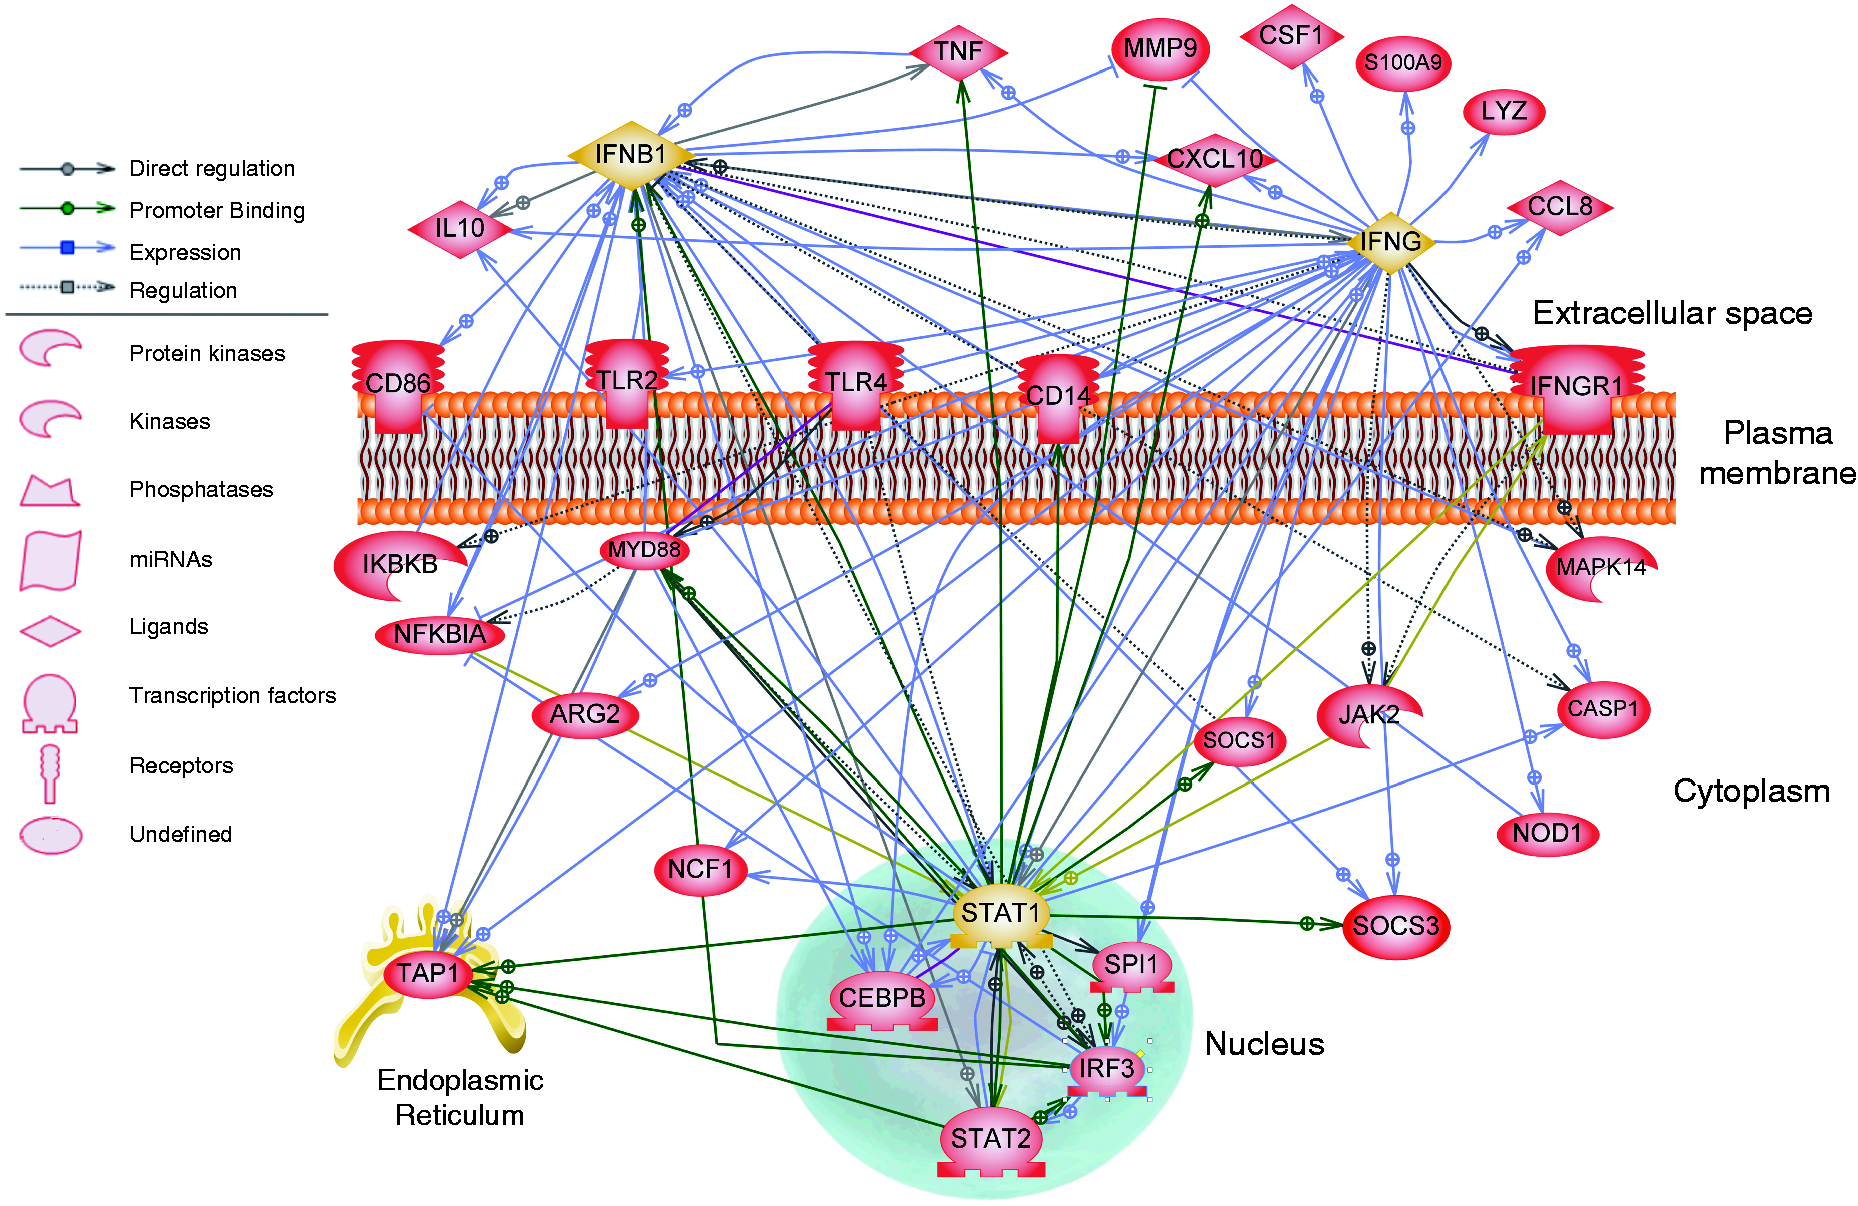
Over-represented GO terms related to negative regulation were unique to the up-regulated genes in LS pigs. As such, we chose to analyze the response pathway for 18 genes that were present in the GO terms ‘regulation of inflammatory response’, ‘negative regulation of leukocyte activation’ or ‘negative regulation of lymphocyte activation’ (Figure 7). The cytokines, cytokine receptors and transcription factors present in these pathways are known to regulate immune response activation, and may mediate alternative activation of cells in the periphery at 2 DPI.
Up-regulated genes in regulatory annotation terms unique to LS pigs. The up-regulated genes presented in the functional annotation GO terms ‘regulation of inflammatory response’, ‘negative regulation of leukocyte activation’ and ‘negative regulation of lymphocyte activation’ are shown. Green lines indicate promoter binding, lavender lines indicate expression, gold lines indicate protein modification, gray solid lines indicate direct regulation and gray dotted lines indicate regulation. Symbols indicate protein classification as shown in the legend.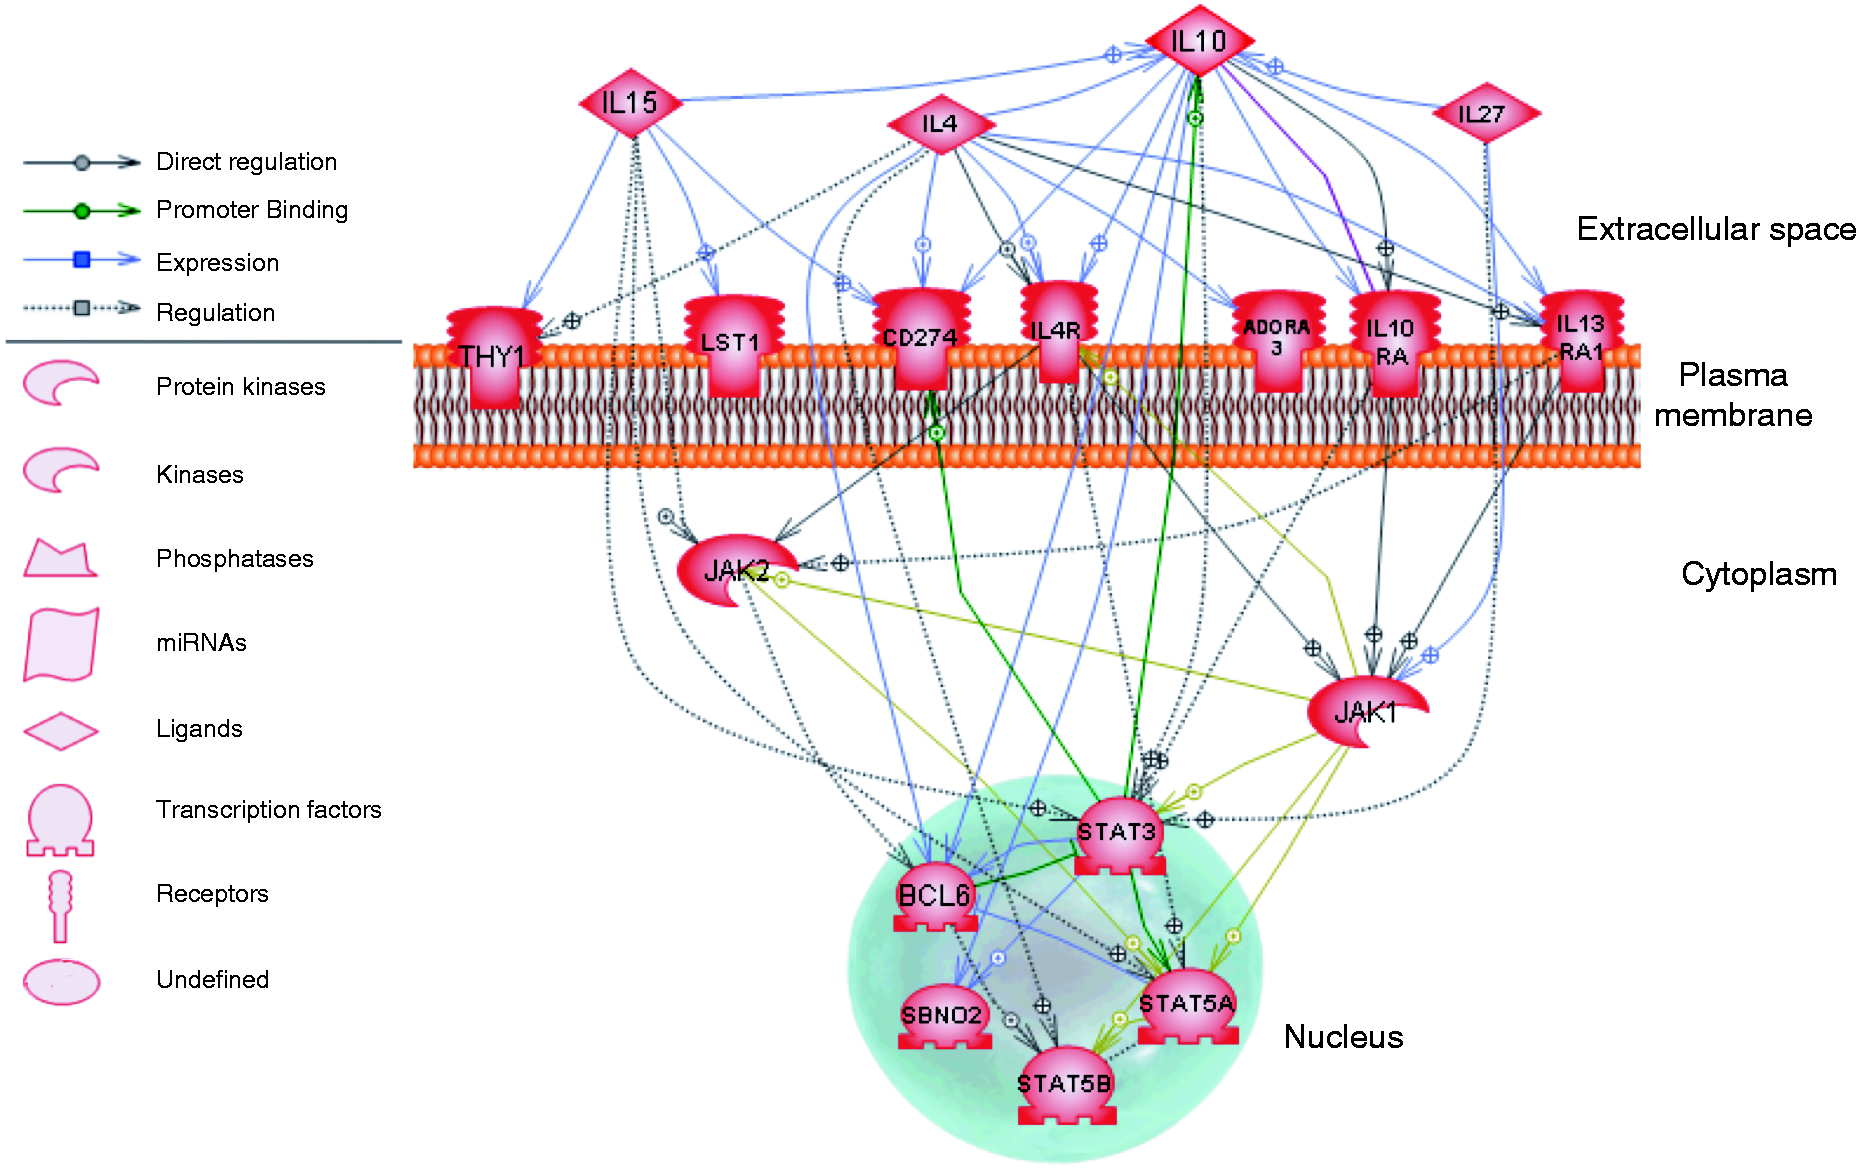
Discussion
Understanding the cause of variation in the severity of porcine salmonellosis is vital if we are to decrease the impact of salmonellosis on animal health, food safety and human health. As such, characterizing the differences in the response to ST infection in those animals that shed fewer Salmonella bacteria may provide insight to limit disease spread early, minimizing both production losses and food safety risks. To our knowledge, this is the first study to combine analysis of clinical and growth performance data, multiple peripheral cytokine concentrations and whole blood transcriptomic data to identify differences in the response of pigs with differing ST shedding levels.
Early clinical phenotypes are distinct in pigs shedding extreme fecal levels of ST
Measurements of fecal ST for the study population support previous reports that shedding amounts and duration vary between infected pigs. While shedding in some pigs dropped below the minimum of quantitative detection by d 7, others shed ST in measurable amounts to the end of the study. Shedding levels varied between d 1 and d 2 post-inoculation, and some pigs exhibited a recrudescence in shedding levels as the study progressed. This variability supports the need to identify immune responses and reliable biomarkers that correlate with a reduction in both shedding levels and reoccurrence of shedding. Comparisons of ST CFU shed between LS and PS pigs revealed that these two groups differ distinctly as early as 1 DPI, and indicated that shedding outcomes can be defined as early as d 1. Moreover, the enhanced severity of diarrhea seen in the PS pigs is likely a contributing factor to the decreased ADG observed in this shedding group. Taken together, these results showed LS pigs had lower total ST shedding after challenge, had less severe diarrhea and reduced these shedding levels more quickly than the PS pigs.
Pyrexia induced by ST challenge was evident as early as d 1, where it peaked for both LS and PS pigs. Previous studies have indicated that body temperatures could be elevated as early as 12–24 h post-inoculation,27,28 and pigs could begin shedding bacteria at 2 h post-inoculation. 29 The drop in body temperatures of LS pigs by d 2 may indicate that LS pigs limit the inflammatory response more quickly. Combined with reduced shedding at this time point, a reduction in the inflammatory response may also be indicative of more efficient control of ST infection. This may suggest that control of ST infection in the LS pigs is mediated through other mechanisms apart from, or in addition to, inflammation.
We further explored inflammation differences between PS and LS pigs by evaluating expression of selected inflammatory genes by qPCR. The expression levels of CASP1, IL1B, TNFA, IL10, IFNAR1 and CCR1 were increased on d 2 in response to ST challenge for both LS and PS pigs. Further, CASP1 expression was significantly greater in PS pigs than in LS pigs. This gene encodes the pro-enzyme form of caspase-1, and can be activated by Salmonella flagellin ligation of a cytosolic PRR known as IL-1β converting enzyme-protease activating factor. 30 Simultaneous signals such as TNF-α or the ligation of other PRRs yield the synthesis of inactive pro-IL-1β and pro-IL-18, 31 which are proteolytically cleaved by caspase-1 for their activation and secretion. Greater expression of CASP1 in the PS pigs could be indicative of an enhanced pro-inflammatory response, either as a measure of replenishing intracellular caspase-1, or as a mechanism for continued signaling. Because the PS pigs did not control ST shedding as quickly as LS pigs, the enhanced systemic inflammatory response observed may have been necessary to maintain the health of the animal or occurred in response to the sustained presence of ST antigens.
Distinct serum cytokine patterns in LS and PS pigs during early infection response
To further elucidate the global differences between the LS and PS inflammatory responses, we measured serum concentrations of six cytokines as biomarkers of inflammation. Both IL-1β and TNF-α were elevated at 2 DPI in the PS pigs, consistent with the observed increases in rectal temperature, as these are acute-phase proteins that can elicit a febrile response. Others have investigated the peripheral TNF-α response to ST infection, with varied results in levels detected and the kinetics of the response.27,32,33 We hypothesize that this variation may be a result of differing experimental factors, such as differences in virulence of the ST strains, differences in host genetics and/or assay sensitivity.
Serum levels of CXCL8 were increased only in LS pigs on d 2. Others have reported increased serum CXCL8 in response to porcine infection with ST, and the neutrophil and fluid influx into the gut lumen is a hallmark of diarrhea seen in ST infection. 33 However, high levels of CXCL8 in the peripheral blood and less severe diarrhea were both observed in the LS pigs. Others have demonstrated serum CXCL8 is highest at 1 DPI in response to ST challenge. 33 Further, IL-1β and TNF-α not only mediate pyrexia, but also induce production of other inflammatory cytokines, including CXCL8, by blood leukocytes and endothelial cells. As chemokines establish a gradient to attract target cells to sites of inflammation, it is possible that high levels in the blood are secondary to a greater response previously induced by intestinal inflammation. If so, the circulation of inflammatory cytokines that mediated the LS pig pyrexia observed on d 1 likely also induced the subsequent production of CXCL8 measured on d 2, as the half-life of CXCL8 is relatively short (< 4 h). In addition, systemic functions of CXCL8 include neutrophil mobilization from the bone marrow to replenish those in circulation, as well as delayed neutrophil apoptosis.34,35 We hypothesize that neutrophil recruitment to the gut was rapid and efficient in LS pigs, and the circulating levels observed in the blood on d 2 are a remnant of that response.
Both LS and PS pigs had greater circulating IL-10 concentrations than controls at d 2 or at any other time point. As a negative regulator, IL-10 is produced by multiple cell types simultaneously with pro-inflammatory cytokines.36,37 It is likely that induction of IL-10 in response to ST is a mechanism for restraining the inflammation elicited by infection.
Circulating levels of IFN-γ at 2 DPI were elevated in the PS pigs compared with pre-inoculation levels and remained elevated at 21 DPI. Caspase-1 activation has been demonstrated to induce IFN-γ rapidly through the activation of IL-18 in the mucosa in response to Salmonella infection, 38 and it is possible that circulating cells in the periphery produce IFNG in response to caspase-1-induced IL-18 as well. Indeed, we have previously reported a correlation between IFNG levels and ST shedding. 14 The PS pigs also had elevated IL-12p40, a subunit of the heterodimer IL-12, when compared with controls on d 2. Observing similar responses in IL-12p40 and IFN-γ is not surprising, as leukocytes produce IL-12p40 in response to pathogen sensing to induce Th1 differentiation and IFN-γ production. 39
The different cytokine profiles observed in the LS and PS pigs may indicate either a difference in the time course of the response, or a difference in the type of response generated between the two shedding phenotypes. As the LS pigs had reduced fever and decreased shedding earlier than the PS pigs, as well as a peripheral cytokine response dominated by IL-10 and CXCL8, it may be reasonable to postulate that their response limited ST invasion and attenuated the immune response by d 2. Conversely, the PS pigs appeared to have more sustained inflammatory and febrile responses than the LS pigs, as well as elevated IFN-γ on d 21. It is possible that the PS pigs responded less quickly, leading to an extended inflammatory response. Studies identifying host genetic elements of Salmonella resistance indicate that such a phenotype results from limiting Salmonella replication in macrophages early, and that susceptible animals are less capable of controlling replication and the ensuing infection. 40
Blood transcriptomic patterns indicate regulatory pathway differences in LS and PS pigs
To explore the regulatory mechanism for this potential divergence in response, microarray experiments were used to compare the global gene expression patterns between LS and PS pigs. Our previous work indicated that PS pigs had a greater transcriptional response to ST challenge than LS pigs. 15 Similarly, the PS pigs identified in this study had a much more extensive transcriptional response to infection, as evidenced by differential expression of more than double the number of genes compared with the LS pigs. The importance of the IFNG response in ST infection continues to be highlighted by this study and by others.14,15,41,42 We identified that the IFNG regulatory network was significantly over-represented by up-regulated genes in the PS pigs, and the STAT1 and IFNB1 networks were the most highly significant over-represented networks in this group. IFN signaling pathways vary depending on the stimulus; however, they largely result in the binding of transcription factor complexes to the IFN-stimulated response elements in the promoters of IFN-stimulated genes. 43 The induction of these genes by IFN-β stimulation is often mediated by dimerization of STAT1 and STAT2 transcription factors, or by TLR signaling to phosphorylate IFN regulatory factor 3 (IRF3). 44 Ligation of TLR4 following Salmonella infection had been shown to stimulate IFN-β production, which then acts in both a paracrine or autocrine manner to activate dendritic cells and up-regulate co-stimulatory molecules. 45 Genes represented in IFNG, STAT1 and IFNB1 regulation networks included CASP1, TNFA and IL10, further indicating a relationship between the gene transcription represented in the networks and the IL-1β, TNF-α and IL-10 cytokine concentrations we found to be elevated in the blood of PS pigs. The interactions of IFNB1, TLR4, STAT1, STAT2, IRF3 and IFNG in the over-represented networks of up-regulated genes in the PS pigs on d 2 are complex, as indicated by the data. We have previously reported regulatory networks in PS pigs in a separate challenge population, 15 and demonstrated that four out of five of those networks were, again, significantly over-represented in the PS group of this study population (CEBPB, SPI1, TLR4 and IFNG).
Functional annotation revealed that, as expected, although both groups were expressing genes involved in the inflammatory response, functions involved in regulation were up-regulated in and unique to LS pigs. SNEA of these genes suggested that LS pigs are negatively regulating the immune response on multiple levels. The gene products of BCL6, SBNO2 and STAT5B have been shown to repress transcription,46–48 and IL-10 and IL-27 both suppress inflammation. 49 The protein encoded by the CD274 gene, also known as PD-L1, responds to IL-10 and IL-27 to induce negative regulation in multiple cell types.50,51Ligation of IL-4R and IL-13RA by their cognate cytokines induces alternative activation of macrophages, a phenotype involved in wound healing and resolution of inflammation, 52 and IL-4 has been demonstrated to have anti-inflammatory activity in pigs and other species.53–55 Additionally, the gene products of both THY1 and LST1 can prevent cellular activation, proliferation and promote negative regulation after stimulation.56–59 Together, the expression of these genes and their involvement in regulatory pathways provides further support for a negative regulation of the immune response in LS pigs by d 2 post-inoculation. It would be interesting to further characterize these gene expression differences to identify transcriptional patterns correlated with shedding as biomarkers of potential shedding phenotype.
We hypothesize the differences observed in the febrile response, peripheral cytokine levels, shedding amounts and gene expression are connected by a differential immune response to ST infection, thereby establishing the LS and PS phenotypes. It is also possible that additional mechanisms, such as those mediated by the gastrointestinal microbiota, are responsible for the differential responses. Variation in microbial communities in the gut may limit ST invasion, altering the requirement for an inflammatory response and limiting shedding. Our recent comparison of the gastrointestinal microbiota of a subpopulation of the extreme Salmonella-shedding pigs identified significant differences in the microbiota before and after challenge with ST between the pig groups. 16 Additionally, measurements taken from the whole blood may not be as indicative of the gastroenteritis induced by ST in swine compared with sampling the mesenteric lymph node or the gut lumen. Whole blood measurements, however, provide us with a practical, repeatable sampling measure in pigs, as well as a more global view of the response. Whole blood transcriptomics have been highlighted as a useful measure of biomarkers for the immune response to disease in humans, 60 and their capabilities in livestock are beginning to be elucidated.
In conclusion, we characterized two phenotypic populations of pigs that differed in their clinical and shedding responses to ST challenge. These two populations exhibited different circulating cytokine profiles, gene expression functional patterns and regulation networks. Together, these data suggest that distinct, alternative immune responses to ST infection could result in different shedding outcomes in swine. Understanding these differing response mechanisms to Salmonella infection is critical to maximizing livestock production, enhancing food safety and protecting human health.
Footnotes
Funding
This work was supported by a National Research Initiative Competitive Grant [no. 2009-35205-05192] from the USDA National Institute of Food and Agriculture, the USDA-ARS-NADC and the USDA-ARS-BARC.
Acknowledgements
We would like to thank Brad Bearson, Brian Brunelle, Jenn Jones and Stephanie Jones for animal assistance and excellent technical support. We thank Jiqing Peng for expert data production and analysis for the Affymetrix Porcine Genechip. We would also like to thank Curtis Christian and Jolita Uthe for technical assistance.
Conflict of interest
The authors do not have any potential conflicts of interest to declare.
References
Supplementary Material
Please find the following supplemental material available below.
For Open Access articles published under a Creative Commons License, all supplemental material carries the same license as the article it is associated with.
For non-Open Access articles published, all supplemental material carries a non-exclusive license, and permission requests for re-use of supplemental material or any part of supplemental material shall be sent directly to the copyright owner as specified in the copyright notice associated with the article.