
Abstract
Susceptibility to infection and response to vaccination differ between populations and as a function of age. The underlying mechanisms for this age- and population-dependent variation are not known. Specifically, it is unclear if these variations are due to differences in genetically encoded host programs or driven by environmental influences or a combination of both. To address the relationship between gene and environment regarding immune ontogeny, we determined the innate cytokine responses following PRR stimulation of blood mononuclear cells at birth, 1, and 2 yr of age in infants from Caucasian vs. Asian parents and were raised in the same city. At birth, we found that innate cytokine responses were significantly elevated in Asian compared with Caucasian infants. However, these differences waned and responses became more similar over the course of 1–2 yr of living in a similar environment. Our observations that innate response differences present at birth subsequently equalized rather than diverged suggest a key role for environmental effects common to both racial groups in shaping the innate immune responses early in life. Delineating the underlying environmental factors that modulate innate immune responses early in life could provide avenues for targeted beneficial immune modulation.
Introduction
Newborns and infants suffer higher morbidity and mortality from infectious diseases compared with older children and adults. 1 Several age-dependent differences in the immune system have been associated with reduced protection from infection or responses to vaccination. 2 The innate immune system represents the first line of host defense against pathogens.3,4 It also directs the adaptive immune response, via Ag-presenting cells as well as expression of co-stimulatory molecules and cytokines. 4 The innate immune system can be activated by microbial pathogens via pattern recognition receptors (PRRs). Toll-like receptors (TLRs) are the best-characterized group of PRRs and can recognize a wide variety of pathogen-associated molecular patterns (PAMPs) derived from bacteria, viruses, fungi and parasites.5–7 We have previously described the ontogeny of TLR-mediated cytokine responses in infants from birth to 2 yr of age.8,9 The general trend in cytokine production is high production of IL-10 and Th17-supporting cytokines (IL-23 and IL-6) at birth, which subsequently drops to a level similar to healthy adults by 2 yr of age. A reverse trend is observed for Th1-supporting cytokines (IL-12p70 and IFN-α), i.e. low levels at birth increasing to levels similarly high as in adults by 2 yr of age. These transitions correlate with periods of heightened vulnerability to systemic infection, i.e. are likely clinically relevant.9,10
However, not all newborns in our cohorts exhibited similar responses to PRR stimulation. We found that specific SNPs in innate genes are linked to variations in particular cytokine responses of newborns and that the prevalence of these SNPs parsed according to racial background. 11 This suggests that neonatal immune responses to PRR are strongly affected by host genetics. Several other studies have confirmed a prominent role for host genetics in the regulation of immune responses in early life. 12 However, variation in immune responses to PRR stimulation has also been ascribed to differences in the environment.2,10 Of particular interest, immune phenotyping analysis of adults indicates that for more than half of the immune parameters studied, > 80% of the variance can be explained by non-heritable factors (i.e. half of adult immune responses are most heavily shaped by environment) 13 . Furthermore, environmental influences have recently been shown to be the most important factor explaining inter-individual immunological variation; immune profiles of cohabitating parents (i.e. same environment) were significantly more similar compared with randomly generated pairs. 14
Contrasting the prominent influence of host genetics at birth on immune responses with the pronounced influence of environment on adult immune responses,11,13,14 we hypothesized that influence of host genetics (based on racial background) on the innate system would decrease, while the impact of environmental factors would increase with age. To test this hypothesis we measured innate immune responsiveness in 113 healthy newborns of different racial background over the first 2 yr of life brought up in a similar geographical environment.
Materials and methods
Study cohort
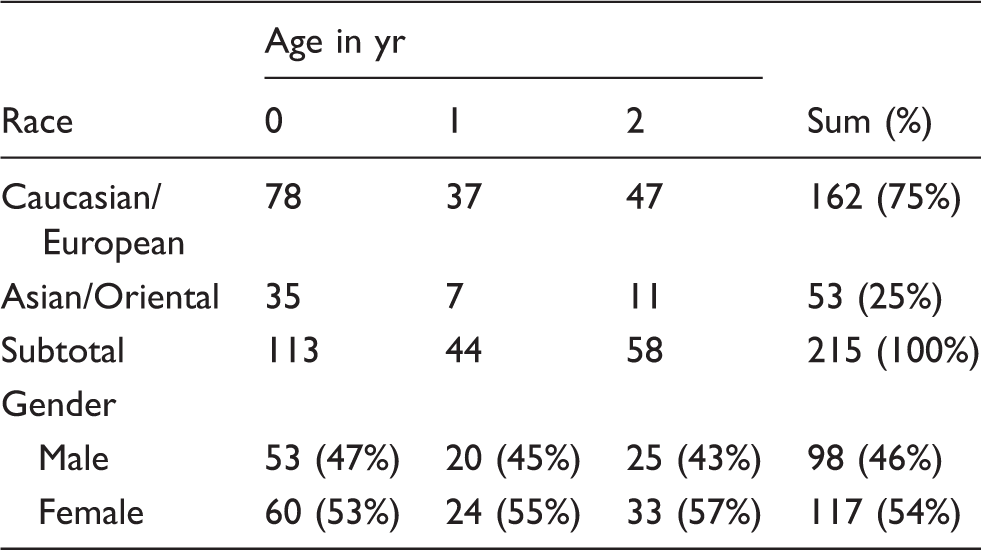
Our study was approved by the institutional ethics review board at the University of British Columbia. A detailed description of our study cohort and recruitment has been previously described. 9 Briefly, written and informed consents were obtained from women undergoing elective Caesarean section at BC Children's Hospital (Vancouver, Canada), and only subjects born via uncomplicated elective Caesarean section were included in our study. A total of 215 samples were assayed for cytokine production where parents' self-declared race was either Asian (specifically East Asia: China, Hong Kong, Macau, Japan, North Korea, South Korea, Mongolia, Taiwan) for both parents or Caucasian for both parents.
In vitro stimulation and measurement of cytokine levels
Cord blood was collected immediately following birth from the umbilical vein using vacutainers containing 143 units of sodium-heparin (BD Biosciences, San Jose, CA, USA). Cord blood mononuclear cells (CBMCs) or PBMCs were isolated within 4 h of blood sample procurement by Ficoll–Paque density gradient centrifugation as previously described. 15 CBMCs and PBMCs were stimulated with TLR2/1 ligand Pam3CSK4 (PAM; 1 mg/mL; InvivoGen, San Diego, CA, USA), TLR3 ligand pI:C (pIC; 50 mg/mL; GE Healthcare, Little Chalfont, UK), TLR4 ligand Escherichia coli 0111:B4 LPS (100 ng/mL; InvivoGen), TLR7/8 ligand 3M-003 (10 mM; 3M Pharmaceuticals, St Paul, MN, USA) and TLR9 ligand CpG ODN 2336 (CpG-A; 25 mg/ml; Coley Pharmaceutical, Wellesley, MA, USA) for 18 h at 37℃ with 5% CO2. The culture supernatant was collected and stored at −80℃ for cytokine measurement. The supernatant was thawed at room temperature, and levels of IL-1β, IL-6, IL-8, IL-10, IL-12p40, IL-12p70, MIP-1α, MIP-1β, MDC, IP-10, IFN-α2, IFN-γ and TNF-α were measured by Luminex assay (Millipore, Billerica, MA, USA). The assays were read using the Luminex 200 Total System (Luminex, Austin, TX, USA) and data were acquired and analyzed using MasterPlex software 2010 (MiraiBio Group, San Francisco, CA, USA). The standard curves ranged from 13.72 to 10,000 pg/mL for each cytokine. Cytokines and chemokines expressed below the lower limit of detection or above the upper limit of detection were removed from the analysis.
Statistical analysis
For clustering analysis we used correlation and average linkage for distance method and cluster algorithm, respectively. 16 Correlation distance uses 1-ρ as the distance where ρ is the correlation of the two vectors. Average linkage defines the distance as the average of all pairs from each cluster group. We used a quantile binning method to map the data values to colours. Cytokines detected above the lower limit of detection were stratified according to racial group and non-parametric statistical tests were employed (unpaired t-test with Welch's correction, to account for asymmetry in the number of participants between groups, and Bonferroni post-test correction, to account for multiple comparison) to determine whether racial background significantly influenced the innate immune response. Two major racial groups were stratified (assigned based on self-declared parental race as Asian or Caucasian) and included for this analysis. A P-value < 0.01 was considered significant. All statistical analyses were performed using Microsoft Excel (2010), Microsoft® Excel 2000/XLSTAT-Pro© (Version 7.5.2, 2004, Addinsoft, Inc., Brooklyn, NY, USA), GraphPad Prism version 5.01 (GraphPad Software, La Jolla, CA, USA) and R statistical software. 17
Results
Subject demographics and immune responses
Demographic variables of the study population.
Biologically relevant clustering of response to TLR ligands
We first determined if our previously observed clustering of cytokine responses to specific TLR-stimulation in a cross-sectional cohort was recapitulated in this longitudinal cohort.
18
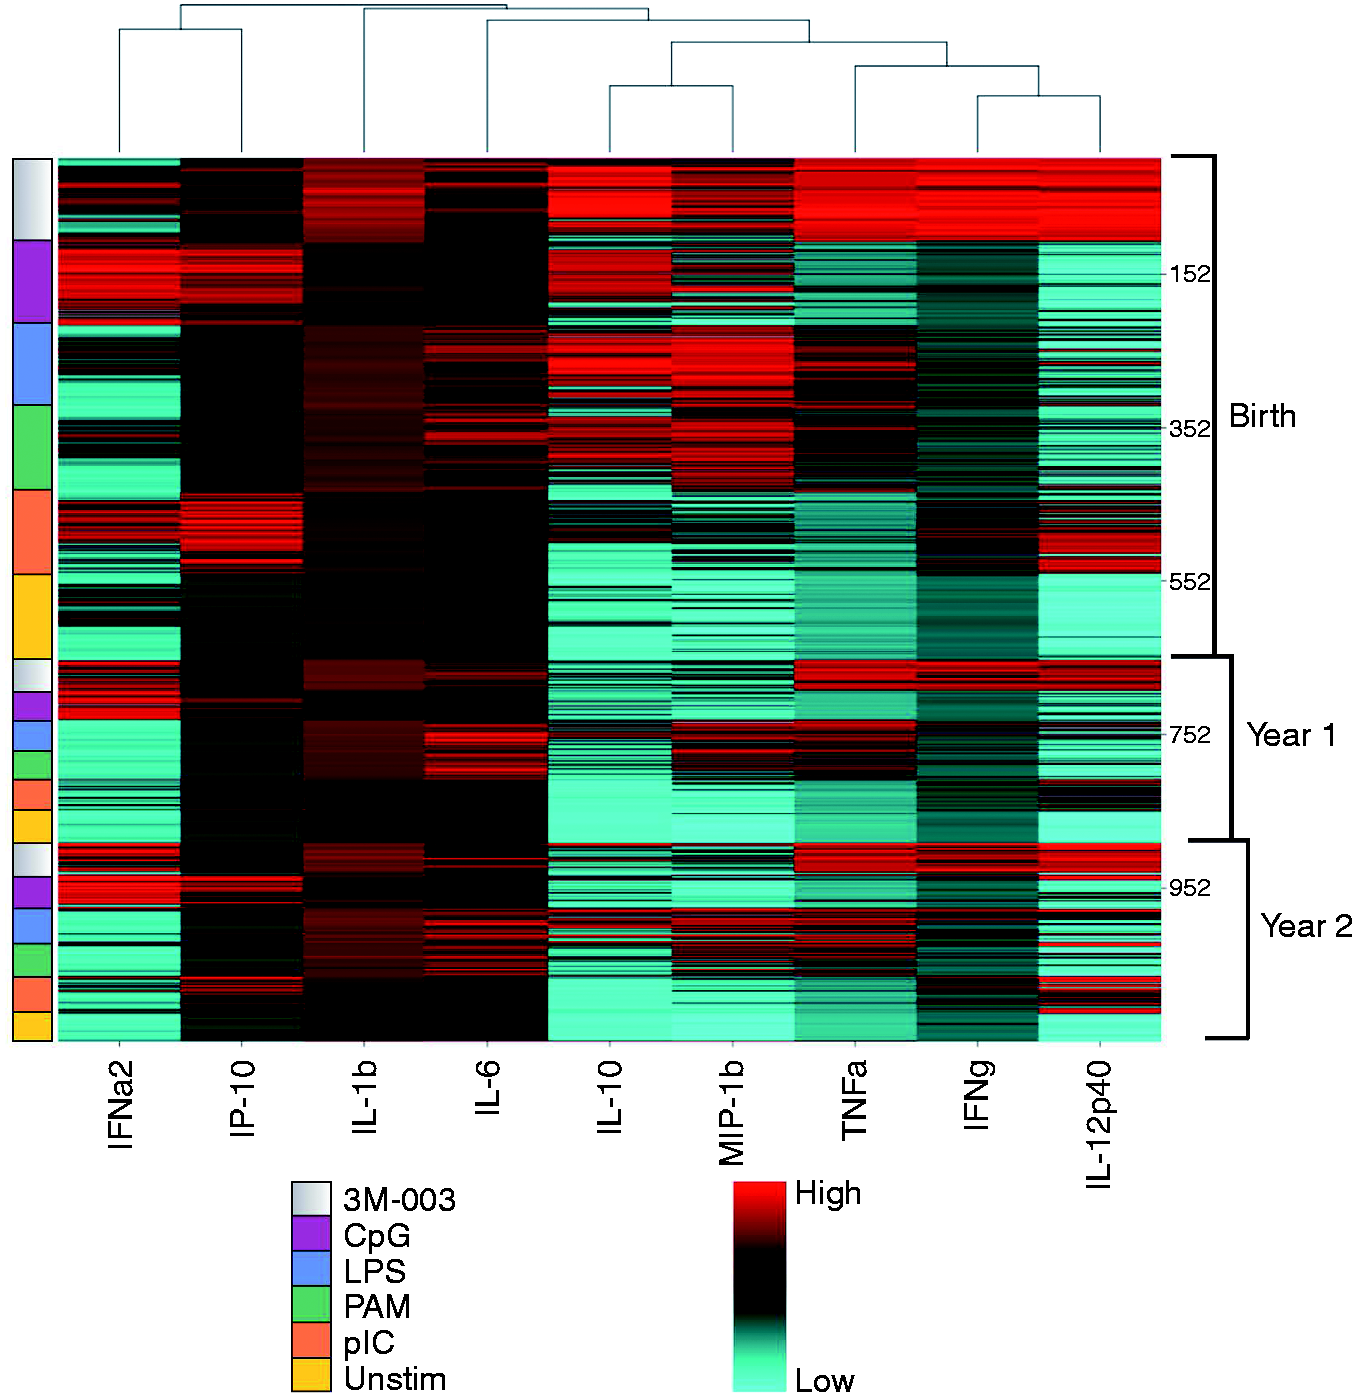
Cytokine production by mononuclear cells following TLR ligand stimulation was determined using Luminex bead-based assays; the full list of cytokine concentrations is shown in Supplementary Table 1. A total of 54 stimulation/cytokine expression combinations were analyzed (six TLR ligand stimulations/nine cytokines). Clustering of surface vs. intracellular (vesicular) TLR agonists in this unsupervised approach (Figure 1) recapitulated our previous findings regarding clustering of TLR responses based on subcellular location of the particular TLR.
18
Beyond clustering based on TLR location within the cell, we also explored clustering of the cytokine responses based on correlation distance as defined by the average linkage method.
16
The dendrogram in Figure 1 reveals that pro-inflammatory cytokines (TNF-α, IFN-γ, IL-12p40) clustered more closely together than with chemokines/cytokines or anti-inflammatory cytokines, while cytokines involved in anti-viral responses, IFN-α2 and IP-10, were clustered away from all other cytokines.
Cytokines of similar type clustered together based on their response to TLR ligands. Visual representation of correlation clustering of cytokines measured in response to TLR ligands. Pro-inflammatory cytokines (TNF-α, IFN-γ, IL-12p40) clustered more closely together compared with chemokines/cytokines or anti-inflammatory cytokines, while cytokines involved in anti-viral responses, IFN-α2 and IP-10, clustered together on their own. The gradient of colour from red (low response) to green (high response) indicates the relative expression of each cytokine (x-axis) against each subject/stimulation combination (row, right y-axis). The stimulation are colour-coded (left y-axis) as per the legend below the heatmap. Note that the rows are also sorted by age group and there are 1854 rows in total. Above the figure, the 13 columns were clustered based on correlating distance as defined by average linkage method.
16
We next determined the specific factors contributing to this clustering pattern of innate immune responses in early life. To this end, principal component analysis (PCA; Figure 2) was performed. The first two components are depicted on the x- and y-axis, respectively, and contributed to the overall variance as follows: F1 (37.13%) and F2 (15.43%). The primary component separating data points (F1) appeared to be the overall strength of the stimulation, as the weakest stimulant (‘Unstim’ samples) clustered nearest to the origin while the overall strongest stimulant (3M-003) clustered furthest to the right. The other component, F2, separated the clusters on the basis of TLR ligand type. Endosomal nucleotide-based TLR ligand (CpG-A and pIC, TLR9 and TLR3, respectively) responses clustered higher on the F2 axis. The synthetic viral ligand 3M-003 (TLR7/8) was near neutrality on the y-axis, while cell surface and cytoplasmic TLR ligand (TLR2/1, TLR4, and NOD) responses clustered lower down. Samples taken at birth contributed to more of the observed variability in cytokine responses (Figure 2, closed circles of all colour) compared with those of 1- and 2-yr-old infants (Figure 2, opened triangles and squares of all colour). Notably, the largest contribution to variation in cytokine production seen at birth was contributed by responses to TLR7/8 (3M-003) (Figure 2, red closed circles). For further clarification, eigenvectors presented in the supplementary material showed the particular correlations of individual cytokines to the ordination of the PCA presented in Figure 2, that were age-specific (Supplementary Figure 1) and TLR ligand-specific (Supplementary Figure 2). Endosomal nucleotide-based TLR-driven clusters were largely composed of intracellular pathogen response cytokines (IFN-α, IP-10), while the cell-surface TLR- and NOD-driven clusters were composed of the Th1 and pro-inflammatory cytokines (TNF-α, IL-1β, IFN-γ, IL-12, etc.) (Supplementary Figure 1). The observed patterns were consistent with the known function of PRRs. For example, endosomal PRRs, TLRs 3 and 9, recognize intracellular pathogens and their activation leads to the production of innate cytokines supporting cell-mediated Th1-type immunity (i.e. IFN-α, IP-10).
Biologically relevant clustering of TLR ligand-stimulated mononuclear cells. CA ordination (nine dimensions) for all TLR ligands used and all cytokine analyzed (all age groups). The primary component separating data points (F1) corresponded to the overall strength of the stimulation, as the weakest stimulant (‘Unstim’) clustered nearest to the origin, while the overall strongest stimulant (3M-003) clustered furthest to the right. The other component, F2, separated the clusters on the basis of TLR. Contribution of each cytokine for a specific TLR stimulation and age were analyzed using Microsoft® Excel 2000/XLSTAT©-Pro (Version 7.5.2, 2004, Addinsoft, Inc., Brooklyn, NY, USA). The data were plotted using R statistical software. Each colour represents a ligand, while each dot represents one subject. We coded each dot for visualization: 3M003 (red), CpG-A (orange), pIC (blue), LPS (yellow), PAM (green) and Unstim (purple); and samples taken at birth (closed circle), yr 1 (triangle) and yr 2 (square).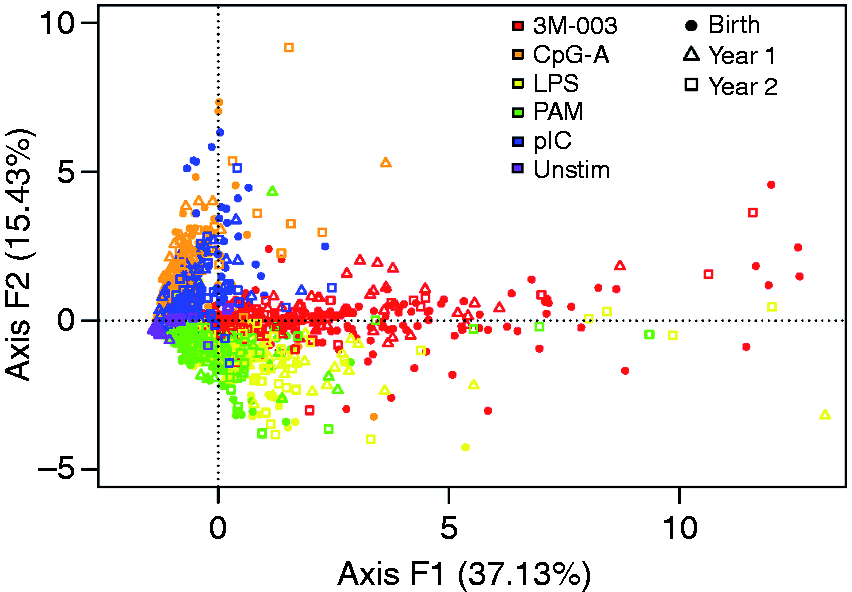
Racial differences in cytokine responses at birth waned by 2 yr of age
Among the 54 stimulation/cytokine combinations analyzed using PCA, nine cytokines were produced after stimulation with 3M-003 (TLR7/8 ligand), six after CpG ODN 2336 (TLR9 ligand), six after poly (I:C) (TLR3 ligand) and six after LPS (TLR4 ligand). PAM (TLR2 ligand) and Unstim were at the level of detection limit; thus, we did not include these two conditions in our subsequent analysis (Figure 3a–d).
Significant differences in cytokine production at birth disappeared with age. Cord blood mononuclear cells or peripheral blood mononuclear cells were stimulated with TLR ligands (a, 3M003; b, CpG; c, LPS; d, pIC) for 18 h and supernatants were harvested to determine cytokine production by Luminex assay. The number of subjects at each time point for each group is described in Table 1. For comparing cytokine production between race at each age group, we used an unpaired t-test with Welch's correction; significance was assessed after performing a post-test Bonferroni correction (* and ** represent statistical significance after Bonferroni's correction for P-values <0.01 and 0.001, respectively). Data presented as mean +/− SEM (at birth, n = 113; at yr 1, n = 44; at yr 2, n = 58).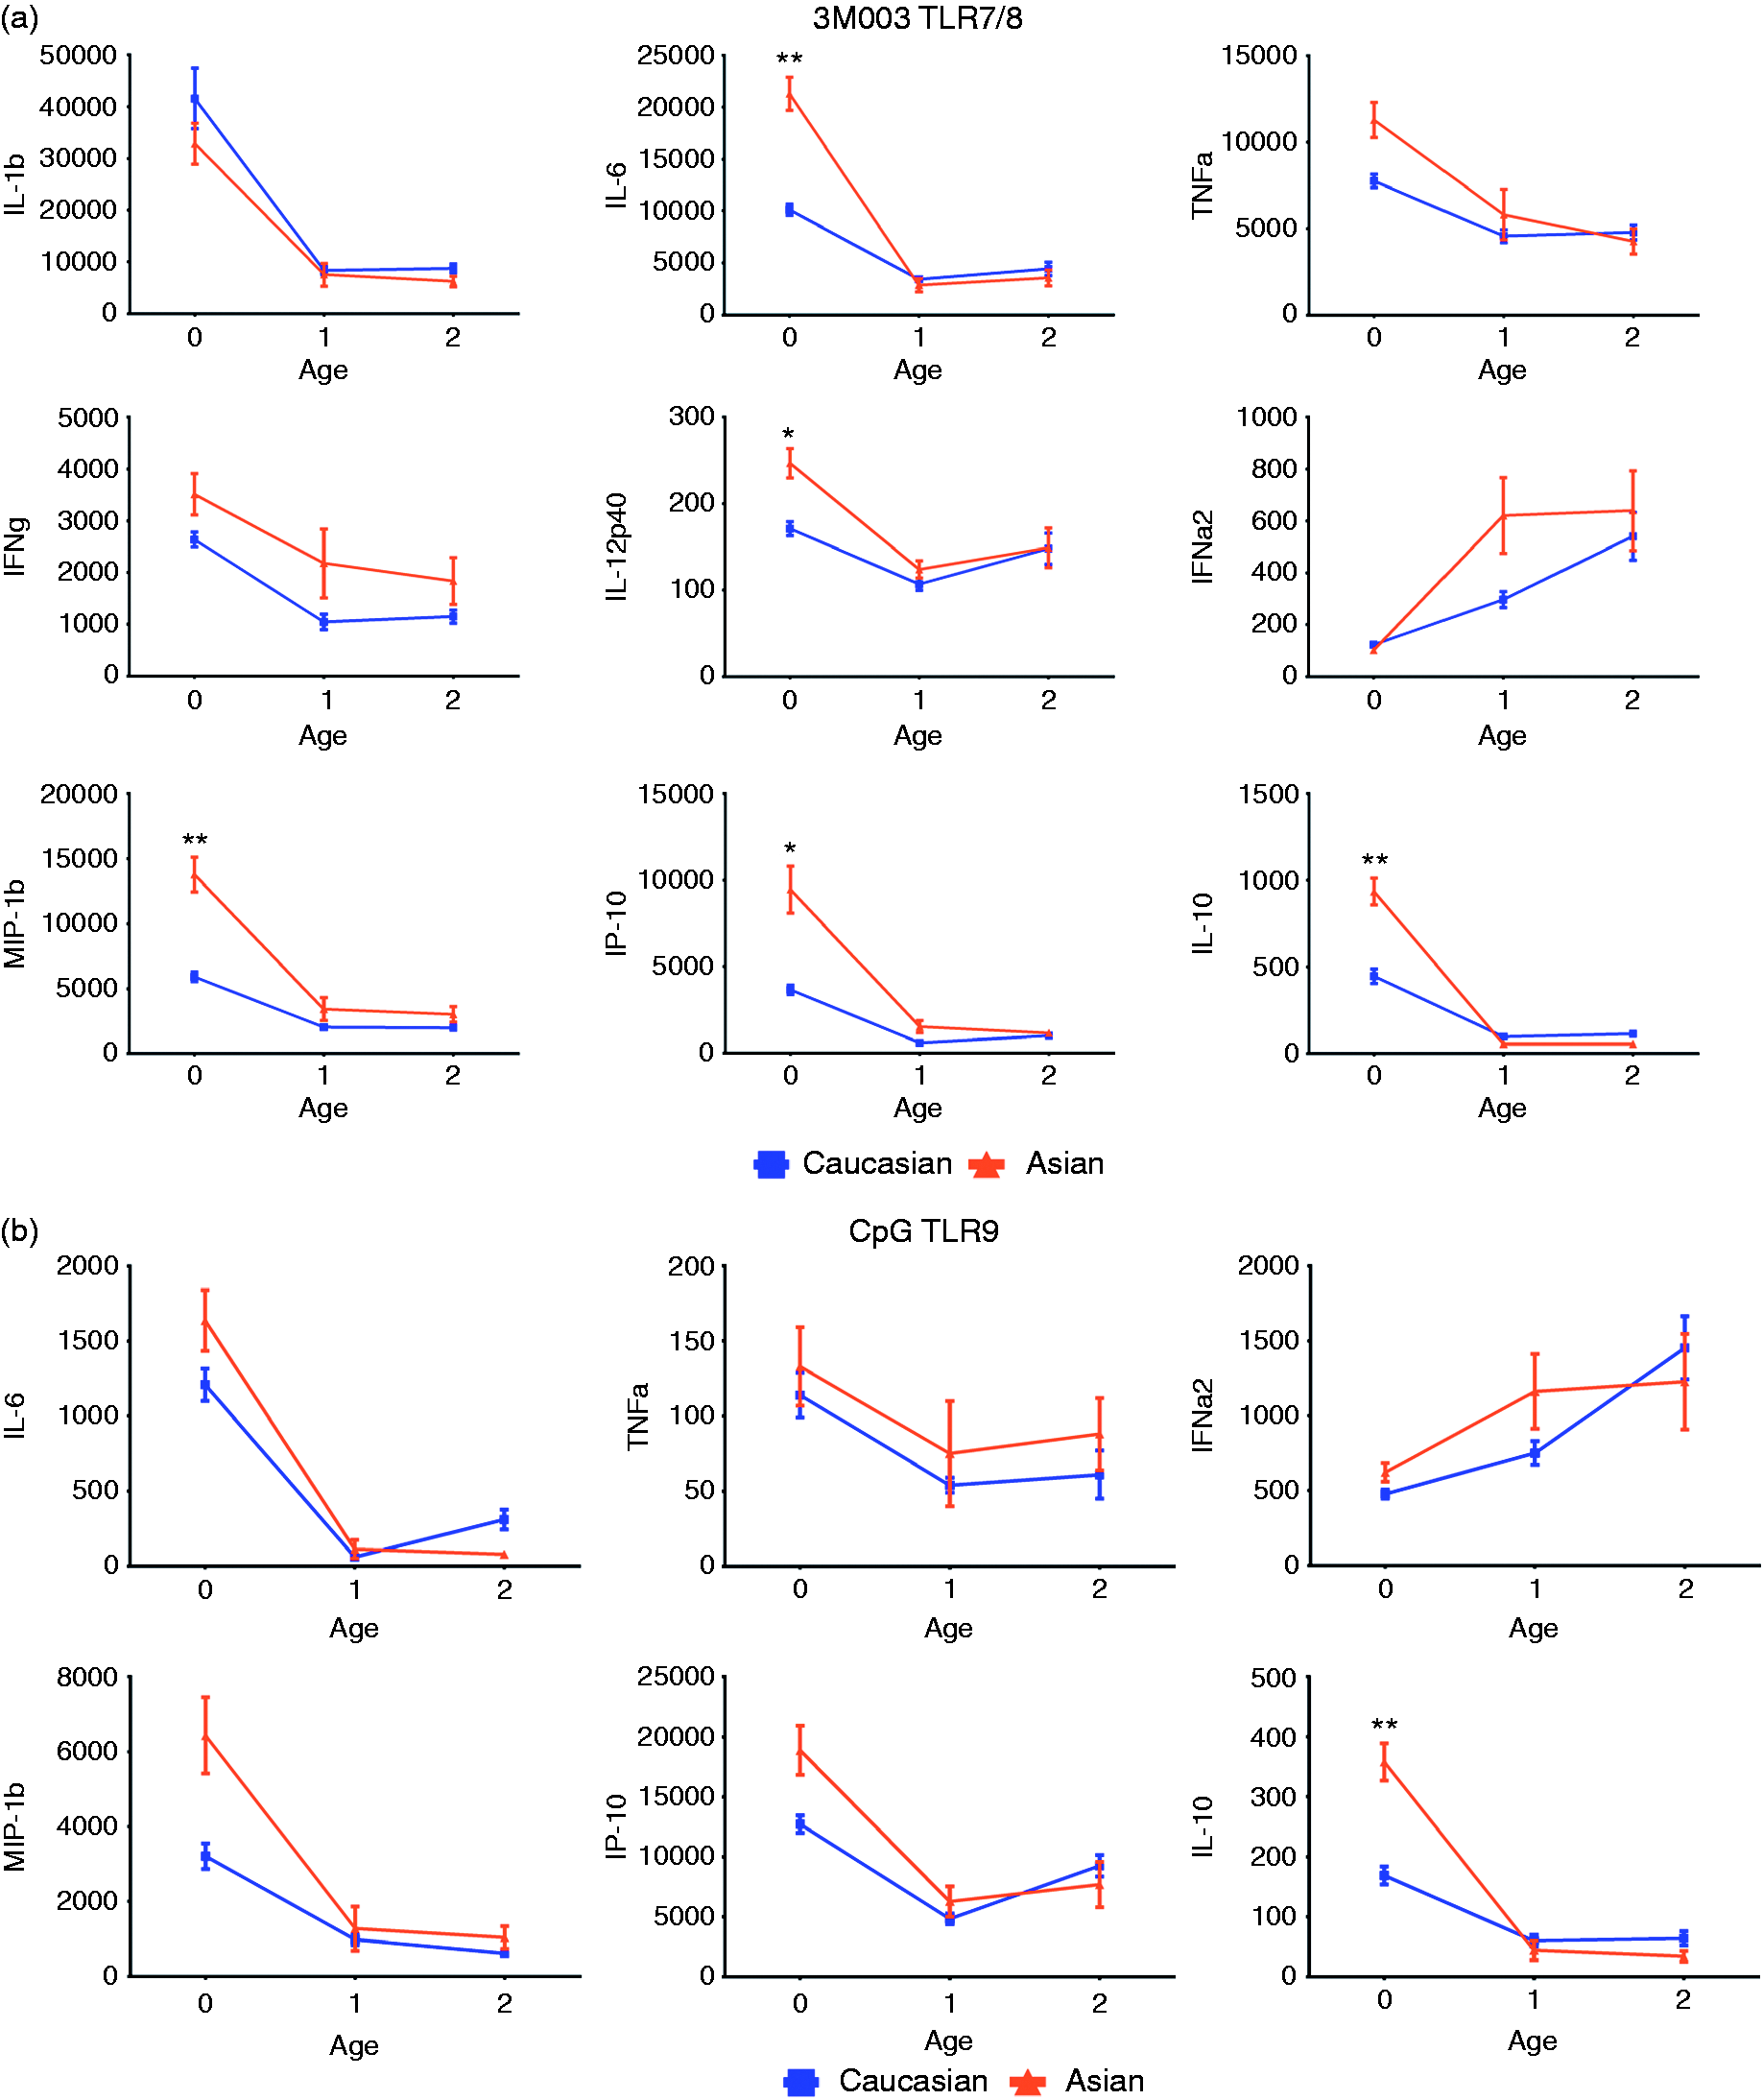
For 3M-003 (Figure 3a), cytokine levels were high at birth, decreased to low by yr 1, and remained low at yr 2 in both racial groups. The observation was true for all cytokines, except IFN-α2, which increased from birth to yr 2. We observed a significant difference between Asian and Caucasian at birth for IL-6, IL-12p40, MIP-1β, IP-10 and IL-10 levels, in which Asian newborns consistently exhibited higher production. However, by yr 1 these differences in cytokine production between the two races disappeared and remained similar at yr 2. Levels of IL-1β, IFN-γ, TNF-α and IFN-α2 were not significantly different between races at any time point. For CpG (Figure 3b), cytokine levels were high at birth and decreased to low by yr 1, and remained at comparably low levels at yr 2 between both racial groups. IFN-α2 increased from birth to yr 2. Despite visible trends for MIP-1β and IP-10, only IL-10 production was significantly higher in Asians at birth. Again, IL-10 levels became similar in both racial groups by yr 1 and remained similar at yr 2. For LPS (Figure 3c), IL-1β, TNF-α and IFN-γ production increased from birth to yr 1, and levels remained high by yr 2 in both racial groups. However, MIP-1β and IP-10 decreased from high at birth to low levels by yr 1, and remained low at yr 2. IL-1β levels at birth were the only significant difference between Caucasians and Asians for LPS induced cytokines. For pIC (Figure 3d), IL-6, MIP-1β, IP-10 and IL-10 decreased from birth to yr 1, and remained low by yr 2 in both racial groups. IFN-γ started high and reached the lowest production by yr 1, but increased again to about half way of birth levels at yr 2, in both racial groups. IP-10 production in response to pIC at birth was the only significant difference observed between Caucasians and Asians.
A summary of the significant changes in cytokine production is presented in Figure 4. The core density distribution of the cytokine production in each racial group did not overlap (Supplementary Figure 3), which indicated that differences in cytokine production between the two groups were not likely due to a subset of samples with extreme values (i.e. outliers).
Summary of cytokine differently produced between subjects of Caucasian and Asian race over time. The number of cytokine (x-axis) that exhibit significant increased in production after in vitro stimulation is highlighted (only samples taken at birth are shown) for the four major TLR ligands studied. Orange bars denote that subject with Asian race produced more cytokines. Blue bars denote that Caucasian produced more cytokines.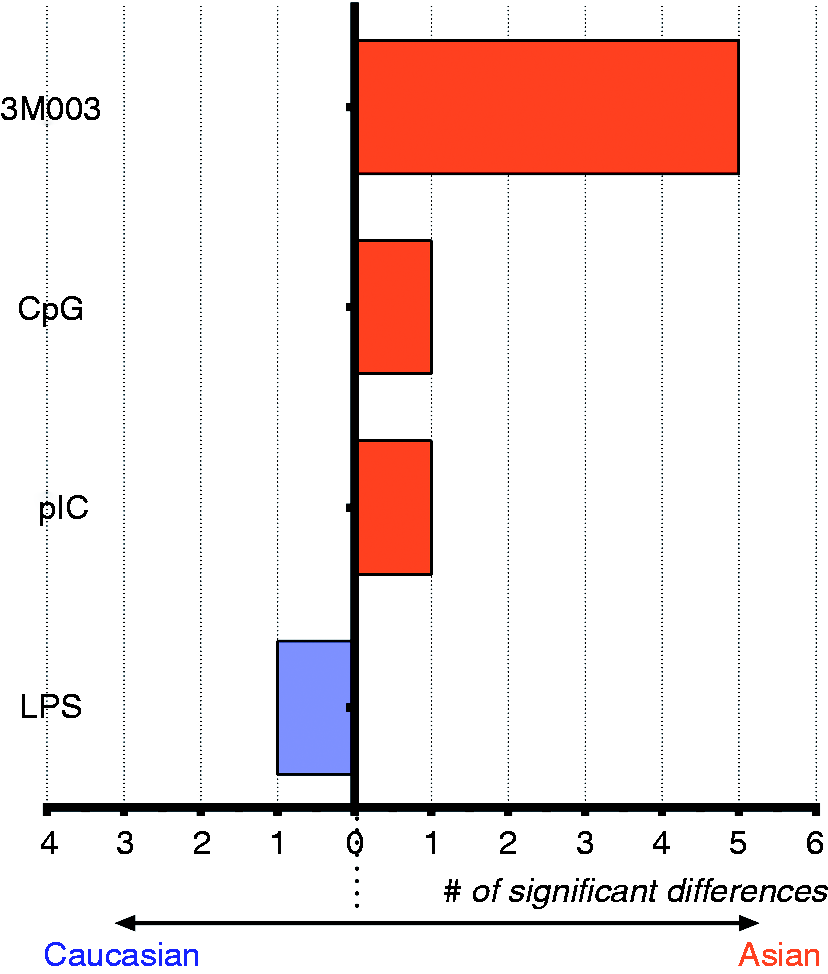
Discussion
To our knowledge, this is the first study to examine the longitudinal response to innate immune response following TLR stimulation in infants across two distinct racial groups growing up in the same environment. Innate immune responses are the first line of immune defence, provide immediate effector function and instruct the ensuing adaptive immune responses. Ongoing efforts to decipher the underlying mechanisms directing the ontogeny of the innate immune system aim to eventually improve early life protective immunity.8,9
In our previous work, we analyzed innate immune responses following in vitro TLR stimulation of cord blood, in a stringently controlled (healthy pregnancy, birth mode and geographical location) cohort of newborns.9,15,19 We found that while sex of the newborn had no significant effect on cytokine or chemokine production, race resulted in clearly distinct levels of cytokine at birth. 11 We confirmed race-based differences in cytokine responses in our current larger study. Importantly, we extended our analysis to contrast cytokine production between racial groups longitudinally over yr 1 and 2 of life. This allowed us to investigate the effect of environment/geography as a ‘modifier’ of innate immune responses by selecting infants of different racial background that were raised in the same city. Our results suggest a profound ‘equalizing’ influence of common environmental factors on innate immune responses early in life. Specifically, while we observed significant cytokine production difference between races at birth, these differences disappeared by yr 1–2 (Figure 3). We also assessed if individuals with the highest response at birth were also among the highest producers by yr 1 and 2 (‘elite responders’). To this end, we plotted each individual for each cytokine. However, we did not observe a consistent trend (data not shown).
Variation in immune responses can be related to intrinsic (genetic) or extrinsic (environment) factors. The interplay between these two factors is certainly of great importance in defining immune response profiles. Genetic differences have been shown to influence innate immune status not only in our previous study, but also in other studies contrasting different ethnic and racial groups across various regions of the world.20,21 However, to our knowledge, our study is the first to contrast the influence of genetic heritage on innate immune ontogeny longitudinally across the first 2 yr of life for infants growing up in the same geographical environment. In contrast to our previous findings of racially and genetically based differences driving variation in innate immune responses to TLR stimulation at birth, our current data strongly implicate environment as the main driver of post-natal innate immune ontogeny.
Our study has several limitations. While the TLR-location and cytokine-function based clustering of our data suggests functional relevance, we have not performed experiments to confirm such relevance in this study. Nevertheless, both the recapitulation of innate immune response ontogeny from birth up to 2 yr of age and the clustering of responses based on cellular location of the TLR strongly support the biological validity of our data (i.e. the immune response observed is consistent with previously published data and biologically relevant).8,9,18 While our statistical approach provided a stringent assessment of cytokine production for our study parameters, (e.g. Welch’s correction for uneven distribution of study subjects between groups), a higher number of subjects in each age and racial group would certainly have helped ascertain if the other trends observed also would reach significance. We contrasted race as a proxy for genetic differences as it was previously reported. 11 However, analysis of genotype of our subjects would have been necessary to unequivocally identify specific genetic determinants associated with cytokine levels. Additionally, we compared only two racial groups; it would be of interest to assess the cytokine responses of other racial groups growing up in the same environment; this would help delineate how broadly our findings can be applied to the overall population. We measured cytokine concentrations at birth, yr 1 and yr 2. The precise time at which the environmental factors exert their equalizing effect is unknown; at best, our findings indicated that by yr 1 all infants studied responded comparably. It is possible that the equalizing effect of environment could be seen at different times among infants based on early life exposure to unique immune modulators. This raises the question: would timing of the equalizing effects have an impact on the susceptibility of an infant to infection or response to vaccines? Monitoring cytokine responses at closer time intervals could shed light on the kinetics of innate response-changes in a specific population. This could be particularly relevant for the implementation of active immunization strategies in early life.
Conclusion
Several differences in innate cytokine responses to PRR stimulation exist at birth between infants of Asian vs. Caucasian descent. However, after 1–2 yr of living in the same geographical environment, the differences disappeared and innate immune responses became more similar among all infants studied. The convergence suggests a strong environmental influence on innate immune ontogeny in early life.
Supplemental Material
Supplemental material for Environment impacts innate immune ontogeny
Supplemental Material for Environment impacts innate immune ontogeny by Mathieu Garand, Bing Cai and Tobias R Kollmann in Innate Immunity
Footnotes
Acknowledgements
We would like to thank the participants and their parents, as well as the entire staff of the Vaccine Evaluation Centre of the University of British Columbia for this work.
Declaration of Conflicting Interests
The author(s) declared no potential conflicts of interest with respect to the research, authorship, and/or publication of this article.
Funding
The author(s) disclosed receipt of the following financial support for the research, authorship, and/or publication of this article: This work was supported in part by a National Institute of Allergy and Infectious Diseases, National Institutes of Health Grant number: N01 AI50023 (http://www.nih.gov). TRK is supported in part by a Career Award from the Michael Smith Foundation for Health Research (![]() ). The funders had no role in study design, data collection and analysis, decision to publish, or preparation of the manuscript.
). The funders had no role in study design, data collection and analysis, decision to publish, or preparation of the manuscript.
References
Supplementary Material
Please find the following supplemental material available below.
For Open Access articles published under a Creative Commons License, all supplemental material carries the same license as the article it is associated with.
For non-Open Access articles published, all supplemental material carries a non-exclusive license, and permission requests for re-use of supplemental material or any part of supplemental material shall be sent directly to the copyright owner as specified in the copyright notice associated with the article.