
Abstract
ICAM-1 can be induced by inflammatory cytokines such as IFN-γ and TNF-α. This study investigated whether autophagy regulates ICAM-1 given that autophagy facilitates signaling of these two cytokines. Exogenous IFN-γ induced ICAM-1 in human lung epithelial A549 cells carrying wild type p53, a transcription factor reported for ICAM-1, but not in PC14PE6/AS2 (AS2) cells carrying mutated p53. However, IFN-γ also induced ICAM-1 in A549 cells with short hairpin RNA-silenced p53. No changes in IFN-γ receptor expression were observed in AS2 cells, but IFN-γ-activated Jak2/STAT1/IFN regulatory factor 1 was markedly decreased. In AS2 cells, increased levels of reactive oxygen species induced the activation of Src homology domain-containing phosphatase 2 (SHP2), while SHP2 was essential for IFN-γ resistance. AS2 cells showed autophagy resistance, and the manipulation of the autophagy pathway altered IFN-γ resistance. Aberrant Bcl-2 expression and mammalian target of rapamycin activation contributed to both autophagy resistance and IFN-γ resistance. Autophagy, but not p53, also modulated TNF-α-induced NF-κB activation and ICAM-1 expression. Inhibiting autophagy decreased the adhesion of human monocytic U937 cells to IFN-γ-treated A549 cells. These results demonstrated that IFN-γ and TNF-α induced ICAM-1 expression through a common pathway that was regulated by autophagy, but not p53.
Introduction
An increase in ICAM-1 (CD54), which binds LFA-1 (CD11a/CD18) and Mac-1 (CD11b/CD18), is essential for the adhesion of leukocytes to inflamed tissues during inflammation.1,2 In addition to its expression in endothelial cells, ICAM-1 may also be expressed in a variety of other cells, including antigen-presenting cells, fibroblasts and keratinocytes, and a variety of cancers, including melanoma and gastric, breast, lung and other epithelial-derived cancers. ICAM-1 promotes cell–leukocyte interactions, and mediates cell migration itself through interactions with fibrinogen and hyaluronan. 3 The pro-inflammatory cytokines IFN-γ and TNF-α generally induce ICAM-1 expression by activating the Jak2/STAT1 and NF-κB signaling cascades respectively.4,5 Additionally, transcription factor p53 has recently been shown to regulate ICAM-1 mRNA independently of NF-κB. 6 However, it is unclear whether p53 also plays a role in regulating cytokine-induced ICAM-1 expression because p53 is up-regulated through IFN-γ and TNF-α stimulation.7,8
Autophagy, a cellular process involving the formation of autophagosomes that fuse with lysosomes to form an autolysosome, acts as a homeostatic mechanism that degrades aggregated proteins, damaged organelles and invading pathogens.9–11 The autophagic process facilitates cell survival and death, embryonic development, neurodegeneration and immune regulation. In its direct role in host immunity against pathogens, autophagy acts primarily in pathogen recognition and induces intracellular defense mechanisms by promoting microbial digestion within autolysosomes.10–12 During infection, indirect immune regulation by autophagy is essential for the activation of pattern recognition receptors prior to the induction of an antiviral IFN response, MHC class I and II presentation, and dendritic cell activation.12–14 In addition to type I IFN, autophagy can regulate the expression of IL-1, IL-18, and TNF-α.15–18 The regulation of cytokine expression by autophagy is therefore induced by pro-inflammatory stimuli and is involved in cytokine signaling, particularly in the activation of TLRs and the inflammasome through reactive oxygen species (ROS) generation and the release of mitochondrial DNA.16,17,19 For immunoregulation, some cytokines, including IL-1β, IL-2, IL-6, IFN-γ and TNF-α, are known to trigger autophagy, 15 and some are shown to inhibit it, including IL-4, IL-13 and IL-10.15,20–22 In studies of cytokine-induced autophagy, IFN-γ signaling has been well investigated because inducible autophagy is important in IFN-γ-mediated antibacterial defense.15,23,24 Notably, immunity-related GTPases, such as Irgm1 and IFN-γ-inducible 65-ku guanylate-binding protein, endoplasmic reticulum stress-activated ATF6 and p38 MAPK, are critical for IFN-γ-induced autophagy, as well as the bioactivities of IFN-γ.11,23–28
Autophagy has also been associated with numerous cytokine signaling pathways.15,29–31 IFN-γ-induced autophagy not only enhances intracellular microbial clearance and immune activation23,24 but also facilitates downstream Jak2/STAT1 signaling by regulating the ROS-sensitive protein Src homology domain-containing phosphatase 2 (SHP2), but not suppressor of cytokine signaling 1 (SOCS1) or SOCS3, which are negative regulators of IFN-γ signaling.29,30 SHP2 activation can negatively regulate Jak2/STAT1 signaling through protein dephosphorylation.32–34 The regulation of SHP2 by IFN-γ has been proposed to involve negative regulation by glycogen synthase kinase-3 and positive regulation by ROS.29,30,35 In addition to IFN-γ, TNF-α triggers autophagy to facilitate MHC II expression 36 and the long-term control of NF-κB activation by mediating IκB degradation.31,37 Autophagy is speculated to be important for cytokine signaling. In this study, we found that in both epithelial and endothelial cells, the exogenous pro-inflammatory cytokines IFN-γ and TNF-α induced ICAM-1 expression in an autophagy-regulated manner, independently of p53. We further investigated the potential mechanisms that cause autophagy resistance and defects in the IFN-γ/Jak2/STAT1 and TNF-α/IκB/NF-κB signaling pathways, as well as in cytokine-induced ICAM-1 expression.
Materials and methods
Cell culture
The human lung epithelial adenocarcinoma cell line PC14PE6/AS2 (AS2) was established from ascites generated from PC14PE6 cells (a gift from Isaiah J. Fidler, MD Anderson Cancer Center, Houston, TX, USA) in nude mice.38,39 AS2 and human lung epithelial adenocarcinoma A549 cells were routinely grown on plastic in DMEM (Gibco-BRL, Grand Island, NY, USA) with
Reagents and Abs
The reagents used were cisplatin, the antioxidant N-acetyl-cysteine (NAC), the autophagy inhibitor 3-methyladenine (3-MA), the mammalian target of rapamycin (mTOR) inhibitor rapamycin, the Jak2 inhibitor AG490, the NF-κB inhibitor caffeic acid phenethyl ester (CAPE) (Sigma-Aldrich), and the recombinant human cytokines IFN-γ and TNF-α (PeproTech, Rocky Hill, NJ, USA). No drug treatments used in this study caused cell cytotoxicity. The Abs used included those generated in rabbits and directed against human ICAM-1 (85–115 ku), p53, p21, Jak2 Tyr1007/1008, Jak2, STAT1α/β Tyr701, STAT1α/β, IFN regulatory factor (IRF) 1, SHP2 Tyr542, SHP2, SOCS1, SOCS3, Akt Ser473, Akt, p70S6K Thr389, p70S6K, glycogen synthase kinase (GSK)-3α/β Ser21/9, GSK-3α/β, ERK1/2 Thr202/Tyr204, ERK1/2, phosphatase and tensin homolog deleted on chromosome 10 (PTEN), Bcl-2 and Bcl-xL (Cell Signaling Technology, Beverly, MA, USA); an anti-mouse ICAM-1 mAb (BD Biosciences, San Jose, CA, USA); Abs against mTOR, IFN-γ receptor (IFNGR) 1, IFNGR2, TNF-α receptor (TNFR) 1 and TNFR2 (Abcam, Cambridge, MA, USA); anti-GFP (Santa Cruz Biotechnology, Santa Cruz, CA, USA); a mouse mAb specific for β-actin and rabbit anti-mouse autophagy-related gene (Atg) 5 and Beclin 1 (Sigma-Aldrich); and polyclonal anti-rabbit Atg8 (LC3) I/II (MBL International, Woburn, MA, USA). Alexa Fluor 488- and HRP-conjugated goat anti-mouse, goat anti-rabbit, and donkey anti-goat IgG were obtained from Chemicon International (Temecula, CA, USA).
Western blotting
We harvested the cells and lysed them with a buffer containing 1% Triton X-100, 50 mM Tris (pH 7.5), 10 mM EDTA, 0.02% NaN3 and a protease inhibitor mixture (Roche Applied Science, Indianapolis, IN, USA). After they had been freeze–thawed once, the cell lysates were centrifuged at 9000 g for 20 min at 4℃. The supernatants were then collected and boiled in sample buffer for 5 min. After SDS-PAGE, the proteins were transferred to a polyvinylidene fluoride membrane (Millipore, Billerica, MA, USA), blocked in PBS-Tween (PBS plus 0.05% Tween 20) containing 5% skim milk, and probed with primary Abs for 16 h at 4℃. After they had been washed with PBS-T, the blots were incubated with a 1:5000 dilution of HRP-conjugated secondary Ab for 1 h at 4℃. The protein bands were visualized using enhanced chemiluminescence (Pierce, Rockford, IL, USA).
Immunostaining
To detect the expression of ICAM-1, IFNGR1, IFNGR2, TNFR1 and TNFR2, we fixed, stained and analyzed the cells by using flow cytometry analysis as described elsewhere. 40 The cells were stained with primary Abs and then incubated with Alexa Fluor 488-conjugated goat anti-rabbit IgG. Cells were analyzed using flow cytometry (FACSCalibur; BD Biosciences) with excitation set at 488 nm, and emission was detected with the FL-1 channel (515–545 nm). Samples were analyzed using CellQuest Pro 4.0.2 software (BD Biosciences) and quantification was performed using WinMDI 2.8 software (The Scripps Institute, La Jolla, CA, USA). Small cell debris was excluded by gating on a forward scatter plot.
RNA interference
Proteins were down-regulated using lentiviral expression of short hairpin RNA (shRNA) targeting human p53 (clone 1, TRCN0000010814 containing the following shRNA target sequence: 5′-GAGGGATGTTTGGGAGATGTA-3′; and clone 2, TRCN0000003753 containing the following shRNA target sequence: 5′- CGGCGCACAGAGGAAGAGAAT -3′), human SHP2 (TRCN0000005003 containing the following shRNA target sequence: 5′-CGCTAAGAGAACTTAAACTTT-3′), human Atg5 (TRCN0000151963 containing the following shRNA target sequence: 5′- CCTGAACAGAATCATCCTTAA -3′), human Bcl-2 (TRCN0000040069 containing the following shRNA target sequence: 5′-CCGGGAGATAGTGATGAAGTA-3′), human mTOR (TRCN0000038678 containing the following shRNA target sequence: 5′-GCATGGAAGAATACACCTGTA-3′) and a negative control construct (luciferase shRNA, shLuc). shRNA clones were obtained from the National RNAi Core Facility, Institute of Molecular Biology/Genomic Research Center, Academia Sinica, Taipei, Taiwan. Lentiviruses were prepared and cells were infected according to previously described protocols. 29 In brief, AS2 cells were transduced by lentivirus with the appropriate multiplicity of infection in complete growth medium supplemented with polybrene (Sigma-Aldrich). After transduction for 24 h and puromycin (Calbiochem, San Diego, CA, USA) selection for 3 d, protein expression was monitored using Western blot analysis.
ROS detection
Intracellular oxidative stress was measured by dichlorodihydrofluorescein diacetate oxidation. Cells were exposed to 10 µM 5 -(and-6)-chloromethyl-2′,7′-dichlorodihydrofluorescein diacetate, acetyl ester (CM-H2DCFDA) (Invitrogen) for 1 h. The cells were detected with the FL-1 channel (515–545 nm) by FACSCalibur. The data were analyzed using CellQuest Pro 4.0.2 software. Small cell debris was excluded by gating on a forward scatter plot. For image quantification analysis, AS2 cells were treated with NAC (10 mM) for 0.5 h and then co-incubated with CM-H2DCFDA for 1 h. The generation of ROS was detected under a microscope (IX71; Olympus, Tokyo, Japan). To evaluate the intensities of fluorescence, pictures were quantified by using three low-power fields (20 × objective) of each ear section (n = 3 per group) using Image-Pro Plus version 6.0 software (Media Cybernetics, Bethesda, MD, USA).
Plasmid transfection
To monitor autophagosome formation, cells (3 × 10⁴) were transfected with 2 µg of pGFP-C1-LC3 or control vector using TurboFect transfection reagent (Thermo Scientific, Waltham, MA, USA). 29 After IFN-γ or TNF-α treatment, the formation of punctate GFP–LC3 was detected under a microscope (IX71). 4′,6-diamidino-2-phenylindole (Sigma-Aldrich) was used for the nuclear staining. For protein overexpression, transient transfection was performed using an MP-100 Microporator (Digital Biotechnology, Seoul, South Korea) according to the manufacturer’s instructions for optimization and usage. The pEGFP-C1 constructs expressing GFP-Bcl-2 (pEGFP-C1-Bcl-2) 41 were purchased from Addgene (ID NM_000314; Cambridge, MA, USA). After transfection, the cells were cultured for 24 h before the experiments.
Luciferase reporter assay
For the luciferase reporter assay, the cells were transiently co-transfected with the IRF1 or NF-κB promoter-driven luciferase reporter (0.2 µg) and 0.01 µg of Renilla luciferase-expressing plasmid (pRL-TK; Promega, Madison, WI, USA) using the GeneJammer transfection reagent (Stratagene, La Jolla, CA, USA). Twenty-four h after the transfection, the cells were treated with IFN-γ or TNF-α for 1 h, lysed, and then harvested for luciferase and Renilla measurement using a luciferase assay system (Dual-Glo; Promega). For each lysate, the firefly luciferase activity was normalized to the Renilla luciferase activity to assess transfection efficiencies.
Cell adherence assay
A549 cells (5 × 10⁴ cells/well) were plated into 96-well culture plates and the cell adherence assay was performed as described elsewhere. 42 When the monolayers reached confluency, the cells were stimulated with IFN-γ in culture medium. After 24 h of incubation, the cells were washed once with medium, stained with SYTO 60 red fluorescent nucleic acid stain (Invitrogen) according to the manufacturer’s instructions, and incubated for 1 h at 37℃ with U937 cells (1 × 10⁵ cells/well), which were pre-stained with 10 µg/ml of Hoechst 33258 (Sigma-Aldrich), in a total volume of 200 µl/well. At the end of the incubation period, the non-adherent cells were removed by washing twice with 0.1% BSA in PBS. The morphology of cell growth was visualized using a microscope (IX71). The adherent cells were counted in three consecutive microscopic fields.
Statistical analysis
Values are means ± SD. Groups were compared using Student’s two-tailed unpaired t-test (SigmaPlot 8.0 for Windows; Systat Software, San Jose, CA, USA). Statistical significance was set at P < 0.05.
Results
Exogenous IFN-γ induces p53-independent ICAM-1 expression in human lung epithelial cells
Physiological stress can induce p53-regulated ICAM-1 expression through transcriptional regulation.
6
However, the role of p53 in pro-inflammatory cytokine-induced ICAM-1 expression is unclear. To address this issue, p53 wild type A549 cells and AS2 cells carrying a natural p53 mutation (R248W) with disrupted function
39
were examined in this study. Western blotting showed that exogenous administration of cisplatin, a p53-inducing DNA damage agent,
39
caused an increase in p53 expression followed by p21 expression in A549 cells, but not in AS2 cells, although the mutated p53 was expressed in the AS2 cells (Figure 1A). In IFN-γ-treated A549 cells, an increase in ICAM-1 expression was demonstrated by Western blotting (Figure 1B) and immunostaining followed by flow cytometry (Figure 1C), suggesting a possible role for p53 in IFN-γ-induced ICAM-1 expression; these phenomena were not observed in AS2 cells. To further confirm the role of p53, we used a lentivirus-based shRNA approach to knock down p53 in A549 cells, as confirmed by cisplatin stimulation (Figure 1D). However, Western blotting (Figure 1E) and immunostaining (Figure 1F) showed that silencing p53 did not affect IFN-γ-induced ICAM-1 expression. These results demonstrate that p53 is not required for the induction of ICAM-1 expression by IFN-γ, but the mechanism underlying the IFN-γ resistance in AS2 cells remains unclear.
IFN-γ induces ICAM-1 expression independently of p53. (A) Human lung epithelial A549 and AS2 cells were treated with cisplatin (20 µM) for 24 h. Western blotting was used to measure the expression of p53 and p21. (B) A549 and AS2 cells were treated with IFN-γ (10 ng/ml). Western blotting was used to evaluate the expression of ICAM-1 (85–115 kDa) over time. (C) Immunostaining followed by flow cytometry was used to detect the surface expression of ICAM-1 at 24 h post-treatment with IFN-γ (10 ng/ml) in the indicated cells. Lentivirus-based shRNAs targeting luciferase (shLuc as a control) and p53 (clones shp53-1 and shp53-2) were used to silence p53 expression in A549 cells. Transfected cells were treated with cisplatin (20 µM) or IFN-γ (10 ng/ml) for 24 h. Western blot analysis was used to measure the expression of p53 (D) and ICAM-1 (E). Immunostaining followed by flow cytometry was used to determine the surface expression of ICAM-1 in shLuc- or shp53-2-transfected A549 cells (F). For Western blotting, β-actin was used as the internal control. The data shown are representative of three individual experiments. The negative control for all flow cytometry analyses was PBS treatment. Each histogram is representative of three individual experiments. 2nd: secondary Ab.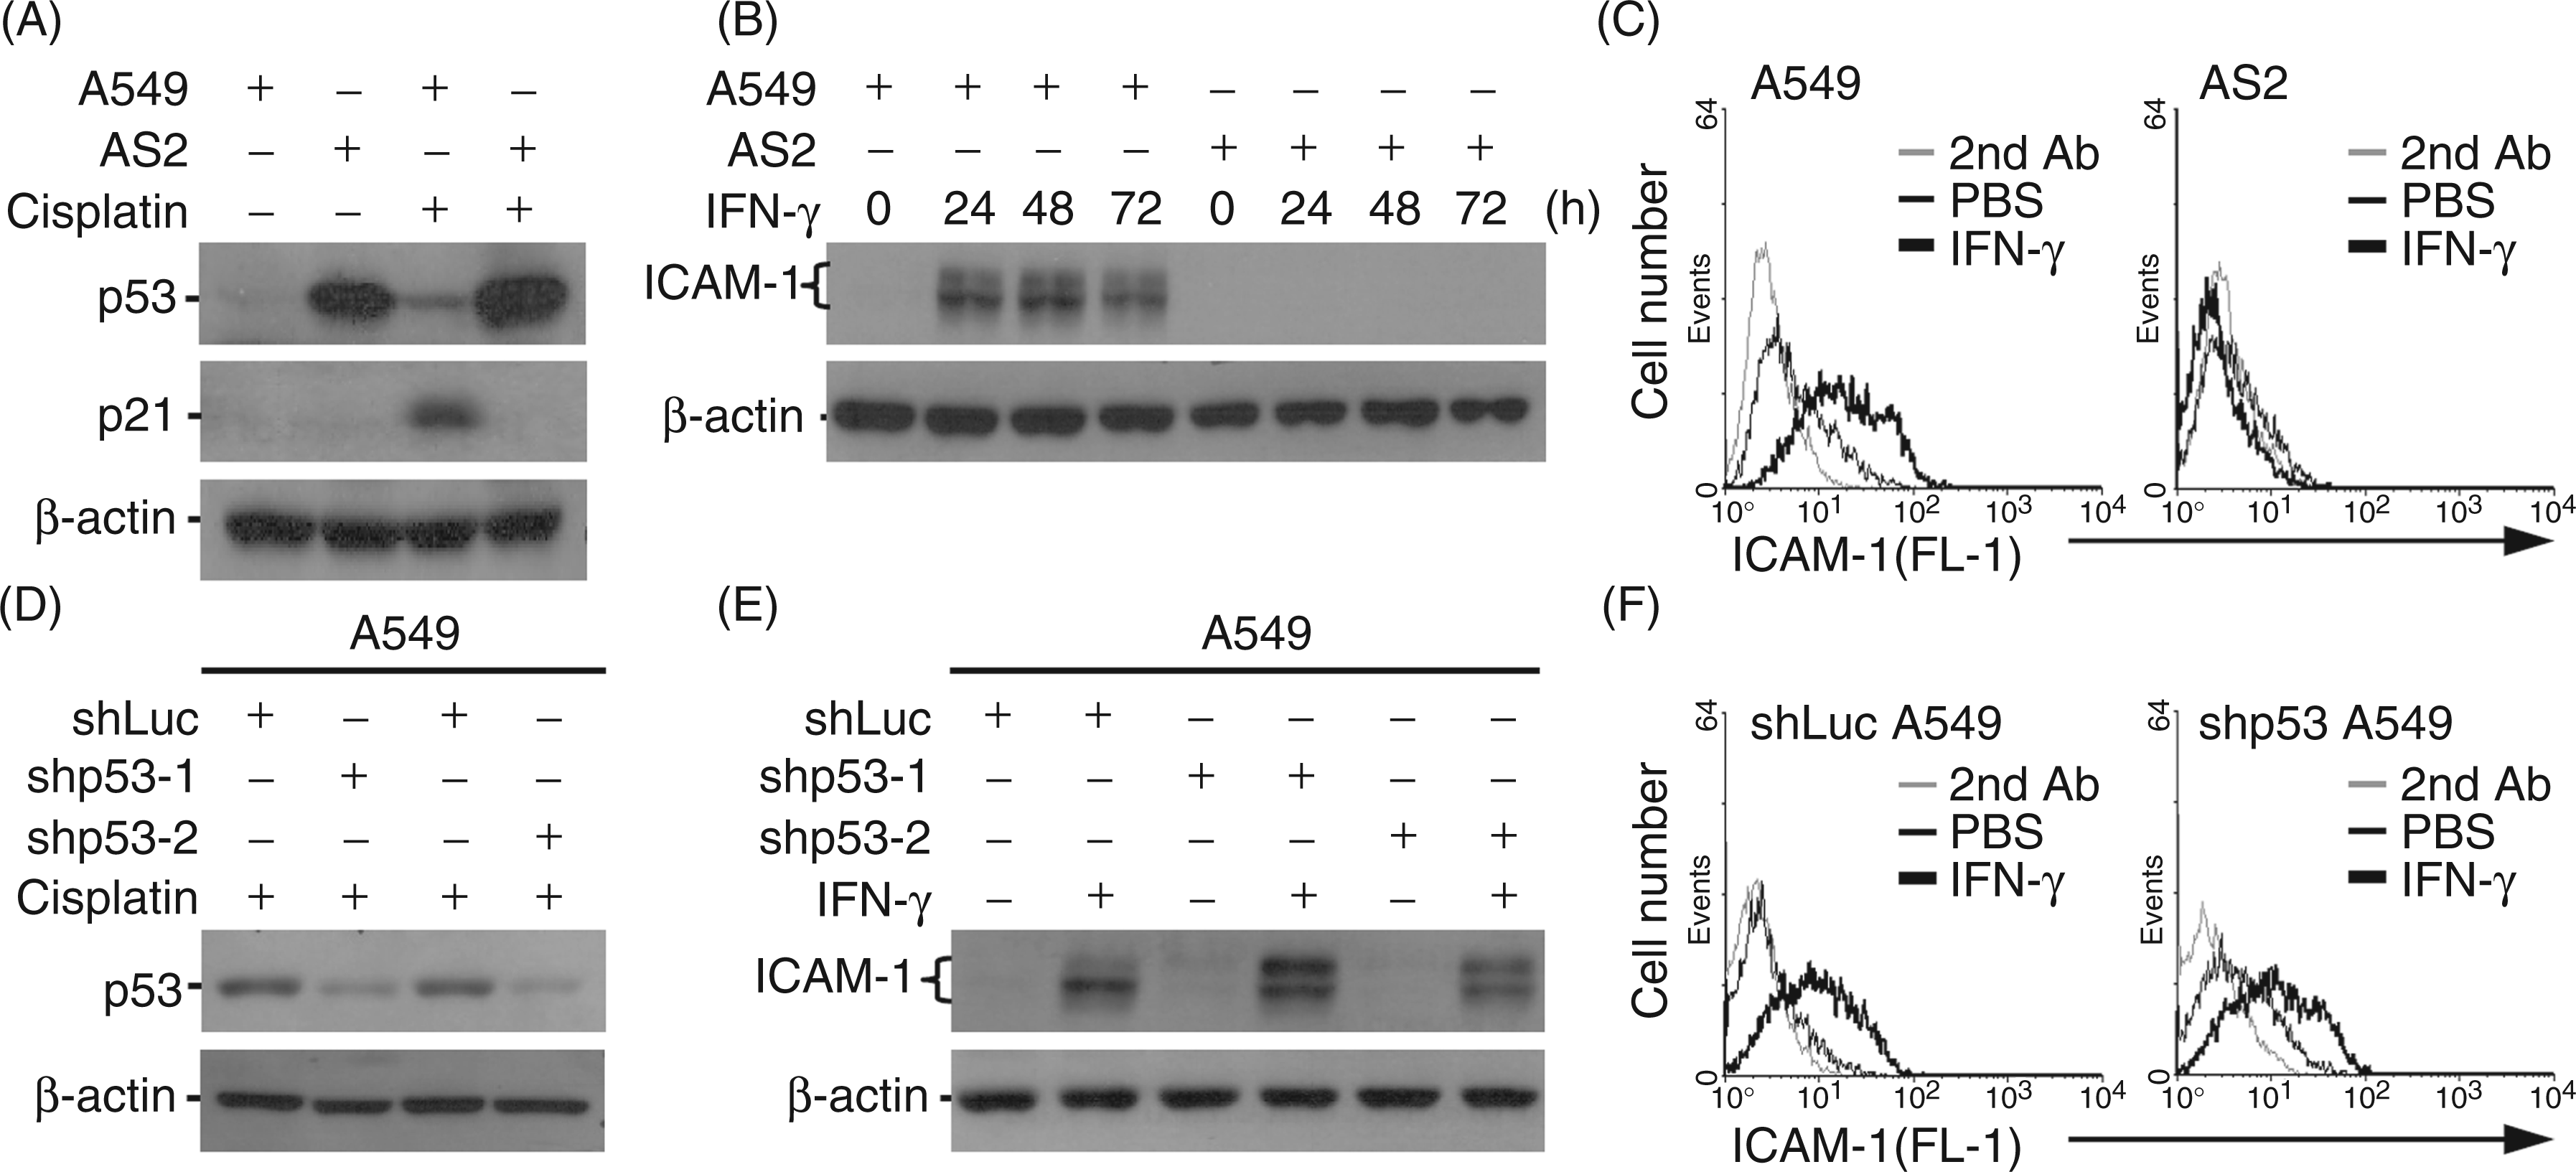
AS2 cells, but not A549 cells, are resistant to IFN-γ signaling
To investigate the possible mechanisms underlying IFN-γ resistance in AS2 cells, we evaluated the activity of the IFN-γ/IFNGRs/Jak2/STAT1/IRF1 signaling axis, which is required for IFN-γ-induced ICAM-1 expression.
33
Immunostaining followed by flow cytometry demonstrated no differences in the expression of IFN-γ receptors, including IFNGR1 and IFNGR2, between A549, AS2 and A549 cells with shRNA-mediated p53 silencing (Figure 2A). Notably, Western blotting showed that IFN-γ failed to cause Jak2 phosphorylation, STAT1 phosphorylation or IRF1 expression in AS2 cells compared with A549 cells (Figure 2B). Additionally, STAT1 phosphorylation was not affected by inhibiting p53 in A549 cells (Figure 2C). The luciferase-based promoter assay showed that IFN-γ caused significant (P < 0.01) IRF1 transactivation in A549, but not AS2 cells (Figure 2D). Again, however, IRF1 transactivation was not affected by p53 silencing in A549 cells. The pharmacological inhibition of Jak2 using AG490 led to decreased ICAM-1 expression in IFN-γ-treated A549 cells, confirming an important role for Jak2 signaling (Figure 2E). These results show that defective IFN-γ signaling leads to the inhibition of ICAM-1 expression in AS2 cells independent of p53.
IFN-γ fails to activate Jak2/STAT1/IRF1 signaling in AS2 cells. (A) Immunostaining followed by flow cytometry was used to measure the surface expression of IFNGR1 and IFNGR2 in A549, AS2, and shLuc- or shp53-2-transfected A549 cells. Each histogram is representative of three individual experiments. Western blot analysis was used to measure the expression of Jak2 Tyr1007/1008 (pJak2), Jak2, STAT1α/β Tyr701 (pSTAT1α/β), STAT1α/β, and IRF-1 in IFN-γ (10 ng/ml)-treated A549 and AS2 cells over time (B) and the expression of STAT1α/β Tyr701 (pSTAT1α/β) and STAT1α/β in shLuc- or shp53-2-transfected A549 cells treated with IFN-γ (10 ng/ml) for 1 h (C). (D) The luciferase reporter assay showed the transactivation ratio of IRF-1 to Renilla in the indicated cells, which were treated with IFN-γ for 1 h. PBS treatment was used as the negative control. The data shown are the mean ± SD obtained from repeated experiments. **P < 0.01 compared with PBS. #P < 0.05 compared with A549. (E) Western blotting was used to measure the expression of ICAM-1 in A549 cells treated with IFN-γ (10 ng/ml) for 24 h following pre-treatment with the Jak2 inhibitor AG490 (10 µM). β-actin was used as the internal control. The data shown are representative of three individual experiments. 2nd: secondary Ab; ns: not significant.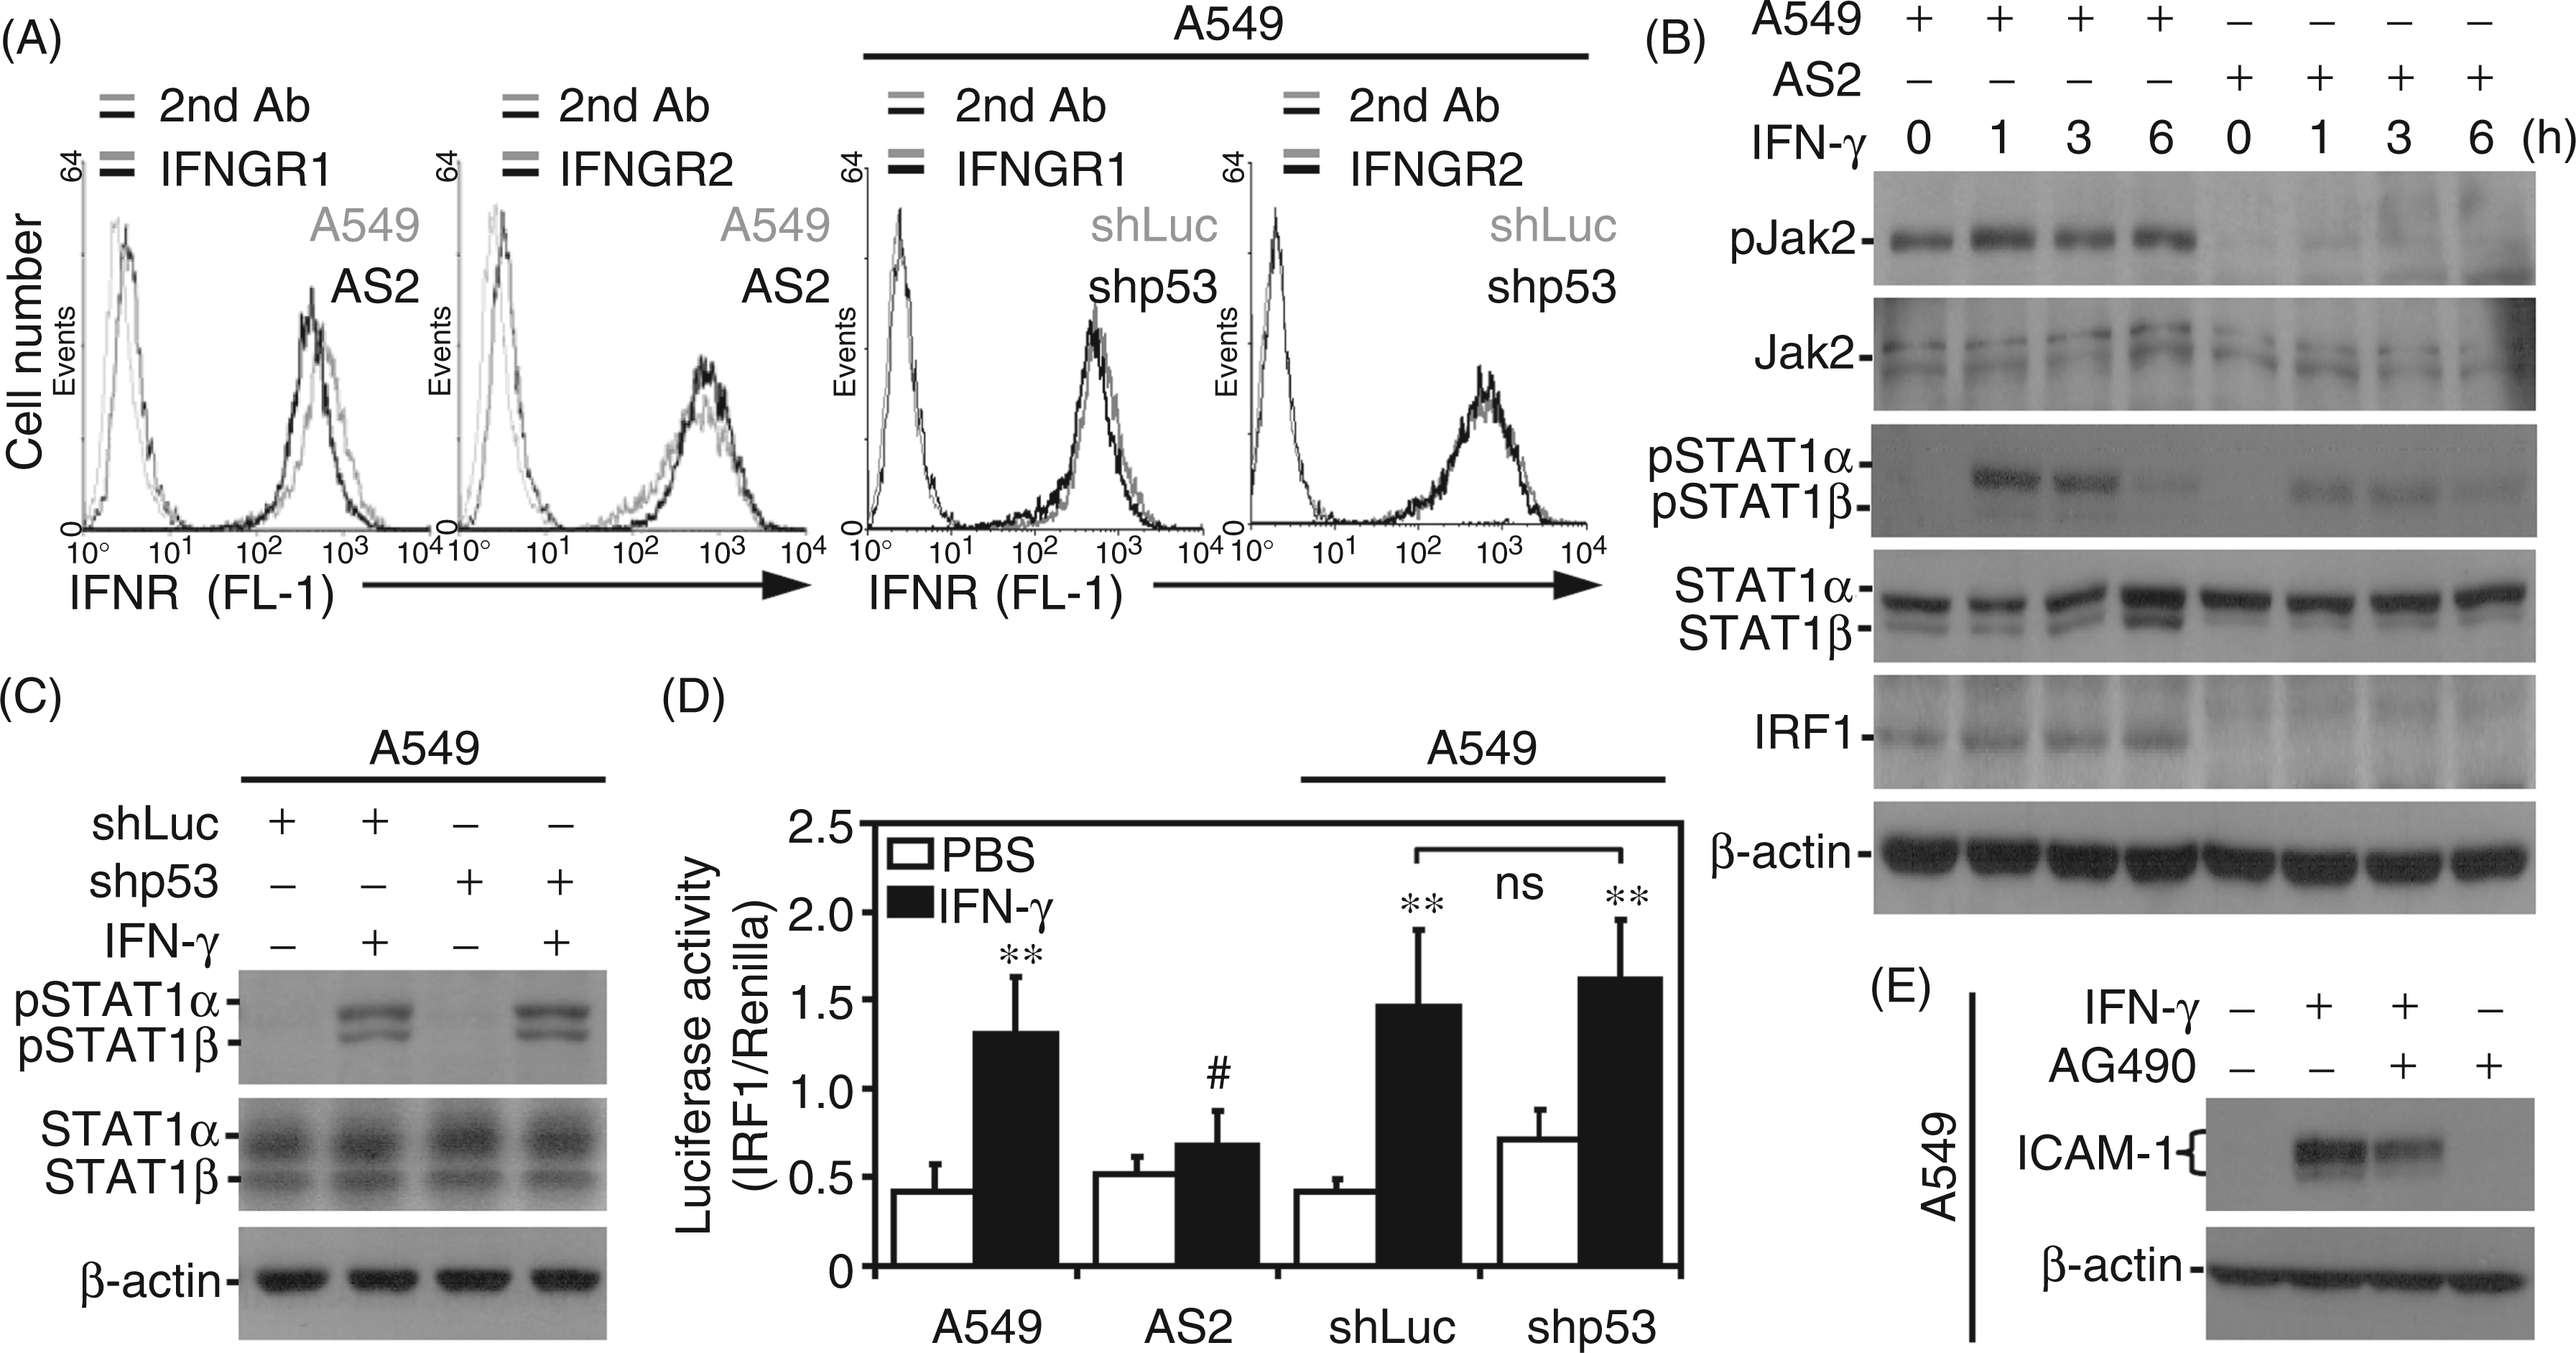
Aberrant SHP2 activation causes IFN-γ resistance in AS2 cells
AS2 cells showed resistance to IFN-γ signaling and decreased ICAM-1 expression. To evaluate the potential molecular basis for such defects, the negative regulators of IFN-γ were studied, including SHP2, SOCS1 and SOCS3.32–34,43 SHP2 can dephosphorylate or inactivate Jak2/STAT1, and SOCS proteins can competitively bind to IFNGR to block Jak2 and STAT1 activation. Western blotting showed that AS2 cells exhibited an increase in SHP2 phosphorylation, but there were no differences in the expression of SOCS1 or SOCS3 in AS2 cells compared with A549 cells (Figure 3A). Excessive ROS may positively activate SHP2.29,30,44,45 CM-H2DCFDA, MitoSOX and MitoTracker Green staining of AS2 cells demonstrated a high intracellular oxidative state (Figure 3B), accompanied by an increased number of ROS-containing mitochondria within the cells (Supplementary Figure 1). Treating AS2 cells with the antioxidant NAC effectively reduced ROS generation (Figure 3B), as well as SHP2 phosphorylation (Figure 3C). We next hypothesized a further role for ROS-activated SHP2 in IFN-γ resistance in AS2 cells. A reporter assay showed that inhibiting SHP2 through lentivirus-based shRNA knockdown in AS2 cells significantly (P < 0.05) reversed IFN-γ-induced IRF1 transactivation (Figure 3D). Western blotting, which was used to analyze the feedback regulatory role of SHP2, showed that shRNA inhibited SHP2 expression and rescued the expression of ICAM-1 in IFN-γ-treated AS2 cells (Figure 3E). These results provide evidence that the oxidative activation of SHP2 negatively regulates IFN-γ signaling and ICAM-1 expression in AS2 cells.
Aberrant SHP2 activation causes defects in IFN-γ signaling and ICAM-1 expression in AS2 cells. (A) Western blotting was used to determine the kinetics of SHP2 Tyr542 (pSHP2), SHP2, SOCS1 and SOCS3 expression in IFN-γ (10 ng/ml)-treated A549 and AS2 cells. (B) Representative histograms of CM-H2DCFDA staining for intracellular ROS followed by flow cytometry demonstrated the generation of ROS in A549 and AS2 cells, and the effect of antioxidant NAC treatment was also investigated. *P < 0.05 compared with PBS. Western blotting was used to measure the expression of SHP2 Tyr542 (pSHP2) and SHP2 in AS2 cells treated with the indicated dose of NAC for 6 h (C), and the expression of SHP2 and ICAM-1 in shLuc- or shSHP2-transfected AS2 cells treated with IFN-γ (10 ng/ml) for 24 h (E). β-Actin was used as the internal control. The data shown are representative of three individual experiments. (D) In addition, the luciferase reporter assay showed the transactivation ratio of IRF-1 to Renilla in the indicated cells, which were treated with IFN-γ for 1 h. PBS treatment was used as the negative control. The data are shown as the mean ± SD obtained from repeated experiments. *P < 0.05 compared with PBS. #P < 0.05 compared with shLuc. Auto: autofluorescence.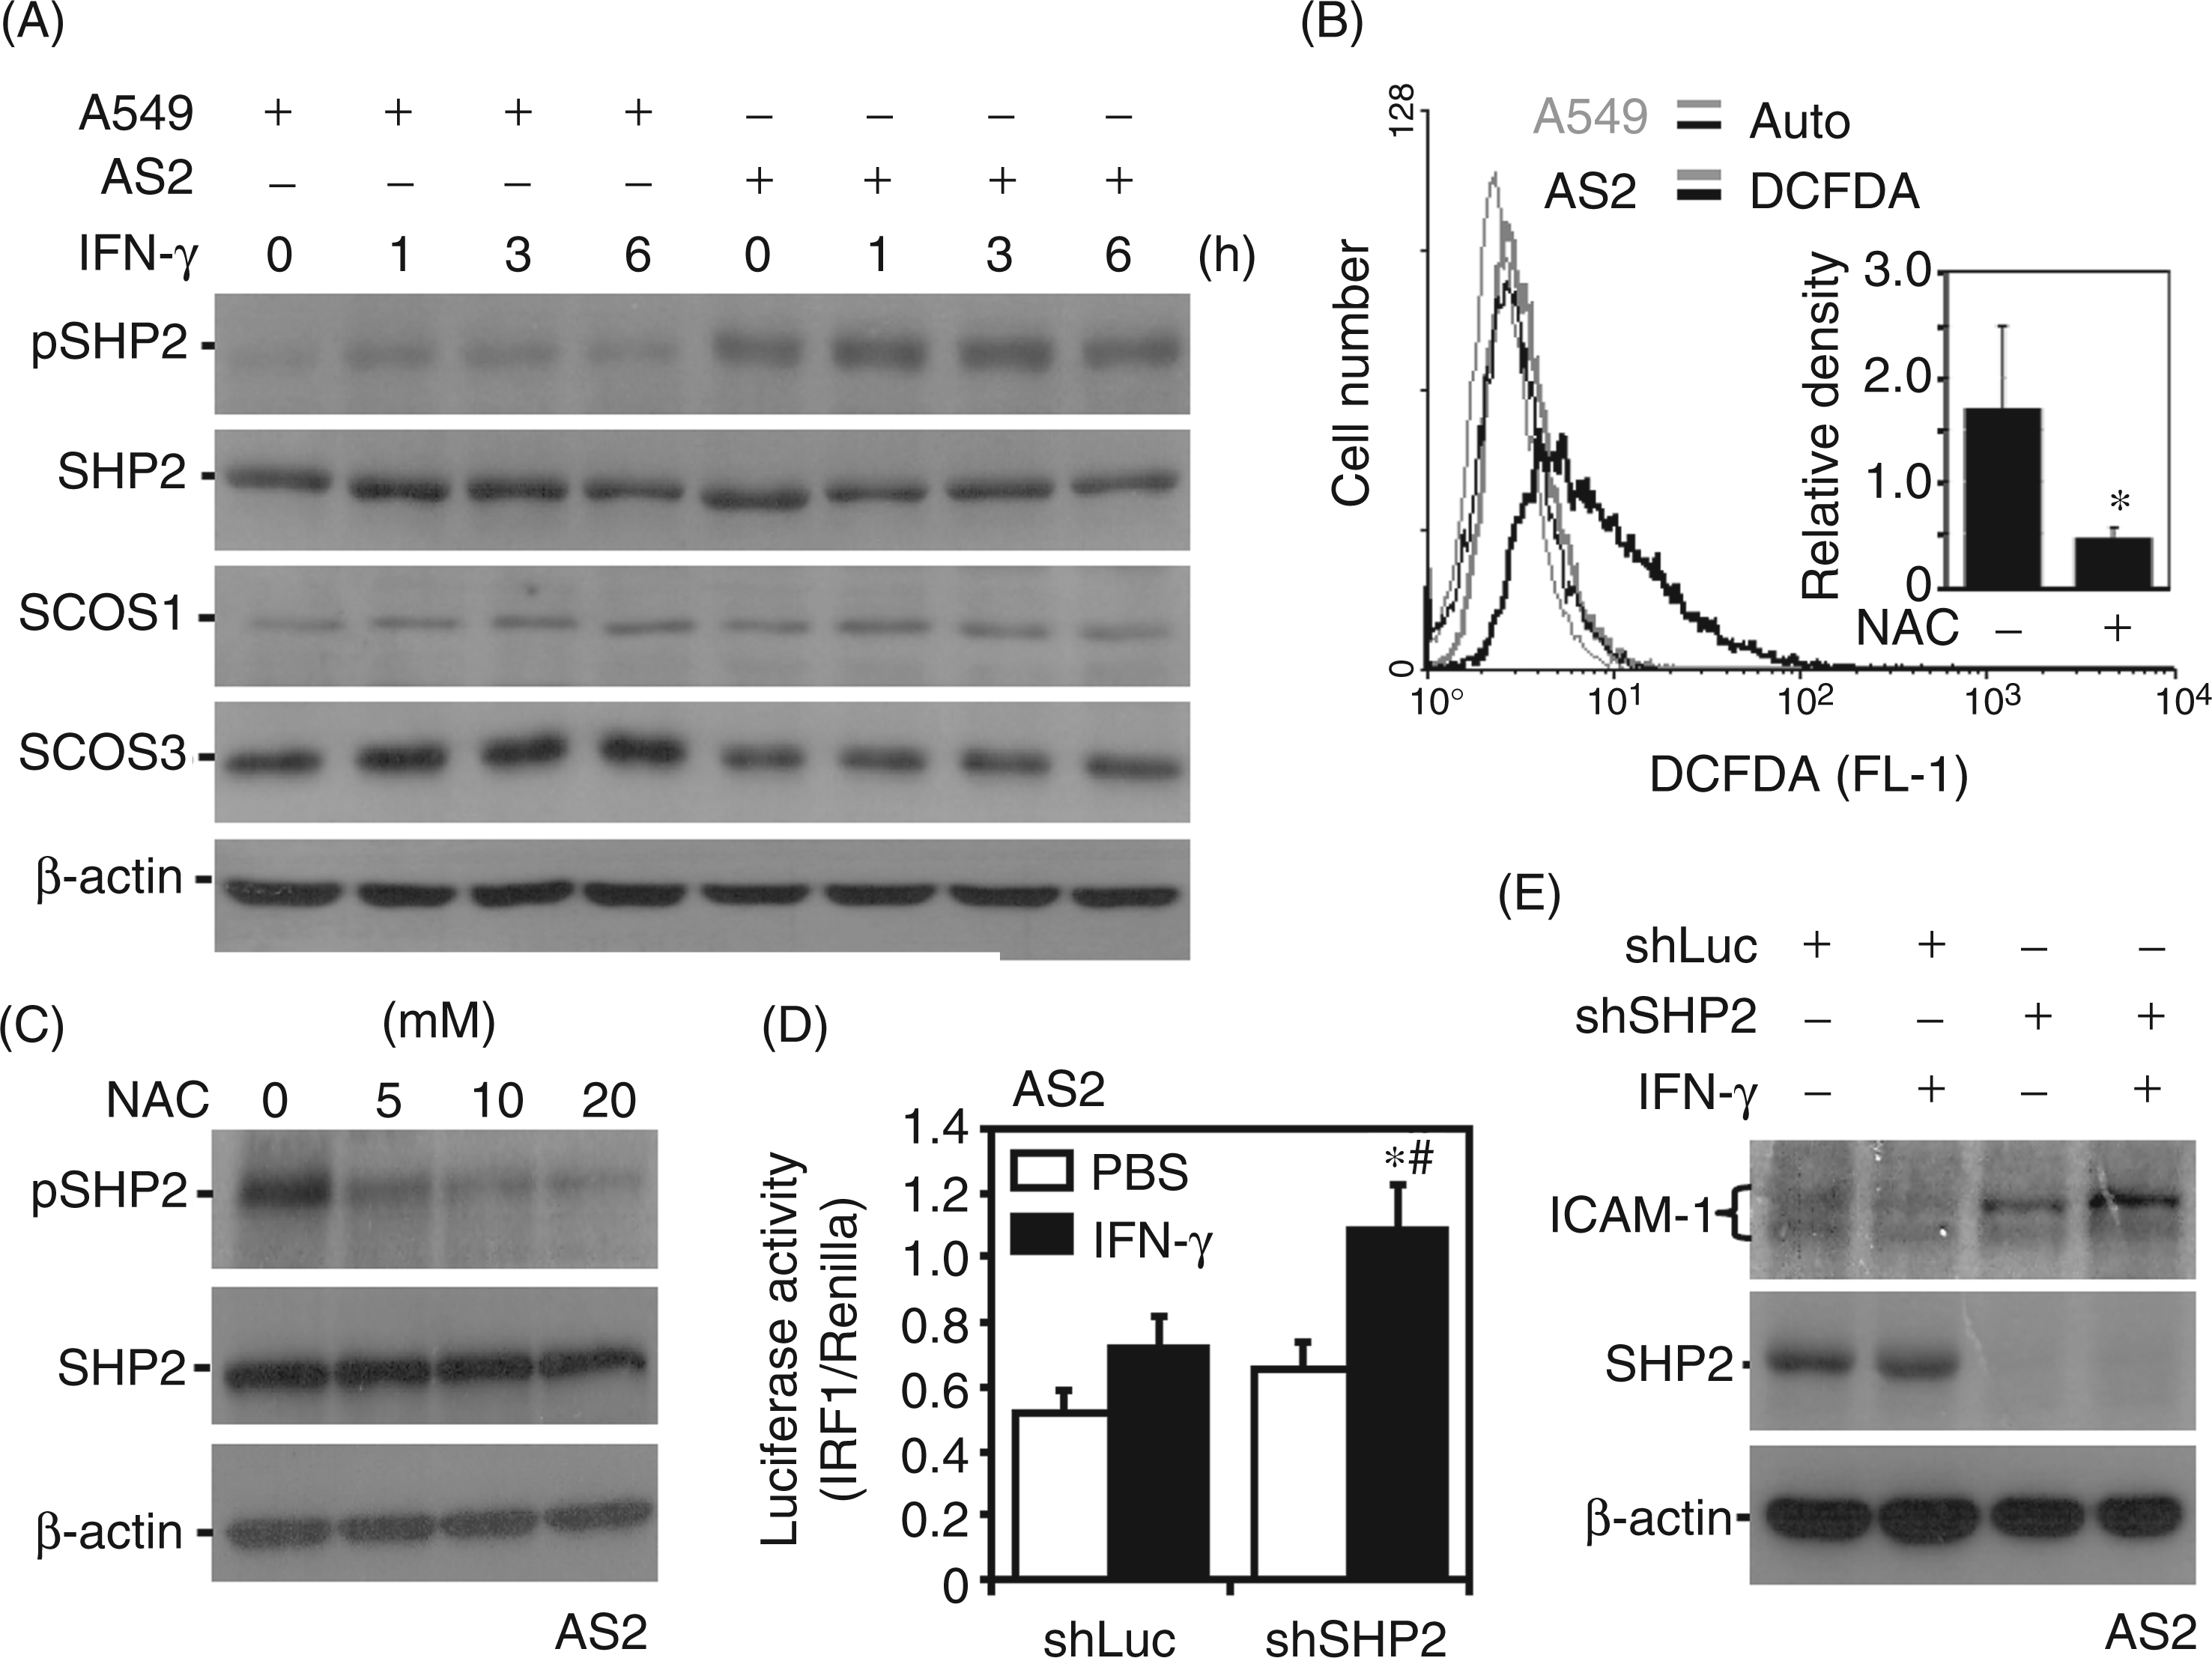
Autophagic inhibition contributes to IFN-γ resistance
We previously demonstrated that autophagy facilitates IFN-γ signaling and cellular inflammation.29,30 The process of autophagosome formation depends on various Atgs and E1-, E2- and E3-like activating enzymes to mediate the conjugation of LC3 with phosphatidylethanolamine.46–48 We investigated whether autophagic inhibition caused IFN-γ resistance in AS2 cells. The transfection of a GFP–LC3 fusion protein showed that IFN-γ-induced formation of GFP–LC3 puncta, a cellular phenomenon that indicates autophagosome formation,29,47 was significantly (P < 0.01) inhibited in AS2 cells compared with A549 cells (Figure 4A). Western blotting further confirmed that IFN-γ caused an increase in LC3 II expression in A549 but not AS2 cells; however, the levels of Atg5 and Beclin-1 were similar in A549 and AS2 cells (Figure 4B). Additionally, under serum starvation and mTOR inhibition with rapamycin, AS2 cells also showed a resistant autophagic response (Supplementary Figure 2). These results confirm that autophagy resistance is constitutive in AS2 cells.
Autophagic resistance in cells inhibits IFN-γ signaling and ICAM-1 expression. (A) Representative images of GFP–LC3 puncta formation in A549 and AS2 cells treated with IFN-γ (10 ng/ml) for 24 h captured by fluorescence microscopy. The data are shown as the mean ± SD obtained from three consecutive microscopic fields. **P < 0.01 compared with PBS. ##P < 0.01 compared with A549. Western blot analysis was used to determine the kinetics of LC3, Atg5 and Beclin 1 expression in IFN-γ (10 ng/ml)-treated A549 and AS2 cells (B), and the kinetics of Atg5, STAT1α/β Tyr701 (pSTAT1α/β), and STAT1α/β expression in IFN-γ (10 ng/ml)-treated shLuc- or shAtg5-transfected A549 cells (D). (C) Representative histograms of immunostaining followed by flow cytometry indicate the surface expression of IFNGR1 and IFNGR2 in shLuc- or shAtg5-transfected A549 cells. (E) Luciferase reporter assays were used to determine the transactivation ratio of IRF-1 to Renilla in the indicated cells treated with IFN-γ for 1 h. PBS treatment was used as the negative control. The data are shown as the mean ± SD obtained from repeated experiments. **P < 0.01 compared with PBS. ##P < 0.01 compared with shLuc. Western blotting at 24 h post-treatment was used to measure the expression of ICAM-1 and LC3 in IFN-γ (10 ng/ml)-treated shLuc- or shAtg5-transfected A549 cells (F), A549 cells pre-treated with the autophagy inhibitor 3-MA (1 mM) (H), and shLuc- or shAtg5-transfected HMEC-1 cells (I). β-Actin was used as the internal control. The data shown are representative of three individual experiments. (G) Representative histograms of immunostaining followed by flow cytometry showed the surface expression of ICAM-1 in shLuc- or shAtg5-transfected A549 cells at 24 h after treatment with IFN-γ (10 ng/ml).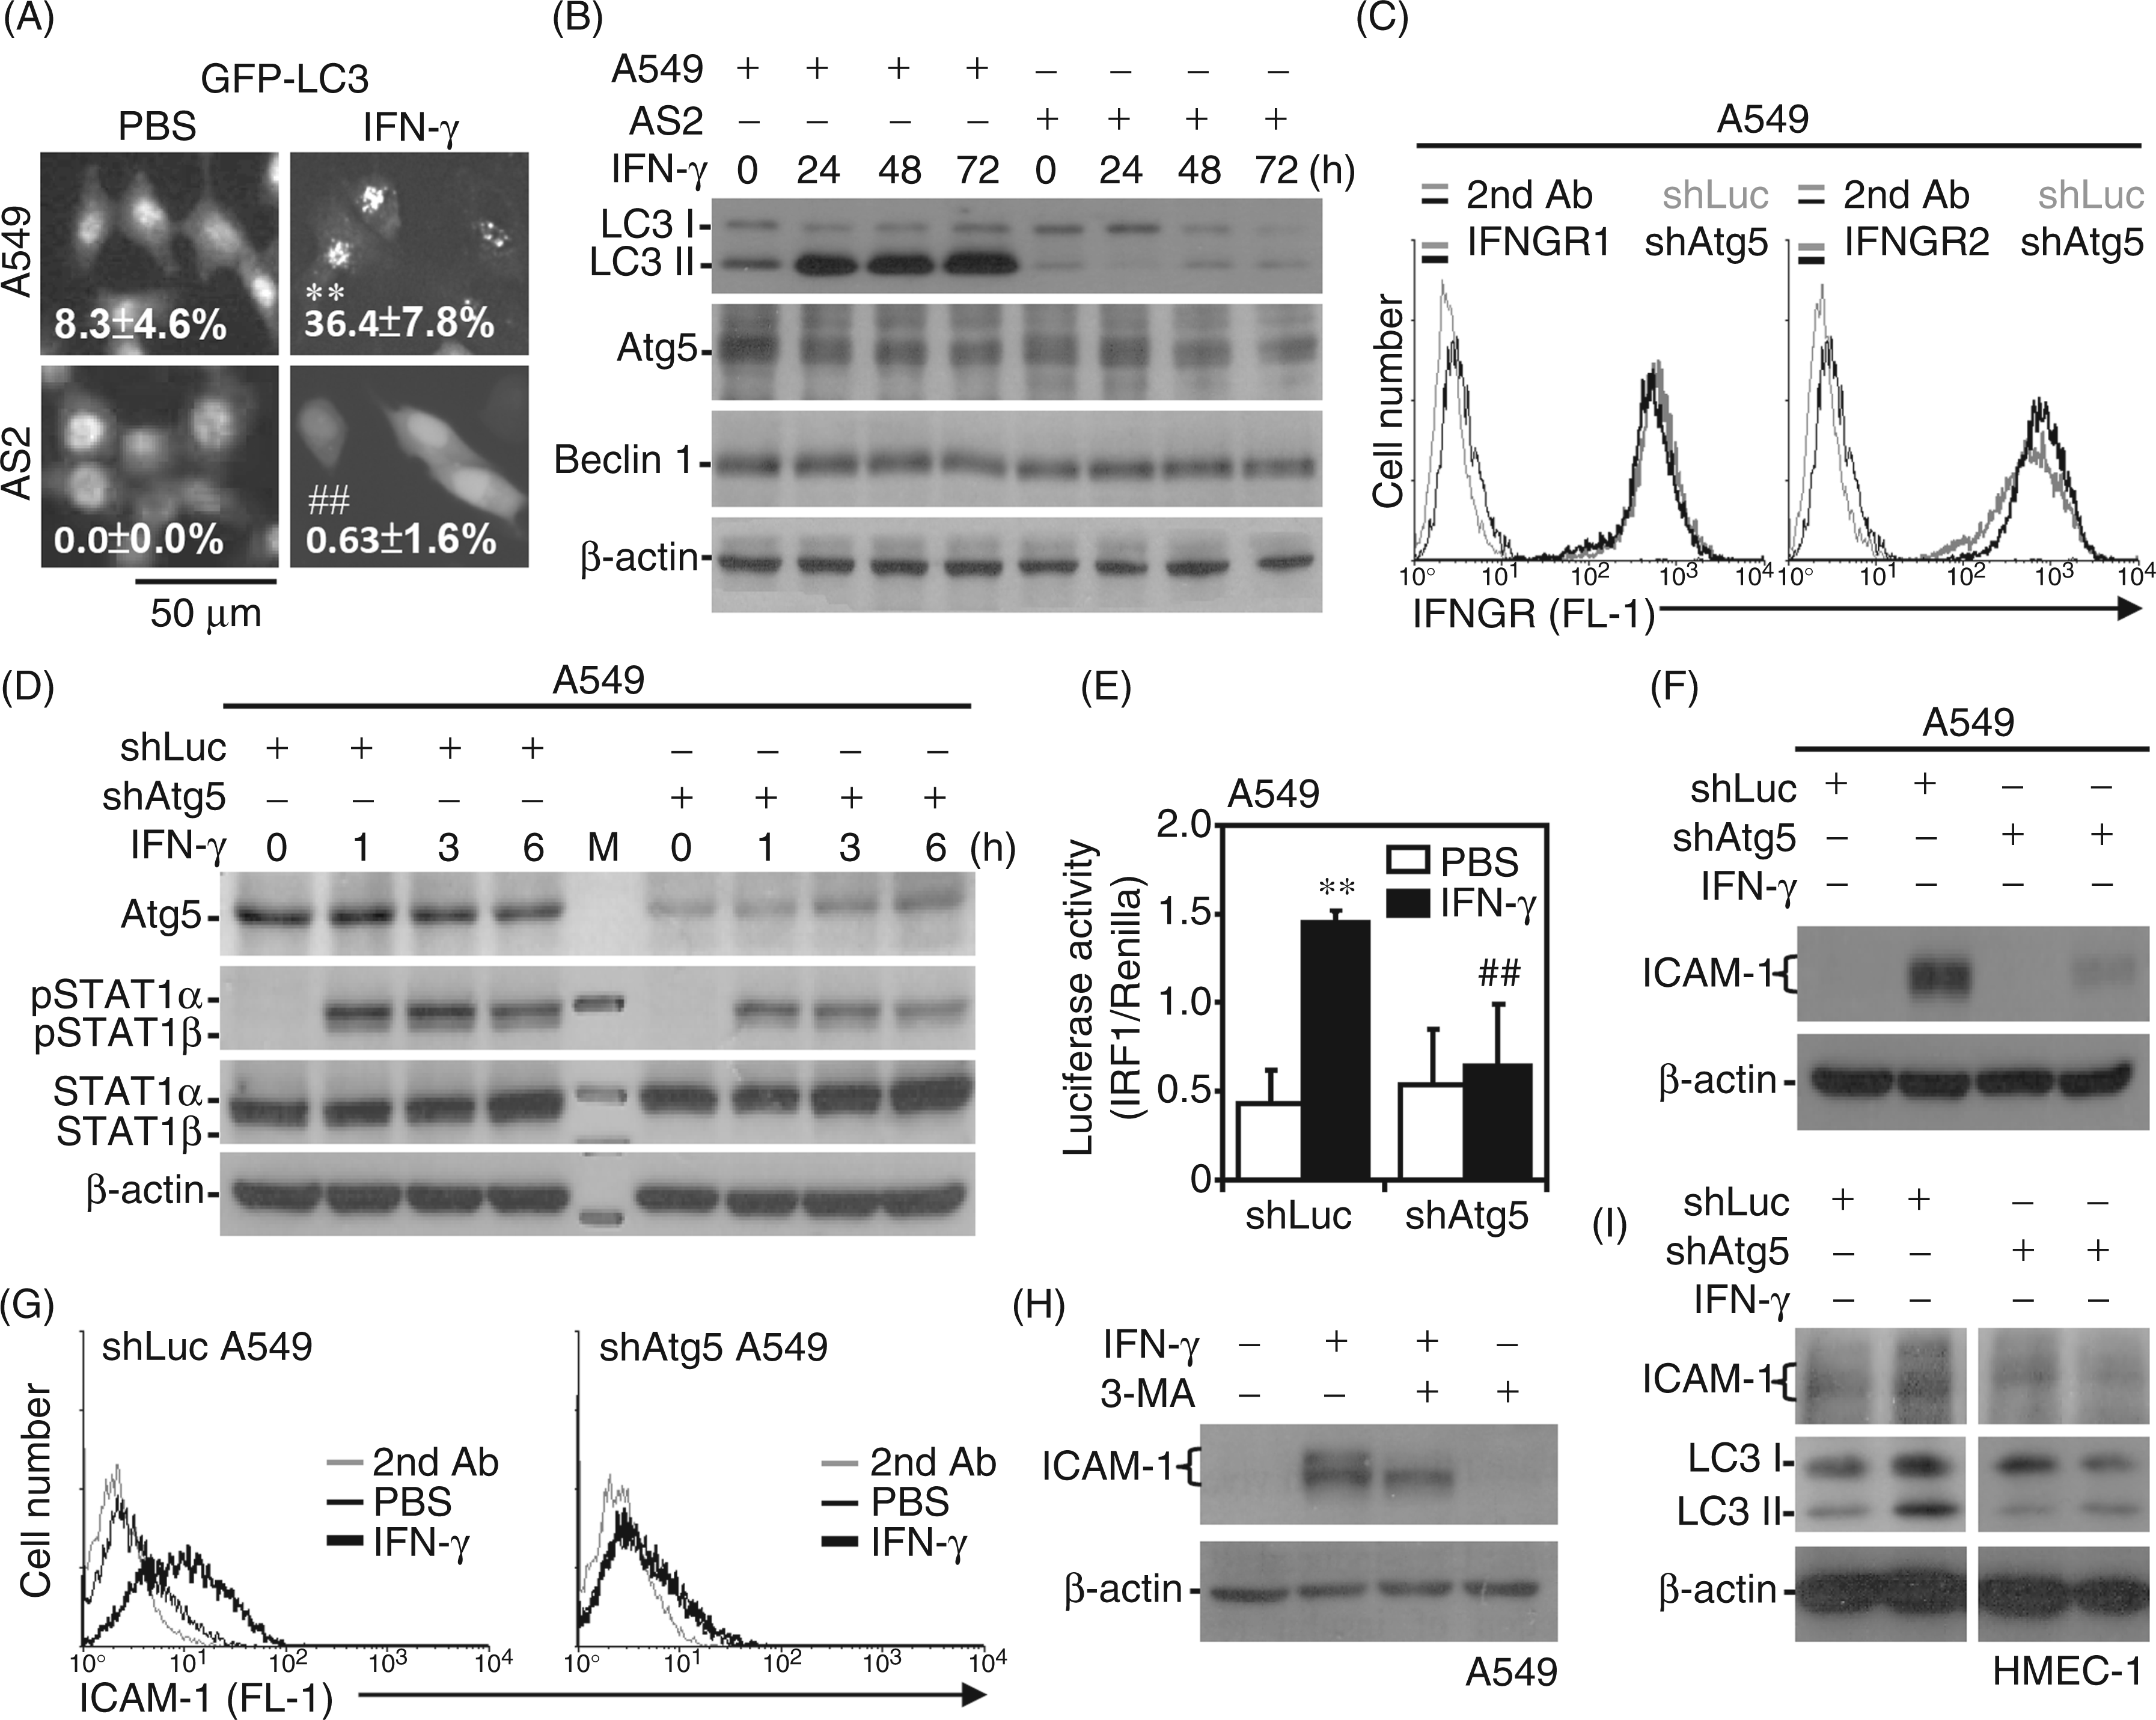
To verify the role of autophagy in IFN-γ-induced ICAM-1 expression, lentivirus-based shRNA was used to knock down Atg5 in A549 cells. Immunostaining demonstrated that IFNGR1 and IFNGR2 expression were not affected in shLuc- and shAtg5-transfected A549 cells (Figure 4C). Following IFN-γ treatment, Western blotting also showed that, compared with the shLuc-transfected control, IFN-γ-induced STAT1 phosphorylation was attenuated in shAtg5-transfected cells (Figure 4D). In autophagy-deficient cells, IFN-γ-induced IRF1 transactivation was also significantly (P < 0.01) inhibited (Figure 4E), and IFN-γ did not induce ICAM-1 expression in shAtg5-transfected A549 cells, as confirmed by Western blotting (Figure 4F) and immunostaining (Figure 4G). Treating A549 cells with 3-MA, an inhibitor of autophagy that inhibits the class III PI3K/Beclin-1 pathway,29,47 confirmed that inhibiting autophagy decreased IFN-γ-induced ICAM-1 expression (Figure 4H). Furthermore, Atg5 knockdown in HMEC-1 cells resulted in a decrease in IFN-γ-induced LC3 II and ICAM-1 expression (Figure 4I). These results indicate that autophagic resistance contributes to the inhibition of IFN-γ signaling and ICAM-1 expression.
Aberrant Bcl-2 and mTOR cause autophagic resistance followed by IFN-γ resistance
We determined that autophagic resistance leads to IFN-γ resistance in AS2 cells; however, the molecular basis underlying this autophagic resistance remains unclear. Generally, Bcl-2-mediated Beclin-1 inactivation and class I PI3K/Akt-activated mTOR-mediated unc-51-like kinase 1 inactivation negatively regulate autophagy, whereas Ras/ERK and PTEN positively regulate this process.46,49–56 Western blotting showed increased Bcl-2 expression, the activation of Akt and p70S6K (a downstream modulator of mTOR signaling) and inactivation of GSK-3β (a downstream target of Akt and p70S6K)35,40 in autophagy-resistant AS2 cells; furthermore, aberrant ERK activation and PTEN expression were observed in autophagy-susceptible A549 cells (Figure 5A). We next evaluated the potential involvement of Bcl-2 in IFN-γ resistance. Bcl-2 overexpression in A549 cells attenuated IFN-γ-induced STAT1 phosphorylation and ICAM-1 expression (Figure 5B). In contrast, Bcl-2 knockdown in AS2 cells reversed IFN-γ-induced STAT1 phosphorylation (Figure 5C) and significantly (P < 0.05) reversed IFN-γ-induced IRF1 transactivation (Figure 5D). Confirming the involvement of mTOR signaling, treatment with rapamycin, an mTOR inhibitor,
29
significantly enhanced IFN-γ-induced LC3 II expression, STAT1 phosphorylation (Figure 5E) and IRF1 transactivation (P < 0.01, Figure 5F) in A549 cells, and partly restored these responses in IFN-γ-stimulated AS2 cells. Silencing mTOR (Figure 5G) significantly (P < 0.05) reversed IFN-γ-induced IRF1 transactivation in AS2 cells (Figure 5H). Rapamycin treatment plus Bcl-2 knockdown effectively enhanced IFN-γ-induced STAT1 phosphorylation in AS2 cells (Figure 5I). These results indicate that aberrant Bcl-2 expression and mTOR activation contribute to autophagic inhibition followed by IFN-γ resistance in AS2 cells, and manipulating such signaling may alter the resistance pattern.
Aberrant Bcl-2 expression and mTOR signaling lead to resistance to IFN-γ-induced autophagy, signaling and ICAM-1 expression. Western blotting was used to measure the expression of Akt Ser473 (pAkt), Akt, p70S6K Thr389 (pS6K), p70S6K, GSK-3α/β Ser21/9 (pGSK-3α/β), GSK-3α/β, ERK Thr202/Tyr204 (pERK), ERK, PTEN, Bcl-2, Bcl-xL, Atg5, Beclin 1, and LC3 in A549 and AS2 cells (A), the expression of Bcl-2-GFP, GFP, STAT1α/β Tyr701 (pSTAT1α/β), STAT1α/β, and ICAM-1 in pGFP-C1- or pGFP-C1-Bcl-2-transfected A549 cells treated with IFN-γ (10 ng/ml) for 1 h (STAT1α/β only) or 24 h (B), the expression of STAT1α/β Tyr701 (pSTAT1α/β), STAT1α/β, and Bcl-2 in shLuc- or shBcl-2-transfected AS2 cells treated with IFN-γ (10 ng/ml) for 1 h (C), the expression of LC3, STAT1α/β Tyr701 (pSTAT1α/β), and STAT1α/β in A549 and AS2 cells treated with IFN-γ (10 ng/ml) for 1 h (STAT1α/β only) or 24 h following pre-treatment with the mTOR inhibitor rapamycin (5 µM) (E), the expression of mTOR in shRNA-transfected AS2 cells (G), and the expression of STAT1α/β Tyr701 (pSTAT1α/β) and STAT1α/β in shLuc- or shBcl-2-transfected AS2 cells treated with IFN-γ (10 ng/ml) for 1 h following pre-treatment with rapamycin (25 µM) (I). β-Actin was used as the internal control. The data shown are representative of three individual experiments. At 1 h post-treatment, a luciferase reporter assay was performed to determine the transactivation ratios of IRF-1 to Renilla in IFN-γ (10 ng/ml)-treated shLuc-, shBcl-2 - or shmTOR-transfected AS2 cells (D, H), and A549 or AS2 cells pre-treated with rapamycin (25 µM) (F). PBS treatment was used as the negative control. The data are shown as the mean ± SD obtained from repeated experiments. *P < 0.05 compared with PBS or A549. #P < 0.05, ##P < 0.01 compared with shLuc or IFN-γ only treatment.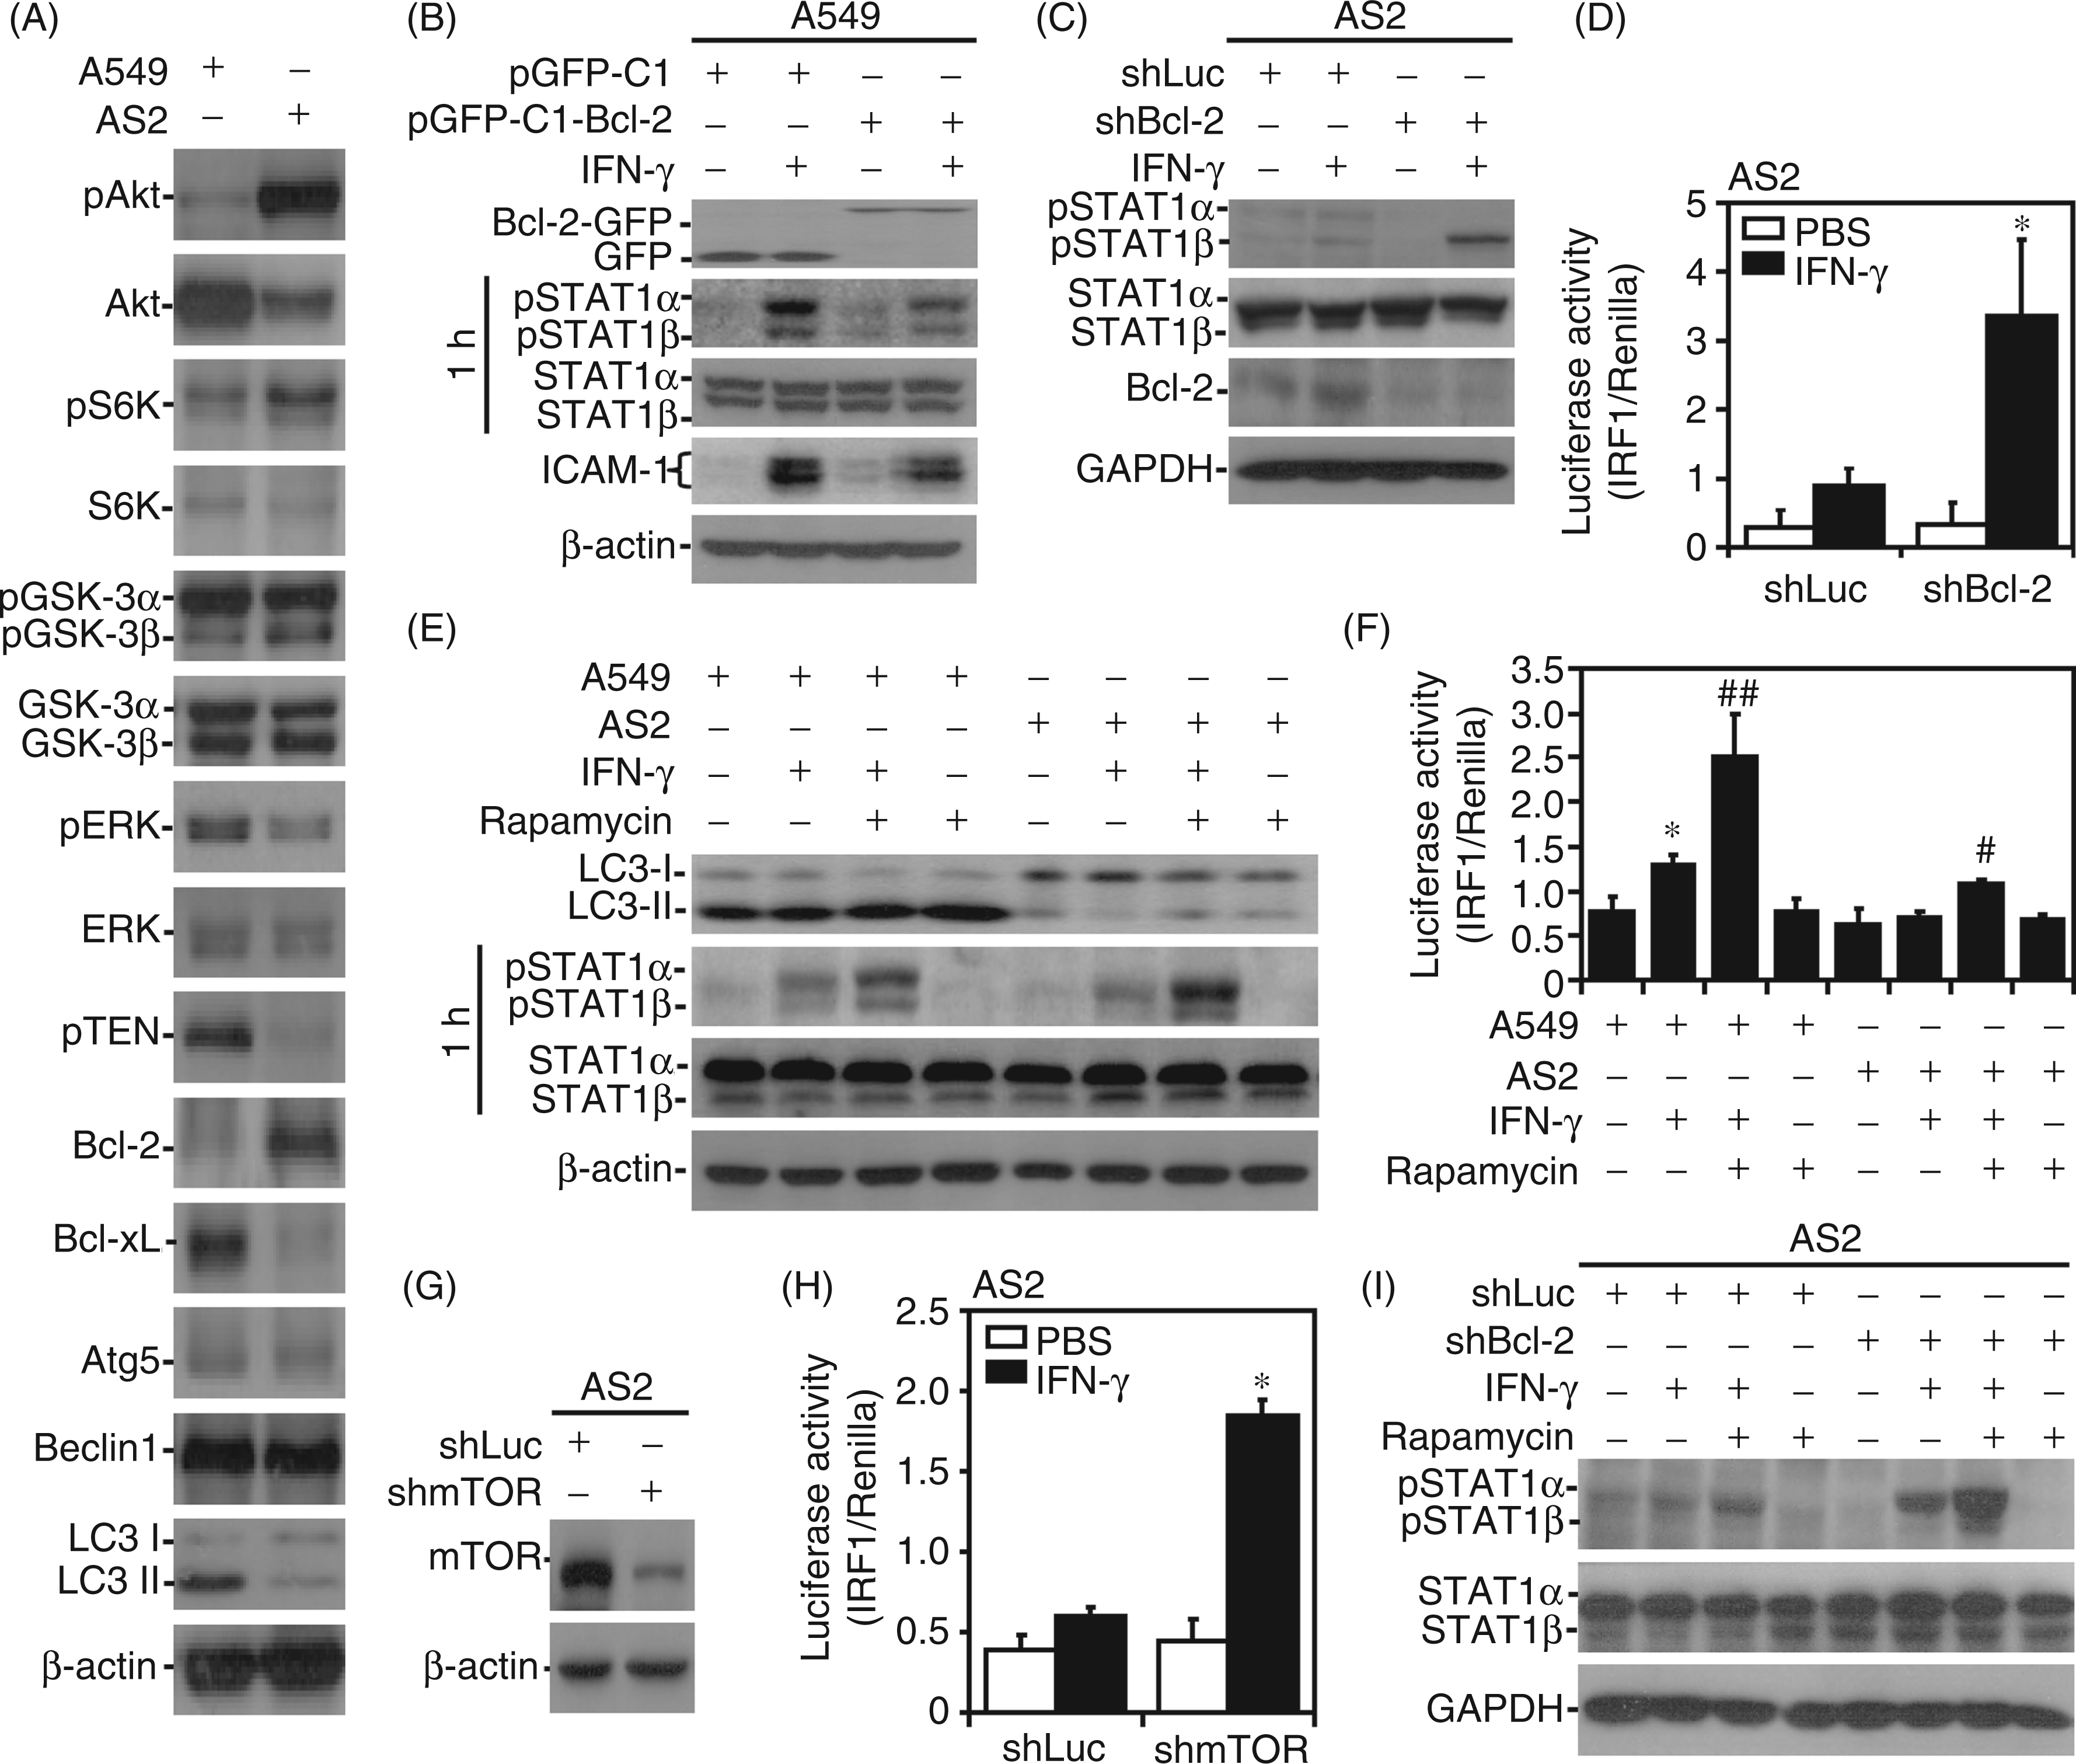
Autophagy regulates TNF-α responses by facilitating NF-κB activation under Bcl-2 and mTOR surveillance
In addition to IFN-γ, autophagy is currently demonstrated for regulating TNF-α-induced NF-κB prolonged activation by degrading IκB.31,37 According to previous studies that have shown that TNF-α induces ICAM-1 expression through an NF-κB-mediated pathway,
5
we hypothesized that autophagy also regulates TNF-α-induced ICAM-1 expression, and AS2 cells may show resistance to TNF-α. Indeed, analysis of the GFP–LC3 fusion protein showed that TNF-α was not inducing autophagy much in AS2 cells compared with A549 cells (Figure 6A). Western blotting showed that AS2 cells were resistant to TNF-α-induced ICAM-1 expression and IκB degradation (Figure 6B). As demonstrated by p53 silencing in A549 cells, TNF-α induced ICAM-1 expression and IκB degradation independently of p53 (Supplementary Figure 3A). The genetic (Figure 6C) and pharmacological (Supplementary Figure 3B) inhibition of autophagy by Atg5 silencing and 3-MA treatment, respectively, decreased TNF-α-induced ICAM-1 activity in A549 cells, and 3-MA treatment also inhibited TNF-α-induced ICAM-1 activity in human endothelial cells (Supplementary Figure 3C). Confirming the role of NF-κB, the pharmacological inhibition of NF-κB using CAPE reduced ICAM-1 expression in TNF-α-treated A549 cells (Supplementary Figure 3D). TNF-α-induced NF-κB activation was significantly (P < 0.01) reduced in AS2 cells compared with A549 cells (Figure 6D, left). Notably, Atg5 knockdown in A549 cells resulted in significant (P < 0.05) resistance to TNF-α-induced NF-κB activation (Figure 6D, right). These results indicate that autophagy, but not p53, facilitates TNF-α-induced IκB degradation and NF-κB activation followed by ICAM-1 expression, and autophagy-resistant AS2 cells also exhibit TNF-α resistance.
Autophagy mediates TNF-α activation, and autophagic resistance causes defects in TNF-α signaling and ICAM-1 expression. (A) Representative images of GFP–LC3 puncta formation in A549 and AS2 cells treated with TNF-α (10 ng/ml) for 24 h captured by fluorescence microscopy. The data are shown as the mean ± SD obtained from three consecutive microscopic fields. *P < 0.05 and ***P < 0.001 compared with PBS. ##P < 0.01 compared with A549. Western blot analysis was used to measure the expression of ICAM-1 and IκB in TNF-α (10 ng/ml)-treated AS2 and A549 cells (B), and shLuc- or shAtg5-transfected A549 cells (C), and the expression of LC3 and ICAM-1 in TNF-α (10 ng/ml)-treated shLuc- and shBcl-2-transfected AS2 cells (E), and A549 and AS2 cells pre-treated with rapamycin (5 µM) (G, bottom) at 24 h post-treatment. β-Actin was used as the internal control. The data shown are representative of three individual experiments. At 1 h post-treatment, luciferase reporter assays were performed to determine the transactivation ratios of NF-κB to Renilla in TNF-α (10 ng/ml)-treated A549 and AS2 cells (D, left), shLuc- and shAtg5- (D, right), shBcl-2 (F), or shmTOR (H)-transfected AS2 cells, and A549 and AS2 cells pre-treated with rapamycin (5 µM) (G, top). PBS treatment was used as the negative control. The data are shown as the mean ± SD obtained from repeated experiments. *P < 0.05, **P < 0.01 compared with PBS. #P < 0.05, ##P < 0.01 compared with A549, shLuc or TNF-α treatment alone.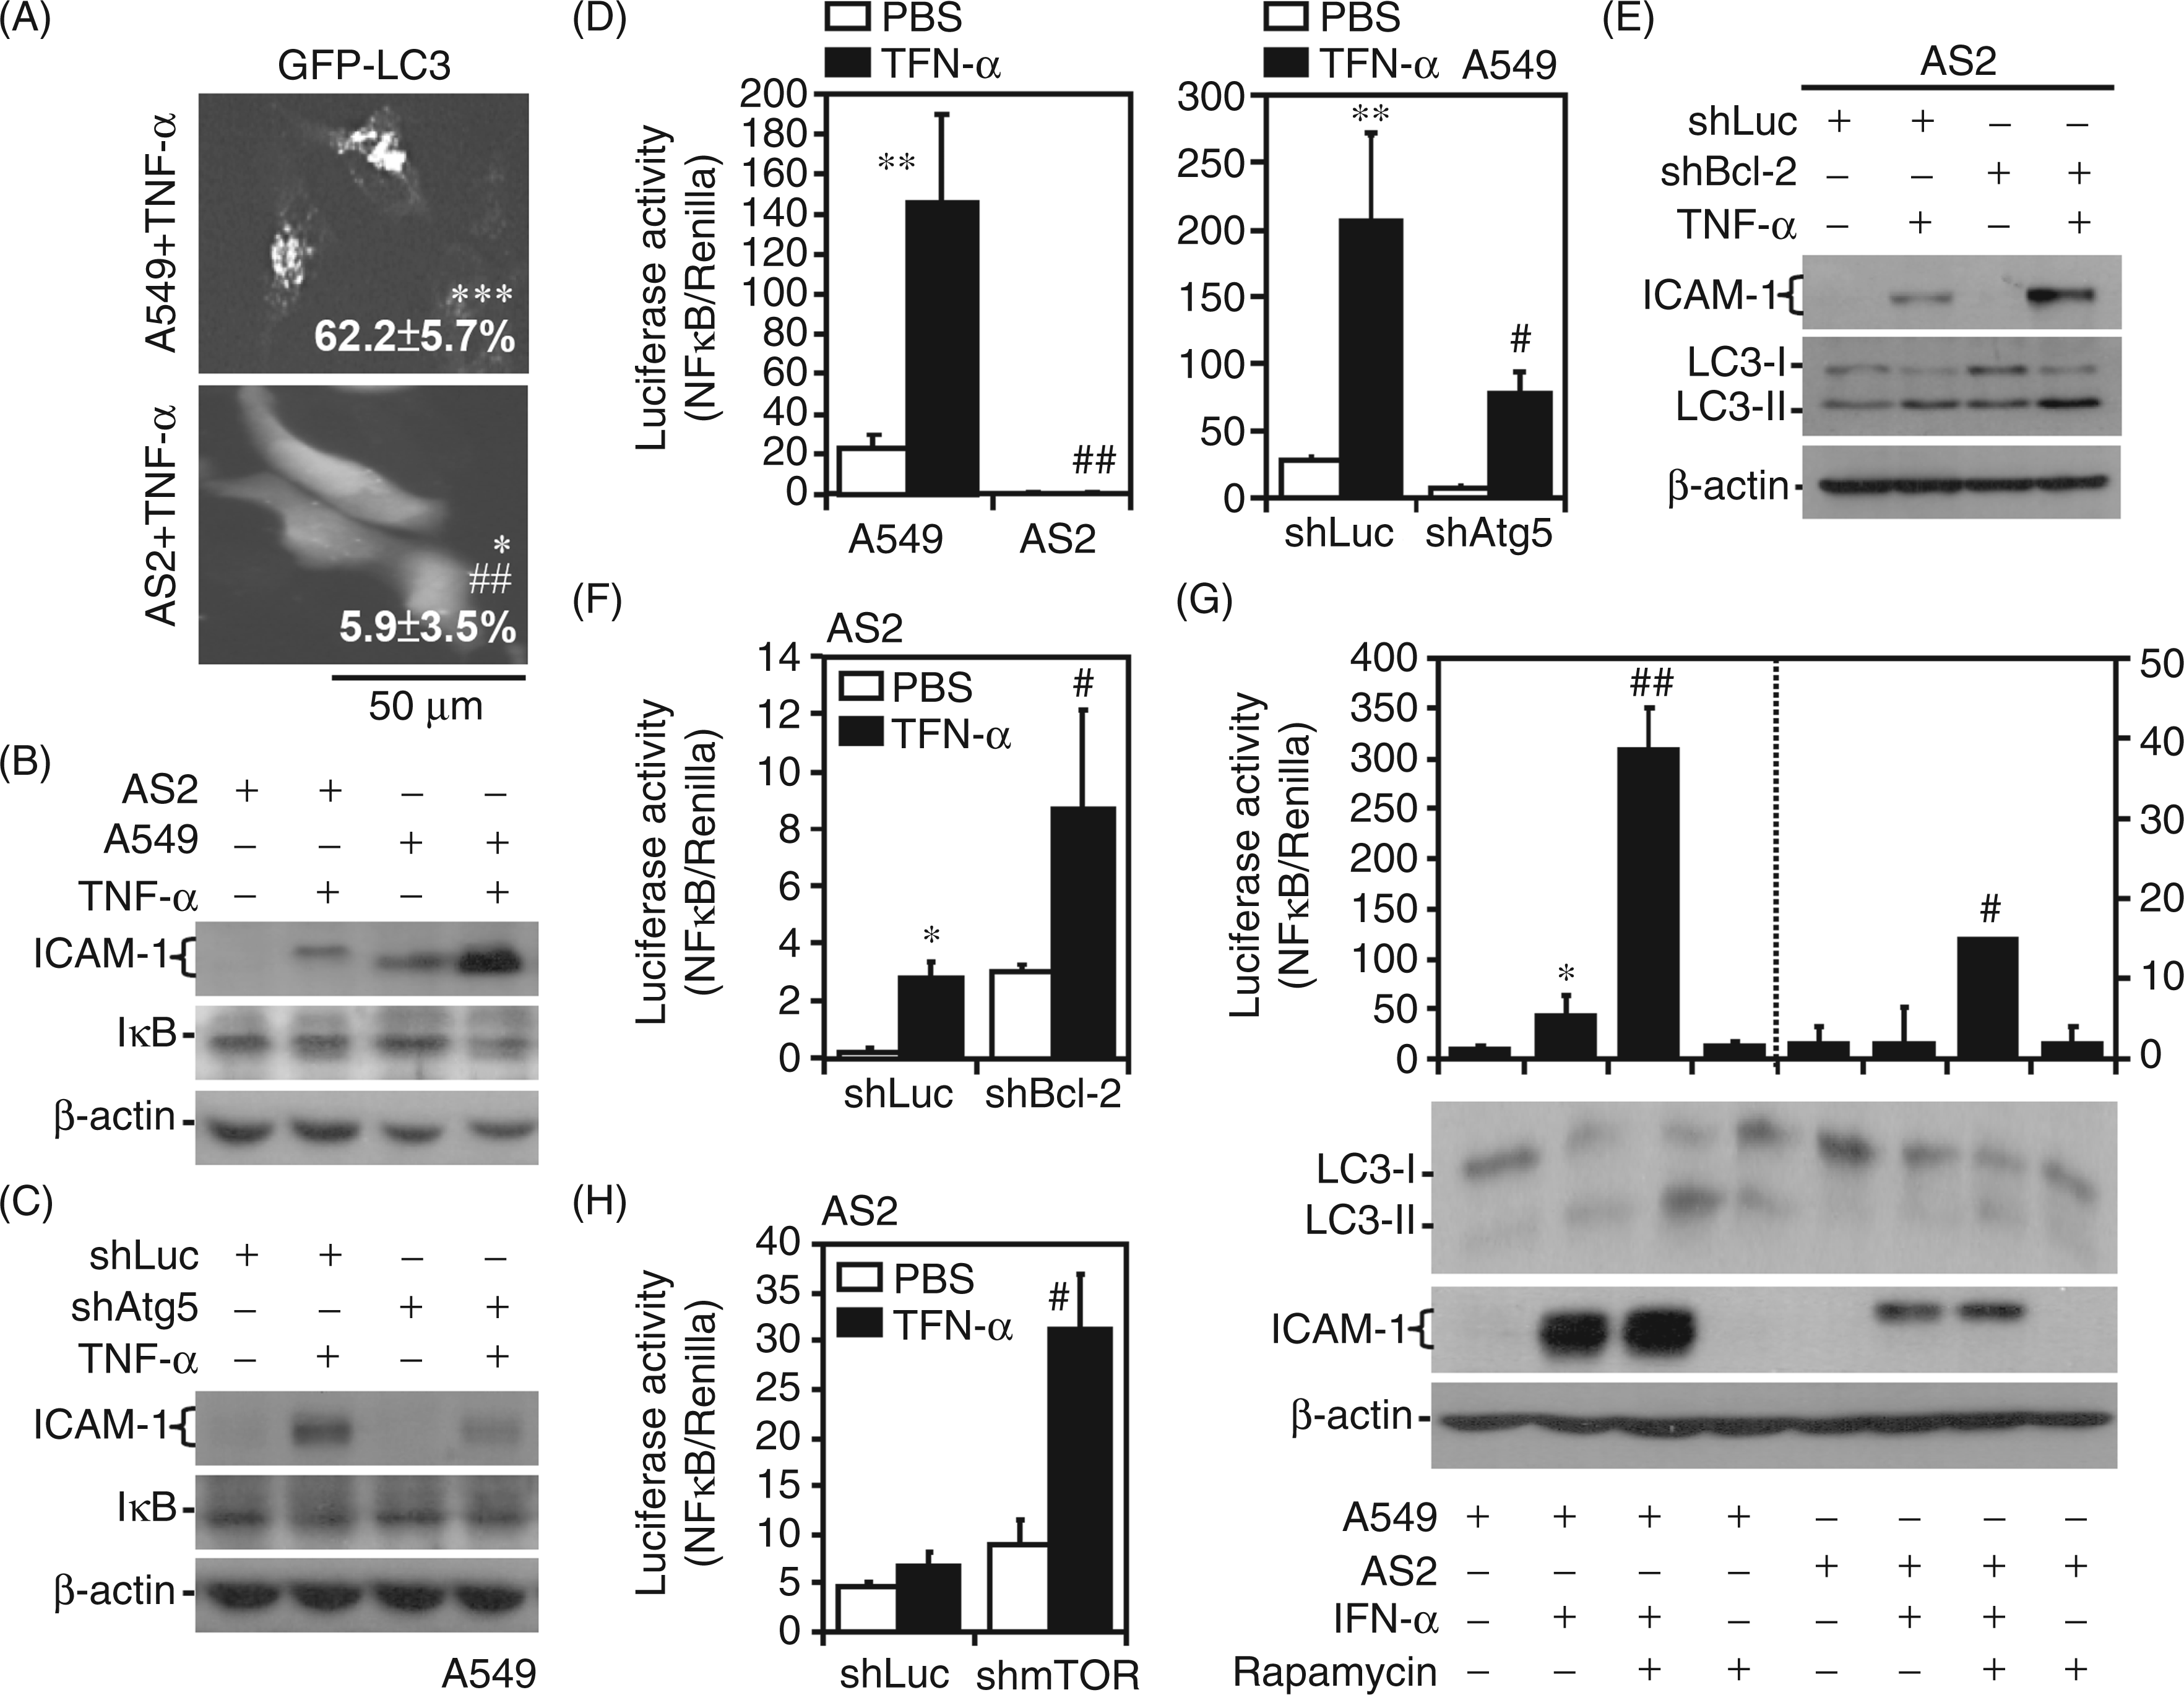
Based on our findings related to autophagic resistance in AS2 cells, we next hypothesized that Bcl-2 and mTOR might be involved in TNF-α resistance. First, immunostaining showed that the expression of TNFR1 and TNFR2 was similar in A549 cells, AS2 cells and A549 cells with shRNA-mediated Atg5 silencing (Supplementary Figure 3E). It is notable that silencing Bcl-2 in AS2 cells increased TNF-α-induced ICAM-1 and LC3 II expression (Figure 6E), and significantly increased NF-κB activation (P < 0.05, Figure 6F). We further found that treatment with rapamycin significantly enhanced TNF-α-induced LC3 II expression, ICAM-1 expression and NF-κB activation (P < 0.01) in A549 cells, and also restored these responses in AS2 cells (Figure 6G). mTOR knockdown in AS2 cells significantly (P < 0.05) reversed TNF-α-induced NF-κB activation (Figure 6H). These results demonstrate that autophagic modulators, such as Bcl-2 and mTOR, also determine TNF-α resistance in AS2 cells.
Inhibiting autophagy decreases monocyte adhesion to IFN-γ-activated cells
To evaluate the necessity of autophagy for functional ICAM-1 expression, a leukocyte adherence test was performed as described previously.
42
Monolayer cultures of A549 cells were stimulated with IFN-γ to induce ICAM-1 expression and then co-incubated with human monocytic U937 cells to evaluate adhesion. In the presence of ICAM-1-neutralizing Abs, the adhesion of U937 cells to IFN-γ-activated A549 cells was decreased (data not shown), indicating that the mechanism of cell adhesion is ICAM-1 dependent. Notably, inhibiting autophagy by 3-MA treatment significantly (P < 0.05) inhibited IFN-γ-induced cell adhesion to activated A549 cells (4.5 ± 1.4 for untreated, 72.1 ± 13.6 for IFN-γ, 32.8 ± 10.2 for IFN-γ plus 3-MA and 11.4 ± 1.8 for 3-MA only) (Figure 7A). These results demonstrate the essential role of autophagy in the regulation of functional ICAM-1 expression to promote monocyte adhesion following IFN-γ stimulation.
Autophagy inhibition decreases monocyte adhesion to IFN-γ-treated A549 cells. (A) Representative fluorescent and phase images of the adhesion of Hoechst 33258-labeled human U937 monocytes (blue) to SYTO 60 red-labeled A549 cells (red) treated with IFN-γ (10 ng/ml) for 24 h following pre-treatment with 3-MA (10 mM). The data are shown as the mean ± SD obtained from three consecutive microscopic fields from three individual experiments. **P < 0.01 compared with PBS. #P < 0.05 compared with IFN-γ. (B) A hypothetical model showing how autophagy, but not p53, regulates ICAM-1 expression mediated by IFN-γ and TNF-α signaling.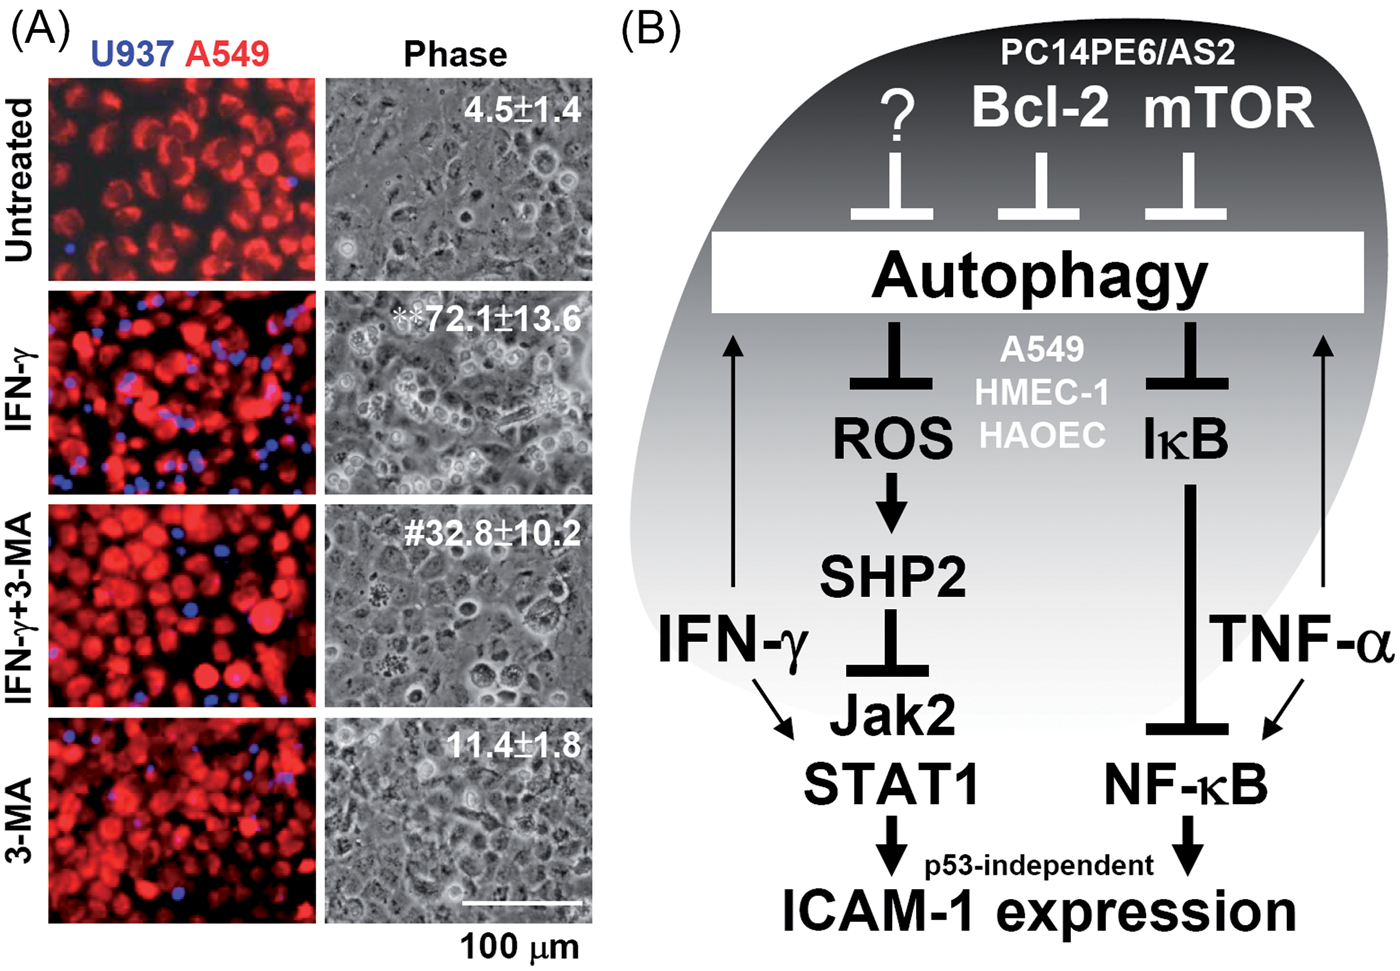
Discussion
Recent studies have demonstrated a crucial role for autophagy in facilitating the signaling of the pro-inflammatory cytokines IFN-γ29,30 and TNF-α.31,37 According to the results of this study as summarized in Figure 7B, upon autophagy-mediated SHP2 and IκB inactivation, IFN-γ and TNF-α trigger Jak2/STAT1 and NF-κB signal transduction, respectively, to promote ICAM-1 expression. However, aberrant Bcl-2 and mTOR signaling causes autophagic resistance followed by the generation of cytokine resistance. Manipulating autophagy may regulate cytokine responses and, consequently, immune homeostasis during inflammation.
Pro-inflammatory cytokine-induced ICAM-1 expression is substantially increased at sites of inflammation, and it usually facilitates inflammation to provide the inflamed cells with a mechanism for the regulation of cell–cell interactions.1,2 Unlike A549 cells, p53-mutated AS2 cells show considerable resistance to IFN-γ and TNF-α signaling, and decreased ICAM-1 expression, as demonstrated in this study. Consistent with the previous studies that the p53 signaling pathway is also important for the transcriptional activation of ICAM-1, 6 and both IFN-γ and TNF-α can activate p53,7,8 our findings implicate a p53-regulated pathway in cytokine-induced ICAM-1. To the best of our knowledge, however, our use of a lentivirus-based shRNA approach to knock down p53 in A549 cells provides the first evidence that p53 is not required for IFN-γ- and TNF-α-induced ICAM-1 expression. These unexpected findings led us to further investigate the molecular mechanism of cytokine resistance in AS2 cells.
IFN-γ activates Jak2/STAT1 to cause IRF1 transactivation and expression. 33 In this study, AS2 cells showed IFN-γ resistance following Jak2, STAT1 and IRF1 inactivation. In contrast, however, STAT1 phosphorylation was slightly decreased in IFN-γ-stimulated AS2 cells and Atg5-silenced A549 cells. In autophagy-deficient (Atg5-/- and Atg7-/-) and autophagy-resistant (AS2) cells, oxidative SHP2 activation determines IFN-γ resistance, as demonstrated previously,29,30,45 and in this study. While SHP2 regulates both Jak2 and STAT1,34,57,58 Src tyrosine kinase, an alternative kinase that can phosphorylate STAT1 at tyrosine residues, has been demonstrated to simultaneously regulate IFN-γ-induced ICAM-1. 59 It is still unclear whether SHP2 also alters IFN-γ-activated Src in the context of the feedback regulation of STAT1. Accordingly, complete STAT1 activation by Jak2 and Src is required for IFN-γ-induced IRF1 and ICAM-1 expression.
Our studies demonstrated that IFN-γ did not cause Jak2/STAT1/IRF1 activation, and TNF-α did not cause IκB degradation or NF-κB activation in AS2 cells. Once we excluded a possible deficiency of IFN-γ and TNF-α receptors in AS2 cells, we found that SHP2, but not SOCS1 or SOCS3, was abnormally activated in AS2 cells, leading to this resistance, specifically in IFN-γ signaling and ICAM-1 expression. Consistent with previous studies,32–34 our results indicated that aberrant SHP2 activation and/or overexpression may cause IFN-γ resistance by interfering with Jak2/STAT1 activation. However, silencing SHP2 in AS2 cells did not reverse the TNF-α response, suggesting that TNF-α resistance is independent of SHP2 (data not shown).
The possible mechanisms underlying SHP2 activation in AS2 cells were further investigated in this study. We previously showed that inhibiting GSK-3β increases SHP2 activation and causes a decrease in IFN-γ-activated Jak2/STAT1/IRF1.35,40 Other studies have demonstrated a regulatory role for GSK-3β in facilitating the autophagy-associated unc-51-like kinase 1 complex signaling pathway. 60 In this study, we showed that GSK-3β is inactive in AS2 cells. Thus, constitutive GSK-3β inactivation may be required for resistance to cytokines and autophagy. Our previous studies also showed that inhibiting SHP2 increases IFN-γ-induced STAT1 phosphorylation and that SHP2 activation plays a role in the inhibition of IFN-γ signaling in autophagy-deficient Atg5-/- cells. 29 A number of reports have shown that autophagy-deficient cells have defective mitochondrial clearance, resulting in increased ROS production.29,61,62 Excessive ROS generation can decrease IFN-γ-induced Jak2/STAT1 activation and promote direct SHP2 activation via disruption of the redox balance.29,44,63 In AS2 cells and Atg5-deficient A549 cells, the levels of intracellular and mitochondrial ROS, and the number of mitochondria, were significantly increased (Supplementary Figure 1). In addition to GSK-3β inactivation, oxidative stress may also facilitate SHP2 activation, leading to IFN-γ resistance in AS2 cells with autophagic resistance.
After determining that AS2 cells and Atg5-deficient A549 cells showed resistance to IFN-γ and TNF-α stimulation, this study characterized several possible regulators of autophagy, including autophagy-suppressing factors (class I PI3K/Akt/mTOR and Bcl-2/Beclin-1) and autophagy-promoting factors (Ras/ERK and PTEN),46,49–56 for autophagic inhibition and cytokine resistance. The signaling involved in autophagic regulation is complicated. Basically, the oncogenes Bcl-2, mTOR and Ras, and the tumor suppressor PTEN are known to play critical roles; however, the role of autophagy in cancer development remains controversial.49–51,64 In this study, Bcl-2 overexpression and Akt/mTOR hyperactivation, which are regulated by unknown mechanisms, were identified in AS2 cells, but not A549 cells. The manipulation of Bcl-2 and mTOR allowed further characterization of their roles in autophagic inhibition followed by IFN-γ and TNF-α resistance. Our findings implicate that oncogenic Bcl-2 and mTOR may act not only to inhibit the response to apoptotic stimuli,53,65 but also to allow the cell to escape from the immunosurveillance of IFN-γ-mediated anticancer activities by interfering with autophagy. Additionally, A549 cells displayed autophagy-promoting Ras/ERK signaling and PTEN overexpression compared with AS2 cells. However, inhibiting Ras did not decrease IFN-γ-induced STAT1 activation or ICAM-1 expression (Supplementary Figure 4). The potential roles of decreased PTEN and other regulators in cytokine resistance require further verification.
ICAM-1-mediated leukocyte infiltration is critical for processing pulmonary inflammation in endotoxemic lung injury.66–68 A recent study showed that the pharmacologic inhibition of mTOR using rapamycin exacerbated LPS-induced lung injury, which is characterized by the infiltration of inflammatory cells, hemorrhage, thickened alveolar septae and proteinaceous exudates, by enhancing STAT1-mediated pro-apoptotic signaling. 69 Consistent with these findings, we showed that both rapamycin and mTOR knock down increased IFN-γ and TNF-α activation and ICAM-1 expression. Conversely, inhibiting autophagy decreased ICAM-1 expression and monocyte adhesion. While IFN-γ and TNF-α involvement is associated with endotoxemic lung injury, it will be important to investigate whether rapamycin-induced autophagy or the inhibition of autophagy alters the sensitivity of cytokine signaling in endotoxemic lung injury, particularly in terms of immune cell infiltration following ICAM-1 up-regulation. ICAM-1 inhibition can be used as a therapeutic strategy to treat inflammation, autoimmunity and cancers. 70 As shown in AS2 cells, cytokine resistance was also found to be associated with autophagic resistance and was, at least partly, regulated by Bcl-2 and mTOR. Regarding the oncogenic effects of Bcl-2 and mTOR, in contrast with their roles in inflammation and cancer cell metastasis, resistance to ICAM-1 induction in cells also has oncogenic effects, while cell adhesion molecules may act as tumor suppressors. 71 According to our findings, manipulating autophagy may alter the cellular susceptibility to cytokine responses, such as IFN-γ- and TNF-α-induced ICAM-1 expression during inflammation.
Footnotes
Funding
This work was supported by grant NHRI-EX99-9917NC from the National Health Research Institutes and grant NSC 100-2320-B-006-009-MY3, Taiwan.
Acknowledgements
We thank the Immunobiology Core of the Research Center of Clinical Medicine at the National Cheng Kung University Hospital for providing services that included training, technical support, and assistance with experimental design and data analysis using the Flow Cytometry Core facilities.
References
Supplementary Material
Please find the following supplemental material available below.
For Open Access articles published under a Creative Commons License, all supplemental material carries the same license as the article it is associated with.
For non-Open Access articles published, all supplemental material carries a non-exclusive license, and permission requests for re-use of supplemental material or any part of supplemental material shall be sent directly to the copyright owner as specified in the copyright notice associated with the article.