
Abstract
This study examined the effect of feeding yeast cell wall (YCW) products on the metabolic responses of newly-received feedlot cattle to an endotoxin challenge. Heifers were separated into treatment groups receiving either a Control diet, YCW-A or YCW-C, and were fed for 52 d. Heifers were weighed on d 0, 14, 36, 38 and 52. On d 37 heifers were challenged i.v. with LPS [0.5 µg/kg body weight (BW)] and blood samples were collected relative to LPS challenge. Heifer BW increased from d 0 to 36 and from d 38 to 52, but was not affected by treatment. Post-LPS, glucose concentrations increased and were less in YCW-A than Control and YCW-C heifers. Pre-LPS, insulin concentrations were greater in YCW-A and YCW-C than Control heifers. Post-LPS, insulin concentrations increased with YCW-C having greater insulin than Control heifers. Pre-LPS, NEFA concentrations tended to be less in YCW-C than Control heifers. Post-LPS non-esterified fatty acids (NEFA) concentrations were less in YCW-C than Control and YCW-A heifers. Post-LPS, blood urea nitrogen (BUN) concentrations were greater in YCW-A than Control and YCW-C. These data indicate, based on NEFA and BUN data, that certain YCW products can enhance energy metabolism during an immune challenge without causing lipolysis or muscle catabolism.
Introduction
The successful clearance of pathogens from the body involves components of the immune system, the stress response and metabolism. The activation and maintenance of the immune system response to an invading pathogen is a very energy-costly process. An increase in core body temperature alone increases an animal’s metabolic rate by 10–13% for a 1℃ increase in body temperature. 1 This does not account for the energy required for the production of inflammatory mediators, acute phase proteins and immunoglobulins. Therefore, a major mediator of the immune response is the energy available to the animal.
As researchers and cattle producers continue to adjust management practices in order to maximize productivity and decrease morbidity, feed supplements that have the potential to influence these economic parameters are of increasing demand. A previous study utilizing a chromium propionate feed supplement found differences in metabolites that helped to explain enhancement of the immune response to an endotoxin challenge. 2 Live yeast and yeast cell wall (YCW) products have been shown to enhance the health of cattle. Specifically, yeast products have been demonstrated to improve dry matter intake and average daily gain, while decreasing cattle morbidity.3–5 Additionally, studies have demonstrated that yeast supplementation can increase serum IgA concentrations, circulating T and B lymphocytes, and modulate neutrophil function in dairy cattle.6–8 The use of YCW products may be more advantageous compared with live yeast products, as the concentration of important cell wall components, such as β-glucans, are concentrated in YCW products, therefore enhancing their effects. Following observed differences in the physiological (vaginal temperature) and acute-phase responses (cortisol, IL-6) in heifers supplemented with two different YCW products, 9 the hypothesis that the differences could be a result of differences in metabolism was developed. Therefore, this study was designed to determine the effect of supplementing two different YCW products on the metabolic response of newly-received feedlot heifers to an LPS challenge.
Materials and methods
Experimental design
All experimental procedures were in compliance with the Guide for the Care and Use of Agricultural Animals in Research and Teaching and approved by the Institutional Animal Care and Use Committee of Texas Tech University (approval number 10079-11).
Diet composition.
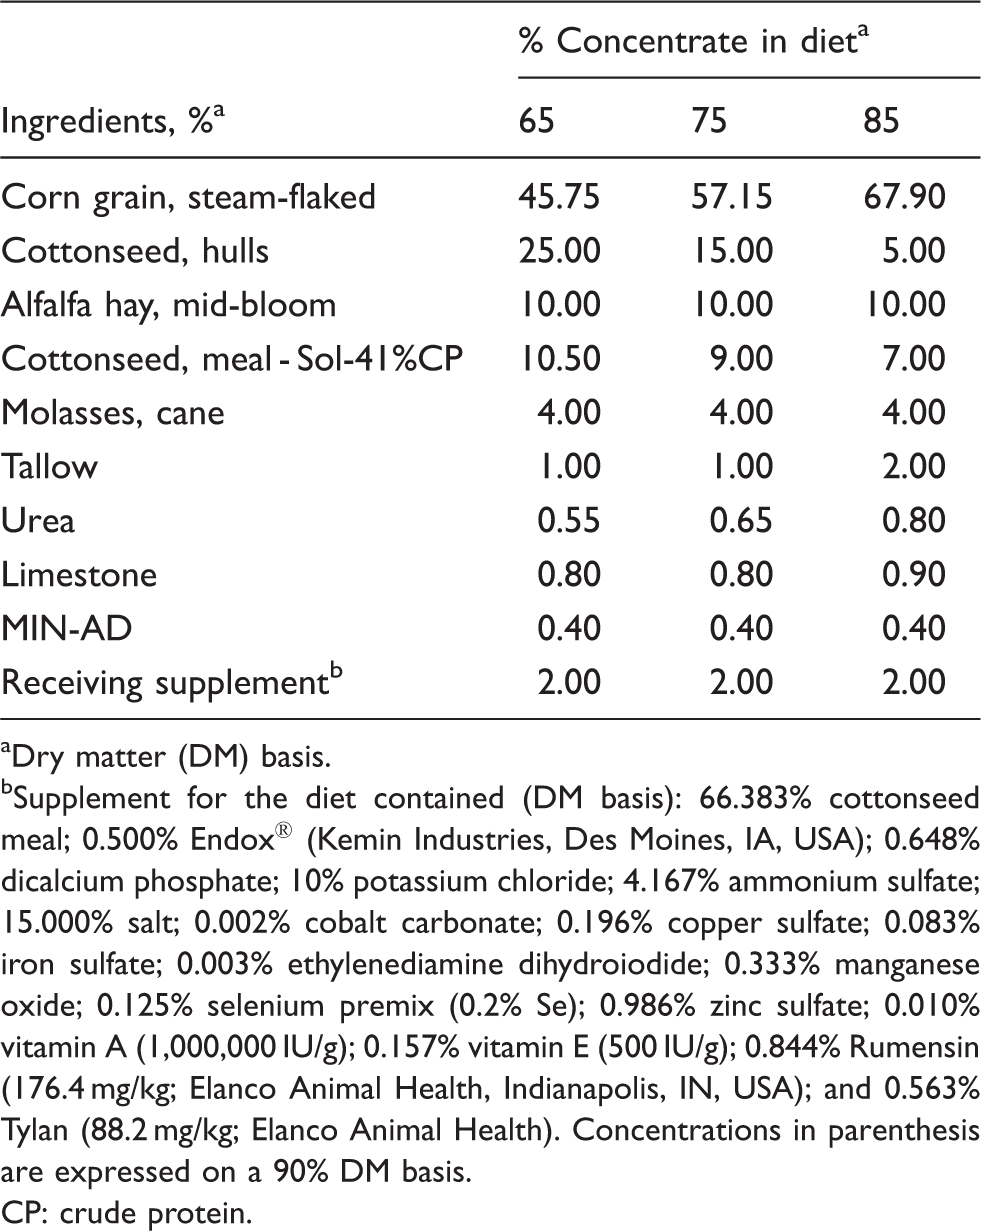
Dry matter (DM) basis.
Supplement for the diet contained (DM basis): 66.383% cottonseed meal; 0.500% Endox® (Kemin Industries, Des Moines, IA, USA); 0.648% dicalcium phosphate; 10% potassium chloride; 4.167% ammonium sulfate; 15.000% salt; 0.002% cobalt carbonate; 0.196% copper sulfate; 0.083% iron sulfate; 0.003% ethylenediamine dihydroiodide; 0.333% manganese oxide; 0.125% selenium premix (0.2% Se); 0.986% zinc sulfate; 0.010% vitamin A (1,000,000 IU/g); 0.157% vitamin E (500 IU/g); 0.844% Rumensin (176.4 mg/kg; Elanco Animal Health, Indianapolis, IN, USA); and 0.563% Tylan (88.2 mg/kg; Elanco Animal Health). Concentrations in parenthesis are expressed on a 90% DM basis.
CP: crude protein.
Chemical composition of control diet bunk samples.
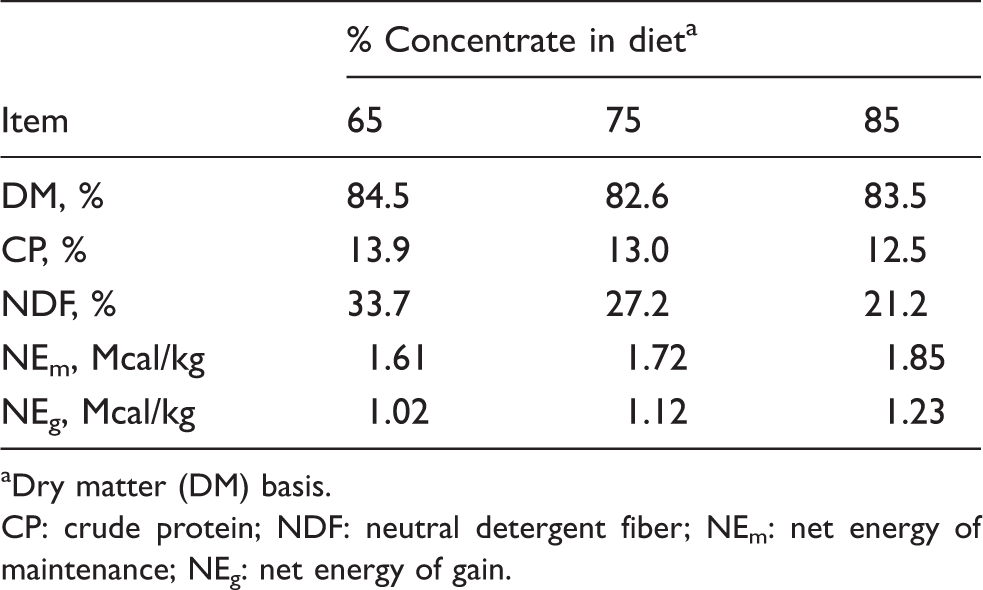
Dry matter (DM) basis.
CP: crude protein; NDF: neutral detergent fiber; NEm: net energy of maintenance; NEg: net energy of gain.
On d 36, heifers were fitted with indwelling jugular vein cannulas. For the jugular cannulation procedure a small, 2–3 cm incision was made in the skin to more easily access the jugular vein. Temporary indwelling jugular cannulas, consisting of approximately 30.48 cm of sterile Tygon® tubing (AAQ04133; US Plastics, Lima, OH, USA; 1.27 mm i.d. and 2.286 mm o.d.), were inserted into the jugular vein using a 14-gauge by 5.08-cm thin-walled stainless steel biomedical needle (o.d. = 3 mm). The catheter was maintained in place using tag cement and a 2.08-cm-wide porous surgical tape around the incision site, and then the entire neck region of the heifers were wrapped with vet wrap (Vetrap™, 3 M Animal Care Products, St. Paul, MN, USA) to ensure stability of the catheterization site. The remaining tubing not inserted into the heifer served as the extension portion of the cannula for collection of blood samples. During these procedures heifers were restrained in a working chute for approximately 10–15 min. Following these procedures heifers were moved to a facility that contained individual stalls (2.13 m long × 0.76 m wide) that housed the heifers through the duration of the study. Heifers were placed so that treatments were alternated by stall. During the challenge the heifers had ad libitum access to feed and water. The extension tubing of the cannula was extended above the stall to allow researchers to collect blood throughout the study without disturbing the heifer, whether the heifers were standing or lying down. On d 37, whole blood samples were collected into blood tubes containing no additive every 0.5 h beginning 2 h prior to and continuing 8 h after administration of LPS (0.5 µg/kg BW; Escherichia coli O111:B4; Sigma-Aldrich, St. Louis MO, USA) and again at 24 h. Whole blood was allowed to clot for 30 min and serum was collected after centrifugation at 1250 g for 20 min at 4℃. Serum was stored at −80℃ until analyzed for glucose, insulin, non-esterified fatty acids (NEFA) and blood urea nitrogen (BUN) concentrations. Prior to administration of LPS, a jugular cannula became dislodged from 1 YCW-A heifer; therefore, data presented represent 23 heifers (Control, n = 8; YCW-A, n = 7; YCW-C, n = 8).
Serum analyses
All serum samples were analyzed in duplicate. Serum glucose concentrations were determined by modification of the enzymatic Autokit glucose (Wako Diagnostics, Richmond, VA, USA) to fit a 96-well format. Briefly, 300 µl of prepared working solution was added to 2 µl of serum or prepared standards in a 96-well plate. Plates were incubated at 37℃ for 5 min and then read using a plate reader at 505 nm. Concentration of glucose was determined by comparing unknown samples to a standard curve of known glucose concentrations. The minimum detectable concentration was 3.8 mg/dl and the intra- and inter-assay coefficients of variation were 8.0% and 7.6% respectively. Data are presented as the concentration in mg/dl.
Insulin concentrations were determined by a bovine-specific insulin ELISA, according to the manufacturer’s instructions (Cat # 80-INSBO-E01; Alpco Diagnostics, Salem, NH, USA). The minimum detectable concentration was 0.1 ng/ml and the intra- and inter-assay coefficients of variation were 3.6% and 8.8% respectively. Data are presented as the concentration in ng/ml.
Concentrations of NEFA were determined by modification of the enzymatic HR Series NEFA-HR (2) assay (Wako Diagnostics) to fit a 96-well format. Briefly, 200 µl of the prepared Color Reagent A were added to 5 µl of serum or prepared standards in a 96-well plate. Plates were incubated at 37℃ for 5 min and then absorbance read using a spectrophotometer at 550 nm. Next, 100 µl of prepared Color Reagent B was added to all wells on the 96-well plate. Plates were incubated for an additional 5 min and read for a second time using a plate reader at 550 nm. Concentrations of NEFA were determined by comparing unknown samples to a standard curve of known NEFA concentrations. The minimum detectable concentration was 0.0014 mmol/l and the intra- and inter-assay coefficients of variation were 9.0% and 14.3% respectively. Data are presented as the concentration in mmol/l.
Serum concentrations of BUN were determined by a colorimetric assay according to the manufacturer’s directions (K024-H1; Arbor Assays, Ann Arbor, MI, USA) by comparison of unknowns to standard curves generated with known concentrations of urea nitrogen. The minimum detectable BUN concentration was 0.065 mg/dl and the intra- and inter-coefficients of variation were 4.0% and 15.7% respectively. Data are presented as the concentration in mg/dl.
Statistical analyses
Data for glucose, insulin, NEFA and BUN were analyzed using the MIXED procedure of SAS (SAS, Cary, NC, USA) specific for repeated measures with treatment, time, and time × treatment interaction included as fixed effects, and heifer within treatment used as the subject. Specific pre-planned treatment comparisons were made using PDIFF. Data for BW and ADG were analyzed using the MIXED procedure of SAS with treatment included as a fixed effect. For all data, P < 0.05 was considered significant, P ≤ 0.10 to ≥ 0.05 was considered a tendency and P ≤ 0.15 to ≥ 0.10 was considered a trend. Data are presented as the least squares means (LSM) ± SE of the mean.
Results
Performance
Heifer performance before, during and after LPS challenge.
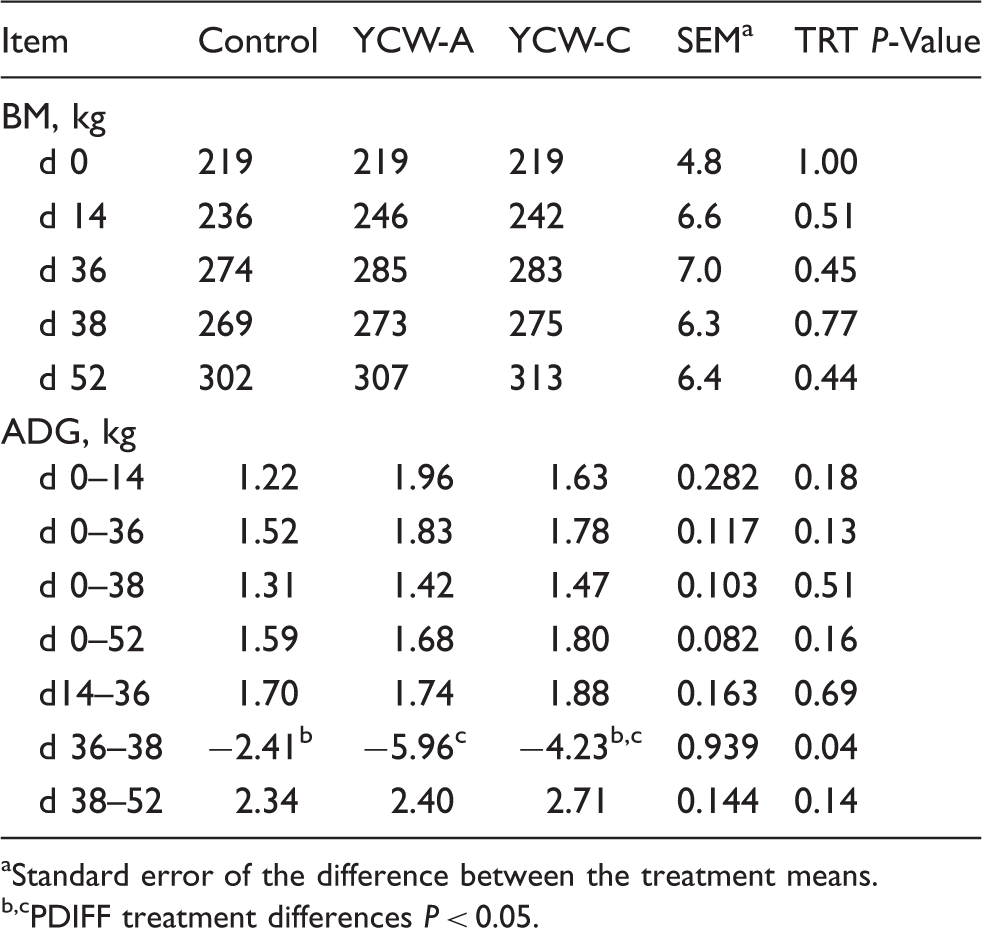
Standard error of the difference between the treatment means.
PDIFF treatment differences P < 0.05.
Glucose
There was no effect of treatment (P = 0.776; 118.0 ± 7.2, 111.4 ± 7.5 and 112.0 ± 7.2 mg/dl for Control, YCW-A and YCW-C heifers respectively) or time (P = 0.289) on serum glucose concentrations prior to administration of LPS (Figure 1). Post-LPS glucose concentrations increased initially (P < 0.001), and peaked 2 h post-LPS in Control heifers and at 3 h post-LPS in YCW-supplemented heifers. Glucose concentrations subsequently decreased below baseline concentrations at 5 h post-LPS in Control heifers and at 5.5 h post-LPS in YCW-supplemented heifers (P > 0.05). Serum glucose concentrations post-LPS were affected by treatment (P = 0.007). Specifically, glucose concentrations were greater in Control (105.6 ± 2.4 mg/dl) and YCW-C heifers (109.5 ± 2.4 mg/dl) compared with YCW-A heifers (98.5 ± 2.5 mg/dl; P = 0.045 and P = 0.002 for Control vs YCW-A and YCW-A vs YCW-C respectively), with no difference between glucose concentrations between Control and YCW-C heifers (P = 0.245). The post-LPS treatment × time interaction was not significant (P = 0.604).
Effect of YCW (YCW-A or YCW-C; 2.5 g/heifer/d) supplementation on the serum glucose response to an endotoxin (LPS; 0.5 µg/kg BW i.v.) challenge (Control, n = 8; YCW-A, n = 7; YCW-C, n = 8). Data presented as LSM ± SEM.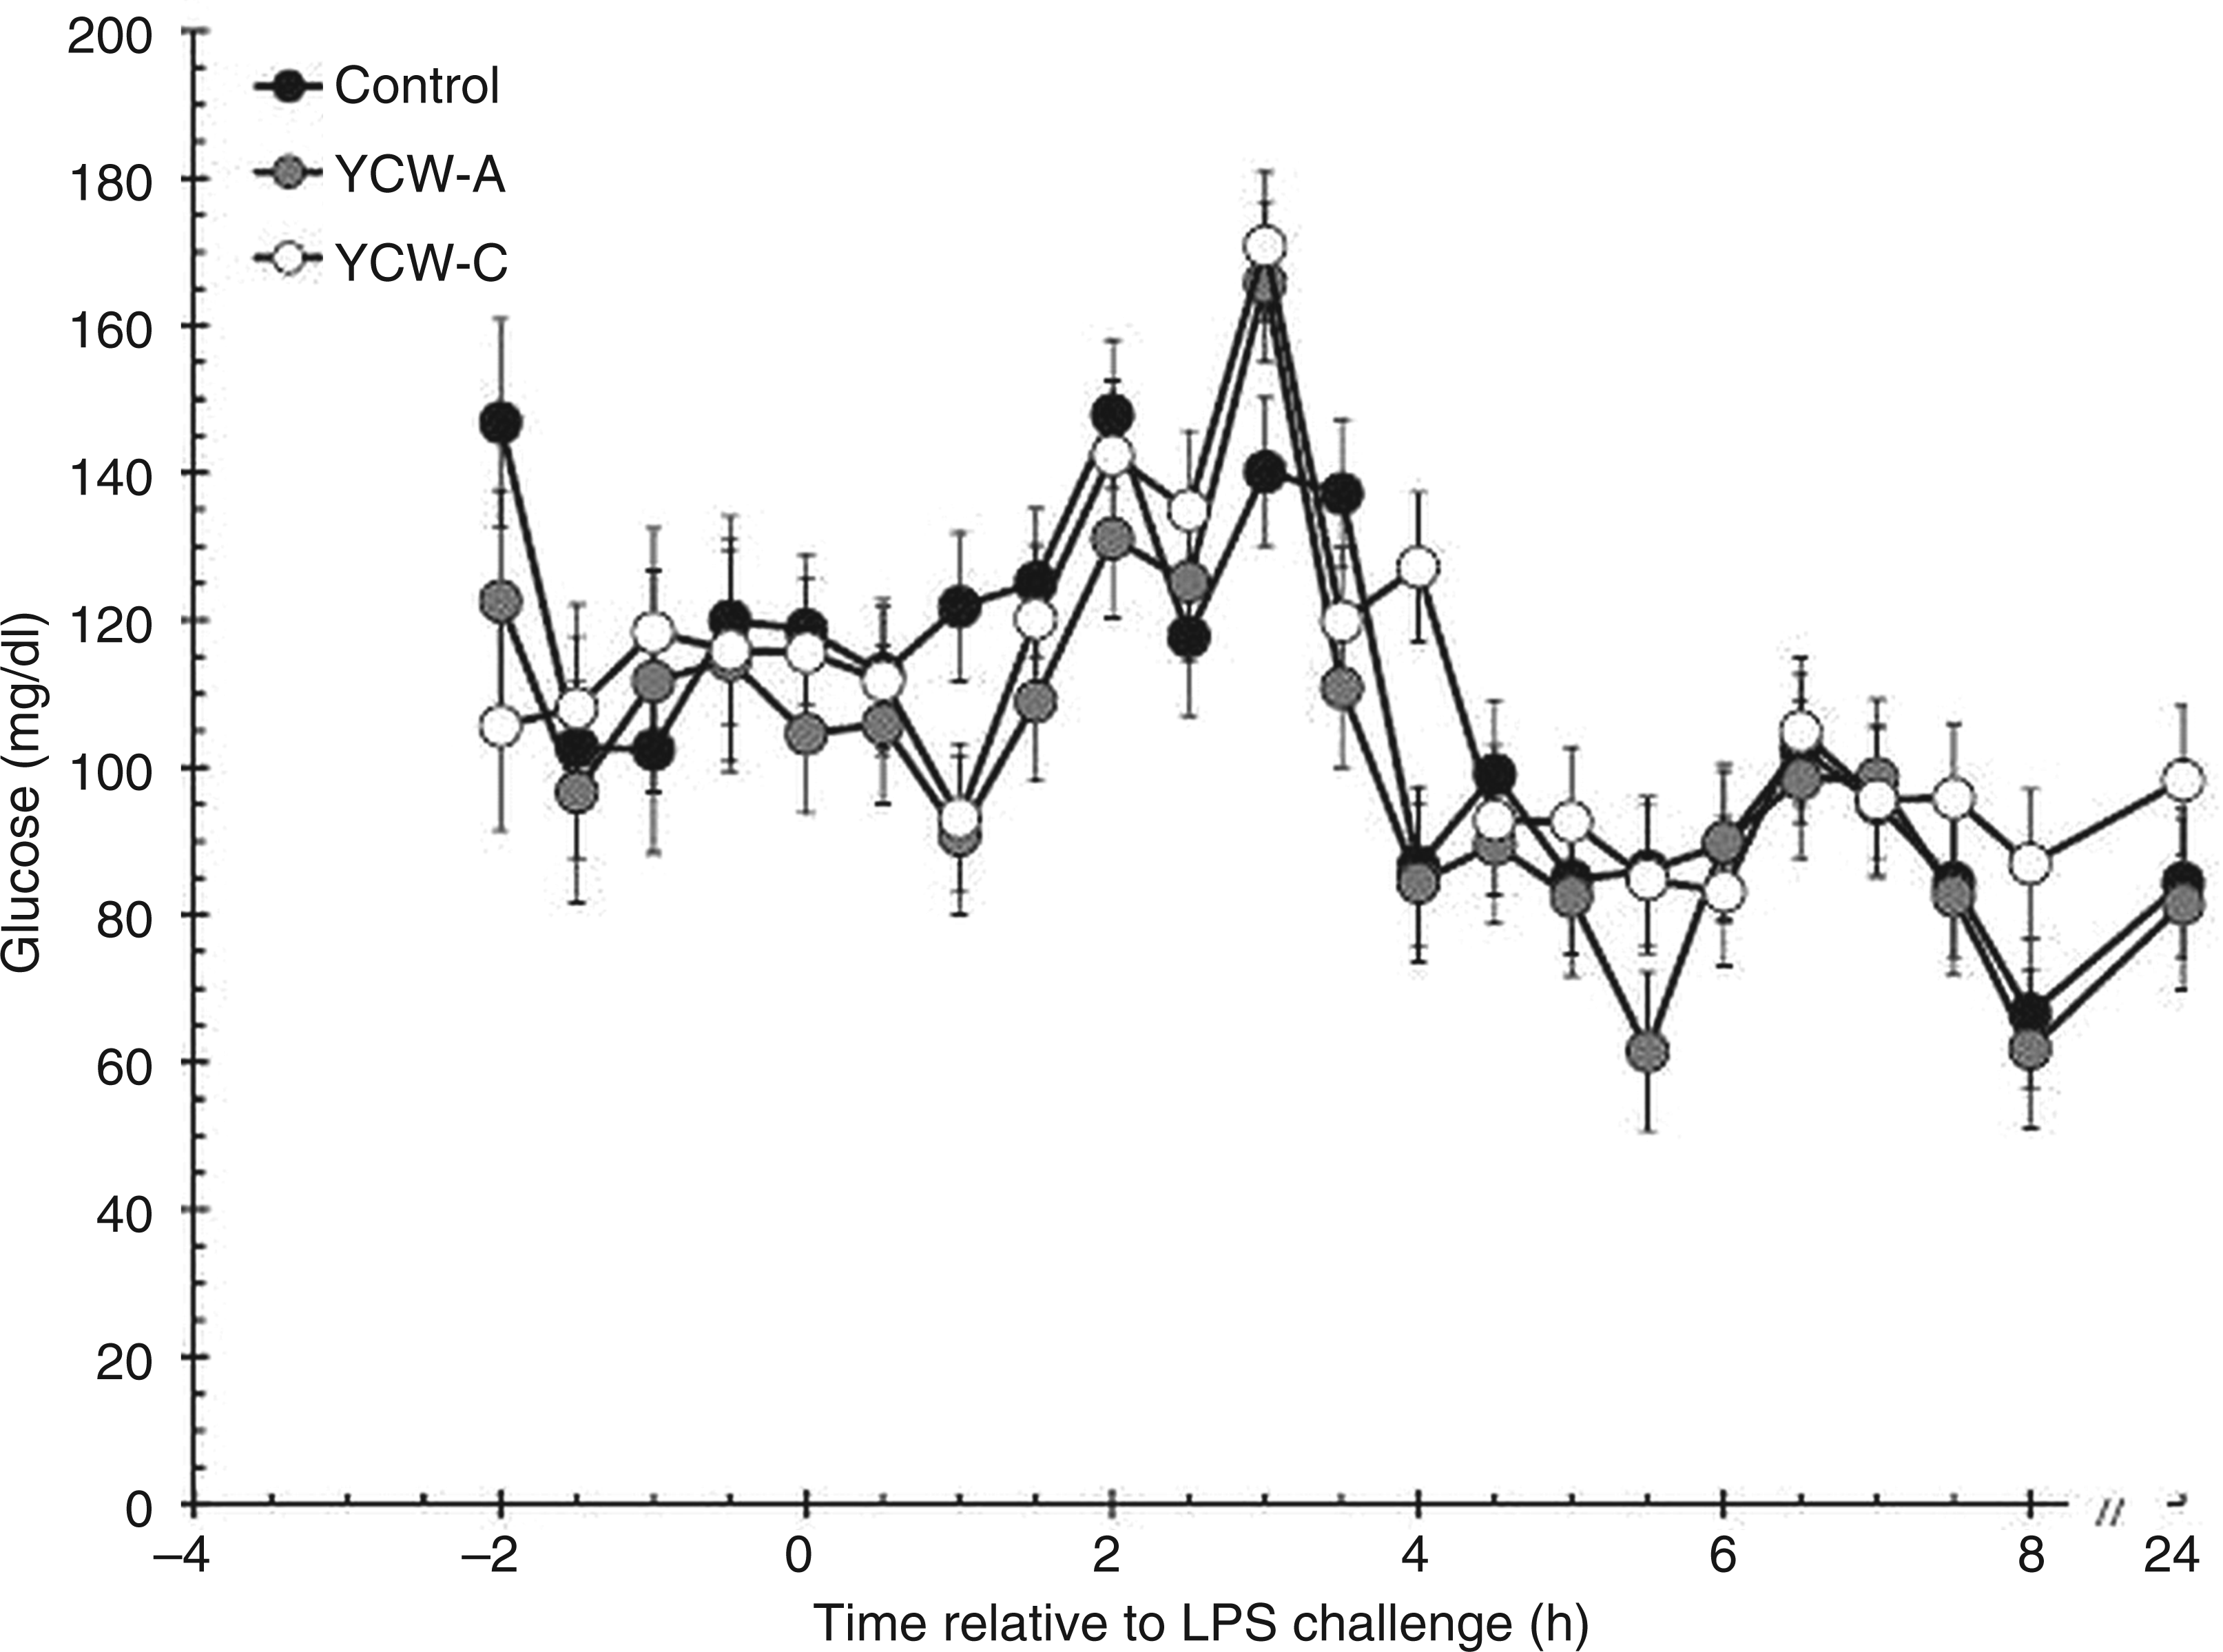
Insulin
Prior to administration of LPS, there was a treatment effect on serum insulin concentrations (P < 0.001; Figure 2). Specifically, insulin concentrations were greater in YCW-A (0.80 ± 0.06 ng/ml) and YCW-C heifers (0.87 ± 0.06 ng/ml) than in Control heifers (0.44 ± 0.06 ng/ml; P < 0.001 for Control vs YCW-A and Control vs YCW-C), with no difference between pre-LPS insulin concentrations between YCW-A and YCW-C (P = 0.367). Following administration of LPS, insulin concentrations increased within 2 h (P < 0.001) in all treatment groups. Post-LPS, insulin concentrations were also affected by treatment (P < 0.001). Specifically, insulin concentrations were greater in YCW-C (0.95 ± 0.04 ng/ml) than in YCW-A (0.71 ± 0.05 ng/ml) and Control heifers (0.59 ± 0.04 ng/ml; P < 0.001 for Control vs YCW-C and YCW-A vs YCW-C). There was a tendency (P = 0.052) for YCW-A heifers to have greater insulin concentrations post-LPS than Control heifers. Insulin concentrations returned to baseline at 2.5 h post LPS in YCW-A heifers and at 3 h post LPS in Control and YCW-C heifers (P > 0.05). There was no significant treatment × time interaction post-LPS (P = 0.981).
Effect of YCW (YCW-A or YCW-C; 2.5 g/heifer/d) supplementation on the serum insulin response to an endotoxin (LPS; 0.5 µg/kg BW i.v.) challenge (Control, n = 8; YCW-A, n = 7; YCW-C, n = 8). Data presented as LSM ± SEM.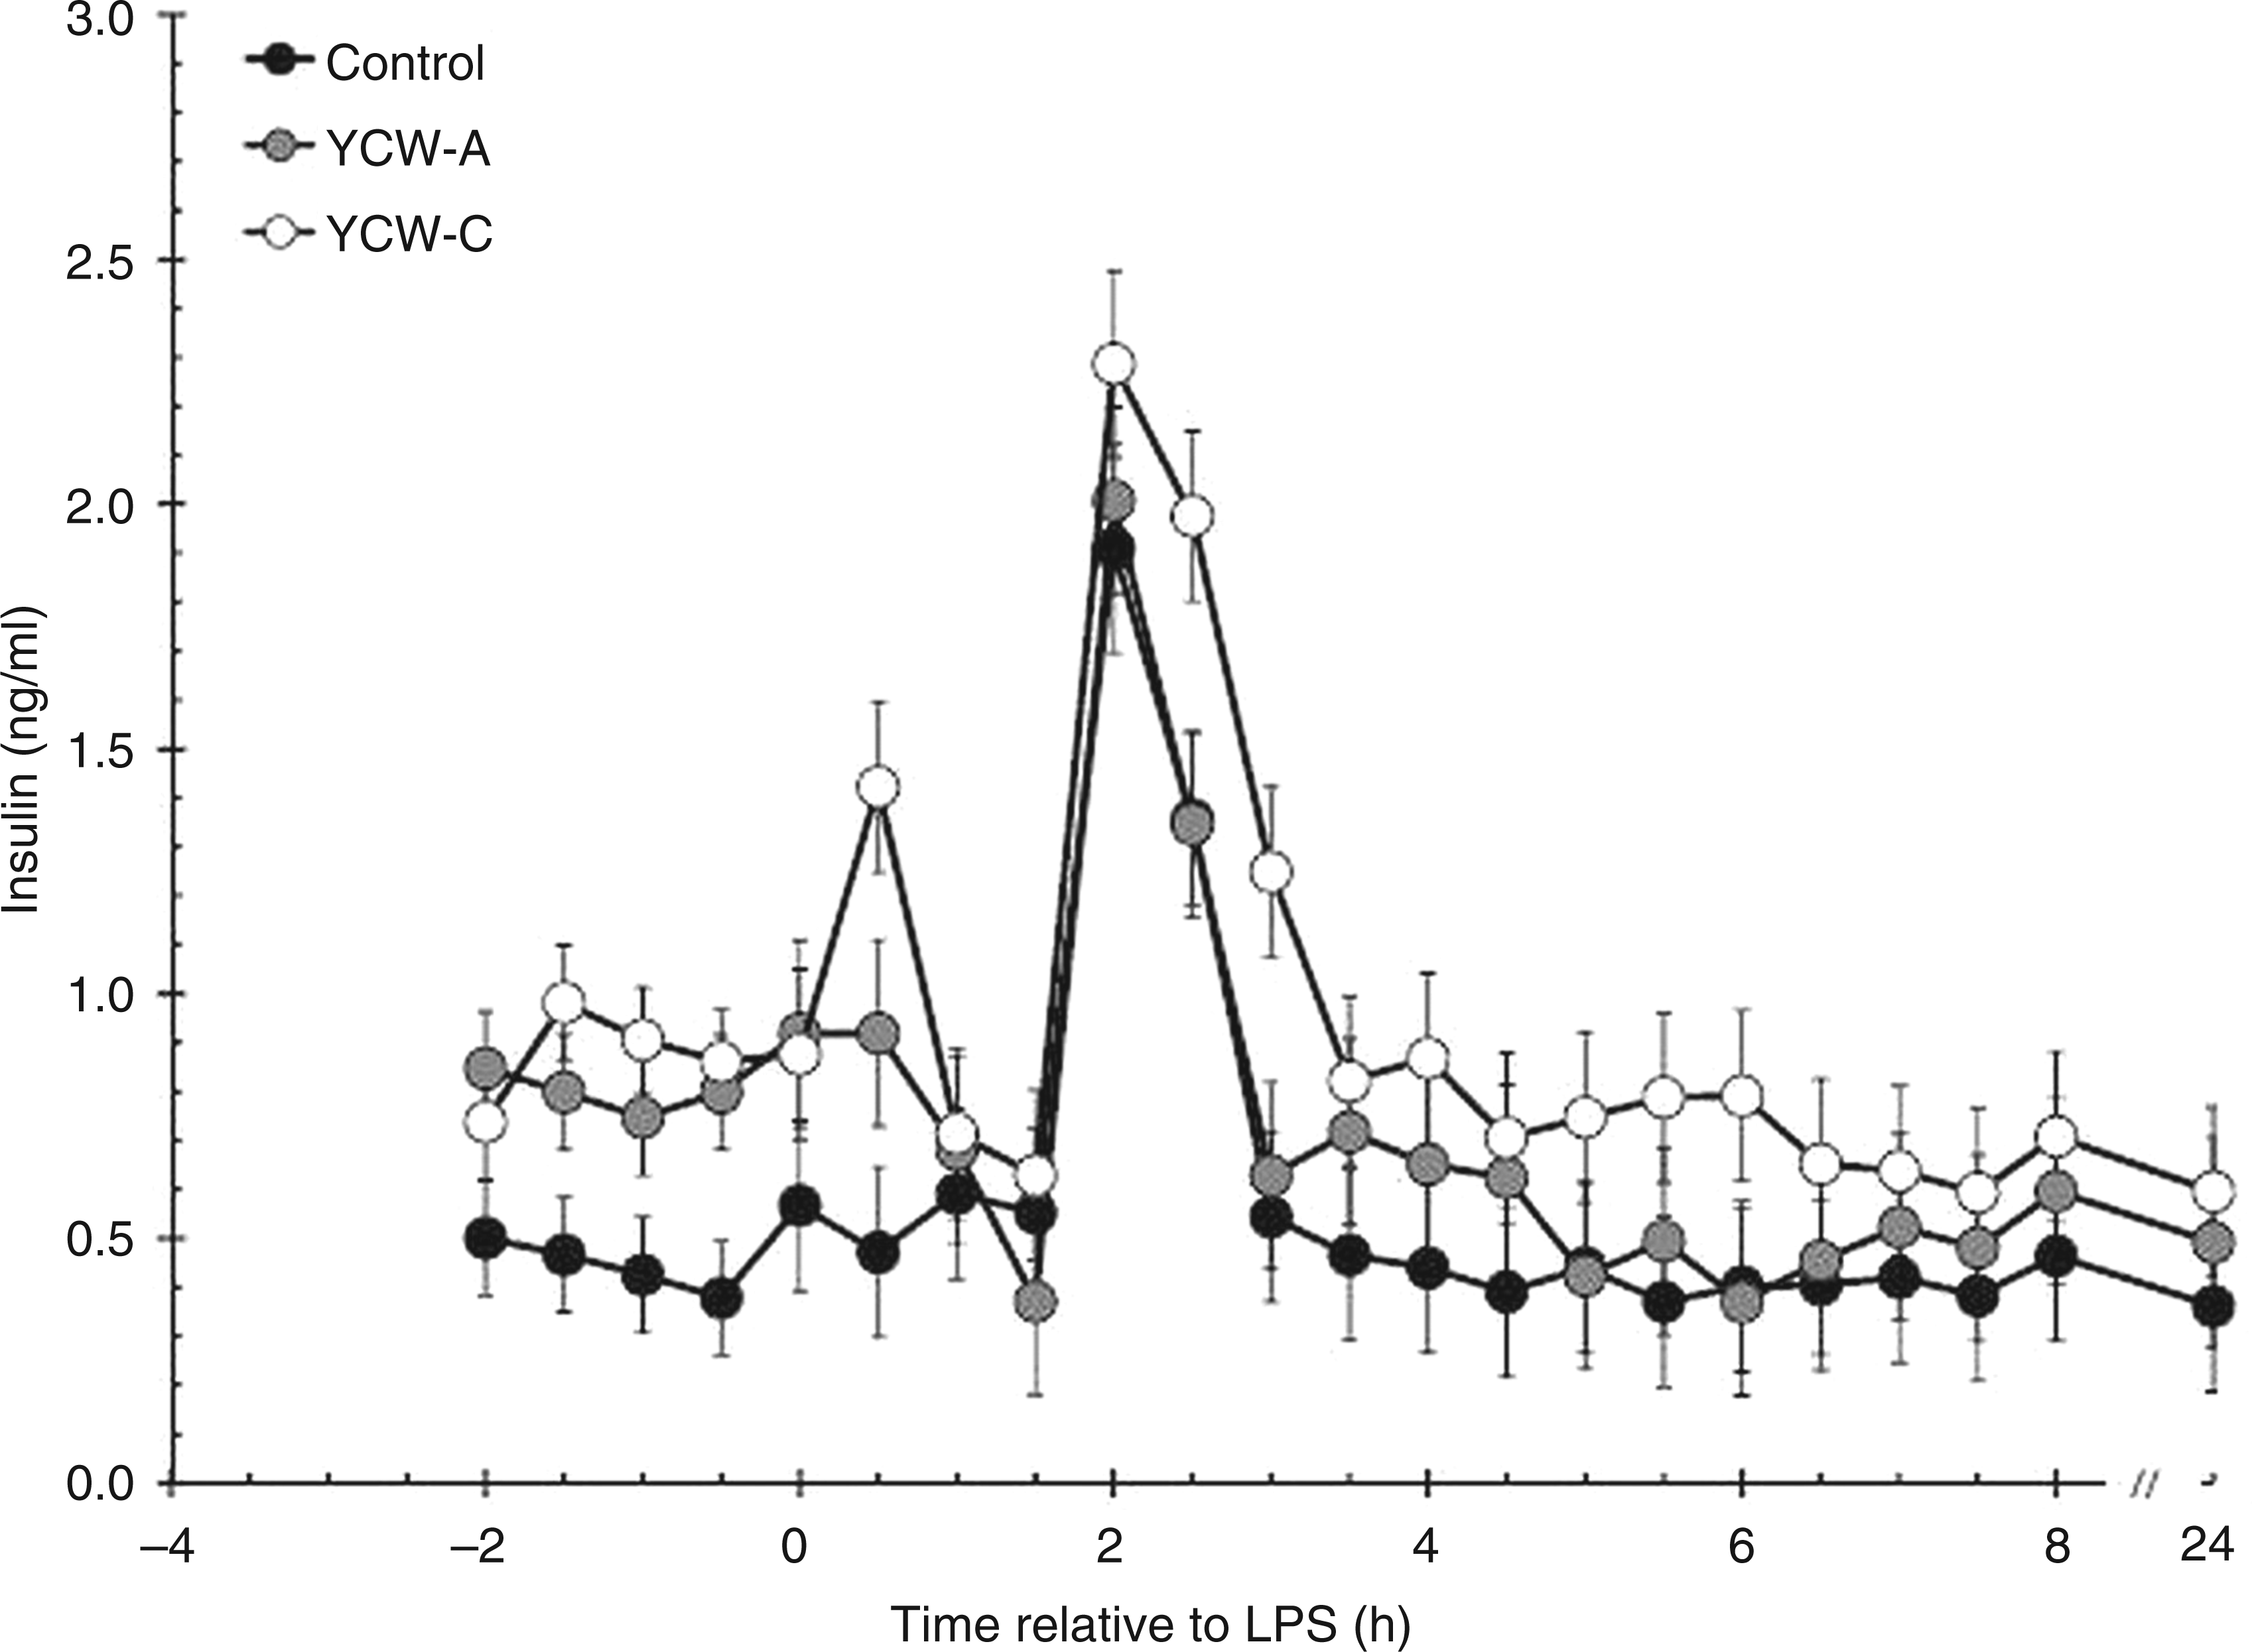
NEFA
There was a tendency (P = 0.073) for an effect of YCW treatment on serum NEFA concentrations prior to LPS administration (Figure 3). Specifically, NEFA concentrations were greater in Control (0.179 ± 0.012 mmol/l) than YCW-C (0.142 ± 0.014 mmol/l; P = 0.031), with YCW-A being intermediate to Control (P = 0.676) and YCW-C (0.171 ± 0.014 mmol/l; P = 0.112). There was an increase in NEFA concentration post-LPS (P < 0.001) in all treatment groups. In addition, NEFA concentrations were affected by treatment post-LPS (P < 0.001). Specifically, NEFA concentrations were greater in Control (0.211 ± 0.007 mmol/l) and YCW-A heifers (0.206 ± 0.008 mmol/l) compared with YCW-C (0.176 ± 0.006 mmol/l; P < 0.001 and P = 0.003 for Control vs YCW-C and YCW-A vs YCW-C respectively) heifers following LPS administration. There was no difference in NEFA concentrations between Control and YCW-A heifers (P = 0.586). The treatment × time interaction post-LPS was not significant (P = 0.997).
Effect of YCW (YCW-A or YCW-C; 2.5 g/heifer/d) supplementation on the serum NEFA response to an endotoxin (LPS; 0.5 µg/kg BW i.v.) challenge (Control, n = 8; YCW-A, n = 7; YCW-C, n = 8). Data presented as LSM ± SEM.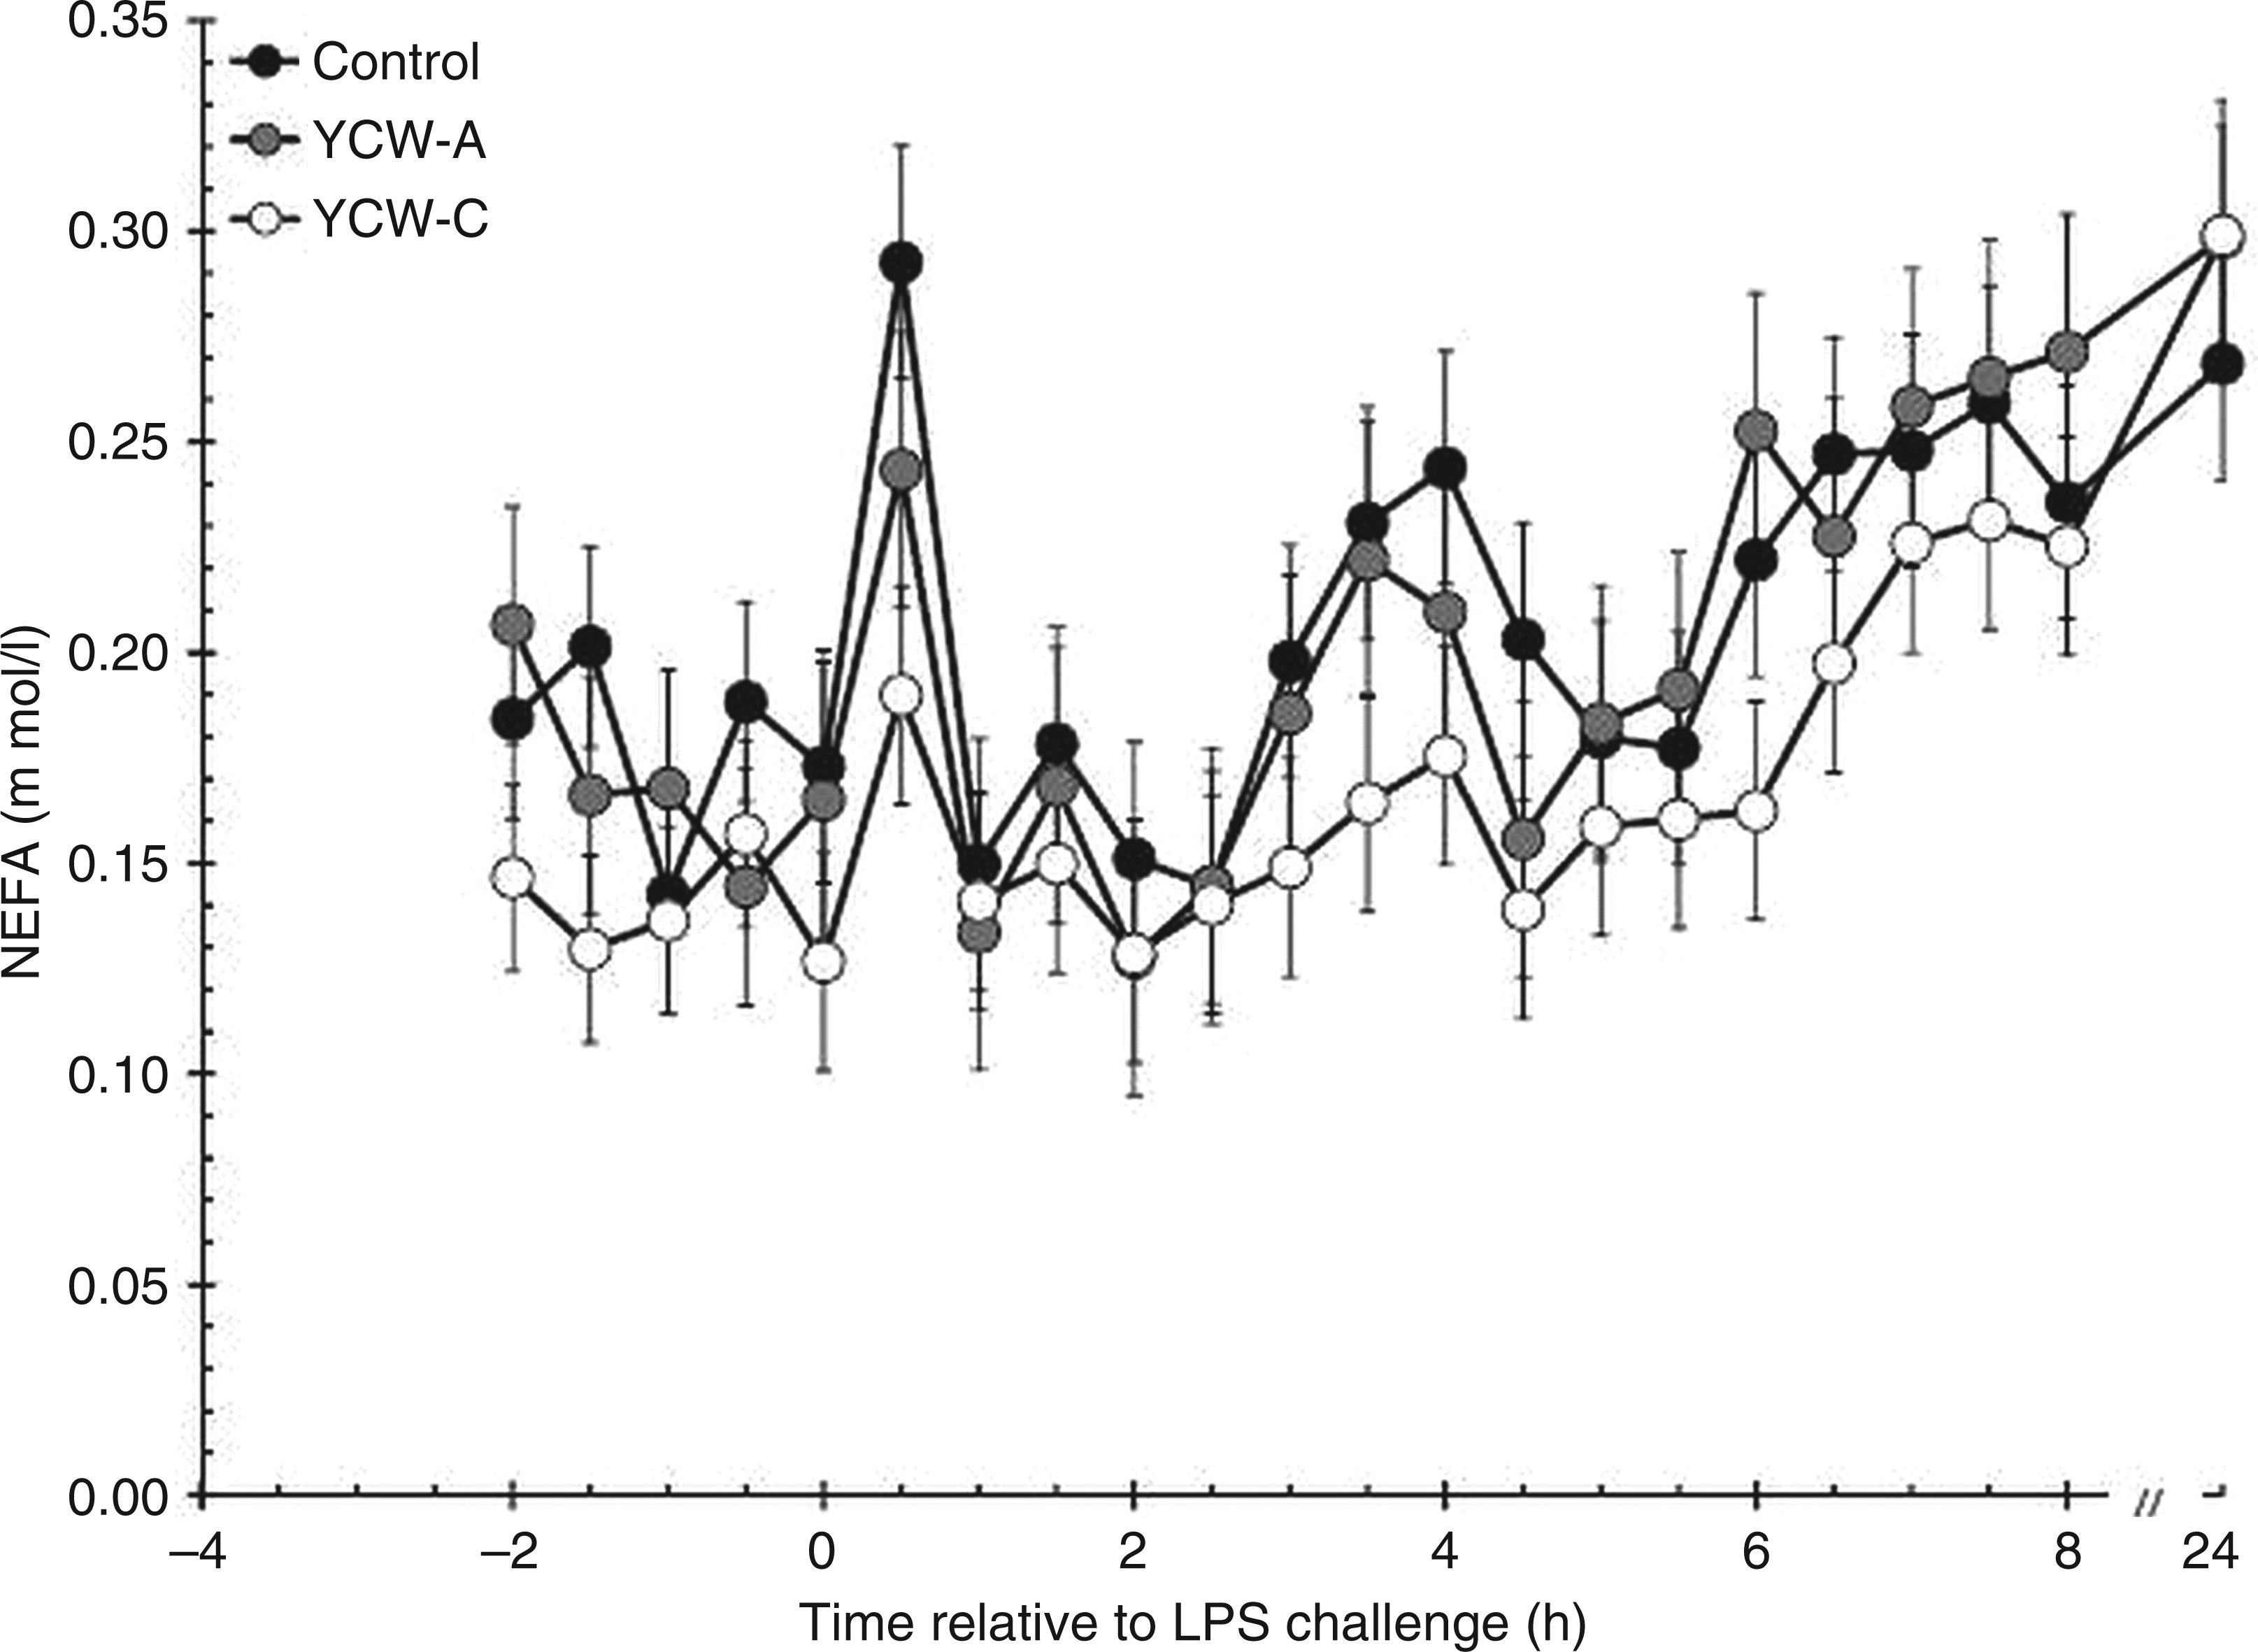
BUN
Serum concentrations of BUN were affected by YCW treatment prior to administration of LPS (P = 0.025; Figure 4). Specifically, BUN concentration was greater in YCW-A (8.2 ± 0.3 mg/dl) than Control heifers (6.9 ± 0.3 mg/dl; P = 0.007), with YCW-C being intermediate (7.5 ± 0.4 mg/dl; P = 0.224 and P = 0.157 for Control vs YCW-C and YCW-A vs YCW-C respectively). In response to administration of LPS, BUN concentrations increased (P < 0.001), and were affected by treatment (P < 0.001). Specifically, YCW-A-supplemented heifers (8.9 ± 0.2 mg/dl) maintained greater BUN concentrations than Control (8.2 ± 0.2 mg/dl; P < 0.001) and YCW-C heifers (8.1 ± 0.2 mg/dl; P < 0.001). There was no difference between post-LPS BUN concentrations between Control and YCW-C heifers (P = 0.634). The post-LPS treatment × time interaction was not significant (P = 1.000).
Effect of YCW (YCW-A or YCW-C; 2.5 g/heifer/d) supplementation on the serum BUN response to an endotoxin (LPS; 0.5 µg/kg BM i.v.) challenge (Control, n = 8; YCW-A, n = 7; YCW-C, n = 8). Data presented as LSM ± SEM.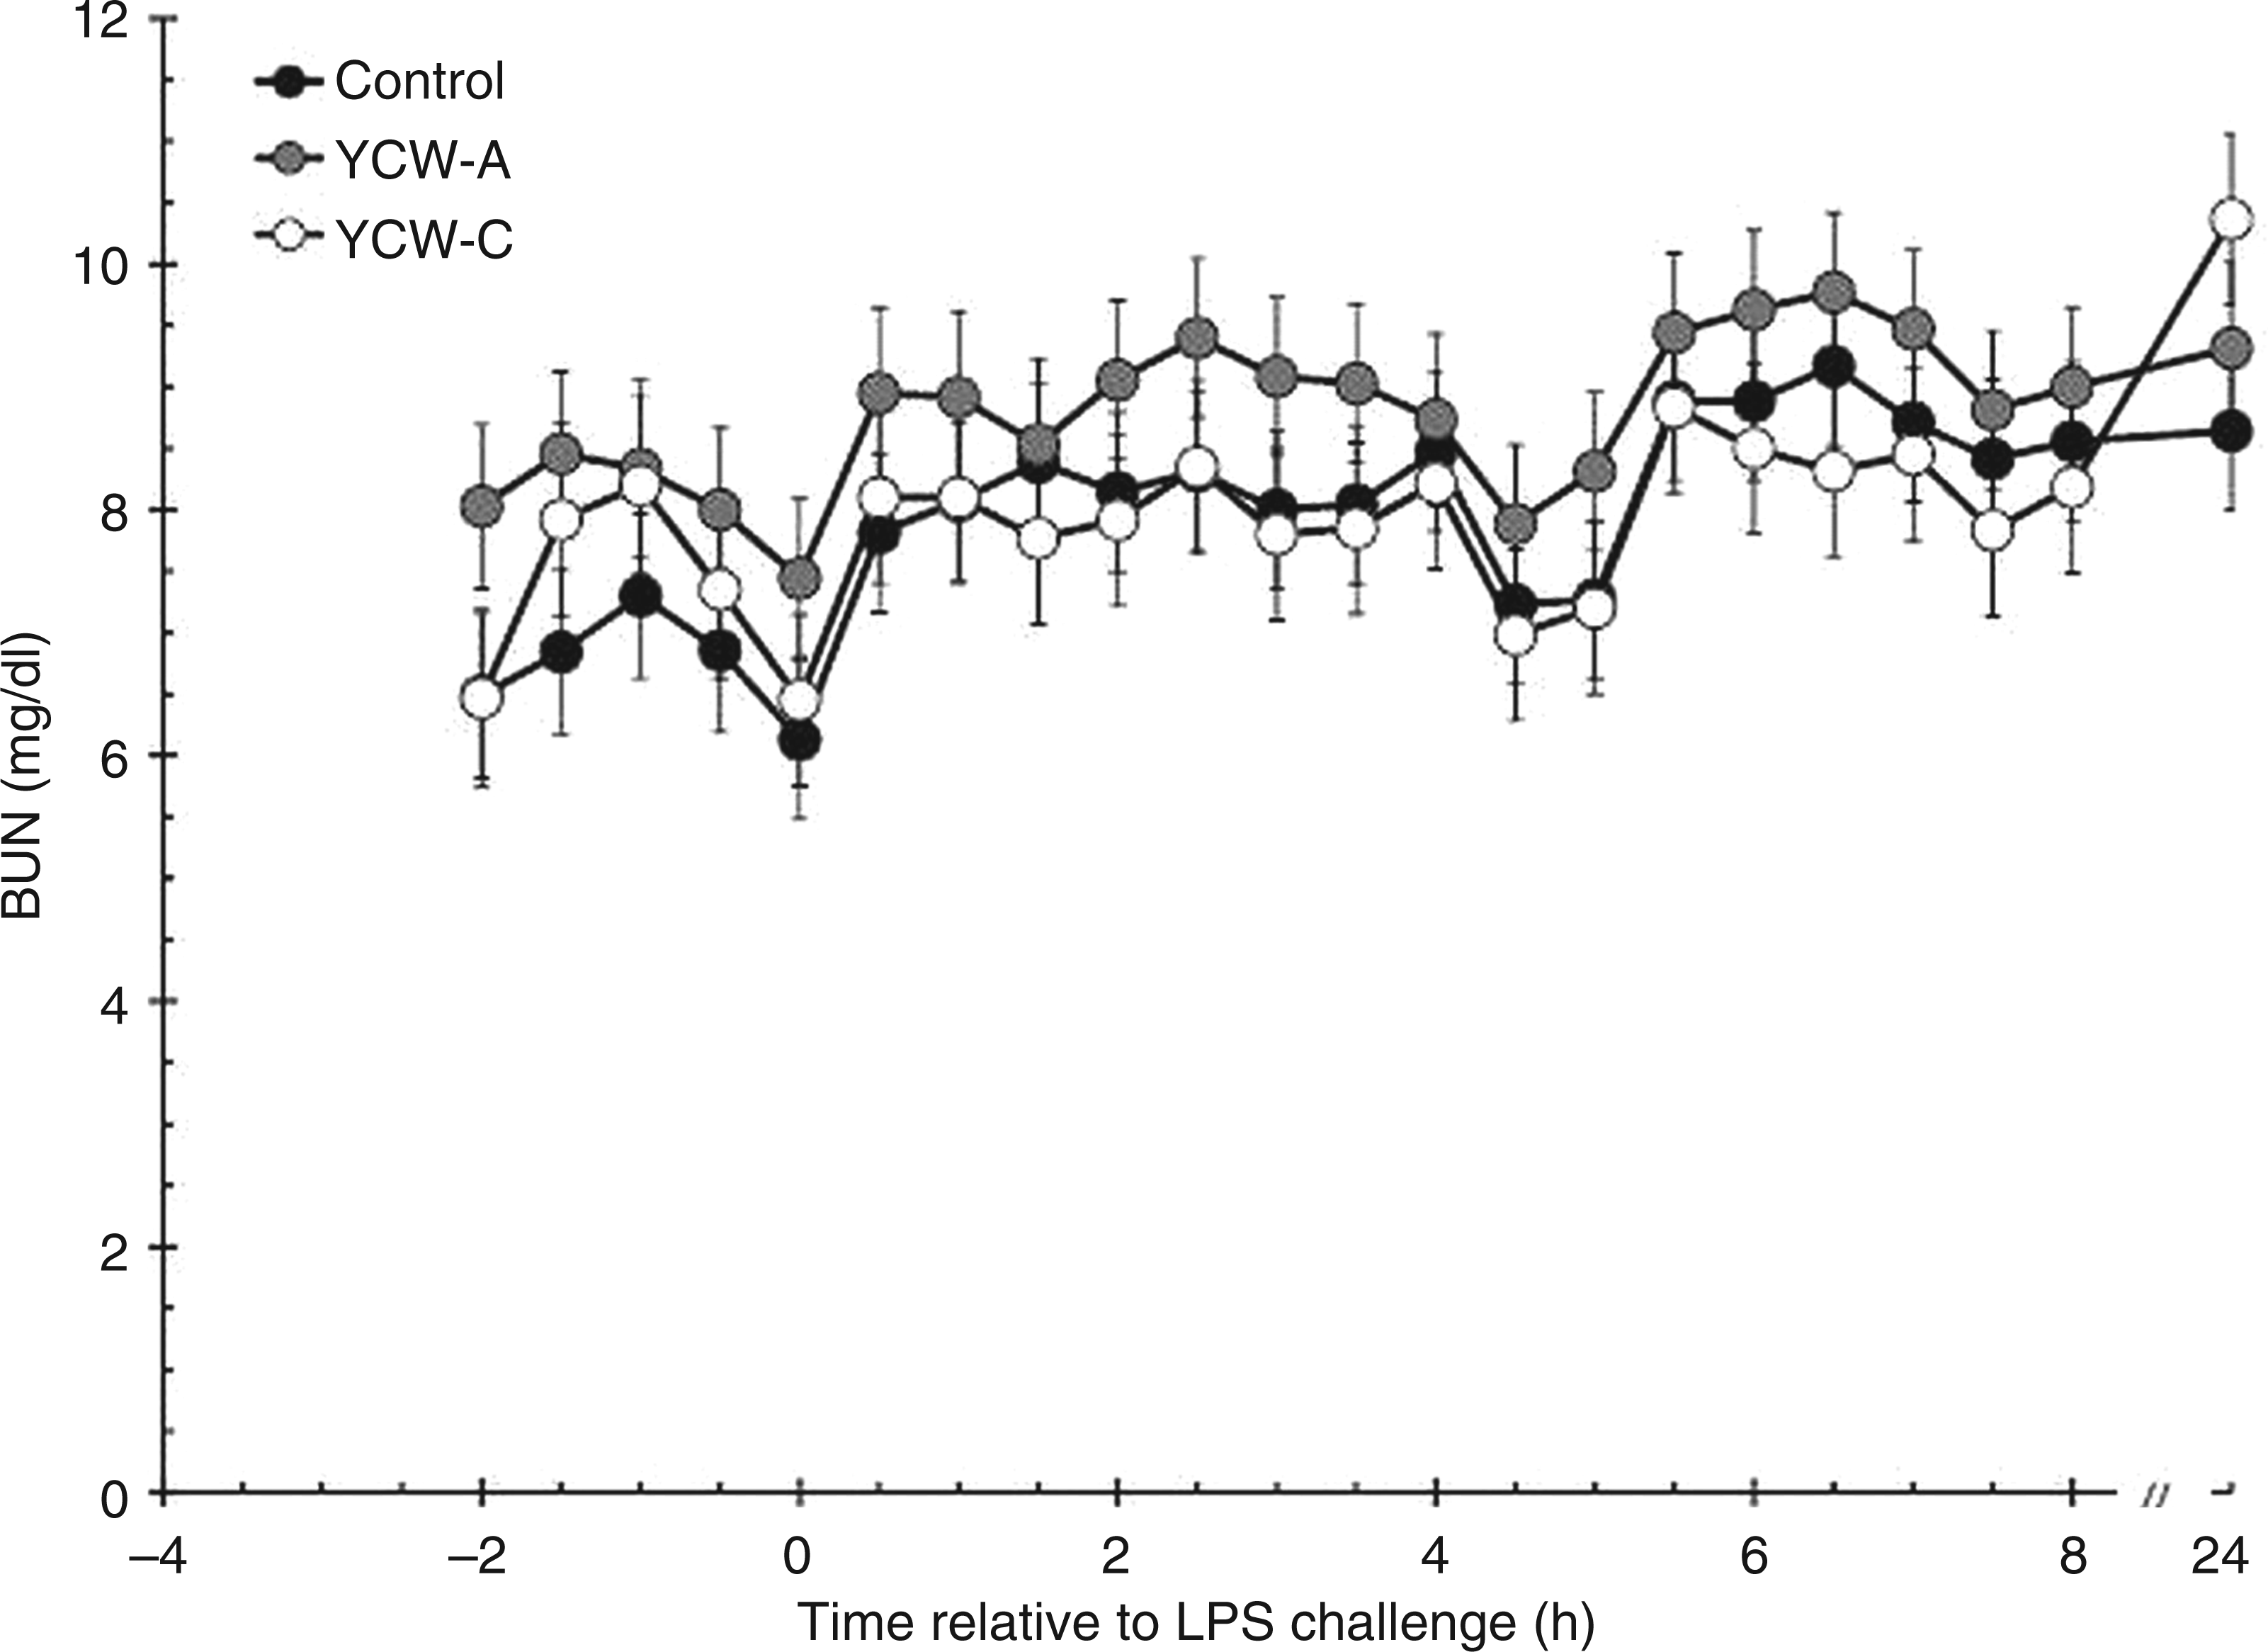
Discussion
This study evaluated differences in metabolites following an LPS challenge in Control or YCW-supplemented newly-received feedlot heifers. Specifically, YCW supplementation altered insulin, NEFA and BUN concentrations prior to, and altered glucose, insulin, NEFA and BUN concentrations following, administration of LPS.
The energy demands of an animal increase significantly in response to an immune challenge. An increase in energy demand of up to 30% has been reported to be required to increase body temperature 1℃.1,11,12 Additionally, the decrease in dry matter intake in response to an immune challenge further increases catabolism of tissues in order to provide energy to the immune system. 12 Therefore, an increase in catabolism and utilization of glucose, fatty acids and protein is not unexpected.
There is limited literature on the effect of yeast supplementation on performance of beef cattle, with most utilizing live yeast rather than YCW products. Studies by Cole et al. 13 and Mir and Mir 14 found no differences in performance of beef cattle supplemented with live yeast. In a recent study, supplementation of live yeast or YCW numerically increased BW and ADG, as well as increased dry matter intake during a 56-d feeding trial. 10 Although there was a tendency for YCW-supplemented heifers to have greater ADG prior to the LPS challenge in the current study, these heifers still lost more BW during the challenge period compared with Control heifers. Nonetheless, YCW-C heifers seemed to have recovered more quickly following the LPS challenge, as reflected by a tendency for a greater ADG in the post-challenge period compared with Control heifers. Measurement of BW and ADG for a longer period of time following LPS challenge may be necessary in order to clarify any possible effect of YCW supplementation on recovery and subsequent growth performance following an immune challenge. Additionally, if the cattle were more fit, as suggested in a companion article, 9 differences between the treatments may not have been as apparent.
Glucose concentrations following LPS administration were greater in Control heifers and YCW-C heifers compared with YCW-A-supplemented heifers. It is possible that a greater amount of glucose was being utilized by tissues in YCW-A-supplemented heifers, leading to lower post-LPS glucose concentrations. Glucose concentrations in the current study were greater compared with a study in dairy cows; 15 yet, while baseline glucose concentrations were greater in dairy heifers, 16 the peak response to LPS was similar to the response observed in the current study. Additionally, glucose concentrations were lower than those observed in Angus-cross steers in response to an LPS challenge. 17 The differences observed between studies may be explained partially by differences in LPS dose, as well as whether or not cattle were fasted prior to and (or) during the LPS challenge. Lower glucose concentrations in YCW-A-supplemented heifers in the present study are supported by greater pre-LPS insulin concentrations in these heifers. This finding suggests that YCW-supplementation might prevent or decrease LPS-induced insulin resistance—a condition which has been observed in rats when LPS, IL-1 or TNF-α was administered.18–20 Baseline insulin concentrations were similar to values reported for dairy cows and heifers,15,16 but were lower than those reported for beef steers. 17 Additionally, the peak insulin response in the current study was lower than reported in the three aforementioned studies.
Concentrations of NEFA remained lower in YCW-C-supplemented heifers than Control heifers both pre- and post-LPS. This finding indicated that YCW-C heifers did not have to break down as much adipose tissue to provide energy for immune defenses. These results are also supported by lower BUN concentrations in Control and YCW-C-supplemented heifers compared with YCW-A-supplemented heifers. Additionally, dry matter intake was greater in the YCW-supplemented heifers in the 36 d prior to and in the 14 d following the LPS challenge (data not shown), which may have also influence pre-LPS concentrations of metabolites and insulin. However, further research is necessary in order to fully understand the implications of these changes prior to LPS administration. Studies have indicated that increases in cytokine concentrations can increase protein catabolism in rats, pigs and cattle.21–24 Specifically, Webel et al. 23 concluded that an increase in concentrations of TNF-α and IL-6 following administration of 5 µg/kg BW LPS to pigs resulted in a peak in plasma urea nitrogen 12 h after injection; however, in the current study, a 12-h sample was not collected. Nonetheless, BUN concentrations were greater in YCW-A heifers than Control and YCW-C heifers, even though YCW-supplemented heifers had lower IL-6 concentrations. 9 Therefore, other factors might contribute to the differences observed in BUN concentrations in Control and YCW-treated heifers.
Glucocorticoids, such as cortisol, can have catabolic effects, resulting in the breakdown of adipose tissue and protein. As indicated in a companion article, cortisol concentrations post-LPS were lower in YCW-supplemented heifers than Control heifers, which may have influenced the release of NEFA and BUN. 9 However, this does not explain the differences in NEFA and BUN concentration observed between YCW-A and YCW-C following administration of LPS. Further research is necessary in order to elucidate metabolic differences observed between YCW-A and YCW-C in response to LPS administration in beef heifers.
The measurement of other metabolic hormones, including growth hormone (GH) and insulin-like growth factor-1 (IGF-I), may be necessary to further understand the complex paradigm associated with nutritional supplementation, growth and metabolism, and immune function. Studies in cattle have demonstrated that both GH and IGF-I concentrations decrease in response to an immune challenge.25,26
Cytokines have also been found to modulate the metabolic response to infection.20,23 Results of a study in pigs indicated that administration of LPS increased concentrations of TNF-α, IL-6, cortisol and plasma urea nitrogen, but did not affect glucose, triglyceride or NEFA concentrations. 23 In a companion article, concentrations of IL-6, but not TNF-α or IFN-γ, were less in YCW-supplemented heifers, which may have influenced the differences observed in the metabolic responses in the current study. 9
Conclusions
The supplementation of newly-received beef heifers with YCW altered the metabolic response to LPS challenge. Specifically, ADG tended to be greater in YCW-supplemented heifers prior to and following (YCW-C only) administration of LPS. Additionally, glucose, insulin, NEFA and BUN concentrations were all altered differently by YCW supplementation. These data circuitously indicate that certain YCW products can enhance the energy metabolism during an immune challenge without causing lipolysis or muscle catabolism. Therefore, alterations in energy utilization during an immune challenge due to YCW supplementation may modulate the energy demand, thus potentially allowing for a more expedient return to homeostasis and an enhanced recovery.
Footnotes
Acknowledgments
Mention of trade names or commercial products in this article is solely for the purpose of providing specific information and does not imply recommendation or endorsement by the U.S. Department of Agriculture. The U.S. Department of Agriculture (USDA) prohibits discrimination in all its programs and activities on the basis of race, color, national origin, age, disability, and where applicable, sex, marital status, familial status, parental status, religion, sexual orientation, genetic information, political beliefs, reprisal, or because all or part of an individual's income is derived from any public assistance program. (Not all prohibited bases apply to all programs.) Persons with disabilities who require alternative means for communication of program information (Braille, large print, audiotape, etc.) should contact USDA's TARGET Center at (202) 720-2600 (voice and TDD). To file a complaint of discrimination, write to USDA, Director, Office of Civil Rights, 1400 Independence Avenue, S.W., Washington, D.C. 20250-9410, or call (800) 795-3272 (voice) or (202) 720-6382 (TDD). USDA is an equal opportunity provider and employer. The authors would like to acknowledge the technical assistance of C. Wu, J.C. Carroll, J.W. Dailey, M.A. Jennings and J.T. Cribbs.
Funding
This study was supported in part by Lesaffre Feed Additives, Milwaukee, WI, USA and the Gordon W. Davis Regents Chair Endowment at Texas Tech University.