
Abstract
Lipopolysaccharide is a major component of the cell wall of Gram-negative bacteria and a potent stimulator of innate immune response via TLR4. Studies on the LPS action both in vivo and in vitro have used different preparations of LPS, including ultra-pure LPS (LIST) and a less pure but less expensive form (Sigma) isolated from Escherichia coli serotype O111:B4. The difference between the effects of these compounds has not been well studied although this information is important in understanding TLR stimulation. In this study, we compared response of RAW264.7 macrophage cells treated LIST or Sigma LPS for 6 h and 24 h. Gene expression data were analyzed to identify specific genes and pathways that are in common and unique to the two LPS preparations. Seven hundred fifty-five genes were differentially expressed at 6 h in response to Sigma LPS and 973 were differentially expressed following LIST LPS treatment, with 503 in common. At 24 h, Sigma LPS induced or repressed 901 genes while 1646 genes were differentially regulated by LIST LPS treatment; 701 genes were shared by two forms of LPS. Although considerably more genes were differentially expressed in response to LIST LPS, similar molecular pathways and transcriptional networks were activated by the two LPS preparations. We also treated bone marrow-derived macrophages (BMMs) from three strains of mice with different concentrations of LIST and Sigma LPS and showed that BMMs produced more IL-6 and TNF-α in response to LIST LPS at low LPS concentrations but, at higher LPS concentrations, more cytokines were produced in response to stimulation by Sigma LPS. Together, these findings suggest that, despite activation of similar molecular pathways by LIST and Sigma LPS preparations, residual protein impurities in the Sigma LPS preparation may nevertheless influence the transcriptional profile attributed to TLR4 stimulation.
Introduction
Macrophages provide the first line of host defense against microbial infections. Upon stimulation by LPS, macrophages secrete cytokines and chemokines that activate the inflammatory response to bacterial pathogens by recruiting phagocytes to sites of inflammation. In addition, LPS stimulates the expression of tissue factor on macrophages; since tissue factor can activate the clotting cascade, its effects can limit the spread of bacterial infection. 1 In response to LPS, macrophages also produce other inflammatory mediators such as nitric oxide and arachidonic acid metabolites. Excessive release of these mediators, however, can result in septic shock, multiple organ failure and acute respiratory distress syndrome. 2
Macrophages recognize microbial components or pathogen-associated molecular patterns (PAMPs) such as LPS using germline-encoded receptors or pattern recognition receptors (PRRs), with TLRs being the most extensively studied family. Binding of LPS to its receptor TLR4 leads to a conformational change in the intracellular domain of TLR4, which in turn initiates TLR signaling mediated by adaptor molecules MyD88 and TRIF. 3 Signaling through the MyD88 adaptor leads to early NF-κB and activator protein-1 (AP-1) activation and pro-inflammatory cytokine production; in contrast, signaling through the TRIF adaptor gives rise to late NF-κB activation and cytokine production as well as the production of type I interferons through interferon regulatory factor 3 (IRF3).
Genome-wide transcriptional profiling of macrophages in response to TLR activation can elucidate gene expression in innate immunity as well as identify novel candidate genes that regulate immune responsiveness and represent new targets of therapy. Previous genomic studies have identified differentially regulated transcripts and transcriptional networks in macrophage cell lines and primary macrophages in response to LPS stimulation, 4 – 9 including Escherichia coli serotype O111:B4 LPS of two different purities.4,7 Lipopolysaccharide can be prepared by trichloroacetic acid, 10 hot phenol-water, 11 or for rough strains phenol-chloroform-light petroleum extraction. 12 Trichloroacetic acid and hot phenol-water extracted LPSs are structurally similar but contain different amounts of nucleic acid and protein impurities.
Most studies on LPS action have used the hot phenol-water-extracted form of LPS manufactured by Sigma Chemical Company (product number 2630) especially for in vivo studies that require large quantities of LPS. This product is prepared from the E. coli serotype O111:B4 by standard hot phenol-water extraction and contains less than 1% of protein. Ultrapure LPS from LIST Biologicals (product number 421) is extracted using the phenol-chloroform-light petroleum method; 12 it is then purified using a modified phenol-water extraction procedure to eliminate residual protein contamination which may affect its activity. 13 This method results in a LPS preparation that lacks detectable protein, as assayed by Western blotting and gold staining.
In this study, we have investigated whether these two LPS preparations differ in their patterns of gene activation that could affect interpretation of their signaling activity. For this purpose, we compared the transcriptional profiles of RAW264.7 macrophages treated with these two preparations of LPS. Using pathway analysis of gene expression data, we have found similar molecular pathways are activated in response to both LPS preparation although differences in the response to LIST and Sigma LPS were detected. These findings suggest that residual protein impurities in the Sigma LPS preparation can affect transcriptional profile attributed to TLR4 and that studies on TLR4 signaling specify the LPS preparation used in the experiments and consider its impact on the analysis.
Materials and methods
Cell culture
RAW 264.7 cells were maintained in RPMI 1640 supplemented with 10% FBS and 200 µg/ml gentamicin (Invitrogen Life Technologies). For stimulation of the RAW 264.7 cell, cells were plated in 6-well culture plates (3 × 10⁶ cells/well) overnight. The overnight growth was performed to allow resting before stimulation. Cells were then washed twice with Opti-MEM (Invitrogen Life Technologies) and stimulated with 50 ng/ml E. coli O111:B4 Ultrapure LPS (List Biological Laboratories) or standard LPS (Sigma). Cells were harvested 6 h or 24 h post-treatment and RNA was extracted using Trizol and following the manufacturer’s protocols (Invitrogen Life Technologies).
Bone marrow macrophages culture
Bone marrow was isolated from the femurs of three different strains of mice to generate bone marrow derived macrophages (BMDMs) using standard methodology. Briefly, bone marrow was harvested from the femurs and tibia, disaggregated, washed, and resuspended in DMEM medium supplemented with 4500 mg/l
Limulus amebocyte lysate (LAL) analysis
Serial dilutions of LIST and Sigma LPS were assayed with a QCL-1000 Chromogenic Endpoint Assay (Lonza) to determine the concentration in endotoxin units (EU). The assay was replicated to validate the results.
Gene expression profiling
Total RNA from three separate treatments and isolations (biological replicates) was used for microarray analysis. Fluorescently labeled cDNA targets were prepared by reverse transcribing 5 µg of total RNA in the presence of aminoallyl-dUTP followed by chemical coupling of NHS-esters of cyanine 3 (Cy3) and cyanine 5 (Cy5) to the aminoallyl linker, according to published protocols. All samples were co-hybridized with the Mouse Universal Cell Line Reference RNA (Stratagene) and hybridizations replicated with the two dyes swapped. We used microarrays containing in situ synthesized 60-mer oligonucleotides with sequences that represent over 20,000 unique well-characterized mouse genes (Agilent Technologies mouse oligo array). Arrays were washed using the recommended SSC washes and scanned on the DNA Microarray Scanner (Agilent Technologies).
Microarray analysis
Image analysis was performed using Agilent Feature Extraction software and lowest-normalized intensities were used in all further analyses performed in TIGR MIDAS and Multiexperiment Viewer. 14 Dye flip replicas were filtered, merged to produce a single expression ratio measure for each gene, and log-base2-transformed. Differentially expressed genes for LPS-stimulated cells versus untreated control were identified using significance analysis of microarrays (SAM) with 100 permutations. 15 Lists of differentially expressed genes in response to LIST and Sigma LPS were compared and analyzed for enriched pathways using the Ingenuity Pathway Analysis (IPA) software. All primary data have been deposited to the Gene Expression Omnibus (GEO) database under accession GSE21548.
Quantitative RT-PCR
Primers were designed using Primer-BLAST and are listed in Supplementary Table 1. RNA was normalized to a concentration of 100 ng/µl and reverse transcribed to cDNA using the Applied Biosystems High Capacity cDNA Reverse Transcription Kit. Each 20-µl PCR contained 20 ng cDNA, 0.5 µ
Results
Genes that are differentially expressed in RAW264.7 macrophages in response to stimulation with the same concentration of LIST ultrapure or Sigma LPS are shown in Venn diagrams in Figure 1 and are listed along with fold-changes and q-values calculated by SAM in Supplementary Tables 2 and 3. As these data indicate, the transcriptional response of RAW264.7 macrophages is stronger to stimulation by ultrapure LPS at both 6 h and 24 h post LPS stimulation. This effect is most likely due to the higher potency of the ultrapure preparation of LPS at the same concentration. To confirm this potency, we performed LAL assays and determined that the ultrapure preparation had 3-fold more endotoxin units (EUs) than the Sigma LPS preparation at the equal concentration. When we compared multiple lots of Sigma and ultrapure LIST LPS, we observed a range of 2–10-fold difference with an average of 3–4-fold; therefore, the preparations we used in this work are representative of the average difference of potency in the two preparations.
Differentially expressed genes in RAW264.7 macrophages (A) 6 h and (B) 24 h post LPS treatment. Differentially expressed genes are defined as those significant at 1% FDR by SAM and with >2-fold up- or down-regulation. LIST LPS genes are shown in yellow circles, Sigma LPS genes are depicted by light blue circles, and the green overlap represents genes shared by the two gene lists.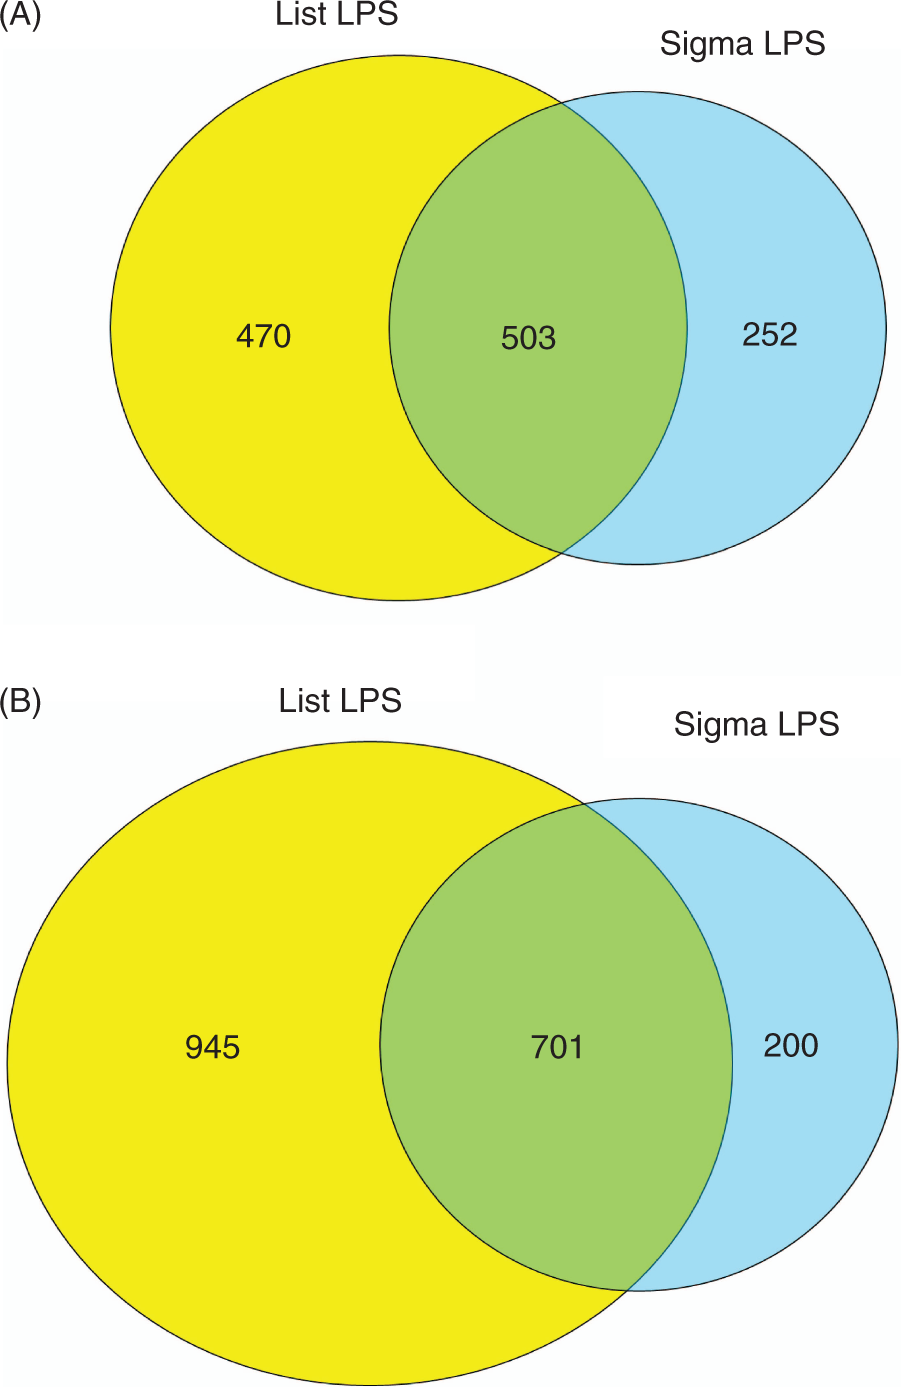
The transcriptional response for both preparations of LPS was also stronger at 24 h than at 6 h post-stimulation. It is expected that longer stimulation by LPS would lead to a more pronounced transcriptional response by the macrophages. However, a portion of this enhanced response is likely attributable to secondary stimulation by cytokines and other inflammatory mediators that were produced initially in response to the primary LPS stimulation. Despite these differences, there is a relatively high degree of overlap of genes that are differentially expressed in response to the two LPS preparations (overlap in Venn diagrams in Figure 1). Of genes that are induced/repressed by LIST LPS, 40–50% are in common with the Sigma LPS. Similarly, 70–80% of genes that are differentially expressed in response to Sigma LPS are shared by the LIST LPS stimulation.
To elucidate further similarities and differences in macrophage response to the two preparations of LPS, we performed pathway analysis on differentially expressed genes in Venn diagrams. Molecular pathways that are activated or repressed in response to the LIST and Sigma LPS preparations were identified using Ingenuity Pathway Analysis (IPA). Figure 2 shows that the same top 12 pathways are activated/repressed in response to the two preparations of LPS both at 6- and 24-h time-points. As these data indicate, stimulation with the LIST ultrapure preparation results in lower P-values for almost all pathways due to the fact that more genes in each individual pathway are differentially expressed in response to this preparation compared to the Sigma LPS preparation. Among the top statistically significant pathways at 6 h are those that are involved in LPS signaling, namely, IL-10 signaling, IL-6 signaling, interferon signaling, p38 MAPK signaling, and NF-κB activation.3,17 Other pathways that are a hallmark of innate immune response, such as acute phase response, death receptor signaling and apoptosis, are also among the top 12 pathways. Finally, pathways relevant to macrophage response in the context of liver injury (LXR activation, hepatic fibrosis, and hepatic cholestasis) are also over-represented at 6 h post-LPS.
Over-represented canonical pathways identified by Ingenuity Pathway Analysis in RAW264.7 macrophages (A) 6 h and (B) 24 h post LPS treatment. Differentially expressed genes from the Venn diagrams in Figure 1 were used for the pathway analysis. LIST LPS data are shown in navy bars and Sigma LPS data are depicted by light blue bars.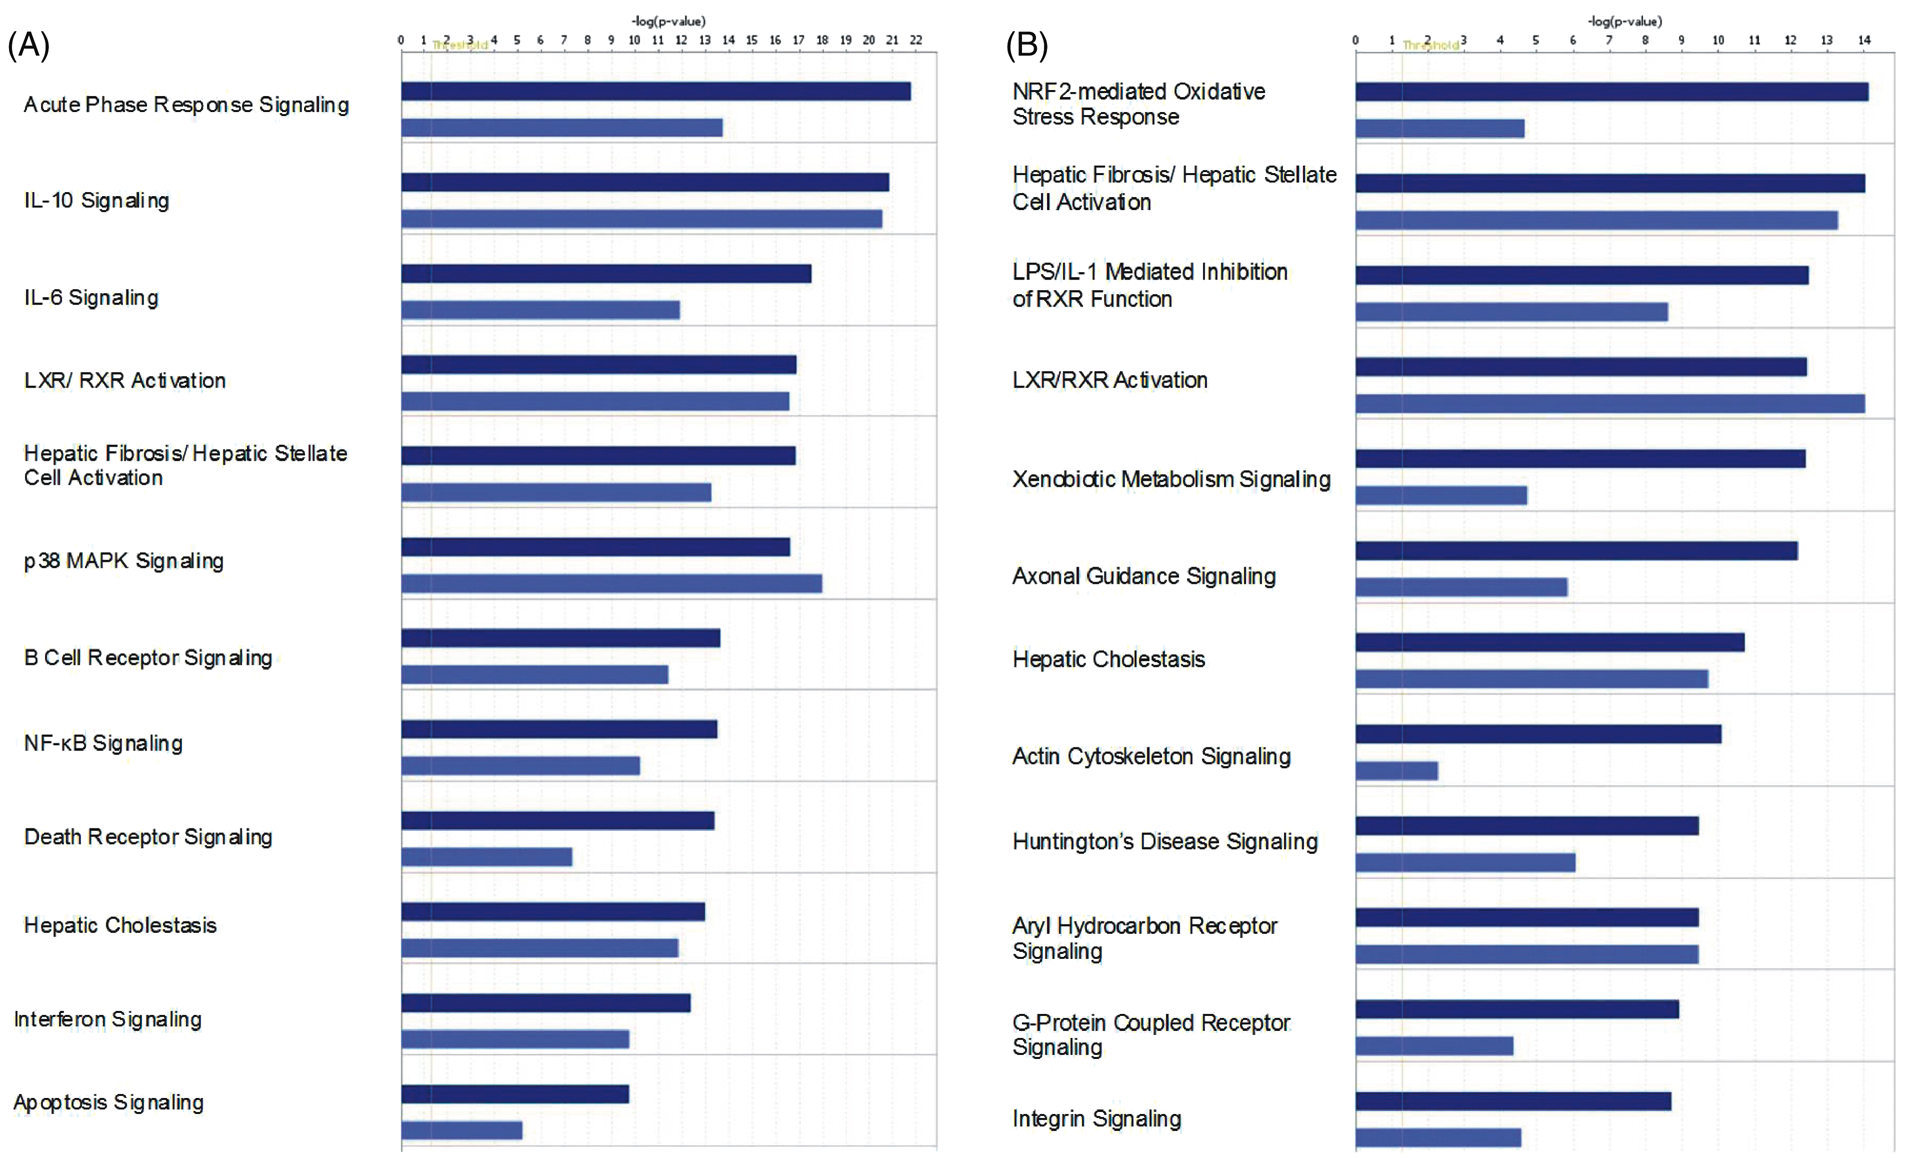
In addition to some of the same pathways that are activated/repressed at 6 h post-LPS, many other pathways are also over-represented at 24 h post-LPS treatment. The top pathway at this time point is NRF2-mediated oxidative stress response, a pathway that may link innate immune response to oxidative stress. 18 G-Protein coupled receptor signaling and integrin signaling have also been implicated in the context of innate immune response by macrophages. However, as stated above, it is difficult to interpret gene expression data at this late time point since some genes and pathways may be differentially regulated in response to secondary stimulation by cytokines and other inflammatory mediators initially produced in response to the primary LPS stimulation. We, therefore, focused our attention on the 6-h time point.
To analyze further the transcriptional profiles of macrophages in response to the two LPS preparations, we examined more closely five pathways that are considered most relevant to LPS signaling: IL-6 signaling, interferon signaling, NF-κB signaling, p38 MAPK signaling, and apoptosis signaling. Differentially expressed genes in each of the five pathways 6 h post-LPS are shown in Venn diagrams in Figure 3. The majority of the genes are differentially expressed in response to both preparations of LPS with additional genes differentially expressed only in response to the ultrapure LPS. These results further support our conclusion that transcriptional profiles of macrophages in response to the two LPS preparations are similar despite differences that may reflect the higher potency of the ultrapure LPS preparation.
Venn diagrams depicting genes that are differentially expressed in selected pathways from the pathway analysis presented in Figure 2A for the 6-h post LPS treatment. LIST LPS genes are shown in yellow circles, Sigma LPS genes are depicted by light blue circles, and the green overlap represents genes shared by the two gene lists.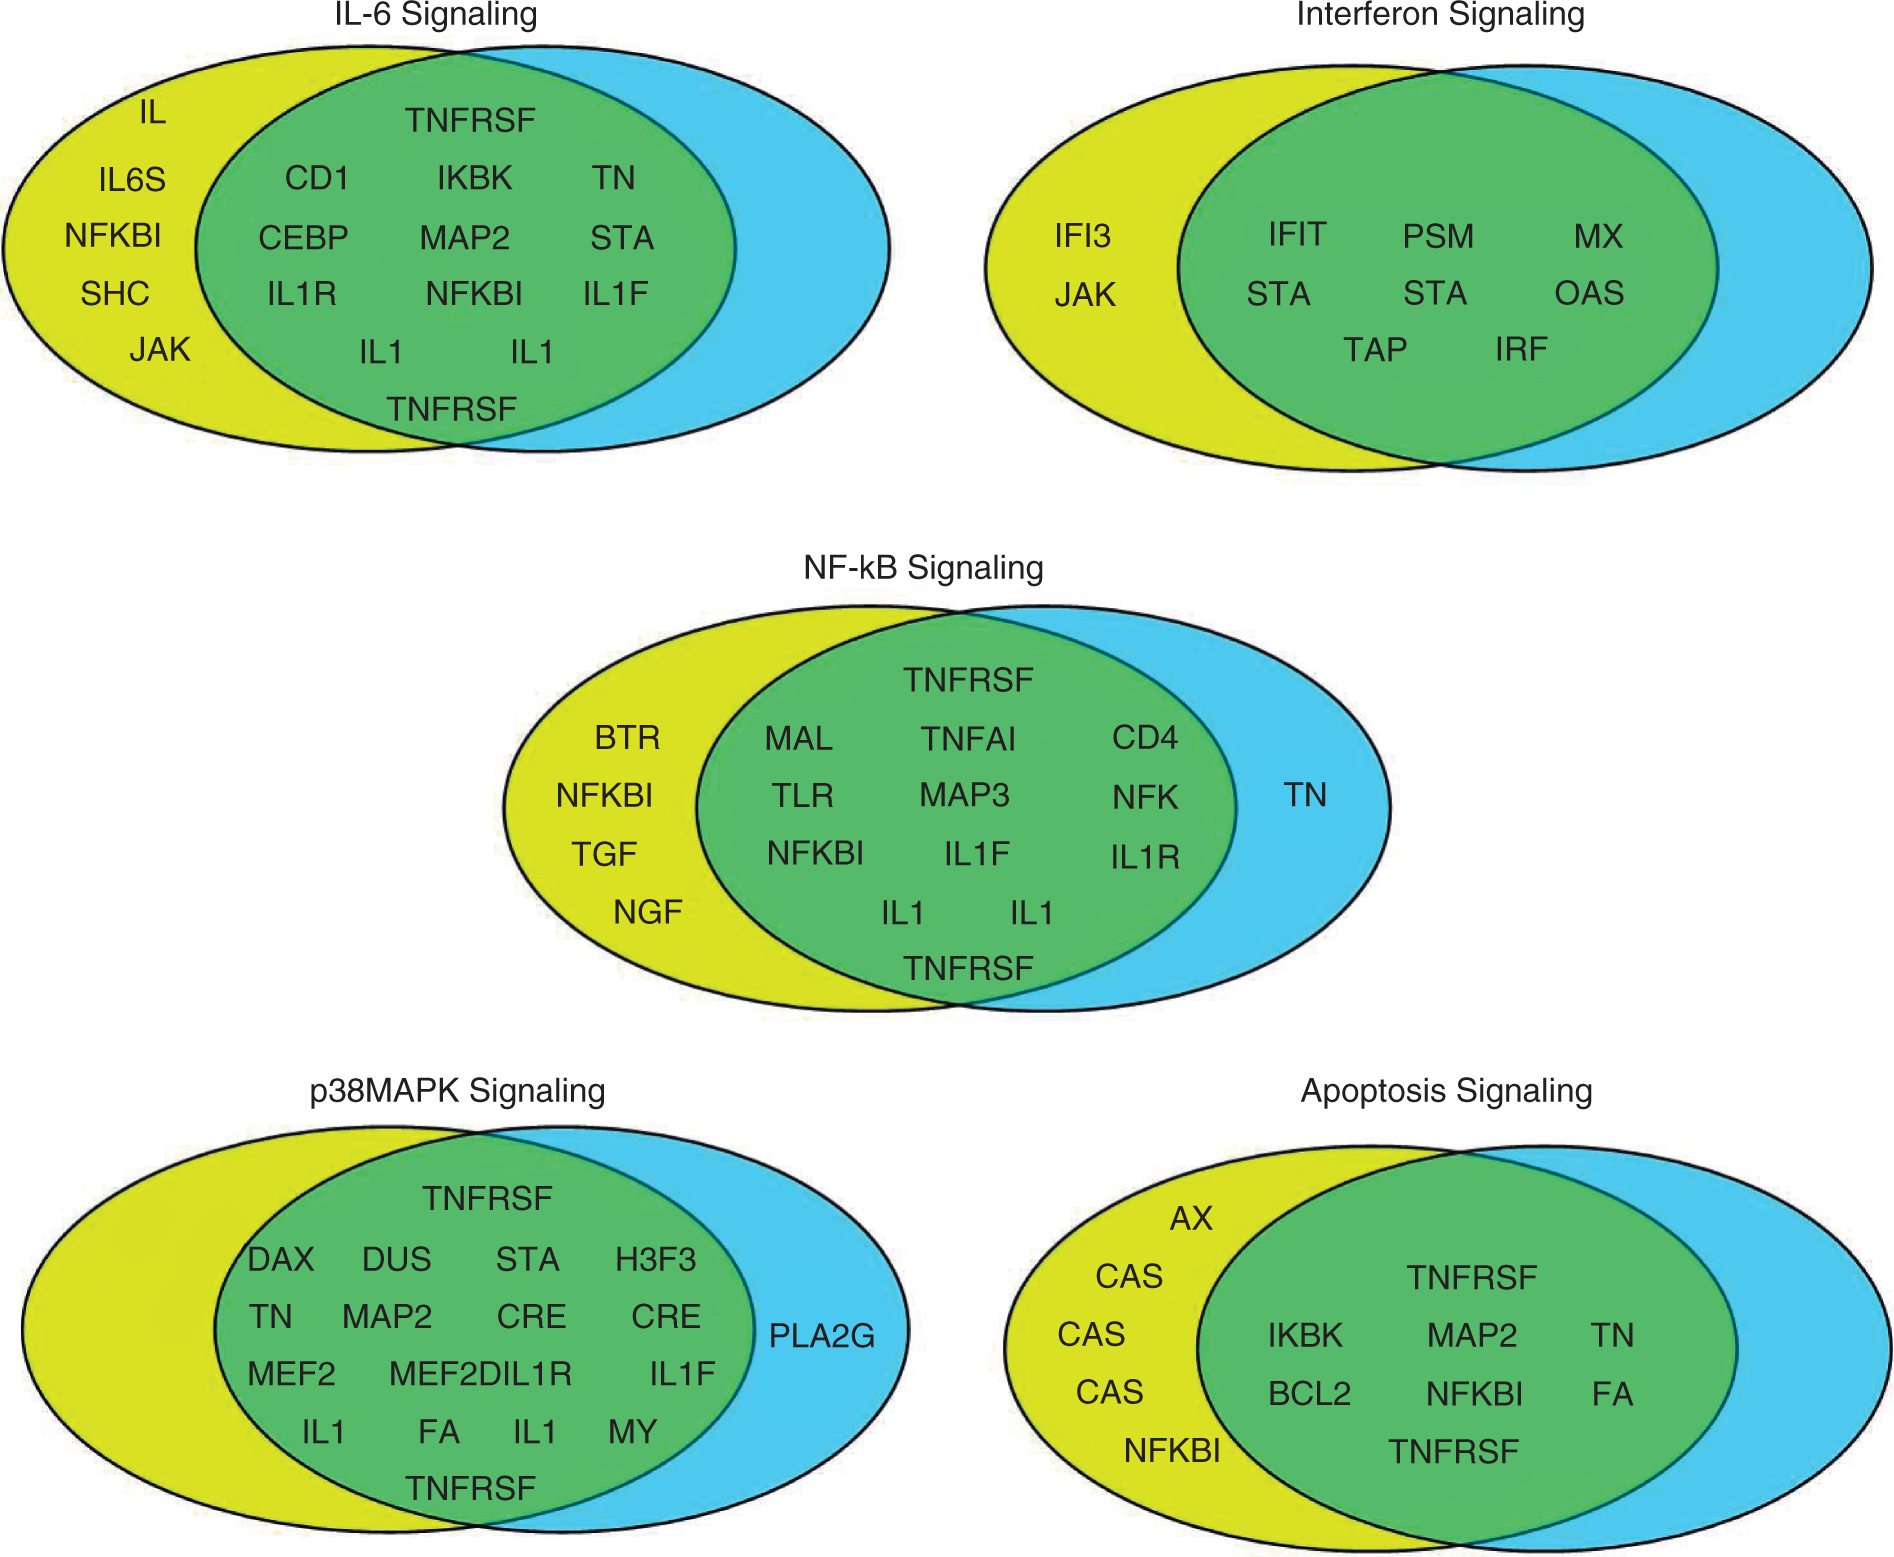
Despite overall similarities, there are several differences in the pathways that are differentially regulated by LIST and Sigma LPS at the 6-h time point. Some pathways are dysregulated to a similar extent (similar p value) by Sigma and LIST LPS, namely IL-10 signaling and LXR/RXR activation. Many pathways are more significantly dysregulated by LIST LPS (lower P-values). The acute phase response, NF-κB signaling, death receptor signaling, and apoptosis are among these pathways. The most likely explanation for this observation is that more differential expression is elicited by LIST LPS due to its higher potency. On the other hand, only p38 MAPK signaling is slightly more dysregulated by Sigma than LIST LPS; protein impurities in the Sigma LPS preparation that signal through TLRs other than TLR4 could account for these enhancements.
We used quantitative RT-PCR to validate microarray data for several representative genes (Figure 4). In these experiments, we analyzed samples from cell stimulated with three different concentrations of LPS: 50 ng/ml (used for the microarray experiment), 250 ng/ml and 500 ng/ml LPS. Consistent with findings from the microarray studies, the analysis by RT-PCT indicated genes that are induced/repressed by both Sigma and LIST LPS on the microarray (Nfkbiz, Slfn3, Plau and Ccna2) are induced by both preparations of LPS albeit to a different extent in some cases. As expected, genes that were identified as differentially expressed in response to Sigma but not LIST LPS (Smad6 and Rbm38) are induced/repressed to a much higher extent by Sigma LPS by RT-PCR. Finally, genes that were identified as differentially expressed in response to LIST than Sigma LPS (Serpinb9c, Nqo, and Xbp1) are only slightly more induced/repressed by LIST than Sigma LPS. The most likely explanation for these findings is that ‘LIST-specific’ genes were below the threshold used to identify differential expression in samples stimulated with Sigma LPS. In aggregate, quantitative RT-PCR data confirm our hypothesis that LIST LPS induces more differential expression due to its higher potency; these findings also suggest that protein impurities in the Sigma preparation contribute significantly to gene expression changes of the genes identified as specific to this preparation by microarray.
Quantitative RT-PCR for selected (A) up-regulated and (B) down-regulated genes in response to 50 ng/ml (green), 250 ng/ml (red) or 500 ng/ml (purple) LIST or Sigma LPS stimulation of RAW264.7 macrophages. Blue bars represent fold change observed on the microarray. Quantitative RT-PCR data are represented as mean with SEMs of three measurements. Concentrations of (A) TNF-α and (B) IL-6 produced by bone marrow-derived macrophages (BMDMs) from 3 strains of mice (C57B/6J in blue, C57B/6JTLR4–/– in green, and MA/MyJ in red) in response to 8 concentrations (with 0, 0.016, 0.08, 0.4, 5, 10, 50 or 100 ng/ml) of LIST (dashed lines) and Sigma LPS (solid lines) 6 h post LPS treatment. Axis is shown in EU/ml.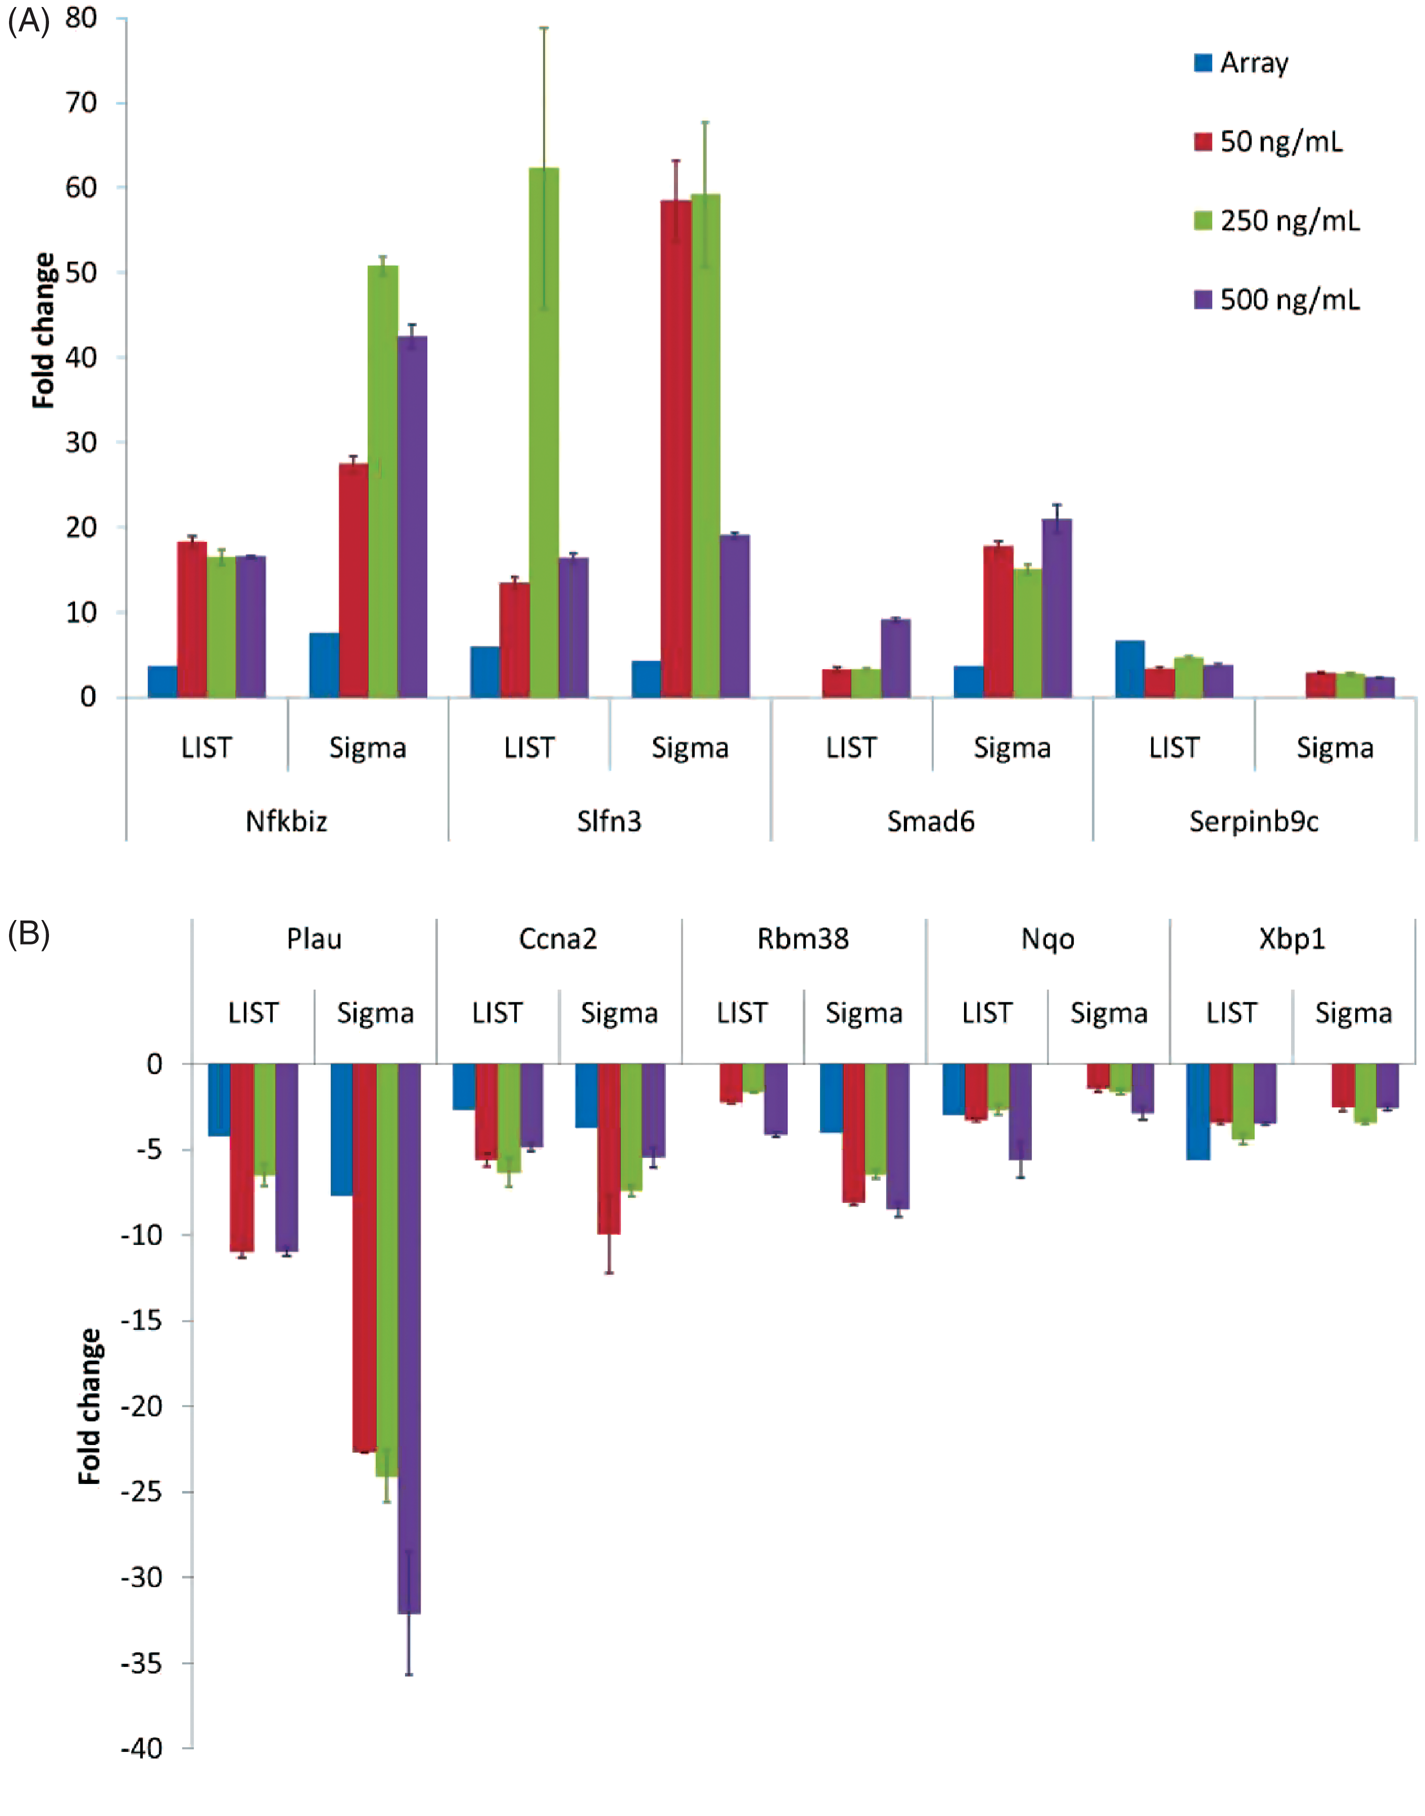
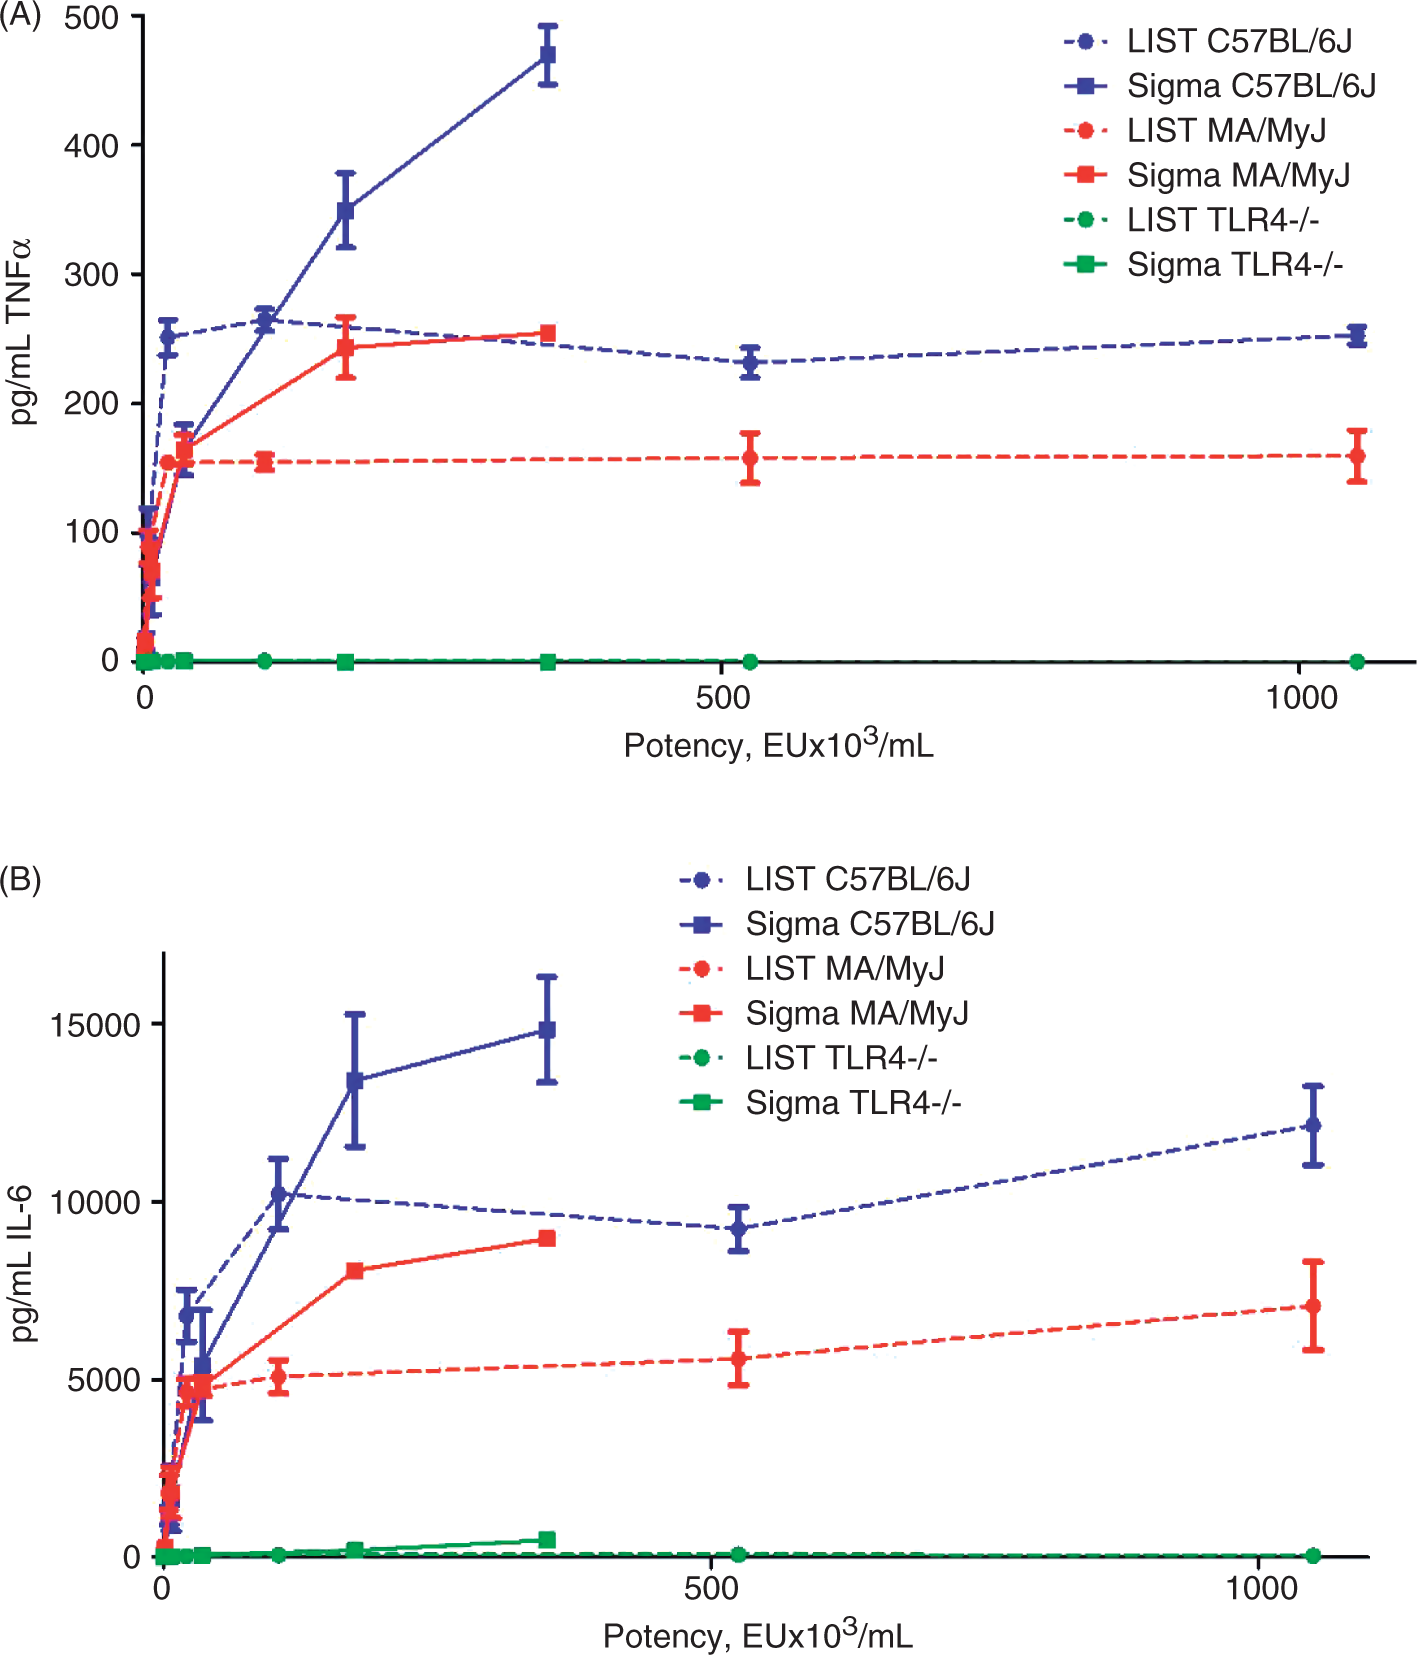
To characterize further the macrophage response to the two preparations of LPS, we studied the responses of BMDMs cultured from two strains of mice that are known to respond to LPS (C57B/6 J and MA/MyJ); 19 we also studied cells from C57B/6JTLR4–/– mice that do not respond to LPS due to TLR4 deficiency. In these experiments, macrophages were treated with eight concentrations of LIST ultrapure or Sigma LPS and TNF-α and IL-6 concentrations in the supernatant were measured 6 h post-LPS. At low concentrations of LPS (<10 ng/ml), macrophages from C57BL/6 J and MA/MyJ mice produced higher concentrations of pro-inflammatory cytokines in response to the ultrapure LPS preparation (Figure 5) presumably due to the higher activity of the ultrapure than the standard preparation at the same concentration. No cytokine production by macrophages from C57B/6JTLR4–/– mice was observed in response to either LPS preparation at <10 ng/ml concentrations. At concentrations >10 ng/ml, macrophages from C57BL/6 J and MA/MyJ mice produced higher concentrations of cytokines in response to the Sigma LPS stimulation. Similarly, macrophages from C57B/6JTLR4–/– mice produced no detectable cytokines in response to ultrapure LIST LPS but produced detectable, albeit low, amounts of TNF-α and IL-6 in response to stimulation with Sigma LPS. This effect can most likely explained by the presence of impurities in the Sigma LPS preparation, where impurities contribute to macrophage stimulation and cytokine production when present at higher concentrations.
Discussion
Results of this study provide new information on the pattern of gene activation induced in RAW264.7 macrophages by stimulation with TLR4 ligand LPS, characterizing similarities and differences in the response to the two commonly used preparations of E. coli LPS that differ in purity. For this purpose, we compared the response to the Sigma preparation, which is isolated using standard phenol extraction (with <1% protein impurities), and the LIST ultrapure LPS that is re-extracted to contain no protein impurities. The ultrapure LIST preparation is commonly used in in vitro cell culture studies whereas most in vivo studies use the Sigma preparation because of the high cost of the ultrapure preparation at quantities needed for in vivo studies. Our data showed that the LPS preparations activated similar pathways, differences in gene activation nevertheless occurred that may reflect potency or the presence of contaminants in the less pure preparation.
Analysis of macrophage responses suggest that protein impurities in the Sigma preparation can influence patterns of gene expression as assessed by microarray analysis and validated by quantitative RT-PCR of RAW264.7 cells. This conclusion is supported by studies on the responses of bone marrow macrophages. Thus, we demonstrated differences in the pattern of cytokine production of macrophages isolated from three different strains when the LPS is used at higher concentrations; it is likely that, at these high LPS concentrations, the concentration of protein impurities are sufficient to affect cytokine production. Together, these findings suggest that aspects of the response to Sigma LPS, measured at either the level of gene expression or cytokine production, may be due to protein impurities present in this preparation.
In these studies, we have shown that, at the same concentration, these two LPS preparations elicit differential expression of many common genes although there is induction of unique genes with each preparation; the ultrapure preparation showed more differentially expressed genes than did the Sigma preparation. This enhanced transcriptional response to the ultrapure LPS concentration is most likely due to its higher potency; we showed that the ultrapure preparation we used in this study has 3 times more EU/mg than does the standard LPS preparation. Despite differences in the number of differentially expressed genes due to the higher potency of the ultrapure preparation, the same pathways are activated/repressed in macrophages stimulated with the two preparations. This finding suggests that studies performed using different preparations of LPS can be compared although the purity and potency of the two preparations can influence some aspect of the transcriptome induced.
By using quantitative RT-PCR, we showed that the Sigma preparation, mostly likely related to its content of protein impurities, induces expression of several genes that are not induced by the ultrapure LPS preparation. We observed a similar pattern at the protein level for several cytokines in our murine BMDM studies. Importantly, BMDMs from C57B/6JTLR4–/– mice can respond to higher doses of Sigma LPS, which strongly supports the conclusion that impurities in the Sigma preparation signal through other receptors and induce innate immune responses. It has been previously shown that impurities in commercial LPS preparations can activate TLR2 pathways. 20 We did not observe any specific gene expression changes (e.g. change in TLR2 expression) that point specifically to the TLR2 pathway activation in our study. Further studies would be necessary to characterize fully the response of protein impurities in the Sigma LPS preparation.
Our study compares gene expression profiles of two preparations of LPS from E. coli serotype O111:B4 that are commonly used both in in vitro and in vivo LPS studies.19,21– 25 However, LPS from other E. coli serotypes, namely O26:B626,27 and O55:B56,8, as well as other Gram-negative organisms, such as different species of Salmonella enterica serovars Minnesota,5,9,28 Enteritidis,29,30 and Typhimurium 31 are also used in cell culture and animal studies. Lipopolysaccharides that are isolated from different species of Gram-negative bacteria are diverse in their structures 32 and may, therefore, elicit differential transcriptional response. Further studies are needed to delineate the transcriptional response of macrophages to LPS from different bacterial species and elucidate the relative contributions of the TLR4 and other pathways may be stimulated by the components present.
Supplemental Material
INI393540 Sigma LIST supplement final111010 - Supplemental material for Gene expression profiles of RAW264.7 macrophages stimulated with preparations of LPS differing in isolation and purity
Supplemental material, INI393540 Sigma LIST supplement final111010 for Gene expression profiles of RAW264.7 macrophages stimulated with preparations of LPS differing in isolation and purity by Holly R Rutledge, Weiwen Jiang, Jun Yang, Laura A Warg, David A Schwartz, David S Pisetsky and Ivana V Yang in Innate Immunity
Footnotes
Acknowledgements
This study was funded by the Intramural Research Program of the NIH, National Institute of the Environmental Health Sciences and National Heart Lung and Blood Institute, and a VA Merit review grant.
References
Supplementary Material
Please find the following supplemental material available below.
For Open Access articles published under a Creative Commons License, all supplemental material carries the same license as the article it is associated with.
For non-Open Access articles published, all supplemental material carries a non-exclusive license, and permission requests for re-use of supplemental material or any part of supplemental material shall be sent directly to the copyright owner as specified in the copyright notice associated with the article.