
Abstract
The aim of this study was to assess whether high sensitivity troponin (hs-cTnI) is associated with 1 year mortality in critical care (CC). One year mortality data were obtained from NHS Digital for a consecutive cohort of patients admitted to general CC unit (GCCU) and neuroscience CC unit (NCCU) who had hs-cTnI tests performed throughout their CC admission, regardless of whether the test was clinically indicated. Cox proportional hazards were used to estimate the risk of 1-year mortality. A landmark analysis was undertaken to assess whether any relationship at 1 year was driven by mortality within the first 30 days. A total of 1033 consecutive patients were included. At 1 year 254 (24.6%) patients had died. The admission log(10)hs-cTnI concentration in the entire cohort (HR 1.35 (95% CI 1.05–1.75) p = 0.009 with a bootstrap of 1000 samples) was independently associated with 1 year mortality. On landmark analysis the association with 1 year mortality was driven by 30 day mortality. These results indicate that admission hs-cTnI concentration is independently associated with 1 year mortality in CC and this relationship may be driven by differences in mortality at 30 days.
Introduction
The increased sensitivity and usage of high sensitivity troponin (hs-cTn) assays has resulted in concentrations above the manufacturer defined upper limit of normal (ULN) being seen in a range of different clinical contexts not traditionally associated with myocardial infarction.1–5 Furthermore, there is an accumulating body of evidence demonstrating that hs-cTn is associated with medium term outcomes in several disease groups.6–14 Specifically, this research group showed that in a population of 20,000 consecutive patients undergoing a blood test for any reason, inpatient or outpatient, the hs-cTnI concentration was above the ULN in 1 in 20. 4 Furthermore, this concentration was independently associated with 1 year mortality in this population. 14 In critical care (CC) environments, hs-cTn concentrations above the ULN are frequent and have been associated with adverse in hospital outcomes including mortality.15–19 In our previous work we demonstrated that the hs-cTnI concentration on admission to CC, taken outside the context of routine clinical indications, was independently associated with CC mortality. 15 The aim of this study was to assess whether there was an association in this cohort between hs-cTnI and mortality at 1 year of follow up, in order to determine if the assay may be of potential value as a marker of elevated risk in CC patients.
Method
The methodology of this study has been described in detail in our previously published work. 15 In brief, this is a prospective, observational study that enrolled consecutive adult patients admitted to one of two CC environments (general critical care unit (GCCU) or the neuroscience critical care unit (NCCU)) within our institution over a 6 month timeframe. A hs-cTnI request was added to the first biochemistry sample received and, following this, on day 1 and day 2 and after that every alternate day of the admission. These tests were performed on every patient regardless of whether there was a clinical indication for doing so, and, unless requested by the supervising clinical team, the results were hidden and not revealed to the patient or clinical team. 15 Patients with an established diagnosis of type 1 myocardial infarction (T1MI) were excluded from this analysis. Only the first admission for each patient was included.
The Beckman Coulter Access hsTnI assay (Brea, CA, USA) was used to measure hs-cTn concentrations in this study. The manufacturer’s 99th centile is 18 ng/L (at which level the coefficient of variation (CV) is <10%) and this is used as the ULN in our institution.
The original study received ethical approval from the East of Scotland Research Ethics Service (18/ES/0118). The original ethical application included an agreement to allow collection of 1 year outcome data from NHS Digital. In addition to the standard ethical review, the project was reviewed and approved by the national Confidentiality Advisory Group (18CAG0156), given both the lack of informed consent from participants and because the results would be withheld from the patient and clinical team. One year after the last patient was enrolled in the study, NHS Digital were sent each patient’s NHS number, date of birth, sex and a study specific identifier. NHS Digital then returned the date and cause of death at 1 year alongside the study specific identifier.
Summary variables are displayed as the median with the interquartile range (IQR) where the variable was continuous or as the number (percentage) for categorical variables. Variables were compared between those patients that died and those that survived at 1 year using the chi squared test (for categorical variables, or where the number of cases was small using Fisher’s exact test) or the Mann Whitney U test for continuous variables. Kaplan Meier curves were created for 1 year mortality based on whether the hs-cTnI concentration on admission was above or below the ULN and this was interrogated using the log rank test for the entire cohort. A Cox proportional hazards model (with a bootstrap of 1000 samples) was then created including all variables that were associated with 1 year mortality (with empirical p values of <0.1) on univariable analysis (using a Cox proportional hazard model with bootstrap of 1000 samples). Given the highly skewed distribution of hs-cTnI concentrations the admission hs-cTnI concentration was log (10) transformed for the multivariable analysis. The distribution of hs-cTnI concentrations before and after log(10) transformation was displayed using histograms. In order to prevent collinearity, variables that form part of any of the scores used in this study (e.g. APACHE II score) were only included in the model if the score itself was not associated with 1 year mortality. Further, pairs plots for the continuous variables in the model were created to evaluate the risk of collinearity. Outputs are displayed as hazard ratios (HR) with 95% confidence intervals (95%CI) presented to two decimal places. A landmark analysis was then performed to assess whether any association between the hs-cTnI concentration and 1 year mortality was driven by mortality within 30 days. Specifically Kaplan Meier curves were drawn for mortality at 30 days comparing mortality between patients with a hs-cTnI above and below the ULN using the log rank test. Following this, cases that died during 30 days were excluded and then a further Kaplan Meier curve was drawn to assess mortality from 30 days to 1 year and the mortality for those with hs-cTnI concentrations above the ULN was compared using a log rank test. All analysis was performed using SPSS v27.0 (SPSS, IBM Corporation, Armonk, NY, USA). Due to the data sharing agreement with NHS Digital and the nature of the ethical approvals the data from this study cannot be shared. The outputs from this analysis are available upon reasonable request.
Results
There were a total of 1033 patients included in the final study cohort (after planned exclusions: patients who were already in CC at the start of the study (26 patients), those who did not have a biochemistry sample requested within 24 h of admission (1 patient), those still in CC after close of the study (two patients) and those diagnosed with T1MI (15 patients) 15 ), with 750 in GCCU and 283 in NCCU (Figure 1). The median age of the entire cohort was 62 (IQR 49–73) with 429 (41.5%) female and the median APACHE II score was 14 (IQR 8–20). There was one patient in GCCU whose admission hs-cTnI was not analysable. Table 1 demonstrates the differences in baseline demographics, admission characteristics and organ support between patients who were alive at 1 year and those that had died. Supplemental Figures 1(a) and 2(a) demonstrate the distribution of hs-cTnI concentration before and after log(10) transformation
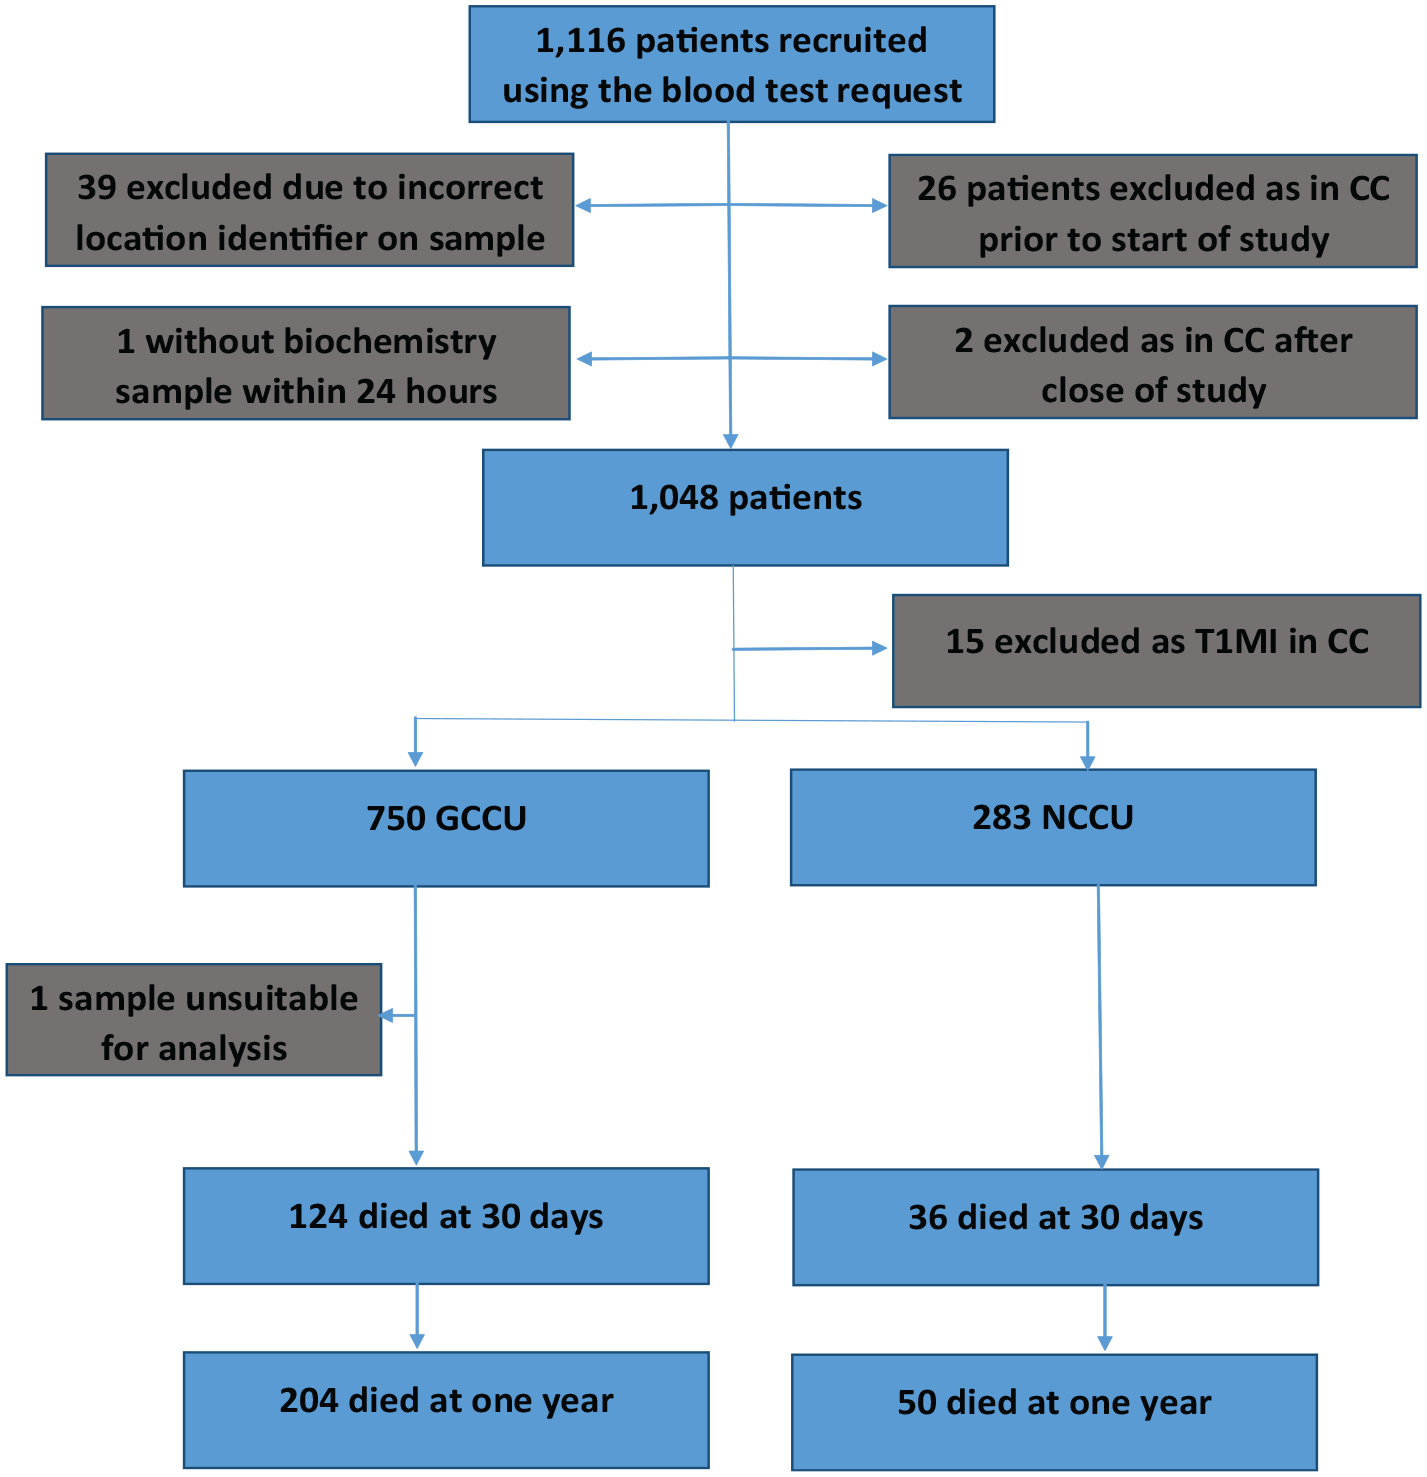
Study recruitment and outcomes.
Baseline demographics, admission characteristics and outcomes across the two CC environments.
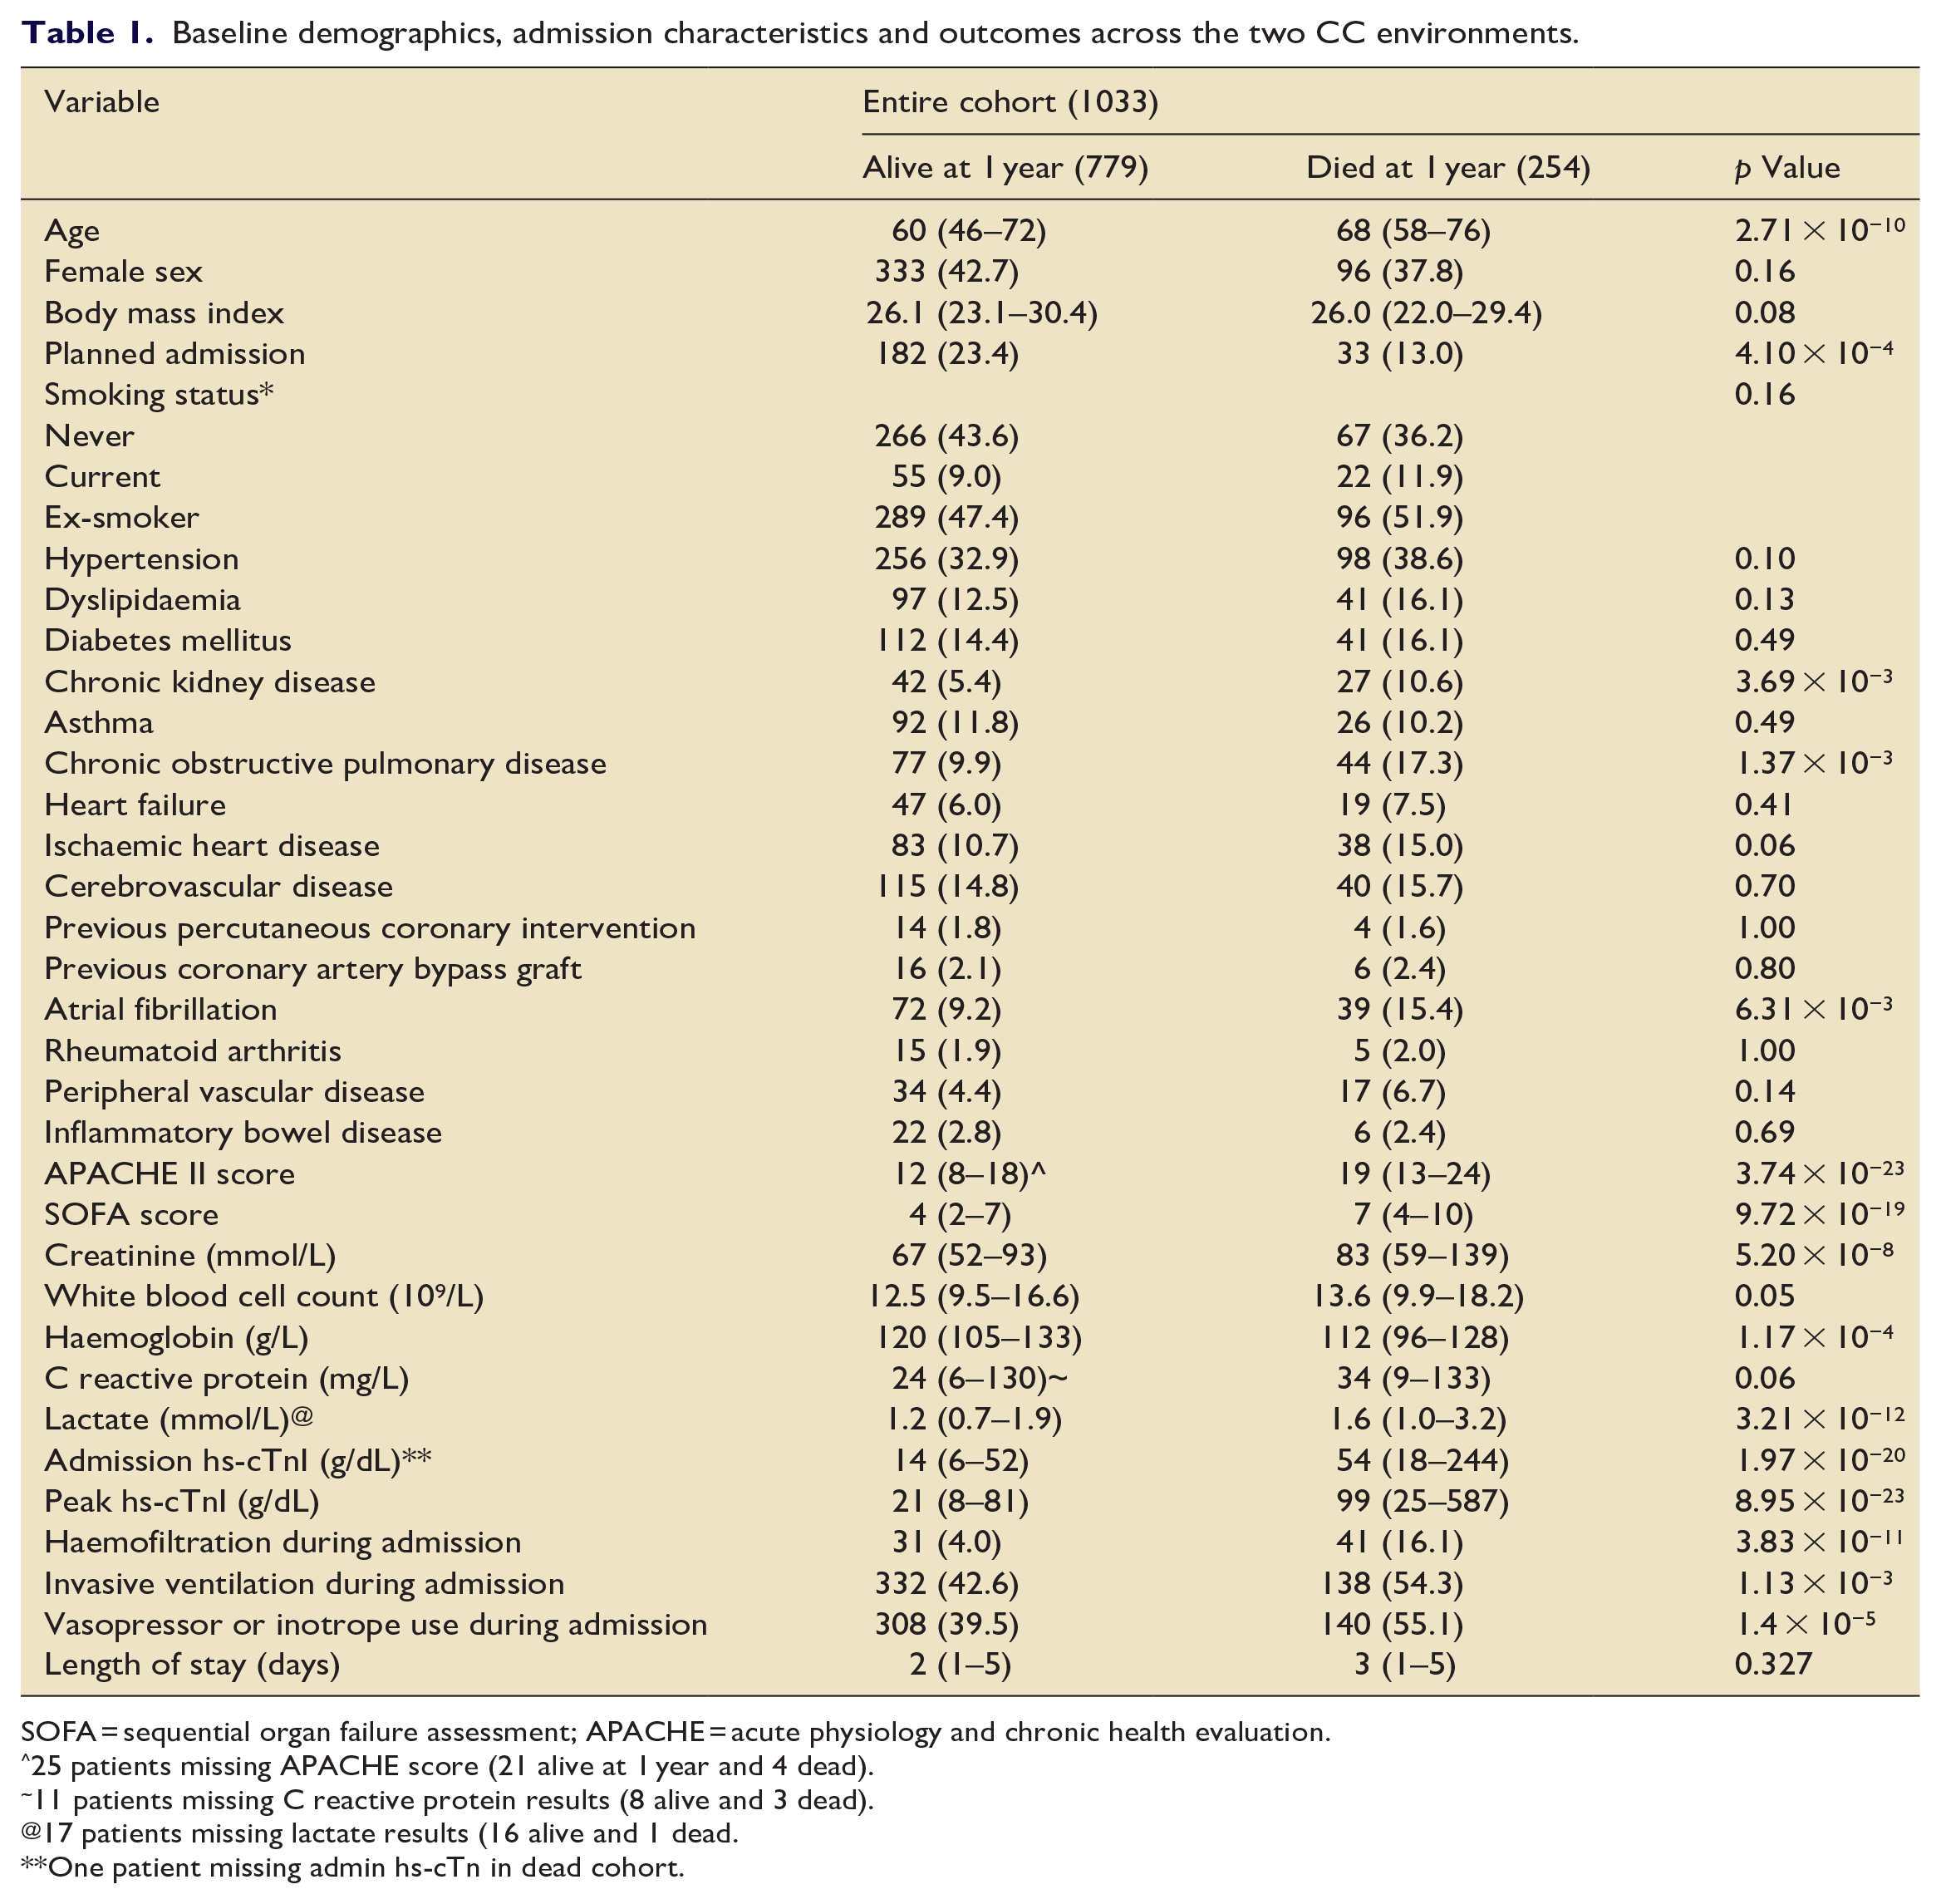
SOFA = sequential organ failure assessment; APACHE = acute physiology and chronic health evaluation.
25 patients missing APACHE score (21 alive at 1 year and 4 dead).
11 patients missing C reactive protein results (8 alive and 3 dead).
17 patients missing lactate results (16 alive and 1 dead.
One patient missing admin hs-cTn in dead cohort.
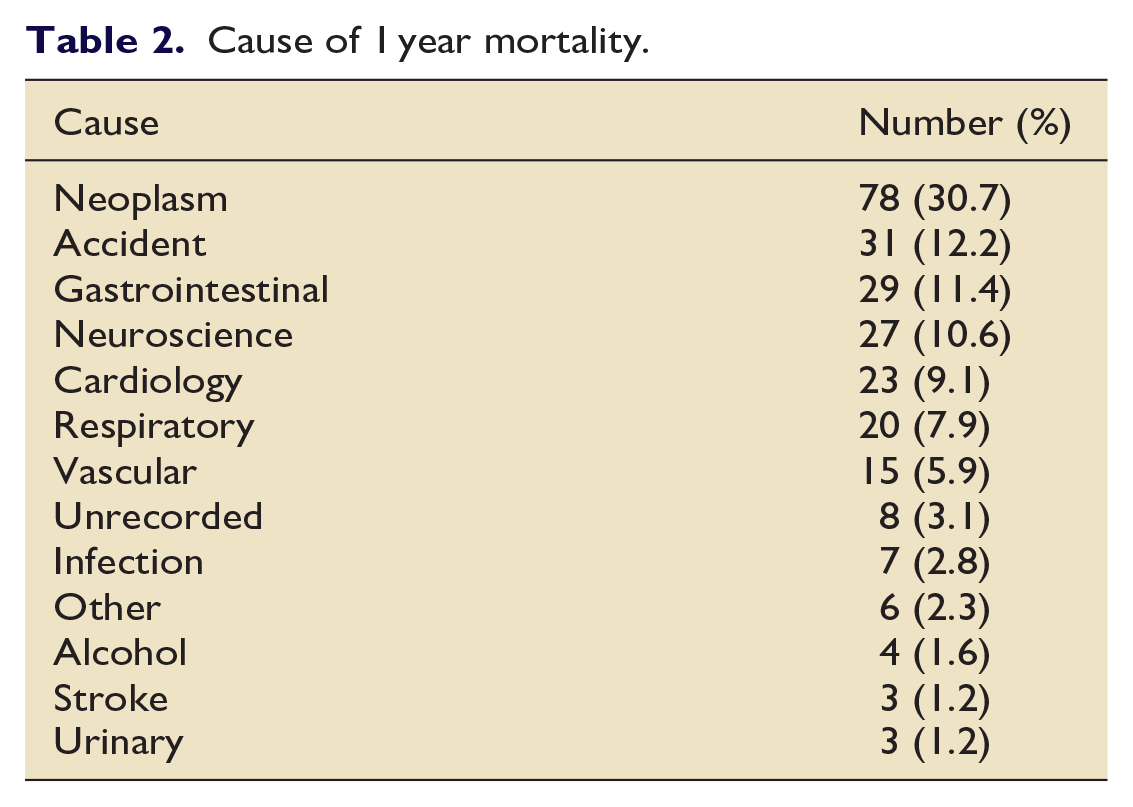
At 1 year 254 (24.6%) patients from the entire cohort had died. In the GCCU cohort 204 (27.2%) and in NCCU cohort 50 (17.7%) had died at 1 year. Table 2 demonstrates the cause of death at 1 year, with the most frequent being malignancy (30.7%). There was a significant difference in 1 year mortality between patients with a hs-cTnI concentration above and below the ULN on admission in the overall cohort (Figure 2). The admission log(10)hs-cTnI concentration was independently associated with the hazard of 1 year mortality on multivariable Cox analysis with a bootstrap of 1000 samples (HR 1.35 (95% CI 1.05–1.75) p = 0.009; Table 3). Supplemental Figure 3(a) demonstrates the pairs plots for continuous variables in the multivariable model.
Cause of 1 year mortality.
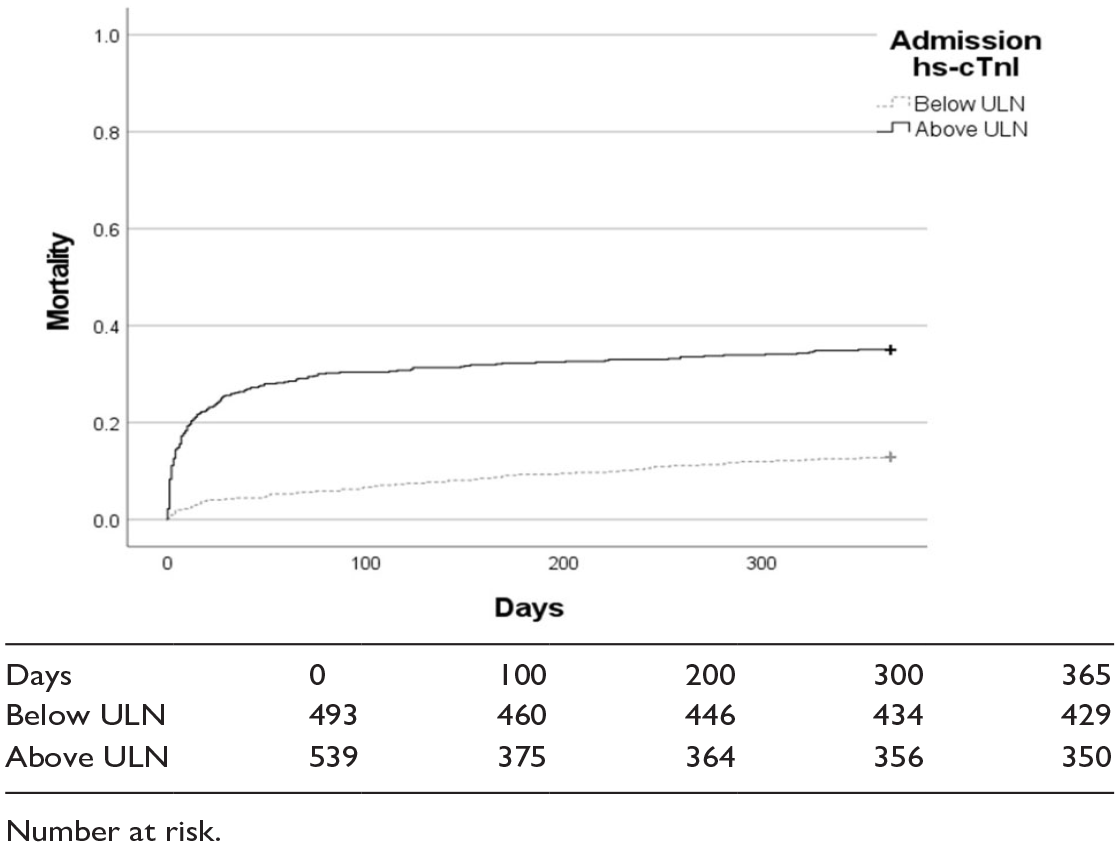
Kaplan Meier curve comparing 1 year outcomes depending on whether the admission hs-cTnI concentration was above the ULN (log rank p = 5.98 × 10⁻¹⁸).
Cox univariable and multivariable outputs for the entire cohort with a bootstrap of 1000 samples.
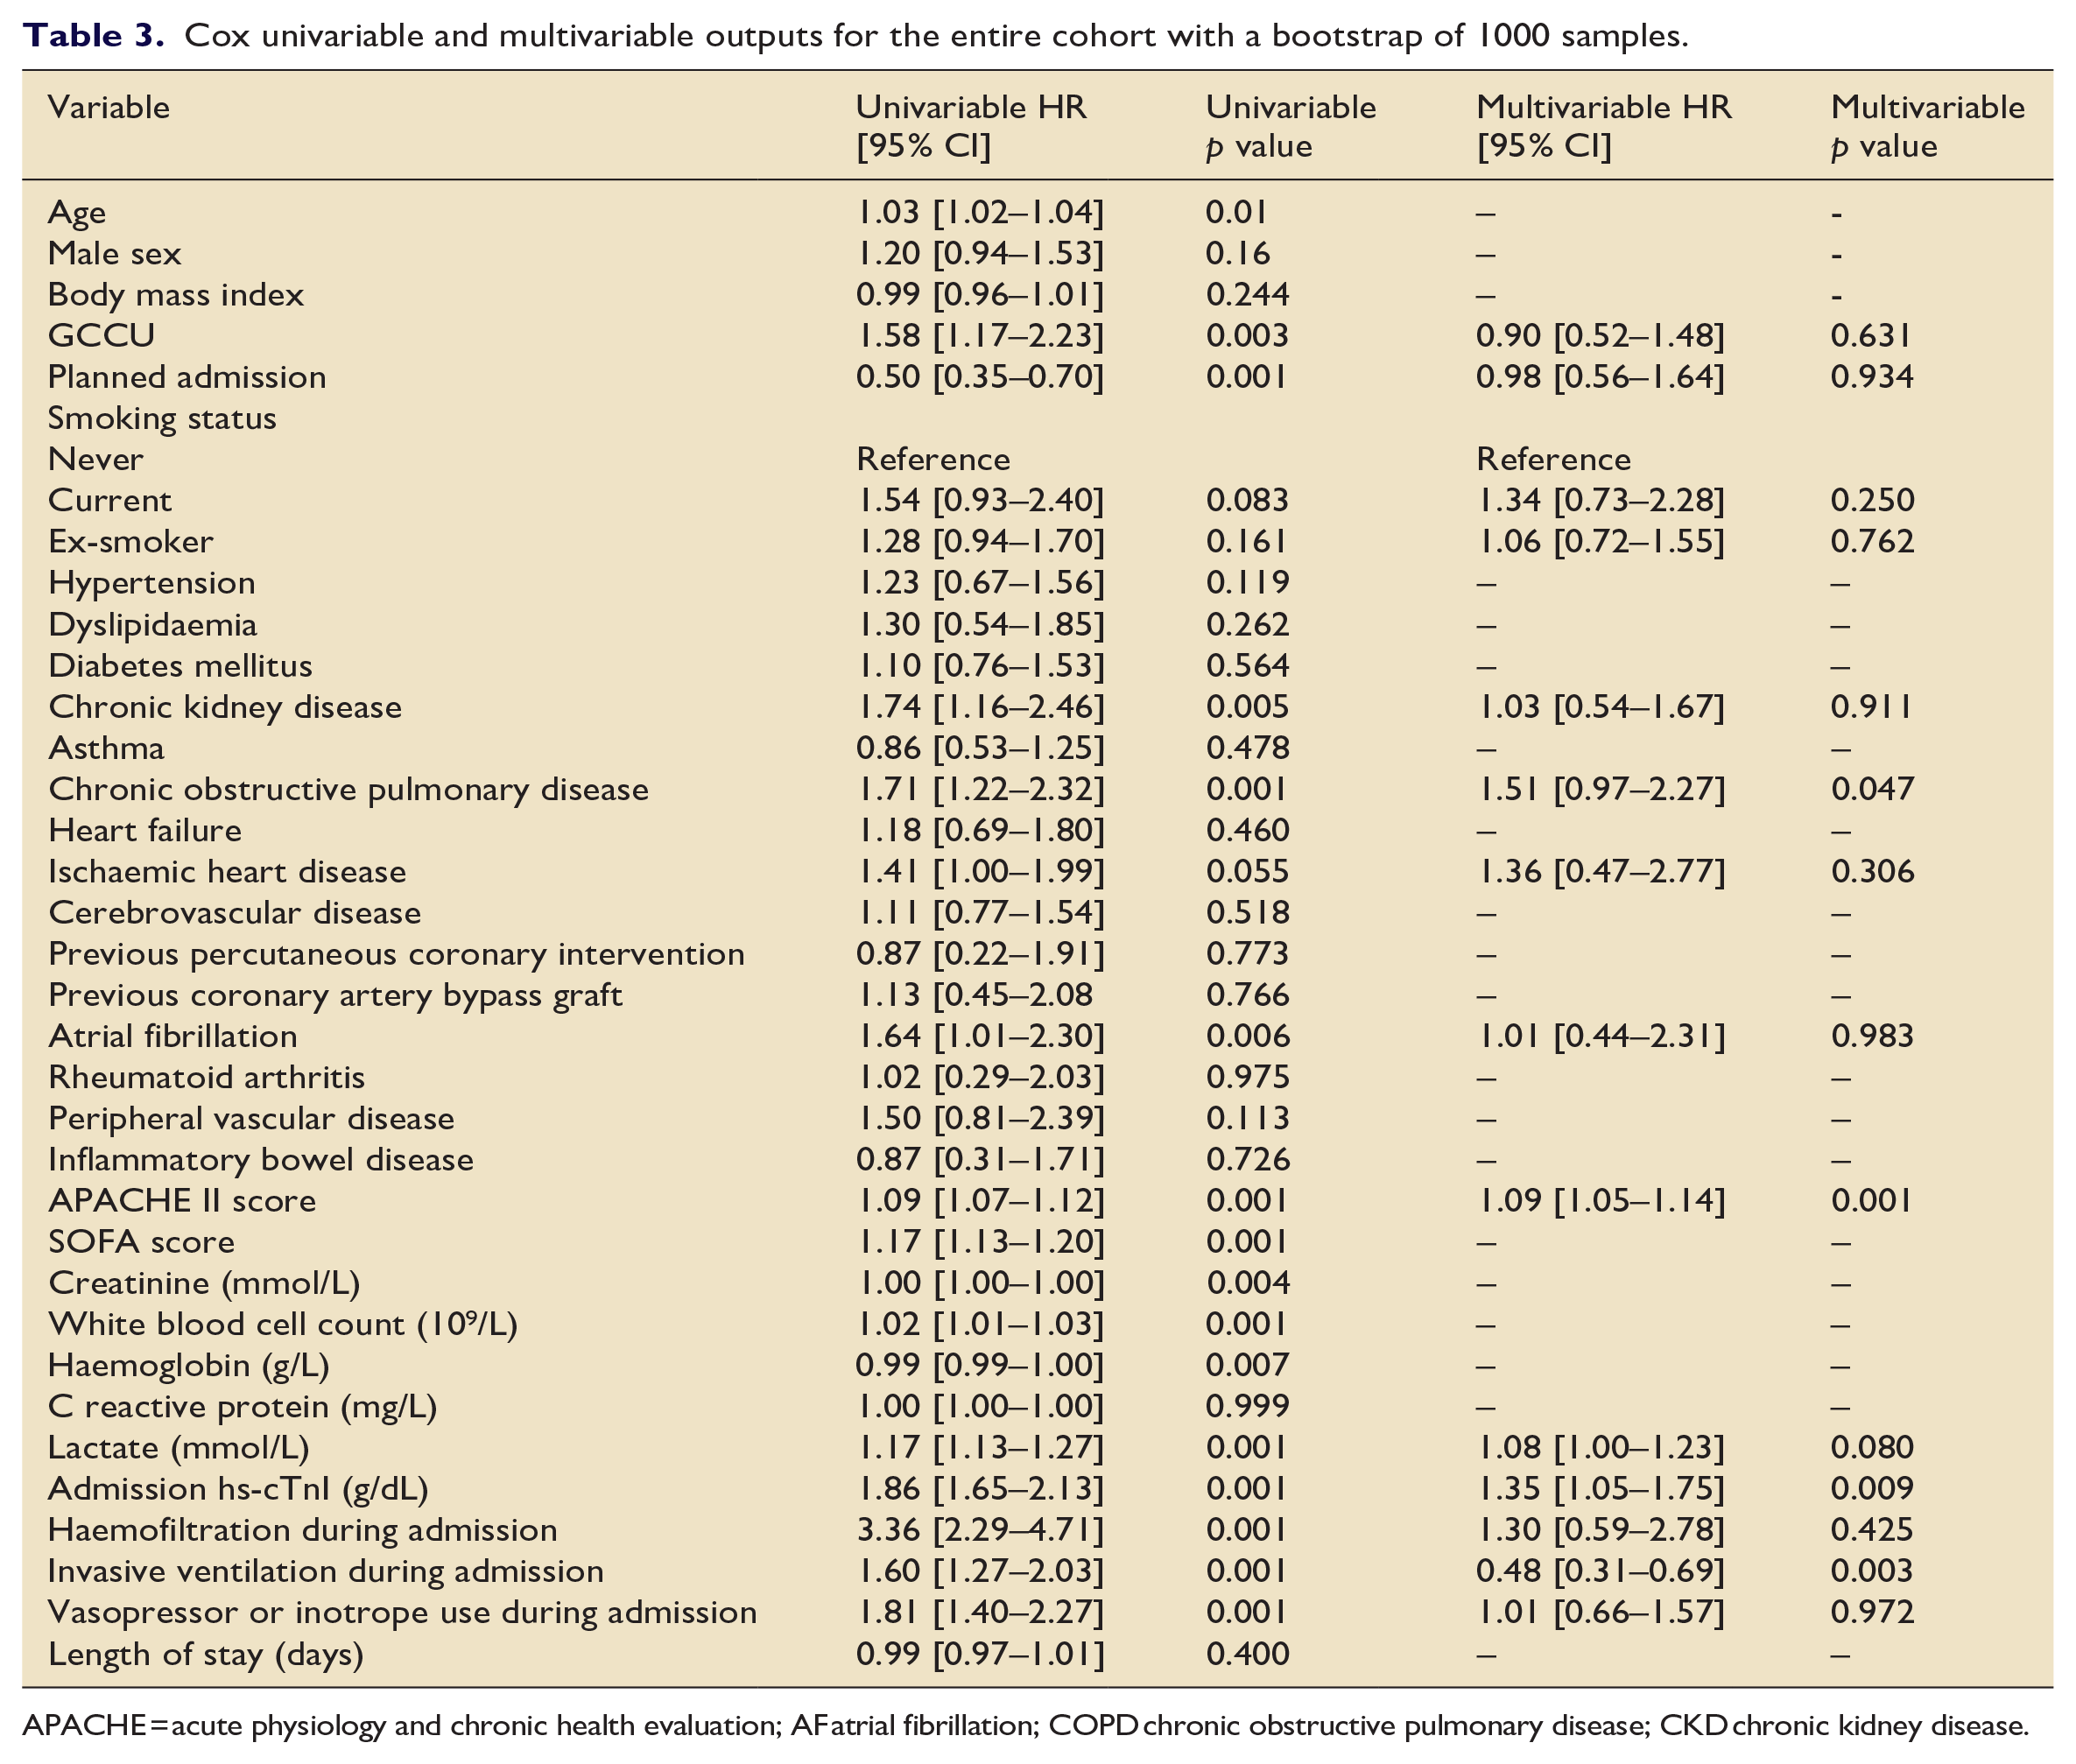
APACHE = acute physiology and chronic health evaluation; AF atrial fibrillation; COPD chronic obstructive pulmonary disease; CKD chronic kidney disease.
There were 160 deaths from any cause at 30 days in the entire cohort (124 in GCCU and 36 in NCCU). At 30 days whether the admission hs-cTnI concentration was above or below the ULN was associated with mortality in the entire cohort (log rank p = 1.72 × 10⁻²¹). Once those patients who died within 30 days were excluded from the analysis this relationship was lost (log rank p = 0.07, Figure 3).
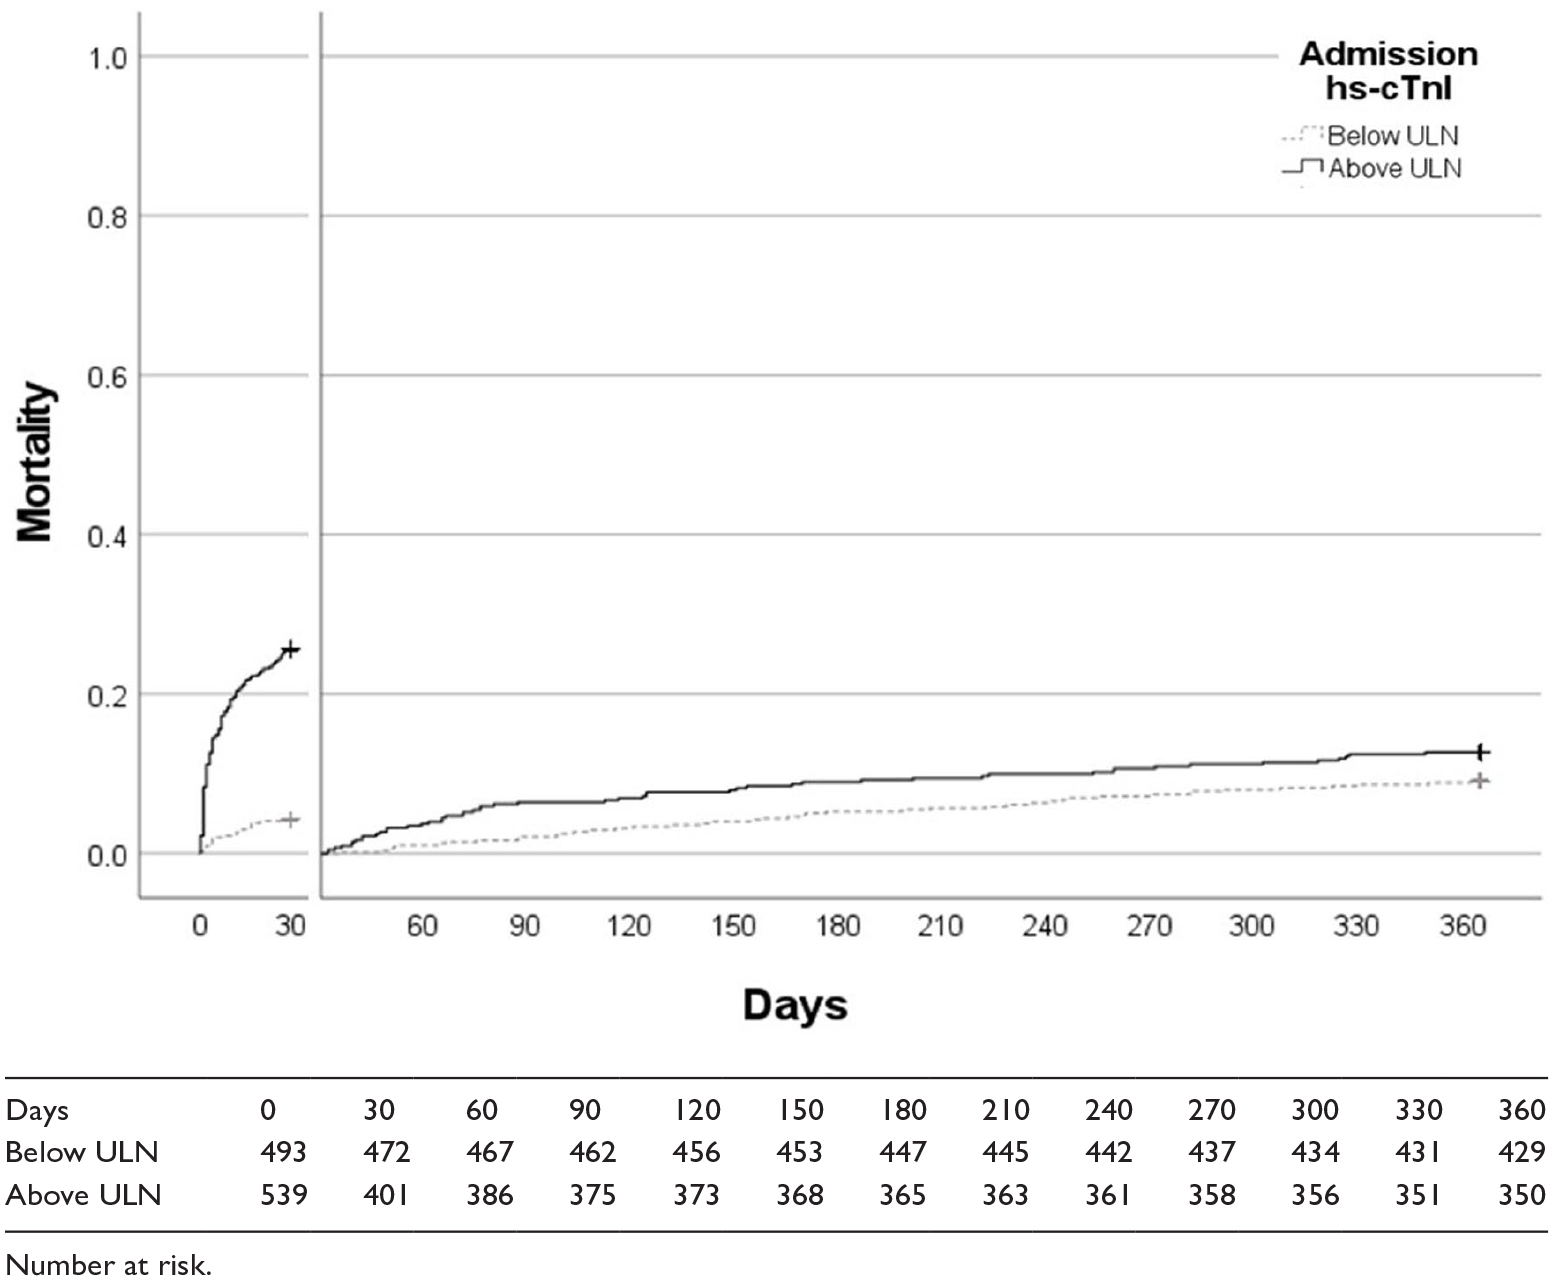
Landmark analysis comparing 30 day and 1 year outcomes depending on whether the admission hs-cTnI concentration was above the upper limit of normal (ULN).
Discussion
This follow up study of the largest consecutive cohort of CC patients to have hs-cTnI concentrations throughout their admission demonstrates that whilst the admission hs-cTnI concentration taken during CC admission was independently positively associated with 1 year mortality, this relationship was driven by differences in mortality at 30 days.
An increasing body of evidence has reported the association between hs-cTnI and medium/long term mortality.6,8,11–13 This has been demonstrated on a population basis and in several cohorts with various chronic conditions including diabetes, chronic obstructive pulmonary disease, heart failure and renal impairment.6,10–13,20 This group has previously demonstrated a link between hs-cTnI concentration and short term mortality in patients in the emergency department and those on critical care, even those in whom there was no traditional indication to measure the assay.2,15 Furthermore, in the CHARIOT study, we previously demonstrated that hs-cTnI was independently associated with 1 year mortality in a consecutive cohort of 20,000 patients undergoing a blood test for any reason at the hospital. 14
The current results are consistent with a previous study, which enrolled 1124 (89%) of patients presenting to CC with sepsis, and found that hs-cTnI concentrations were independently associated with 14 day outcome but not after this timeframe, regardless of whether there was any clinical indication for performing the test. 21 The authors of that study suggested that this maybe the result of their cohort of patients having a high burden of acute disease. An association between short term, but no longer term, mortality has also been reported in studies using standard sensitivity troponin assays, but these were in patients in whom the test had been requested for clinical reasons, unlike our study that included all patients, regardless of an indication for testing. 22
Metkus et al. 23 , in a study of 1057 patients intubated for acute respiratory distress syndrome, demonstrated that the hs-cTnI concentration taken within 24 h was not associated with 60 day mortality once markers of illness severity were taken into account on multivariable analysis. This clearly contrasts with our study and maybe the result of the different study inclusion criteria or varied thresholds for admission to critical care. Furthermore it is possible that different critical care conditions have different relationships between hs-cTn concentrations and outcomes. Further work is required to evaluate the relationships in specific cohorts of critical care.
Whilst the data from this study demonstrate a clear short term relationship between admission hs-cTnI concentration and 30 day mortality further data are required before this can be recommended as a routine test to aid prognostication. Specifically, a further prospective multicentre study would be beneficial to ensure that these findings are more widely applicable. Indeed, future studies should include admission reason in their analyses to allow a better understanding as to whether the relationship between hs-cTnI concentration and mortality is seen across all critical care conditions or a specific subset. The lack of a longer term relationship with mortality in this study, which could of course be affected by the loss of power after 30 days, would suggest that hs-cTnI assays are likely a marker of short term prognosis and not a marker of overall health. If future studies were to demonstrate a longer term relationship this would potentially provide a further area of interest as to whether any medical intervention, most likely with already proven prognostic cardiovascular medications, could adjust the risk in this cohort.
Although the consecutive cohort and the 1 year outcome data from NHS Digital provide complete data, this study does have some limitations, in particular the principal limitation is the sample size. In particular the landmark analysis is limited by the relatively few number of deaths occurring after 30 days, reducing the statistical power of this portion of the analysis. Second, this was a single centre study and therefore has limitations on its generalisability, in particular it is likely that different centres will have different thresholds for admission. Third, and of particular importance, the study did not take into account admission diagnoses which could have provided additional prognostic data that could conceivably have altered the multivariable analysis. Whilst the use of APACHE score allows an assessment of illness severity, the addition of admission diagnoses, particularly the presence of sepsis, could provide additional prognostic data.17,21 Finally the multivariable analysis was performed using an univariable screening method which has limitations when used as a primary method for building models and therefore future similar studies should adopt models based on apriori knowledge.
In conclusion these results indicate that admission hs-cTnI concentration are independently associated with 1 year mortality in a CC population when taken without clinical indication. Landmark analysis indicates that this may be driven by death within the first 30 days
Supplemental Material
sj-docx-1-inc-10.1177_17511437231160078 – Supplemental material for Is high sensitivity troponin, taken regardless of a clinical indication, associated with 1 year mortality in critical care patients?
Supplemental material, sj-docx-1-inc-10.1177_17511437231160078 for Is high sensitivity troponin, taken regardless of a clinical indication, associated with 1 year mortality in critical care patients? by Jonathan Hinton, Maclyn Augustine, Lavinia Gabara, Mark Mariathas, Rick Allan, Florina Borca, Zoe Nicholas, Neil Gillett, Chun Shing Kwok, Paul Cook, Michael PW Grocott, Mamas Mamas and Nick Curzen in Journal of the Intensive Care Society
Footnotes
Declaration of conflicting interests
The author(s) declared the following potential conflicts of interest with respect to the research, authorship, and/or publication of this article: M. P. W. Grocott—unrestricted research grants from Pharmacosmos Ltd and Sphere Medical Ltd as well honoraria for speaking and/or travel expenses from: Astra Zeneca, Edwards Lifescience, Fresenius-Kabi, BOC Medical (Linde Group), Ely-Lilly Critical Care and Cortex GmBH. N. Curzen—unrestricted research grants from: Boston Scientific; Heartflow; Beckman Coulter. Speaker fees/consultancy from: Abbot Vascular; Heartflow; Boston Scientific; travel sponsorship—Edwards; Biosensors, Abbot, Lilly/D-S; St Jude Medical, Medtronic.
Funding
The author(s) disclosed receipt of the following financial support for the research, authorship, and/or publication of this article: Unrestricted Research Grant—Beckman Coulter (BC) for the high sensitivity troponin assays. BC had no role in the design, execution, analysis or interpretation of the study
Data sharing statement
The data used in this study cannot be shared due to the nature of the data sharing agreement with NHS Digital.
Supplemental material
Supplemental material for this article is available online.
References
Supplementary Material
Please find the following supplemental material available below.
For Open Access articles published under a Creative Commons License, all supplemental material carries the same license as the article it is associated with.
For non-Open Access articles published, all supplemental material carries a non-exclusive license, and permission requests for re-use of supplemental material or any part of supplemental material shall be sent directly to the copyright owner as specified in the copyright notice associated with the article.