
Abstract
Purpose
Cirrhotic patients in organ failure are frequently admitted to intensive care units (ICUs) to receive invasive mechanical ventilation (IMV). We evaluated the trends of hospitalizations, in-hospital mortality, hospital costs, and hospital length of stay (LOS) of IMV patients with cirrhosis.
Methods
We analyzed the United States National Inpatient Sample from 2005–2014. We selected discharges of IMV adult (≥18 years) patients with cirrhosis using the International Classification of Diseases, 9th Edition, Clinical Modification codes. Trends were assessed using linear regression and joinpoint regression.
Results
Between 2005 and 2014, there were approximately 9,441,605 hospitalizations of IMV adult patients, of which 4.7% had cirrhosis. There was an increasing trend in the total number of IMV cirrhotic patient hospitalizations (annual percent change [APC] 7.0%, 95% confidence interval [CI] 6.4%; 7.6%, Ptrend < 0.001). The in-hospital case-fatality ratio declined between 2005–2011 (APC –2.9%, 95% CI, –3.4%; –2.4%, Ptrend < 0.001); however, it remained similar between 2011–2014 (Ptrend = 0.58). The total annual hospital costs of all IMV cirrhotic patients increased from approximately $1.2 billion USD in 2005 to $2.7 billion USD in 2014 (Ptrend < 0.001). The mean hospital costs per patient and mean LOS declined between 2005 and 2014 (Ptrend < 0.001 and Ptrend = 0.01 respectively).
Conclusions
The total number of hospitalizations and total annual costs of IMV patients with cirrhosis have been increasing over time. However, past hesitancy around admitting cirrhotic patients to the ICU may need to be tempered by the improving mortality trends in this patient population.
Keywords
Introduction
Cirrhotic patients are often admitted to intensive care units (ICUs) to receive organ support and invasive mechanical ventilation (IMV). These patients generally have poor prognoses, with earlier studies suggesting that their in-hospital mortality ranges between 36–91%.1–4 Furthermore, these patients have prolonged, expensive stays in hospital. 5 In the US, the number of hospital admissions for cirrhotic patients had almost doubled from 2005 to 2015, with a three-fold increase in total annual hospitalization costs. 6 In 2014, the total costs of all hospitalized cirrhotic patients in the United States (US) was estimated at 7.4 billion US dollars (USD). 7
Prior studies of cirrhotic patients have evaluated longitudinal outcomes and trends, without focusing on critically ill patients.6–11 Understanding the temporal trends of critically ill patients with cirrhosis, regarding the number of ICU admissions, mortality, length of stay (LOS), and costs, may have important implications for resource allocation, policy, and clinical decision making. An increasing number of hospitalizations of IMV patients with cirrhosis may forecast a higher demand for ICU beds with ventilatory support. 12 Likewise, the expectation of poor prognoses may lead some clinicians to decline admission to ICUs or limit their interventions.13,14
Recent studies have examined the temporal trends of hospitalizations and outcomes of critically ill patients with cirrhosis.14,15 Between 1998–2012, the number of admissions of cirrhotic patients admitted to United Kingdom ICUs had risen by more than three-fold, with at least half of these patients surviving until hospital discharge. 14 In Australia and New Zealand, cirrhotic patients admitted to ICUs had comparable mortality to non-cirrhotic patients, with declining mortality rates. 15 Trends of hospitalizations and outcomes, particularly among IMV cirrhotic patients, have not been well described in a large US population.
The primary objective of this study was to describe the temporal trends of an IMV patient population of cirrhotic patients, using the National Inpatient Sample (NIS). First, we evaluated the trends in the number of hospitalizations of IMV patients with cirrhosis. Next, we evaluated the trends in clinical outcomes focusing on in-hospital mortality, hospital LOS, and hospital costs. Finally, we compared these outcomes between IMV patients with cirrhosis and without cirrhosis.
Materials and methods
Data source
We evaluated the NIS between 2005–2014. 16 The NIS is the largest US all-payer inpatient database, and it includes all public, academic, non-Federal, short-term, general, and specialty hospitals. 16 Prior to 2012, the NIS included all hospital discharges from a 20% stratified sample of hospitals. Since its re-design in 2012, the NIS represents a 20% stratified sample of discharges from all community hospitals (excluding long-term acute care hospitals) across 45 states and covers more than 97% of the US population. Further information on the NIS is described in the Supplementary Appendix. We obtained a waiver of consent from the former Regina Qu’Appelle Health Region Research Ethics Board (REB-17-23) to conduct this study.
Study population
Our study population was selected using the International Classification of Diseases, 9th Revision, Clinical Modification (ICD-9-CM) codes. We included discharges that met the following criteria: a) adults (i.e. ≥18 years); b) assigned an ICD-9-CM procedure code for IMV and/or insertion of an endotracheal tube. 17 We identified patients with cirrhosis using primary and secondary ICD-9-CM diagnoses, with a previous validated algorithm.18 This algorithm has a sensitivity of 98% and specificity of 43% for detecting patients with cirrhosis. 18 A complete list of the ICD-9-CM codes used, including their validation studies, is described in the Supplementary Appendix eMethods and eTable 1. We excluded patients who had missing data for age. We also excluded liver transplant recipients, who received their transplant prior to the hospitalization of interest. These patients were excluded as they would not have a current diagnosis of cirrhosis.
Measurements
Patient-level characteristics were obtained, including age, gender, race, insurance status, elective versus non-elective admission status, and median household income. Hospital-level characteristics included size, region, location, and teaching status. Diagnoses and procedures included the presence of the Elixhauser comorbidities, alcohol abuse, hepatitis B, hepatitis C, hepatocellular carcinoma, variceal bleeding, ascites, acute kidney injury, sepsis, septic shock, acute respiratory distress syndrome, liver transplantation, renal replacement therapy, and tracheostomy. 19
Outcomes
The primary outcome was the number of hospitalizations of IMV patients with cirrhosis. The yearly population-based hospitalization rate was determined by dividing the number of weighted discharges in the NIS by the appropriate yearly adult population count from US census data.20,21 The rate was expressed as the number of IMV adult cirrhotic hospitalizations per 100,000 US adult population.
Secondary outcomes included all-cause in-hospital mortality, hospital LOS, and hospital costs. The all-cause population mortality rate was represented as the number of IMV adult cirrhotic inpatient deaths per 100,000 US adult population. The IMV cirrhosis-related in-hospital case-fatality ratio was determined by the proportion of hospitalized IMV adult cirrhotic patients that died in hospital. Hospital costs reflected the costs accrued from hospital admission until discharge and were estimated by multiplying total charges (TOTCHG) by the hospital-specific all-payer inpatient cost-to-charge ratio (APICC). 22 Costs were inflation-adjusted to 2014 US dollars (USD), using the US Bureau of Labor Consumer Price Index. 23 Total annual hospitalization costs were estimated by totalling the hospital costs for all IMV cirrhosis-related hospitalizations. Hospital LOS was defined by the total length of hospitalization from time of admission until discharge.
Statistical analysis
All analyses were performed with Stata/MP 15.1 (StataCorp). A two-sided p-value <0.05 was considered statistically significant. Categorical data were presented as counts and weighted percentages, while continuous data were presented as means and standard deviations (SD), or medians and interquartile ranges (IQR), depending on the normality of distribution. The svy, subpop commands were used with the NIS hospital numbers (HOSP_NIS), discharge weights (DISCWT) and strata (NIS_STRATUM). For the years prior to 2012, trend weights (TRENDWT) were used instead of the original discharge weights to account for the NIS re-design. The Agency for Healthcare Research and Quality recommended the use of trend weights to produce consistent and comparable national estimates across all years of the study. 24 Further explanation of these weights is found in the Supplementary Appendix.
Temporal trends were first assessed using the Cochran-Armitage test for categorical variables and survey-specific linear regression for continuous variables. For LOS and hospital costs, these variables were log-transformed as they were not normally distributed, and analysis of trend was performed using the geometric means.
Next, we assessed for the presence of non-linear trends in IMV cirrhosis-related hospitalizations, deaths, mortality rate, total annual hospitalization costs, hospital costs, and LOS, using Joinpoint Regression Program version 4.8.01 (National Cancer Institute). 25 Joinpoint regression is similar to linear spline regression and fits a series of straight lines. 26 Each segment is connected by a joinpoint (“knot”), which represents the year in which a statistically significant change in trend occurred. Joinpoint regression determines the optimal number of joinpoints (between 0 and 2 joinpoints) to include in the model, using a Monte Carlo permutation method, with a minimum of two observed timepoints for all segments. 26 Further information is described in the Supplementary Appendix.
For trends in the number of IMV cirrhosis-related hospitalizations, deaths, and total annual hospital costs, we described the number and location of joinpoints, and estimated the annual percent change (APC) for each segment between joinpoints along with its 95% confidence interval (CI). For trends in the IMV cirrhosis-related case-fatality ratio, we used joinpoint regression to identify the number and location of joinpoints, then we used survey-specific generalized linear model with modified Poisson approach with Huber-White robust errors to fit the joinpoints and estimate the associated APC and 95% CI for each segment between joinpoints.25,27 For trends in the mean hospital LOS and mean hospital costs, we log-transformed these outcomes, then we used survey-specific multivariable linear regression to estimate the APC and 95% CI for each segment between joinpoints, using the geometric means.
Subsequently, we compared in-hospital mortality between hospitalizations of IMV patients with and without cirrhosis, using survey-specific multivariable logistic regression, to estimate the adjusted odds ratio (OR) of in-hospital mortality and 95% CI. Adjustment was performed for year, patient-related and hospital-related characteristics, as detailed in the Supplementary Appendix. Survey-specific linear regression was used to estimate the mean difference and 95% CI of hospital LOS and hospital costs between hospitalizations of IMV patients with and without cirrhosis, with similar adjustment of variables. Additional adjustment for hospital mortality was included for the hospital LOS analysis, and additional adjustment for hospital mortality and LOS were included for the hospital costs analysis.
Sensitivity analysis
We performed sensitivity analyses to evaluate the robustness of our findings of trend. First, we obtained risk-adjusted estimates of the APC and 95% CI for the IMV cirrhosis-related IMV, hospital LOS, and hospital costs, for each segment between joinpoints, adjusting for patient-related and hospital-related characteristics, as detailed in the Supplementary Appendix. Next, the prior trend analyses were repeated with a restrictive population of cirrhosis, using an algorithm derived by Goldberg and colleagues, to ensure these findings were applicable to population of decompensated cirrhotic patients. 28 We also performed an analysis, excluding elective admissions, to ensure the selection of patients with higher severity of illness. Finally, we performed multiple imputation with chained equations, using 10 imputations, and repeated the analyses with the imputed dataset.
Results
Baseline characteristics
Between 2005–2014, there were approximately 37,17,76,859 hospitalizations with a weighted total of 94,41,605 (2.5%) hospitalizations of IMV adult patients, of which 4,39,196 (4.7%) had cirrhosis (Figure 1). Baseline characteristics of cirrhosis-related IMV hospitalizations are described in Table 1 and Supplementary Appendix eTable 2. Missing data are described in Supplementary Appendix eTable 3. Of the potentially modifiable risk factors, alcohol abuse was most common, followed by hepatitis C. Most patients were cared for in large urban teaching hospitals. Approximately 34.7% of hospitalizations had concurrent diagnoses of severe sepsis and/or septic shock and 51.2% had acute kidney injury, while only 2.2% had acute variceal bleeding.
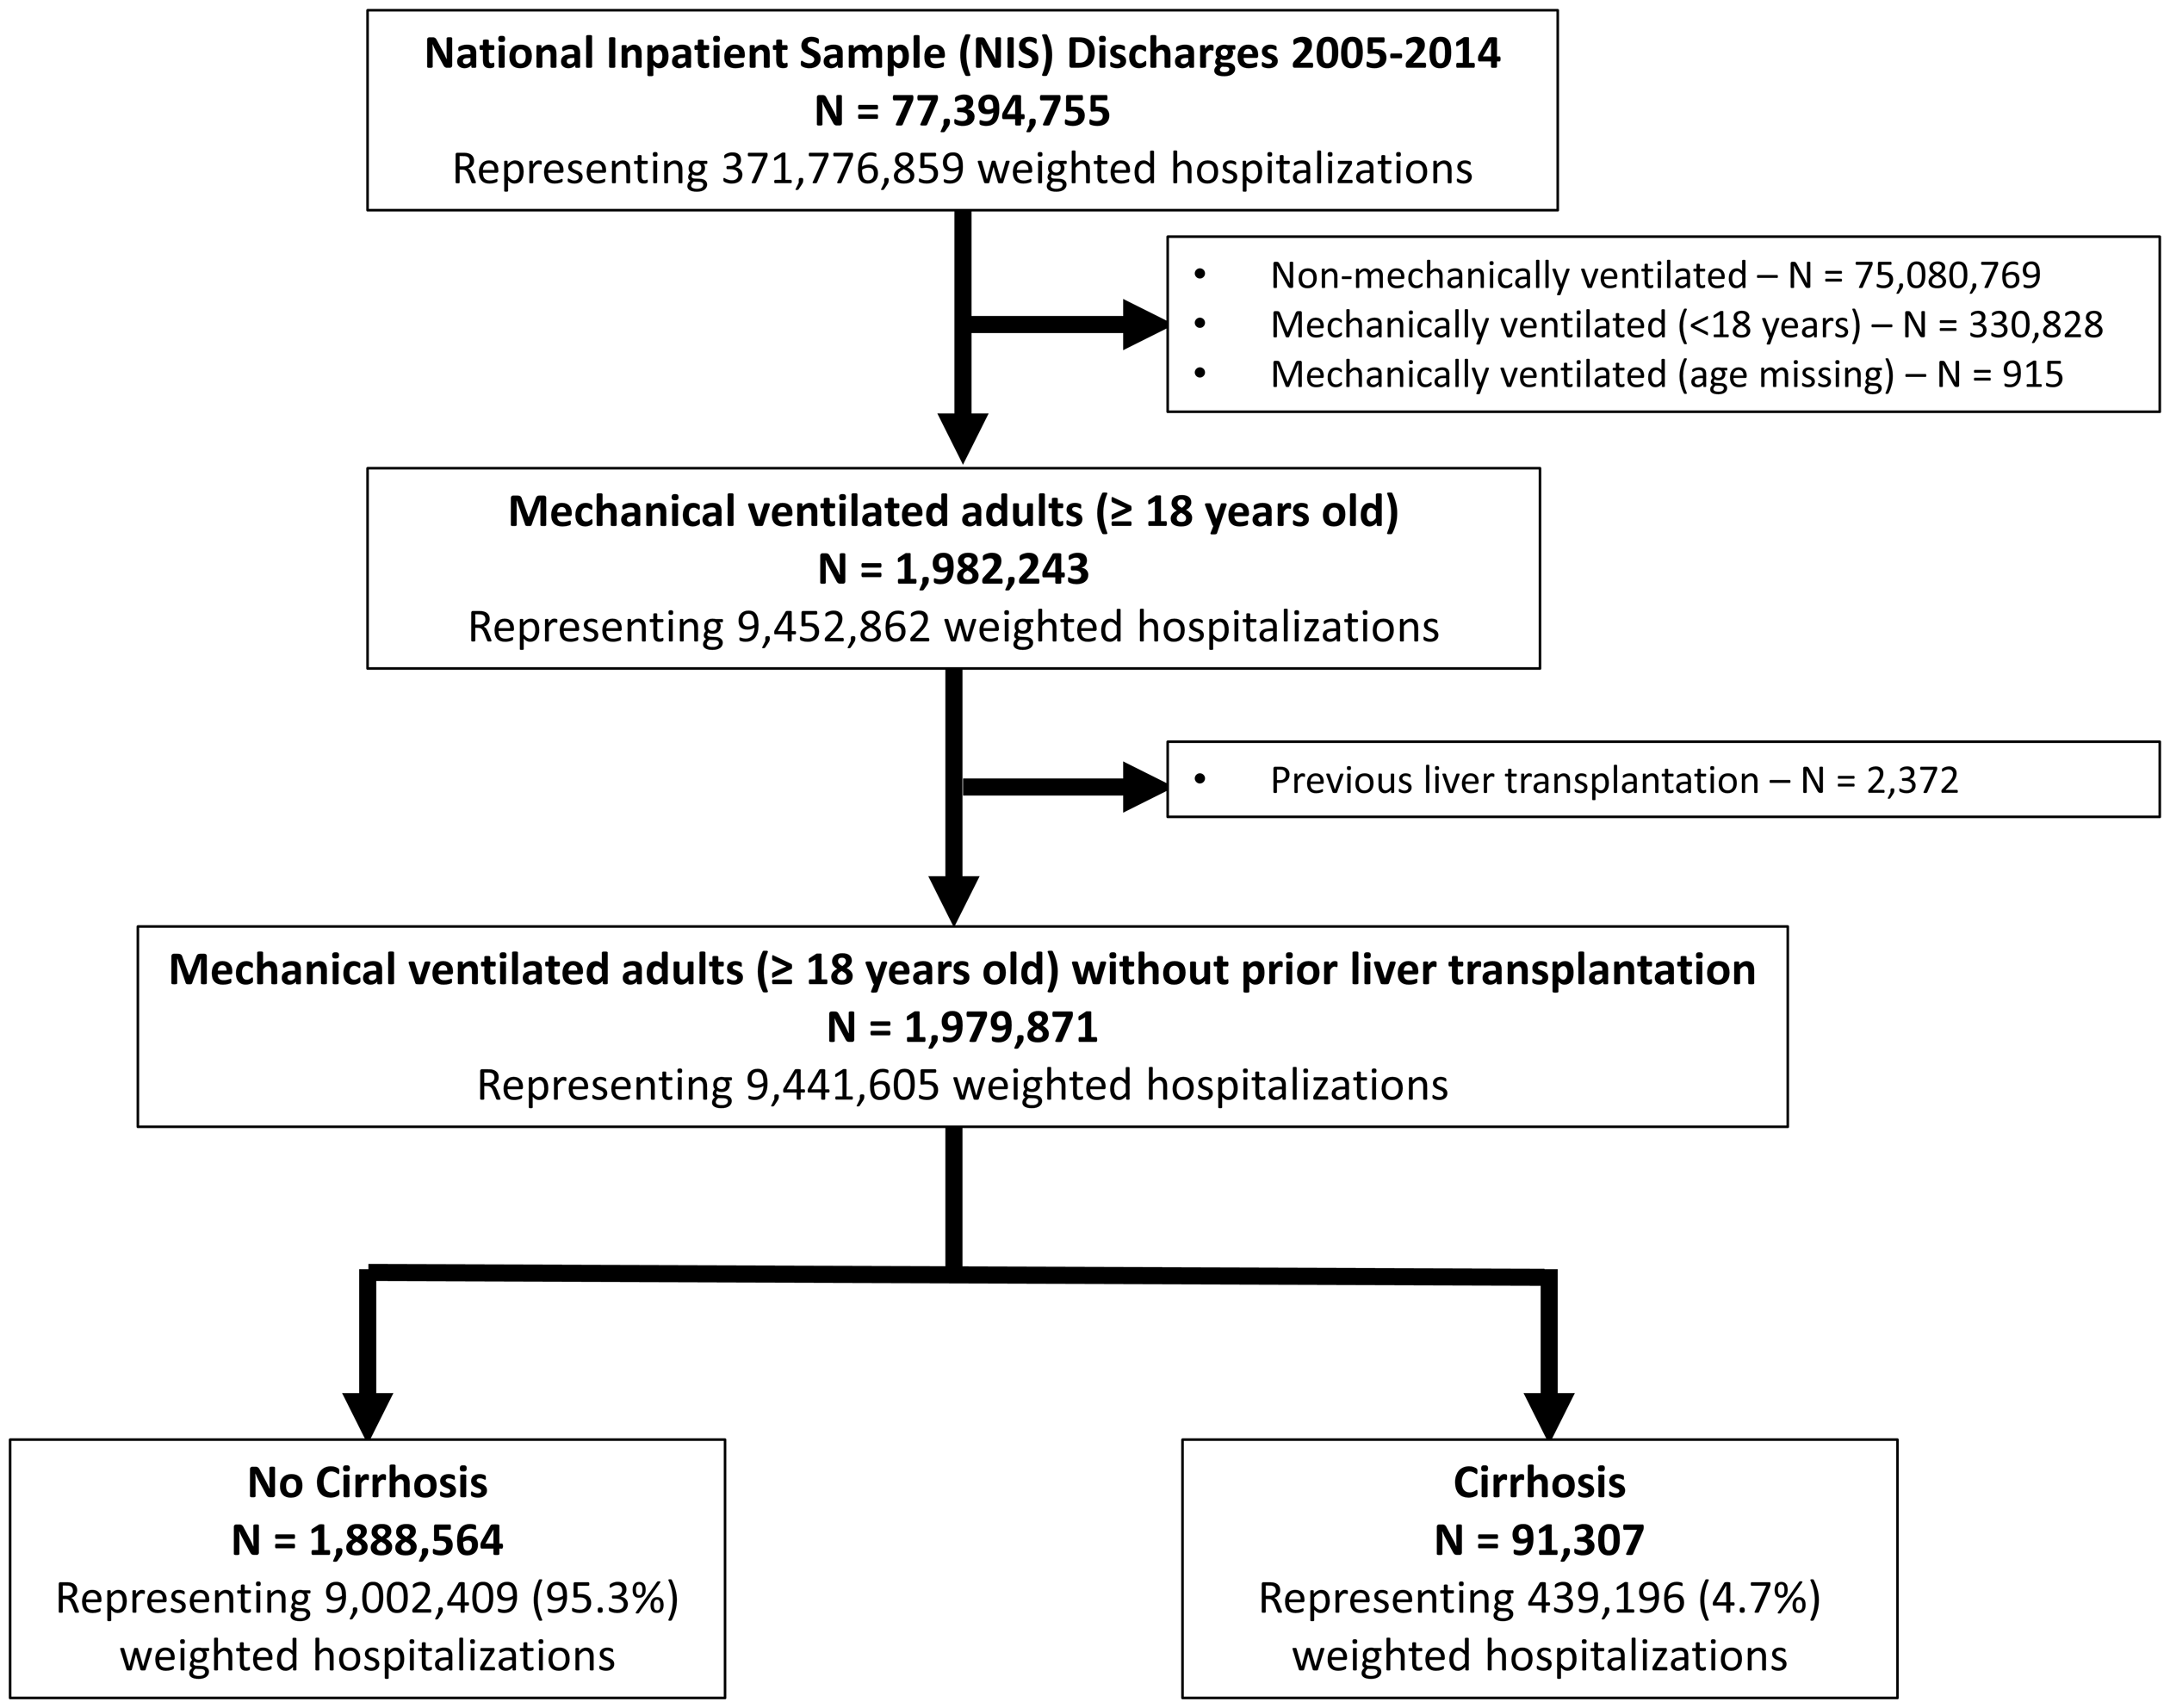
Flow chart of hospitalizations in the National Inpatient Sample 2005–2014.
Demographics and clinical characteristics among hospitalized cirrhotic patients receiving mechanical ventilation from 2005–2014.
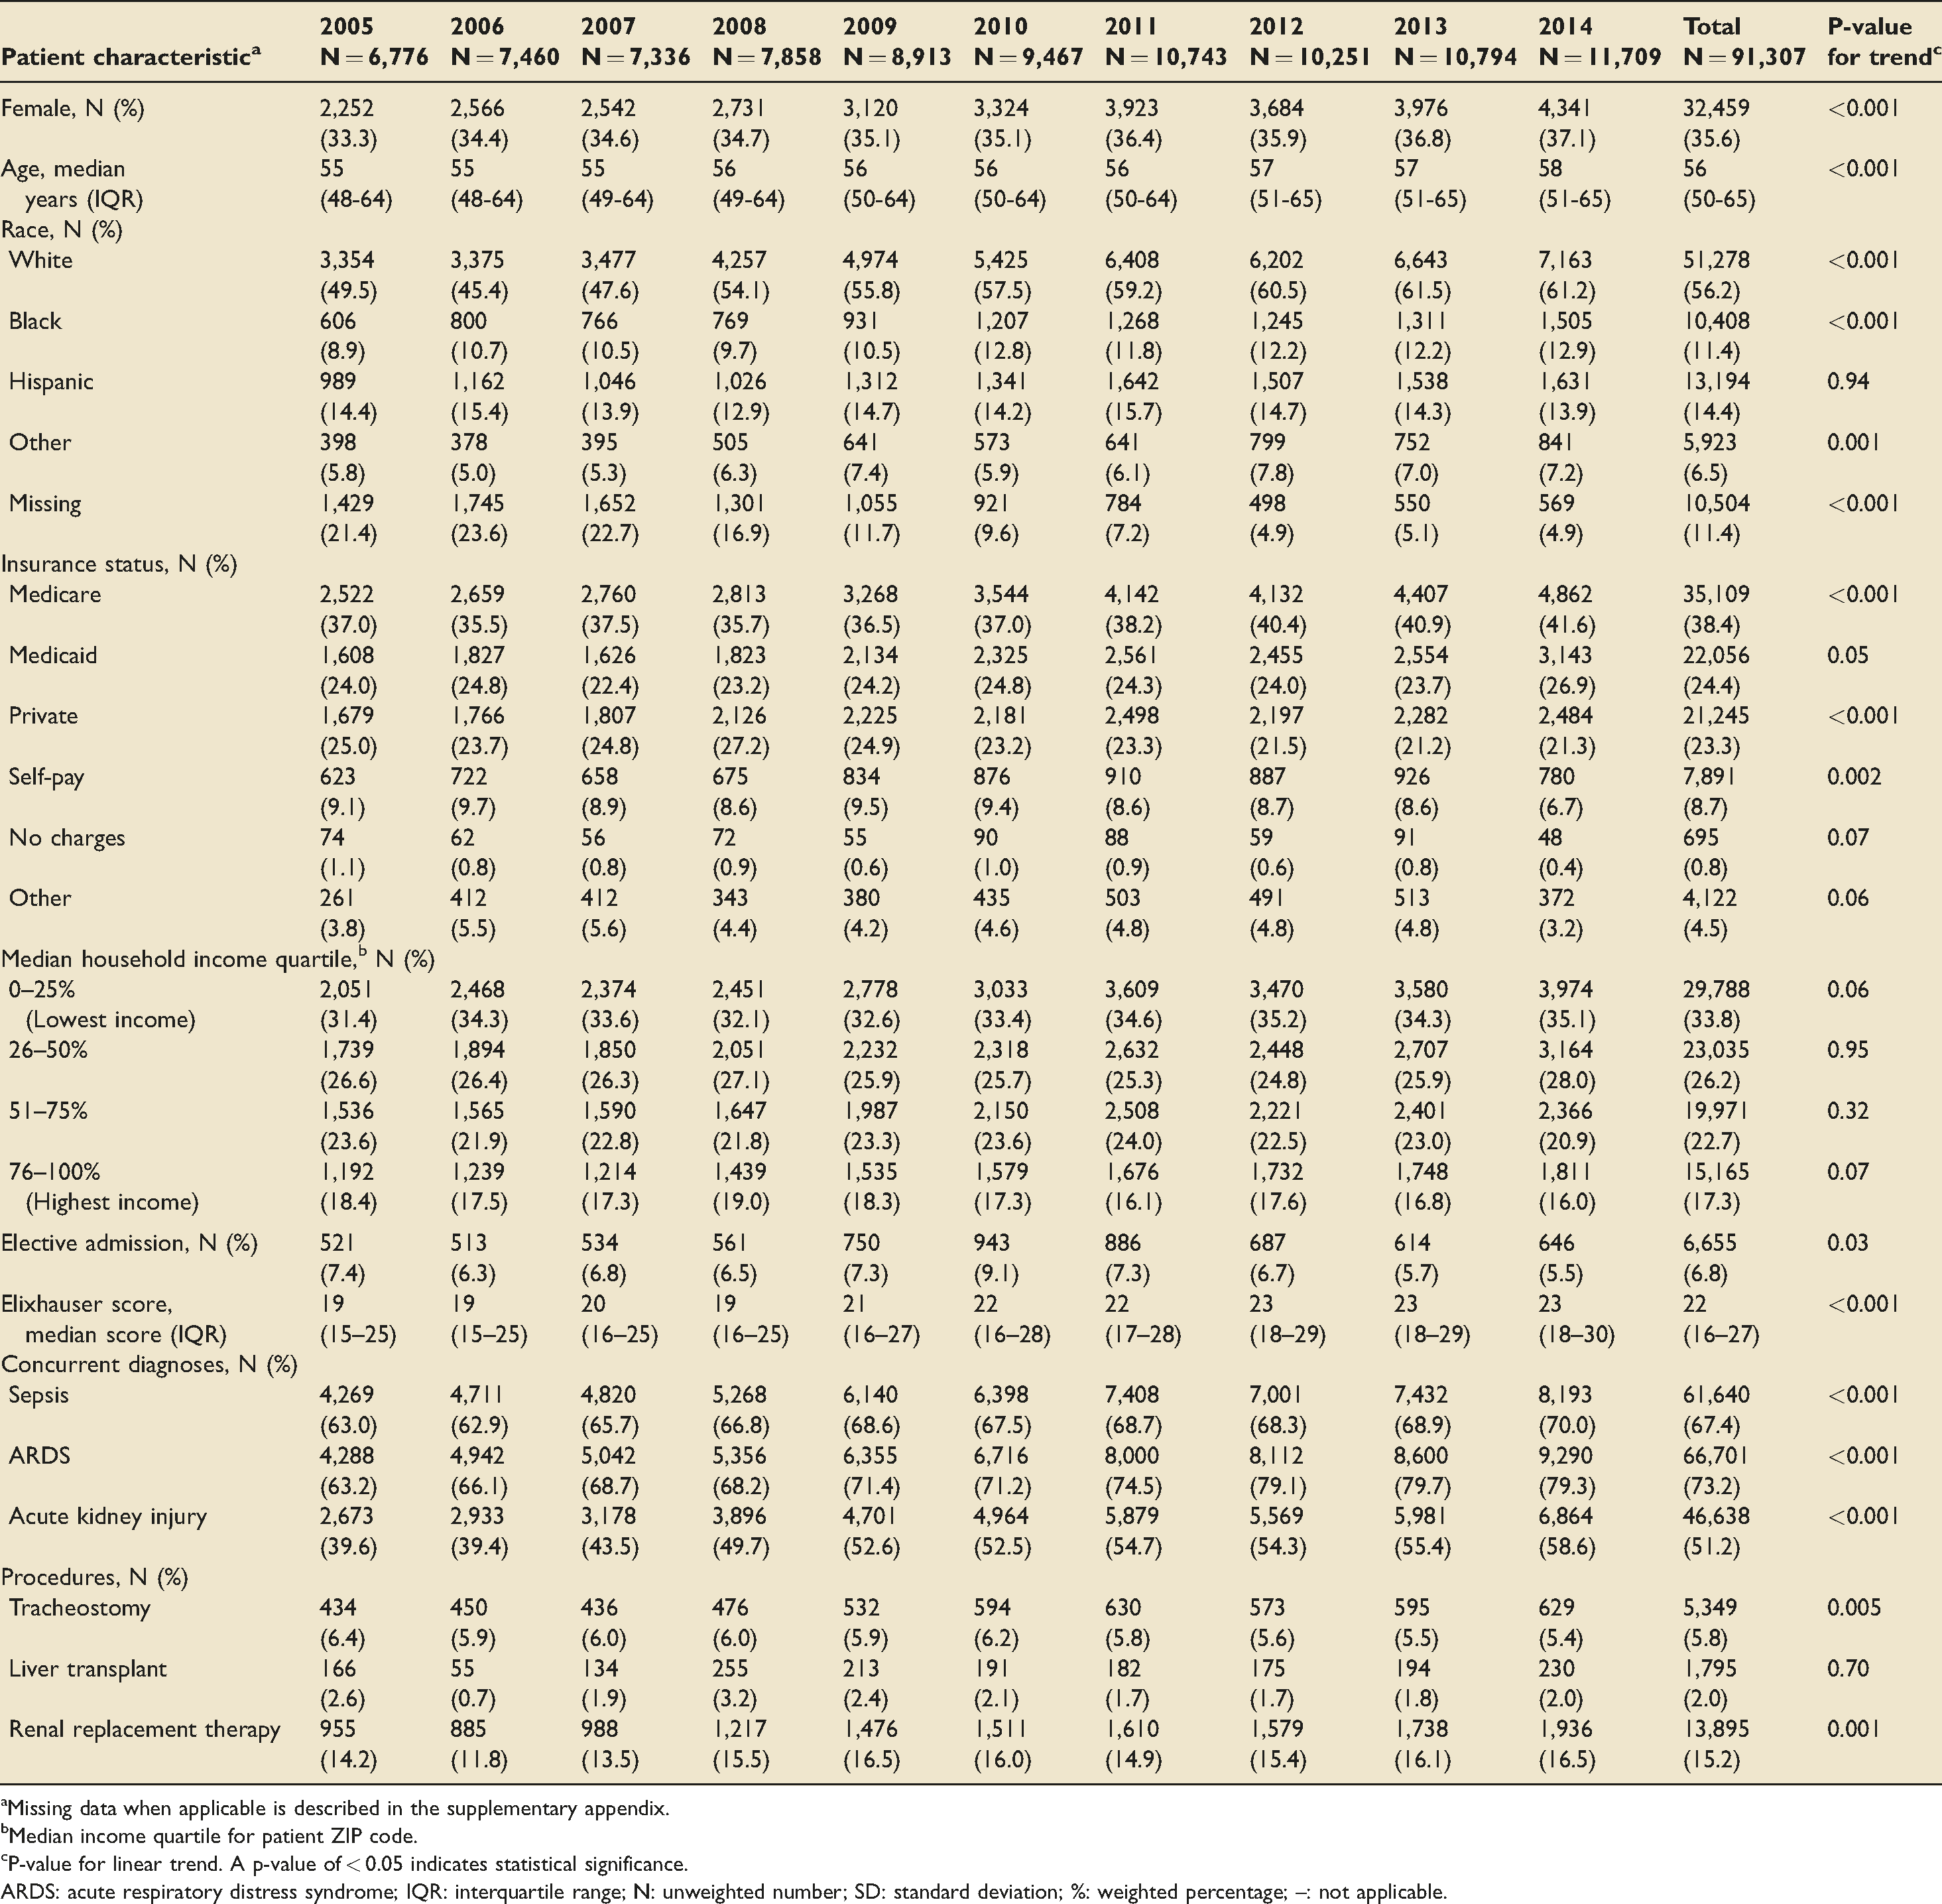
aMissing data when applicable is described in the supplementary appendix.
bMedian income quartile for patient ZIP code.
cP-value for linear trend. A p-value of < 0.05 indicates statistical significance.
ARDS: acute respiratory distress syndrome; IQR: interquartile range; N: unweighted number; SD: standard deviation; %: weighted percentage; –: not applicable.
Trends in hospitalizations
Between 2005–2014, the number of cirrhosis-related IMV hospitalizations increased by 84% with an APC of 7.0% (95% CI 6.4%; 7.6%, Ptrend < 0.001) (Tables 2 and 3). There were 31,839 weighted hospitalizations in 2005 and 58,545 in 2014, corresponding to a 67% increase in the hospitalization rate (Ptrend < 0.001) (Figure 2). While the number of IMV hospitalizations for cirrhotic patients related to alcohol and hepatitis C have been increasing annually, the number of hospitalizations not related to alcohol, hepatitis B, and/or hepatitis C has increased by over 170% from 2005 to 2014 (Ptrend < 0.001).
Hospitalizations, deaths, and costs among mechanically ventilated cirrhosis-related patient hospitalizations between 2005–2014.
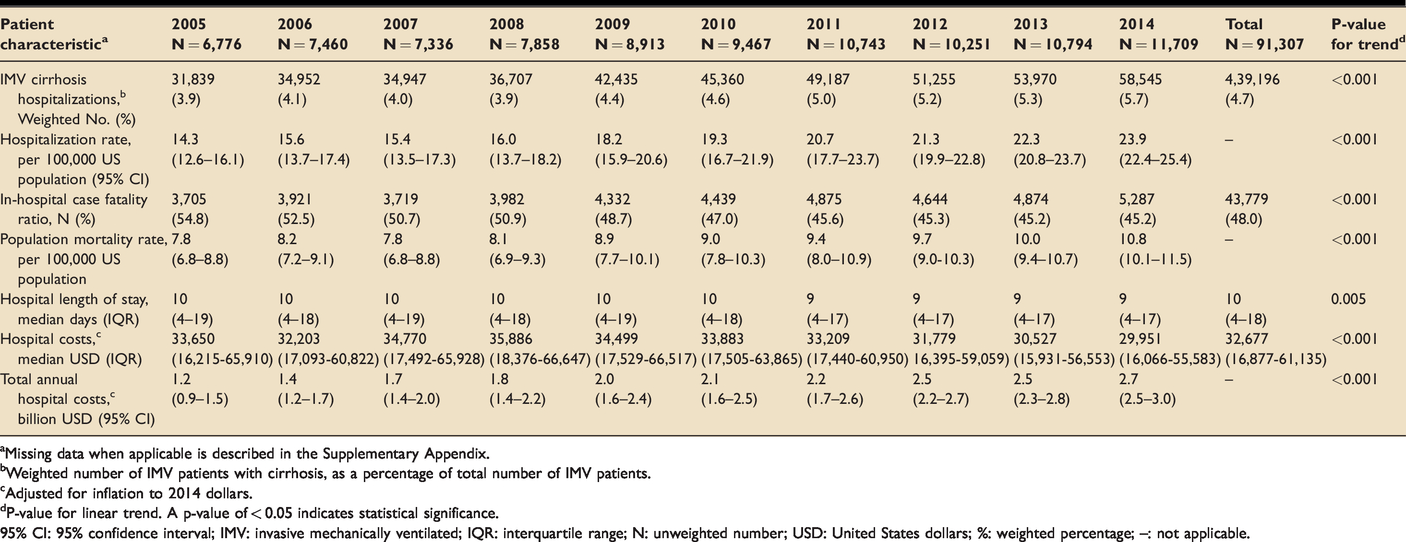
aMissing data when applicable is described in the Supplementary Appendix.
bWeighted number of IMV patients with cirrhosis, as a percentage of total number of IMV patients.
cAdjusted for inflation to 2014 dollars.
dP-value for linear trend. A p-value of < 0.05 indicates statistical significance.
95% CI: 95% confidence interval; IMV: invasive mechanically ventilated; IQR: interquartile range; N: unweighted number; USD: United States dollars; %: weighted percentage; –: not applicable.
Temporal changes in clinical outcomes among mechanically ventilated cirrhosis-related patient hospitalizations between 2005–2014.
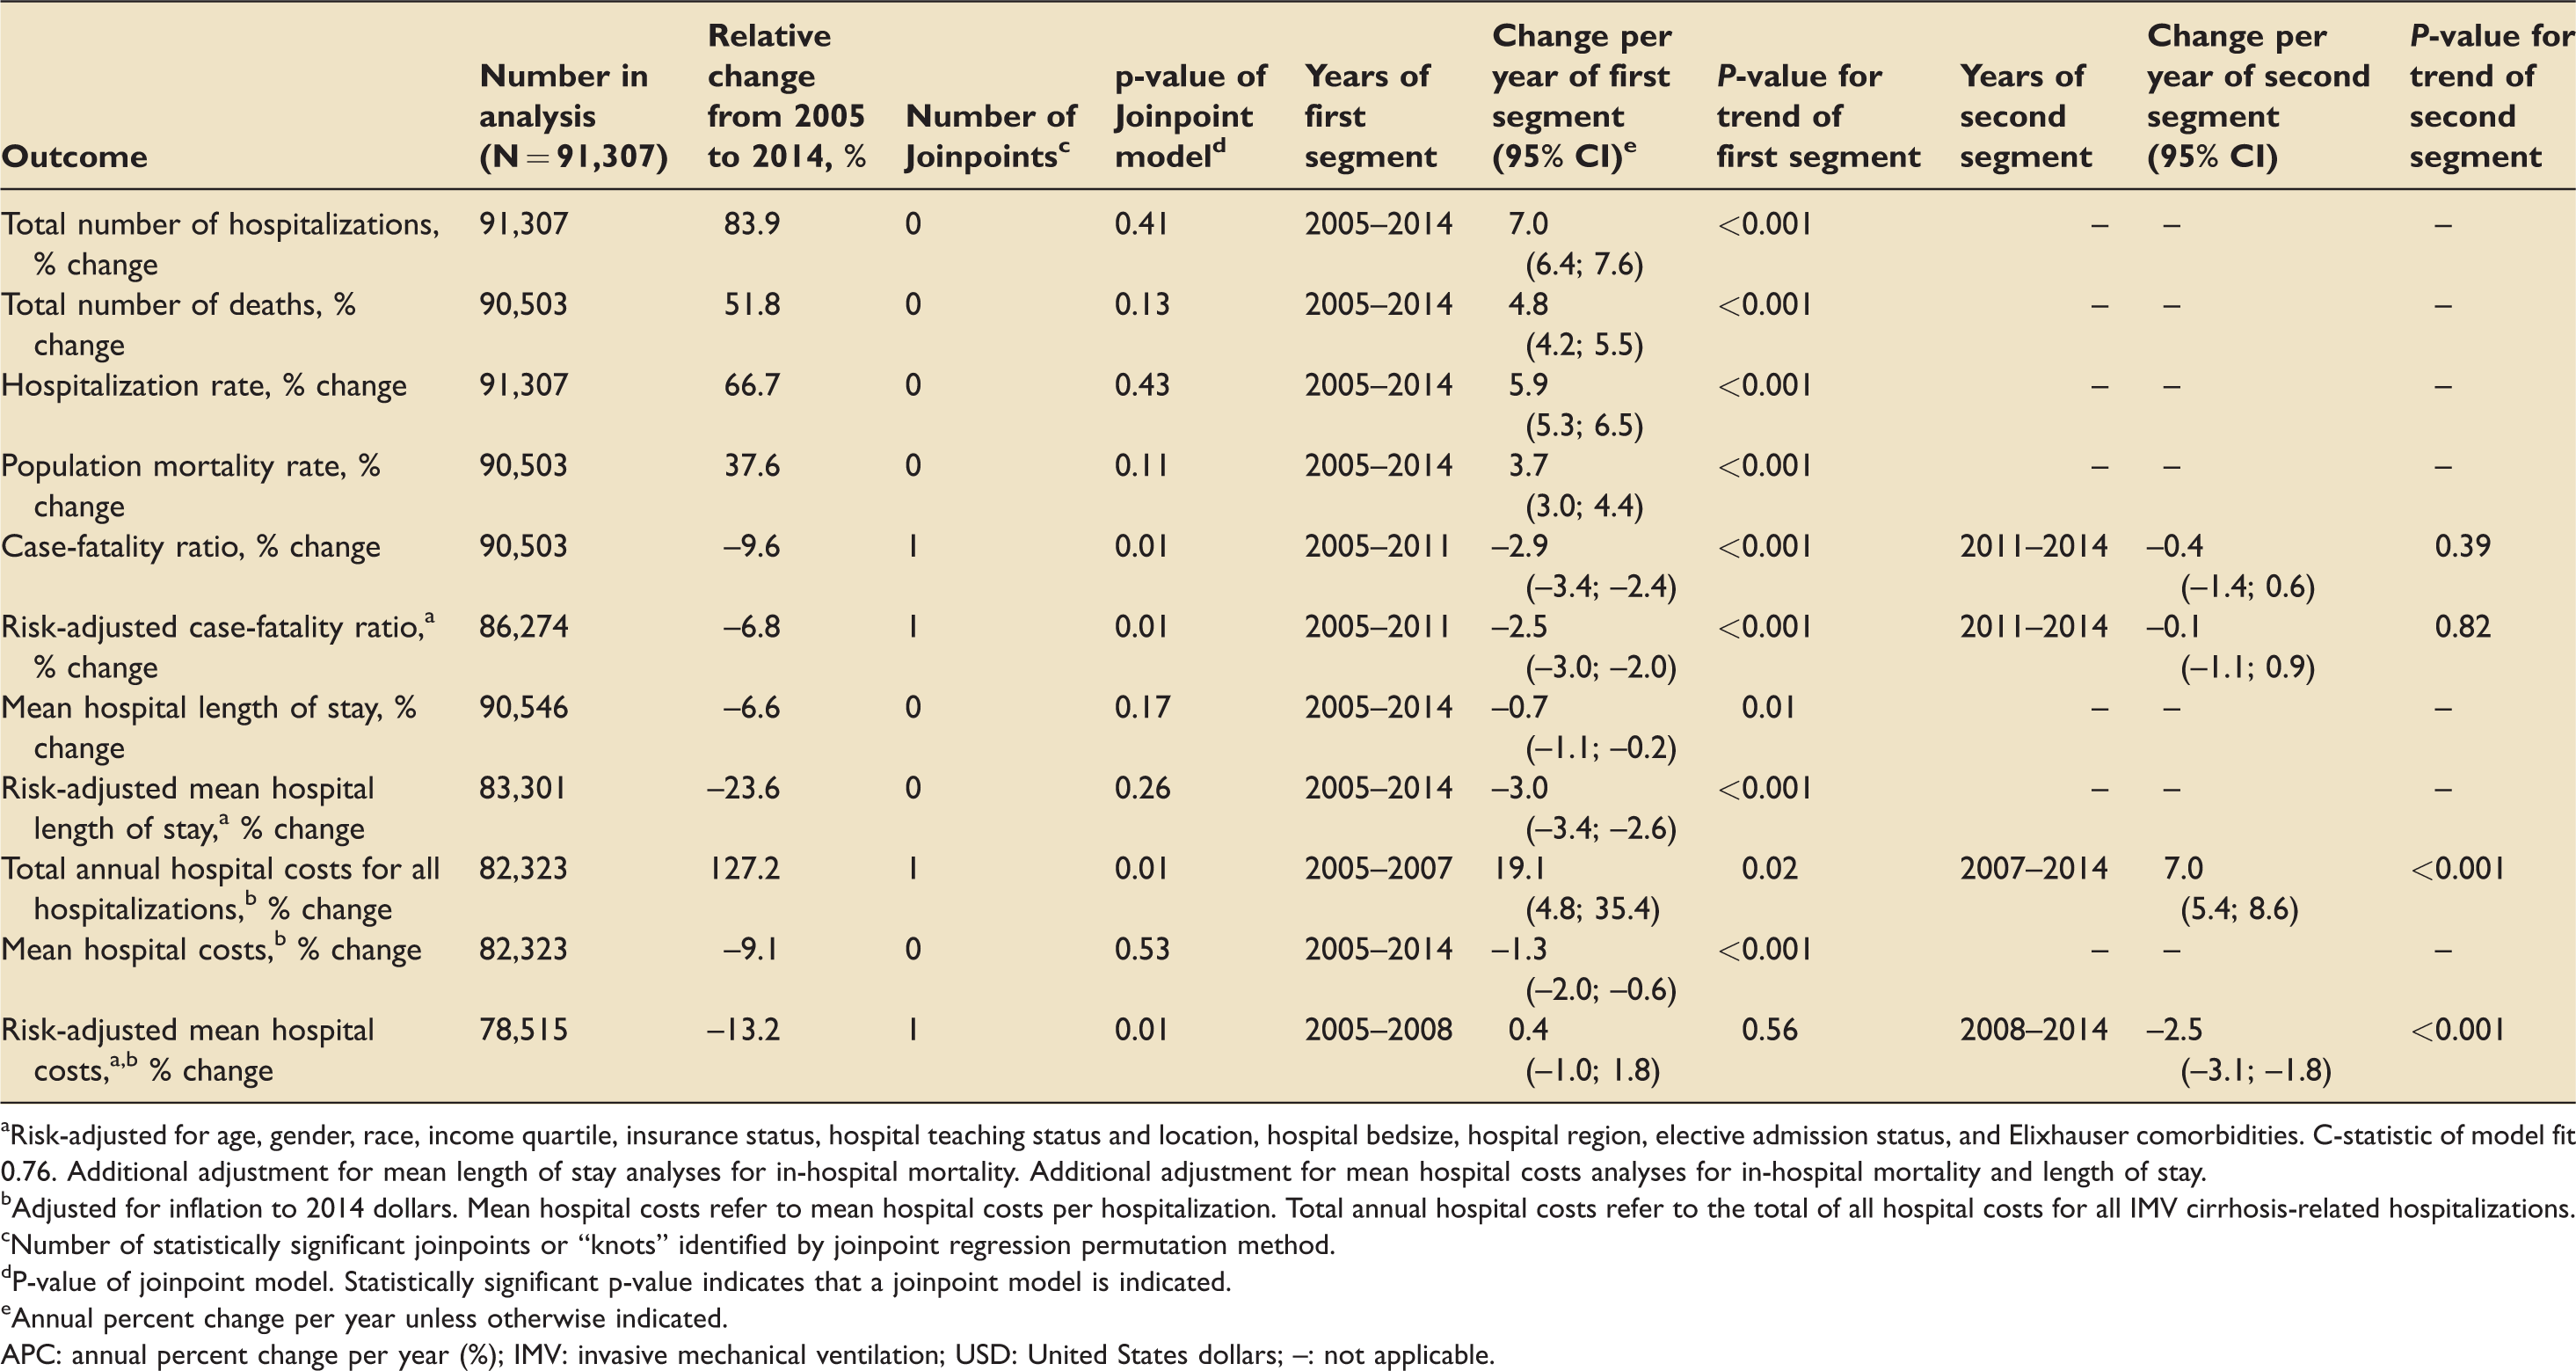
aRisk-adjusted for age, gender, race, income quartile, insurance status, hospital teaching status and location, hospital bedsize, hospital region, elective admission status, and Elixhauser comorbidities. C-statistic of model fit 0.76. Additional adjustment for mean length of stay analyses for in-hospital mortality. Additional adjustment for mean hospital costs analyses for in-hospital mortality and length of stay.
bAdjusted for inflation to 2014 dollars. Mean hospital costs refer to mean hospital costs per hospitalization. Total annual hospital costs refer to the total of all hospital costs for all IMV cirrhosis-related hospitalizations.
cNumber of statistically significant joinpoints or “knots” identified by joinpoint regression permutation method.
dP-value of joinpoint model. Statistically significant p-value indicates that a joinpoint model is indicated.
eAnnual percent change per year unless otherwise indicated.
APC: annual percent change per year (%); IMV: invasive mechanical ventilation; USD: United States dollars; –: not applicable.
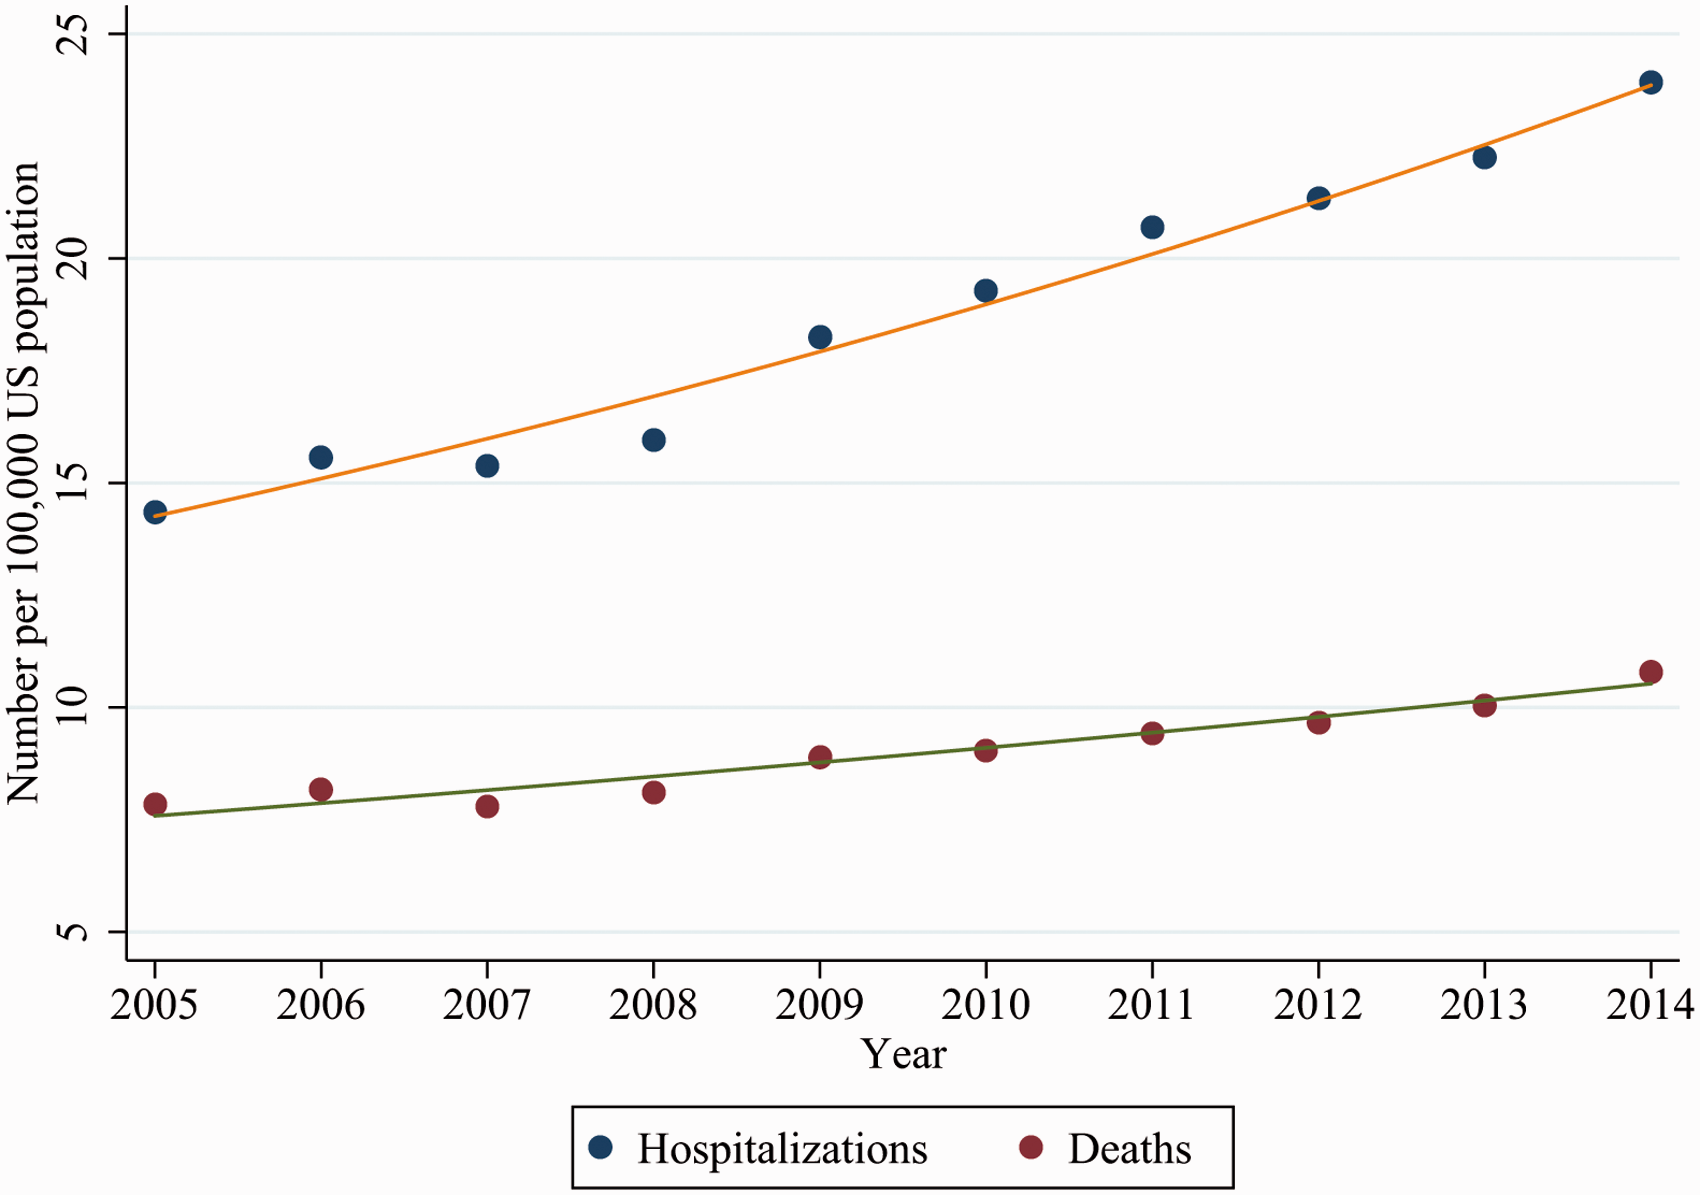
Incidence of hospitalizations and deaths of mechanically ventilated adult cirrhotic patients from the National Inpatient Sample 2005–2014. The orange line represents the estimated slope of the annual percent change (APC) in hospitalization rate (APC 5.9%, 95% CI, 5.3%; 6.5%, Ptrend < 0.001). The green line represents the estimated slope of the APC of the overall population mortality rate (APC 3.7%, 95% CI 3.0%; 4.4%, Ptrend < 0.001).
Trends in all-cause mortality
Between 2005–2014, the overall population mortality rate increased by 37.6% from 7.8 deaths per 1,00,000 US adult population in 2005 to 10.8 deaths per 1,00,000 US adult population in 2014 (APC 3.7%, 95% CI 3.0%; 4.4%, Ptrend < 0.001) (Tables 2 and 3 and Figure 2). The in-hospital case-fatality ratio was approximately 48.0%. The in-hospital case-fatality ratio declined between 2005–2014, with one joinpoint identified in 2008 (P = 0.01) (Figure 3). Between 2005–2011, the mortality decreased by 2.9% annually (95% CI, –3.4%; –2.4%, Ptrend < 0.001), while the mortality remained similar between 2011–2014 (Ptrend = 0.39).
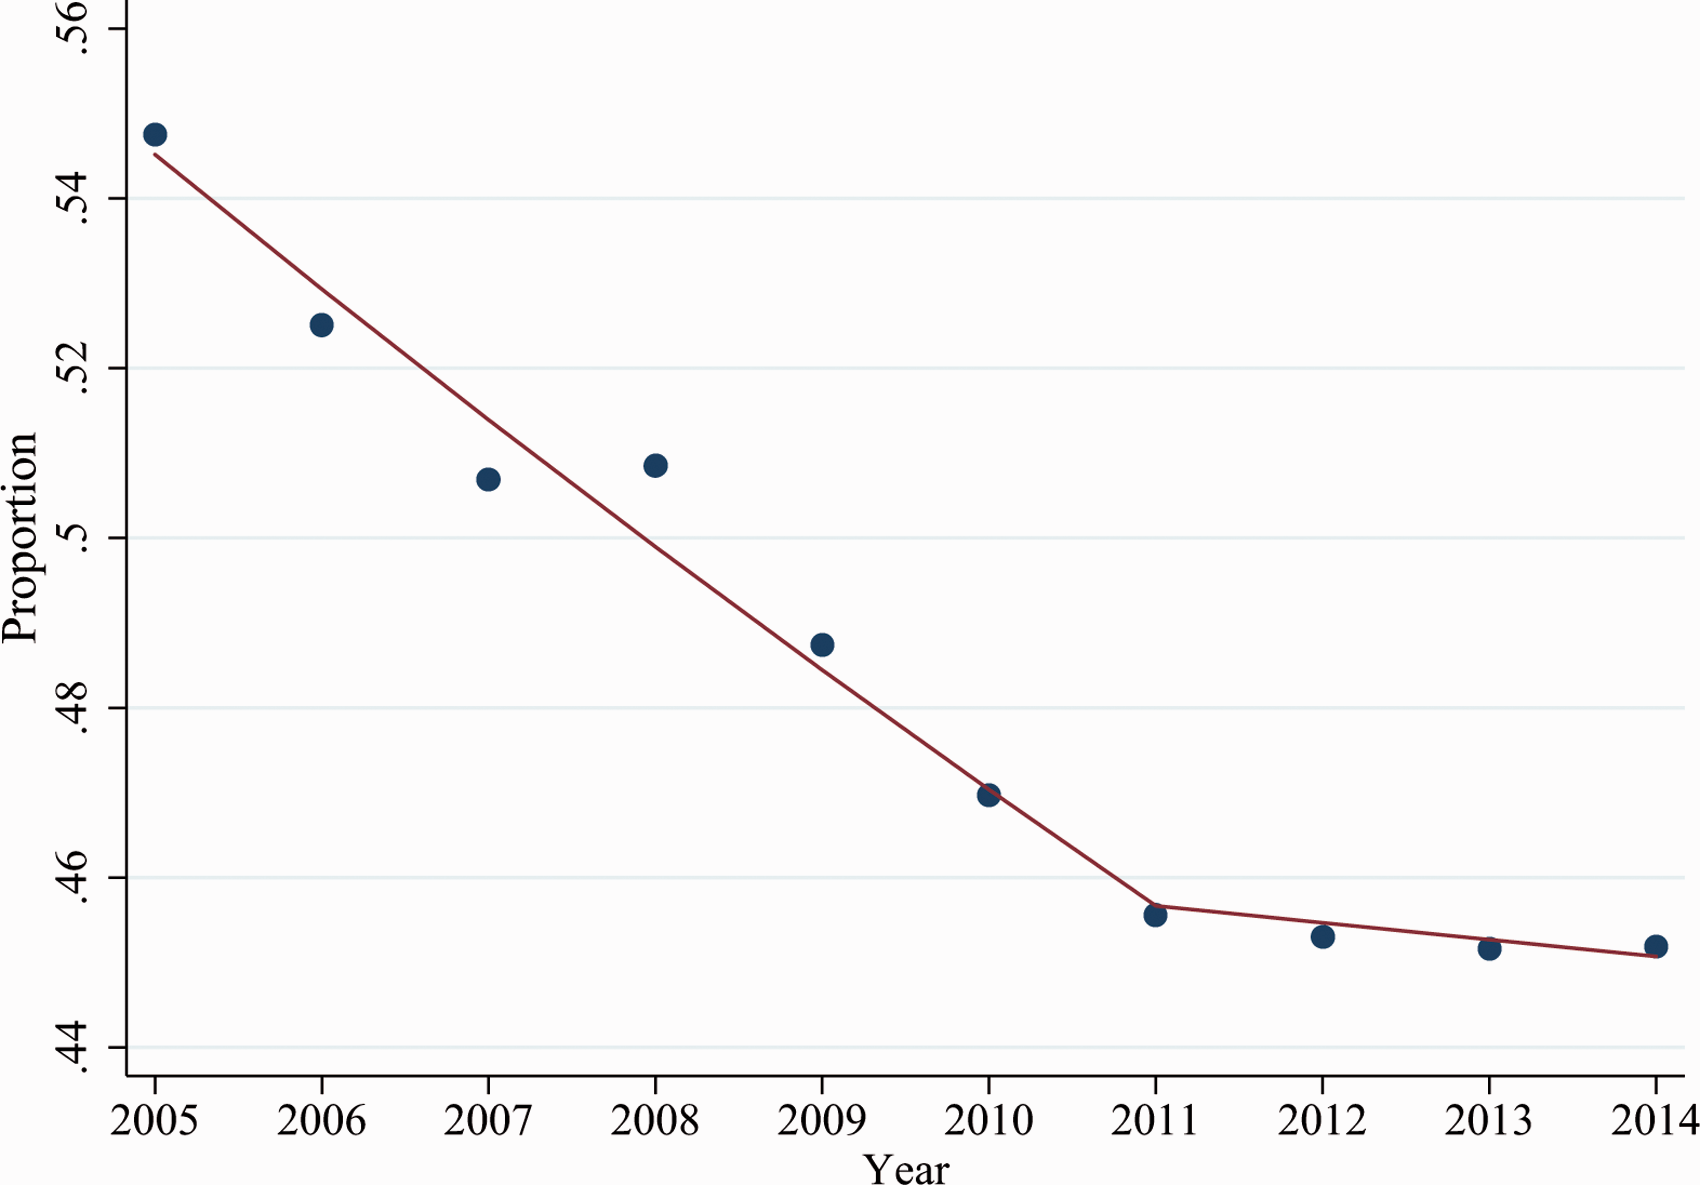
In-hospital case-fatality ratio for mechanically ventilated adult cirrhotic patients from the National Inpatient Sample 2005–2014. One joinpoint was identified in 2011 (P = 0.01). In-hospital mortality declined between 2005–2011, with an annual percent change (APC) of the in-hospital case-fatality ratio of –2.9% (95% CI –3.4%; –2.4%, Ptrend < 0.001). The in-hospital case-fatality ratio remained similar between 2011–2014 (APC –0.4%, 95% CI, –1.4%; 0.6%, Ptrend = 0.39).
Trends in hospital length of stay and hospital costs
The median hospital LOS was 10 days (IQR 4–18 days), with a trend towards reduced hospital LOS (APC –0.7%, 95% CI, –1.1%; –0.2%, Ptrend = 0.01) (Table 3). The median hospital costs was $32,677 (IQR $16,877; $61,135), after inflation-adjustment to 2014 dollars. The total annual hospitalization costs increased from approximately $1.2 billion USD in 2005 to $2.7 billion USD in 2014, with one joinpoint identified in 2007 (Table 3, Supplementary Appendix eFigure 1). Between 2005–2007, the total annual hospitalization costs increased by 19.1% annually (95% CI, 4.8%; 35.4%, Ptrend = 0.02), while they increased by 7.0% annually between 2007–2014 (95% CI, 5.4%; 8.6%, Ptrend < 0.001). However, the mean hospital costs per hospitalization have declined from 2005–2014 (APC –1.3%, 95% CI, –0.6%; –2.0%, Ptrend < 0.001).
Comparison of hospitalizations of mechanically ventilated patients with and without cirrhosis
After performing multivariable analysis (c-statistic = 0.81), IMV patients with cirrhosis had higher odds of in-hospital mortality (odds ratio [OR] 2.59, [95% CI 2.54; 2.63], P < 0.001) compared to IMV non-cirrhotic patients, after adjustment (Supplementary Appendix eTable 4). They had also longer lengths of stay (additional 0.8 days, 95% CI, 0.6; 1.0, P < 0.001), after adjustment. However, mean hospital costs were similar (P = 0.13).
Sensitivity analyses
We performed sensitivity analyses to evaluate our findings. After performing risk-adjusted joinpoint regression, we found that the in-hospital case-fatality ratio of IMV patients with cirrhosis declined (APC –2.5%, 95% CI –3.0%; –2.0%, Ptrend < 0.001) between 2005–2011, while it remained similar between 2011–2014 (Ptrend = 0.82) (Table 3). The mean hospital LOS declined between 2005–2014 (APC –3.0%, 95% CI, –3.4%; –2.6%). Mean hospital costs did not change between 2005–2008 (Ptrend = 0.56); however, they declined between 2008–2014 (APC –2.5%, 95% CI, –3.1%; –1.8%).
We found similar results for our analyses of trend and comparisons between IMV hospitalizations with and without cirrhosis, when using the more restrictive Goldberg definition of cirrhosis and when excluding elective admissions 28 (Supplementary Appendix eResults, eTable 5, eTable 6, eTable 7 and eTable 8). To account for missing data, we repeated the primary analyses of trend and comparisons, using multiple imputation with chained equations and found similar findings in the imputed dataset (Supplementary Appendix eResults, eTable 9 and eTable 10).
Discussion
We report one of the first studies to examine the trends in hospitalizations, outcomes, and hospital costs of cirrhotic patients receiving IMV in the US. In this study, we have found that 1 the hospitalization rate of IMV patients with cirrhosis has increased, 2 total annual costs of all hospitalizations across the US have risen, 3 in-hospital case-fatality rate, mean hospital LOS, and mean hospital costs of these patients have declined, and 4 these patients still have worse clinical outcomes than non-cirrhotic IMV patients.
In our study, the number of hospitalizations of patients with cirrhosis requiring IMV, rose from 3.9% of all IMV patients in 2005 to 5.7% in 2014. In 2014, we found that IMV cirrhotic patients had costly inpatient hospitalizations accounting for at least $2.7 billion USD in healthcare costs. For reference, the average cost of all cirrhotic hospitalizations in a similar year was roughly $7.4 billion. 7 These costs are rising, reflective of an increasing number of hospitalizations. A prior study by Desai and colleagues had found a weighted mean cost of hospitalizations of patients with cirrhosis and IMV of $41,269. 7 We estimated higher costs as we included patients who were sicker (i.e. many patients included had sepsis and acute kidney injury) and did not specifically include patients with an ICD-9-CM code of primary biliary cholangitis (as these patients may not necessarily have cirrhosis).
Prior studies of critically ill patients with cirrhosis had described very poor prognoses, with a prior meta-analysis describing an in-hospital mortality rate of 51.4%.1,3,4,29 In this study, we found an in-hospital case-fatality ratio of 48.0%, which has been consistent with prior studies.1,2,30–32 A substantial proportion of these patients (>25%) in our cohort had severe sepsis and/or septic shock. Likewise, the presence of AKI and ARDS were quite common. Mortality in cirrhotic patients is likely influenced by an increasing burden of concurrent diagnoses and/or organ failures including sepsis, ARDS, and AKI. Sepsis in critically ill cirrhotic patients has been strongly associated with increased LOS, hospitalization costs and mortality, and it may be a precipitant for acute-on-chronic liver failure (ACLF).30,33–35
Of note, we observed a reducing trend of the in-hospital case-fatality ratio in these patients, similar to a prior study done by McPhail and colleagues in the United Kingdom. 14 We observed this trend despite an increasing degree of AKI, sepsis, and comorbidities in this patient population. This may be reflective of improvements in critical care practice and quality improvement initiatives. While most critically ill patients with cirrhosis were not expected to survive in the past, this has now changed with current data.
Strengths and limitations
There are several limitations with this study. First, administrative databases are susceptible to coding inaccuracies. The detection of IMV in administrative databases has been shown to have moderate sensitivity (ranging from 40–70%) with high specificity (>95%).36,37 Consequently, our estimates of the total costs or the total number of hospitalizations could be underestimated. Second, due to limitations in ICD-9-CM coding, we were limited in evaluating certain diagnoses, such as ACLF. Prior studies had attempted to evaluate ACLF using the North American Consortium for the Study of End-Stage Liver Disease (NACSELD) criteria.11,38 However, there has not yet been any validation studies of ICD-9-CM coding for ACLF, nor any validation studies for correctly identifying the organ failures. Vasopressor usage (procedure code 00.17) is undercoded with low sensitivity (<10%). 39 Additionally, some ICD-9-CM codes were recently introduced. The ICD-9-CM coding was introduced for spontaneous bacteria peritonitis in 2005 and autoimmune hepatitis in 2008. 40 Third, the NIS changed to ICD-10-CM coding partway through 2015, which precluded 2015 and subsequent years from inclusion, as validation studies have not been performed for ICD-10-CM coding. Therefore, our study may be limited by the relative age of the data. Fourth, 8.9% of our data was missing for the cost outcome, which may limit the strengths of these conclusions. However, we performed multiple imputation to verify these conclusions. Finally, the NIS is limited by the lack of clinical data (such as severity of illness scores).
Despite these limitations, we evaluated a large dataset consisting of over 91,000 unweighted (4,00,000 weighted) hospitalizations with IMV patients with cirrhosis. We found that IMV cirrhotic patients generally have guarded prognoses, with expensive hospital stays. However, over half of these patients are now surviving to hospital discharge. Past hesitancy around admitting cirrhotic patients to the ICU needs to be tempered by the improving trends in in-hospital mortality. Our findings based on ten years of US national data may help guide intensivists during difficult situations and conversations, with these patients and their family members, to manage expectations and preserve quality of life.
Conclusions
There has been an increasing trend in the number of hospitalizations of IMV patients with cirrhosis, resulting in higher total annual costs. However, there have been improving trends in the in-hospital case-fatality rate, warranting a trial of ICU support in the critically ill cirrhotic patient.
Supplemental Material
sj-pdf-1-inc-10.1177_1751143720985293 - Supplemental material for Trends and outcomes of mechanically ventilated cirrhotic patients in the United States from 2005–2014
Supplemental material, sj-pdf-1-inc-10.1177_1751143720985293 for Trends and outcomes of mechanically ventilated cirrhotic patients in the United States from 2005–2014 by Kyle Cheung, Jonathan F Mailman, Jennifer J Crawford, Constantine J Karvellas and Eric Sy in Journal of the Intensive Care Society
Footnotes
Authors’ contributions
KC contributed to the study by planning design, obtaining the data set, analyzing data, and drafting the manuscript. JFM contributed to the study by planning design and reviewing the manuscript. JC contributed to the study by planning design and reviewing the manuscript. CJK contributed to the study by contributing to the design and reviewing the manuscript. ES contributed to the study by planning design, obtaining the data set, analyzing data, and drafting the manuscript. All authors reviewed the final manuscript and contributed to its content.
Declaration of conflicting interests
The author(s) declared no potential conflicts of interest with respect to the research, authorship, and/or publication of this article.
Ethics approval
Ethics approval of this study was approved by the former Regina Qu’Appelle Health Region Research Ethics Board (REB-17-23).
Funding
The author(s) disclosed receipt of the following financial support for the research, authorship, and/or publication of this article: KC was funded by a University of Saskatchewan College of Medicine Dean’s Summer Student Project 2017 Grant. Otherwise, there were no grants/funding from any other public, private, or commercial interests.
Supplemental material
Supplemental material for this article is available online.
References
Supplementary Material
Please find the following supplemental material available below.
For Open Access articles published under a Creative Commons License, all supplemental material carries the same license as the article it is associated with.
For non-Open Access articles published, all supplemental material carries a non-exclusive license, and permission requests for re-use of supplemental material or any part of supplemental material shall be sent directly to the copyright owner as specified in the copyright notice associated with the article.