
Abstract
Electroencephalograms are commonly ordered by acute care doctors but not always understood. Other reviews have covered when and how to perform electroencephalograms. This primer has a different, unique, and complementary goal. We review basic electroencephalogram interpretation and terminology for nonexperts. Our goal is to encourage common understanding, facilitate inter specialty collaboration, dispel common misunderstandings, and inform the current and future use of this precious resource. This primer is categorically not to replace the expert neurologist or technician. Quite the contrary, it should help explain how nuanced electroencephalogram can be, and why indiscriminate electroencephalogram is inappropriate. Some might argue not to teach nonexperts lest they overestimate their abilities or reach. We humbly submit that it is even more inappropriate to not know the basics of a test that is ordered frequently and resource intensive. We cover the characteristics of the “normal” electroencephalogram, electroencephalogram slowing, periodic epileptiform discharges (and its subtypes), burst suppression, and electrographic seizures (and its subtypes). Alongside characteristic electroencephalogram findings, we provide clinical pearls. These should further explain what the reporter is communicating and whether additional testing is beneficial. Along with teaching the basics and whetting the appetite of the general clinician, this resource could increase mutual understanding and mutual appreciation between those who order electroencephalograms and those who interpret them. While there is more to electroencephalogram than can be delivered via a single concise primer, it offers a multidisciplinary starting point for those interested in the present and future of this commonly ordered test.
Introduction
Electroencephalograms (EEGs) are commonly ordered by intensivists, emergency physicians, and surgeons. These are intended to assist with the diagnosis and treatment of seizures and altered level of consciousness. Excellent reviews have covered when to order an EEG.1–4 This primer has a different, unique, and complementary remit. We cover the basics of EEG interpretation for nonexpert physicians, with a focus on acute care issues. Appropriately, this primer follows collaboration from each of these stakeholder specialties, alongside certified epileptologists. Our hope is to provide a common basic language and shared mental model. In so doing, we hope to facilitate collaboration, minimize misunderstanding, and encourage cross-specialty dialogue regarding the current and future use of this precious resource.
This primer is categorically not to replace the expert neurologist, epileptologist, technician, or EEG interpreter. Quite the contrary, it should help explain how nuanced EEG can be, why ongoing inter-specialty dialogue is essential, and why indiscriminate EEG is inappropriate. This primer is also not arguing what EEG modality is most appropriate and is categorically not encouraging nonexperts to perform EEGs themselves. Again, these technical issues are for specialists, and have been discussed elsewhere. 5
Instead, alongside characteristic EEG findings, we have included clinical pearls for the nonspecialist acute care clinician. These should further explain what the expert interpreter is attempting to communicate in his/her report and whether additional testing is beneficial. In so doing, we offer this resource to the whole team, both trainees and experienced personnel, and across numerous specialties. As such, it mirrors basic primers on, for example, electrocardiograms (ECGs) or computed tomography (CT), which have been welcomed by experts and nonexperts alike. Some might argue that we should not teach nonexperts in case they overestimate their abilities or reach. We humbly submit that it would be even more inappropriate to misuse a test that is ordered frequently, not universally understood, and resource intensive.
Important terminology
The term “epileptiform” can confuse clinicians. It simply means “pertaining to epilepsy” or “resembling epilepsy”. Importantly, it does not mean the patient has had or is having a clinical (visible) or sub-clinical (nonvisible) seizure. “Spikes” and “sharp waves” are also commonly mentioned on EEG reports. The difference between the two is their duration: if a waveform is less than 70 ms in duration it is a spike, whereas if it is between 70 and 200 ms it is a sharp wave. 3 If spikes or sharp waves occur frequently and in a specific area, it indicates an area of potential seizure activity. Use of the term “generalized” refers to activity in both hemispheres but does not mean that it is clear where the activity started. In addition to frequency, amplitude, and shape, EEG waveforms are classified by the area on the scalp in which they are recorded (i.e. which electrode(s) are involved).
Electrodes are placed on the scalp using the International 10–20 system.1,3 This groups electrodes into five transverse planes (Figure 1(a)) and five sagittal planes (Figure 1(b)), with odd numbers denoting the left side of the head and even numbers denoting the right side of the head. Leads are named according to anatomical location, where Fp = frontopolar, F = frontal, C = central, T = temporal, P = parietal, and O = occipital. Electrodes detect voltage and, intuitively, it makes sense that the EEG display would show the voltage at a particular electrode (e.g. Fp1); however, what is actually shown is the voltage difference between two points (e.g. Fp1-F3). This is identical to the way an ECG works: the waveform at lead I, for example, is not actually the voltage at lead I but rather the voltage difference between the left arm and right arm electrodes. The International 10–20 system. Panel (a) demonstrates the five primary transverse planes, while panel (b) shows the five primary sagittal planes. In panel (a), the bipolar or “double banana” montage is demonstrated with blue (left) and red (right) dashed arrows.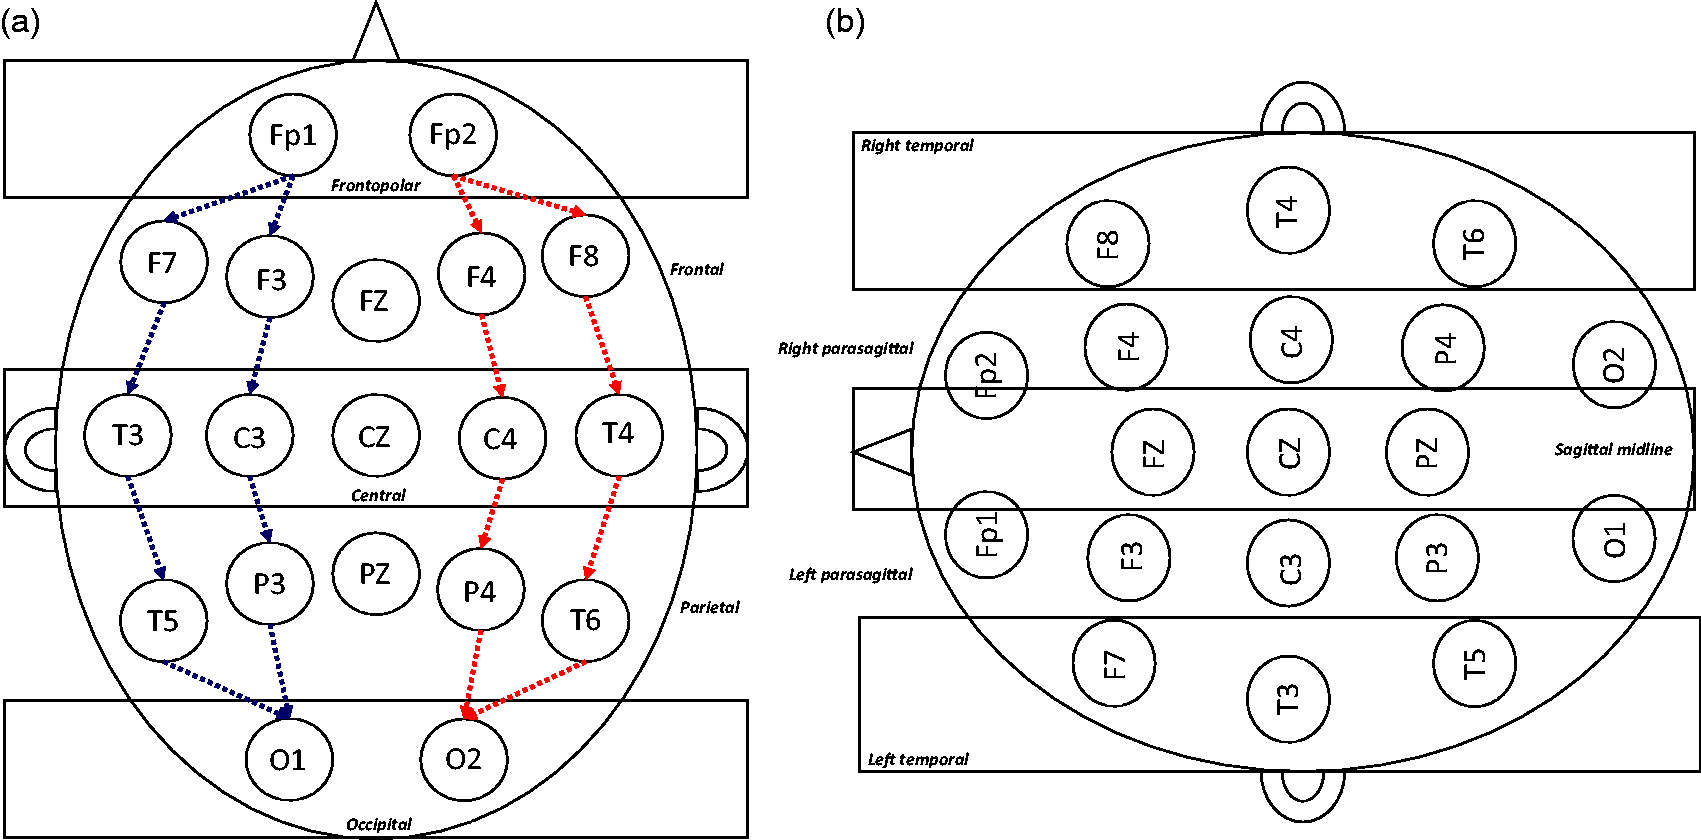
With the 10–20 system, epileptologists have developed myriad electrode configurations (also called “montages”) to compare different voltages on the scalp. This is done to aid localization and is why interpreters often switch between montages in a single EEG. A discussion of specific montages is beyond this primer, but excellent reviews are available for readers wishing to know more.1,3 For clarity and simplicity, all EEGs in this primer are in the most common and straight-forward montage, the so-called bipolar montage.
Pattern 1: Normal EEG
Acute care clinicians should be careful with terms like “normal” and instead focus on whether an EEG helps with treatment or prognosis. For example, patients with known epilepsy or previous brain damage may never have a typical/normal EEG. Instead, they will have a tracing that is “normal” or “unchanged” for them. This is not different than say, patients with an abnormal resting ECG. If the tracing has not changed then there is no new pathology and, hence, no need for additional therapy or repeat testing.
Following those important caveats, the awake EEG (or normal EEG) is characterized by an alpha rhythm: a symmetrical 8–12 Hz pattern best seen in the leads from the posterior scalp (Figure 2). It is therefore also referred to as the “posterior dominant rhythm”. Alpha activity is increased in amplitude during relaxed wakefulness and is more reactive if the patient is mentally alert.
3
Though alpha band frequencies (i.e. 8–12 Hz) may be seen in critically-injured, comatose patients, it would be otherwise rare to detect an alpha or posterior dominant rhythm in a patient under anesthetic or in the intensive care unit (ICU).
6
Normal alpha rhythm. EEG demonstrating a normal alpha rhythm at 11 Hz.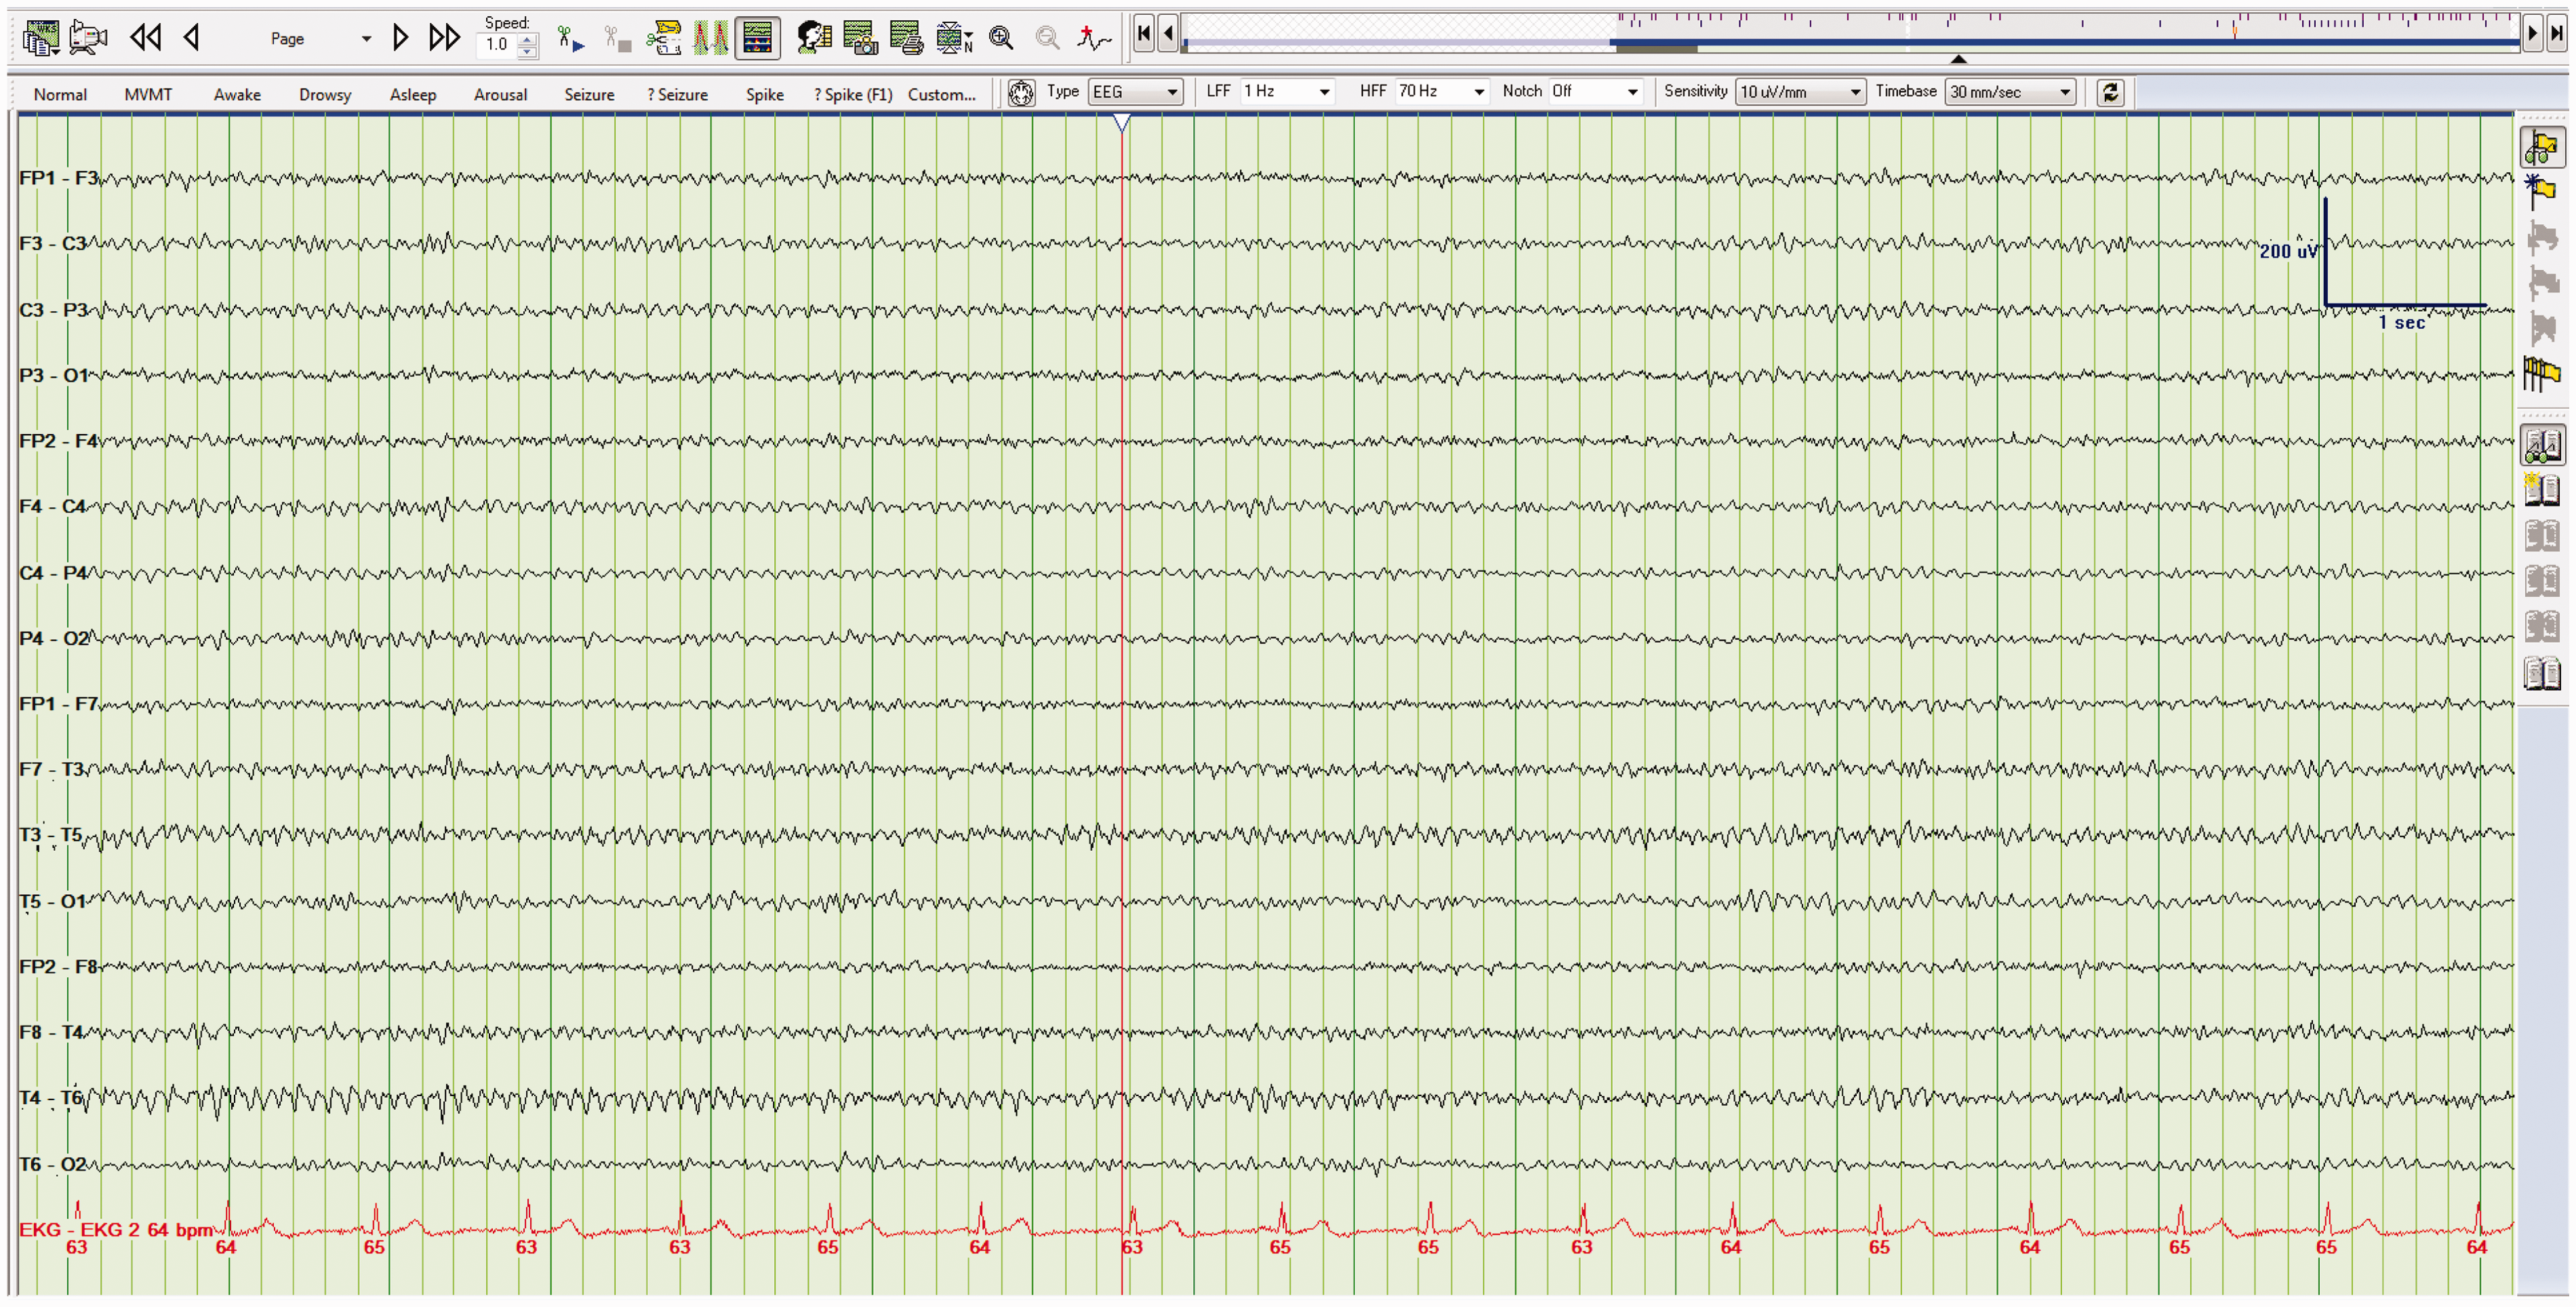
Clinicians commonly order EEGs after anoxic cardiac arrest. This is done to prognosticate (see below), as well as to distinguish myoclonic jerks from a de novo seizure. Strictly speaking, this EEG tracing will be abnormal because it will be affected by muscle twitches. The more nuanced question to ask the epileptologist is whether they are confident calling those movements “myoclonic”. Myoclonic jerks are a poor prognostic sign, but do not benefit from treatment or repeat testing. If instead the EEG shows seizures, then patients may need antiepileptic drugs (AEDs) followed by repeat testing. This illustrates both the challenge in EEG interpretation and the importance of dialogue with your EEG service and the potential problem of reflex ordering EEGs.
Take home point(s)
Rather than calling EEGs “normal” or “abnormal”, we should focus on whether they change management. The “normal” EEG is characterized by the presence of the alpha or posterior dominant rhythm. The alpha or posterior dominant rhythm is a rare finding in a critical care EEG.
Pattern 2: Slowing
Slowing of the alpha rhythm, whether diffuse or focal, suggests encephalopathy. Typically, as the encephalopathy deepens, the EEG becomes increasingly slow.
6
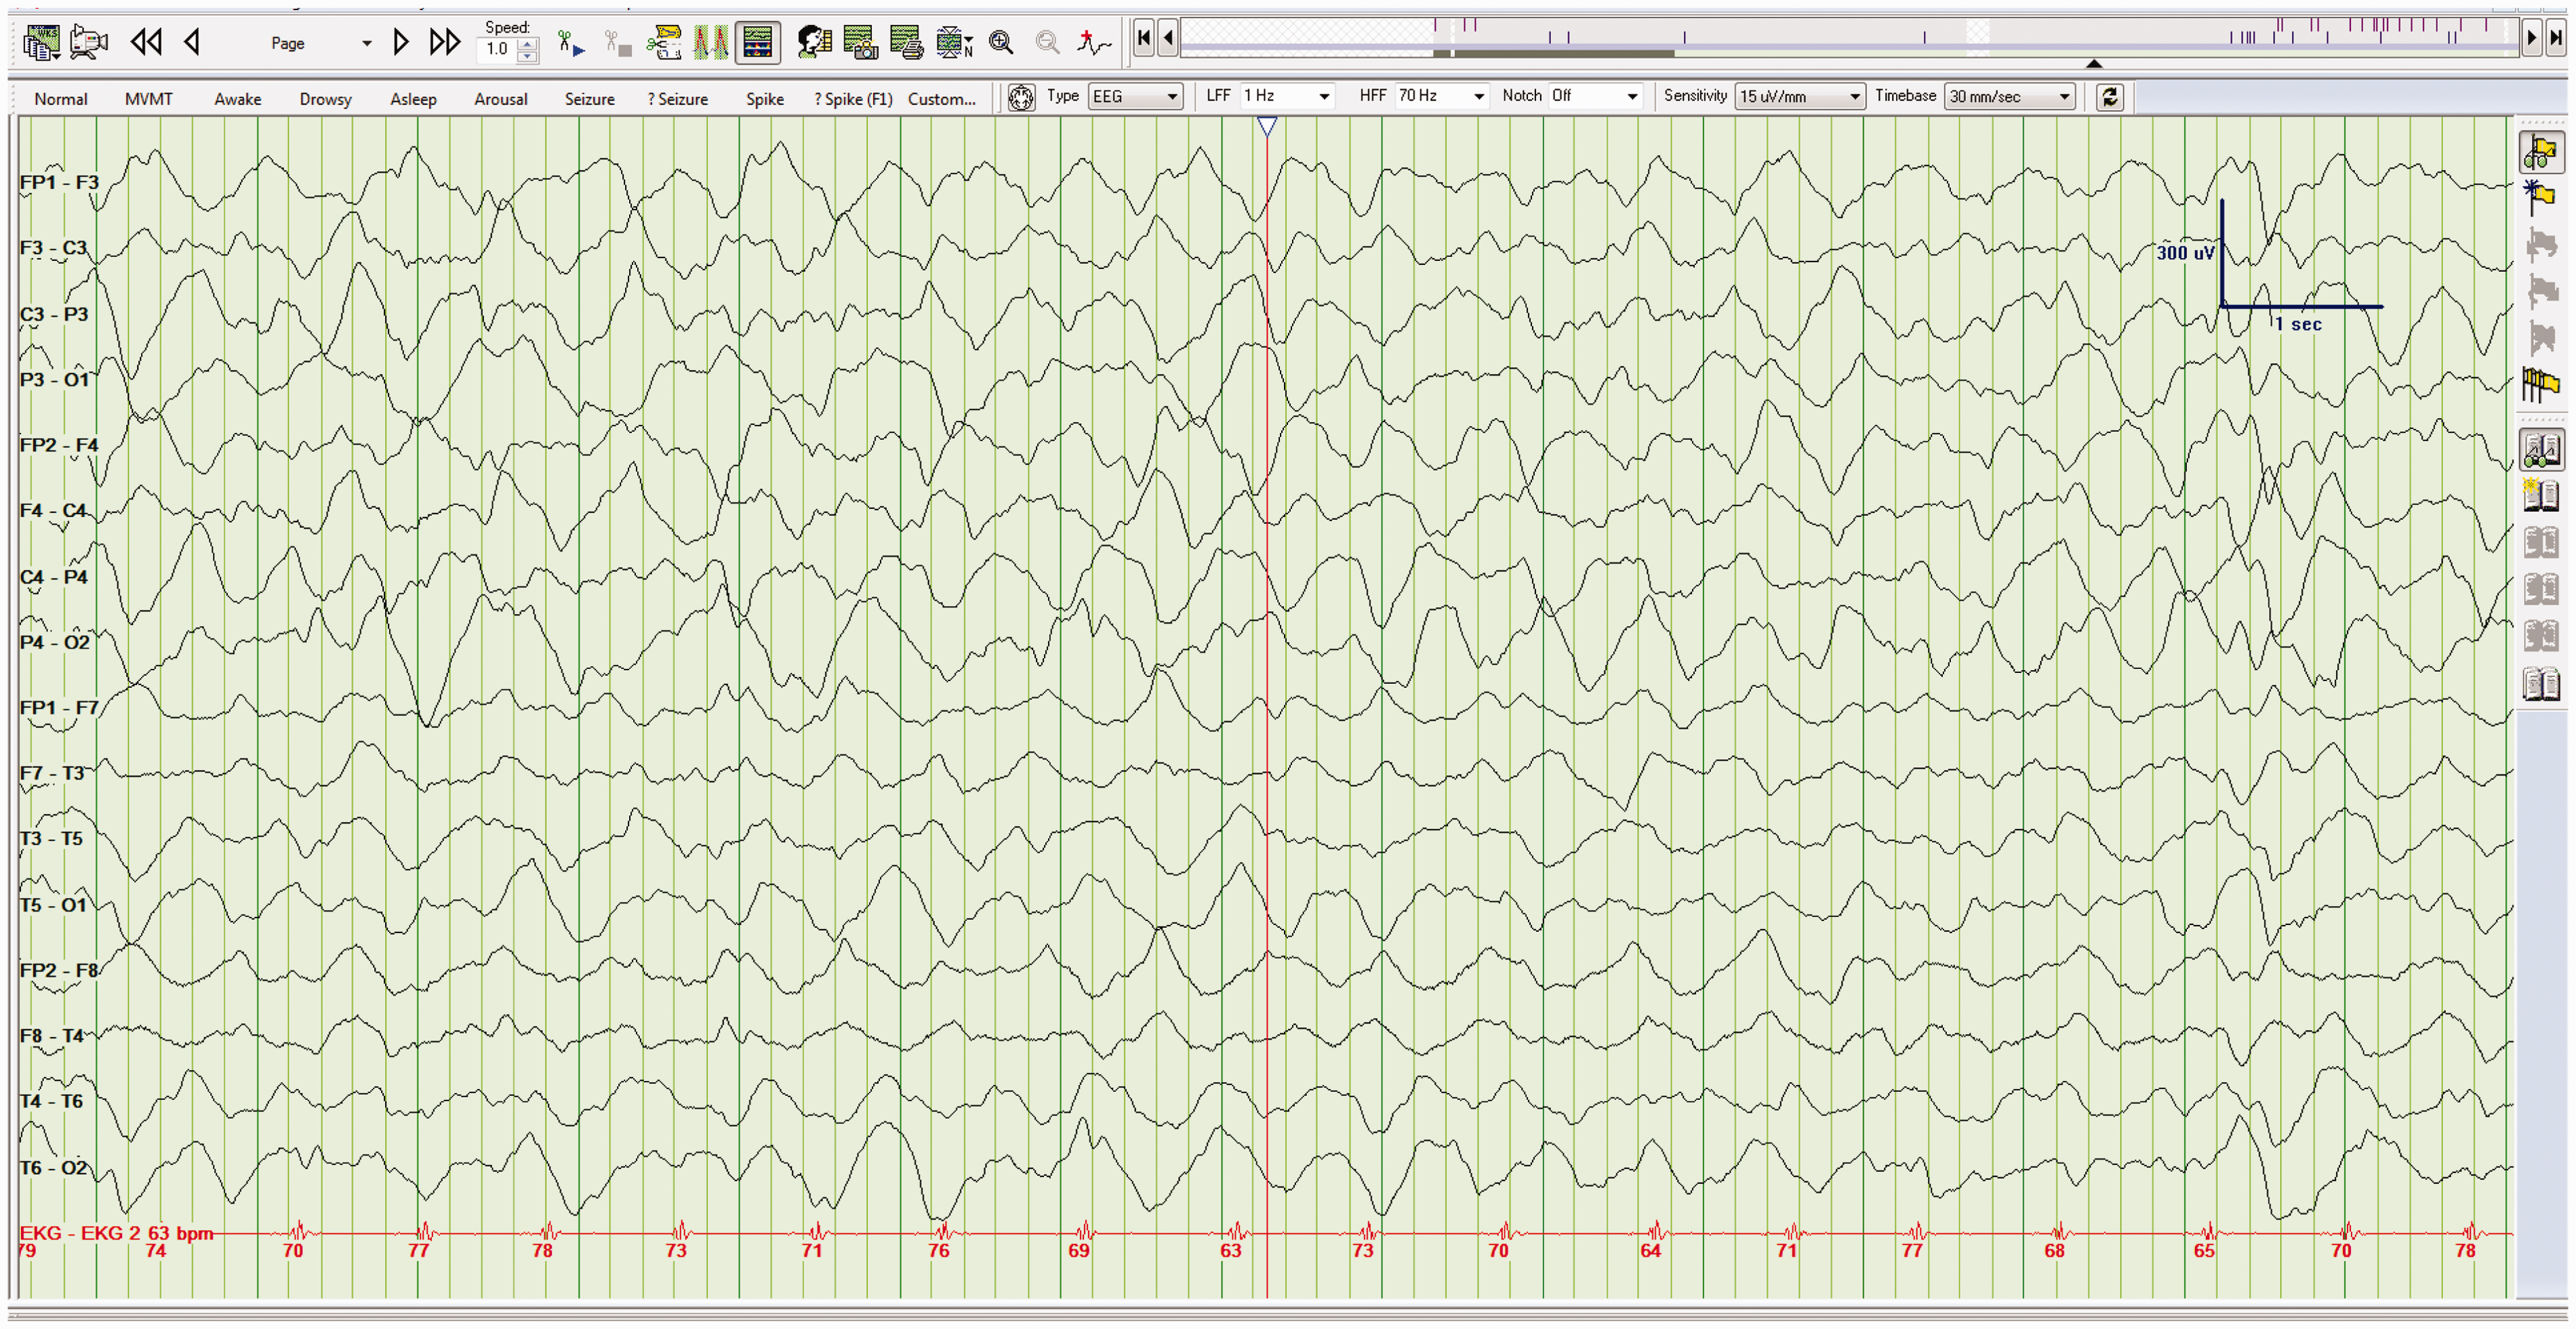
EEG frequencies between 4 and 7 Hz (Figure 3) are said to be within the theta band of frequencies (i.e. moderately slow), while frequencies less than 4 Hz are within the delta band (i.e. markedly slow) (Figure 4). As a result, if a report states that EEG frequencies are less than or equal to 4 Hz, the patient likely has a severe encephalopathy.6,7 When EEGs show persistent and diffuse delta activity, it is referred to as polymorphic delta activity (PDA). As demonstrated in Figure 4, the addition of the word polymorphic simply means that it is asymmetric in frequency, distribution, and amplitude. Diffuse slowing. EEG demonstrating diffuse slowing to the theta band of frequencies (6 Hz in this example). Diffuse slowing. EEG demonstrating diffuse slowing to the delta band of frequencies (1–3 Hz in this example). Another name for this type of slowing, as described in the text, is polymorphic delta activity or PDA.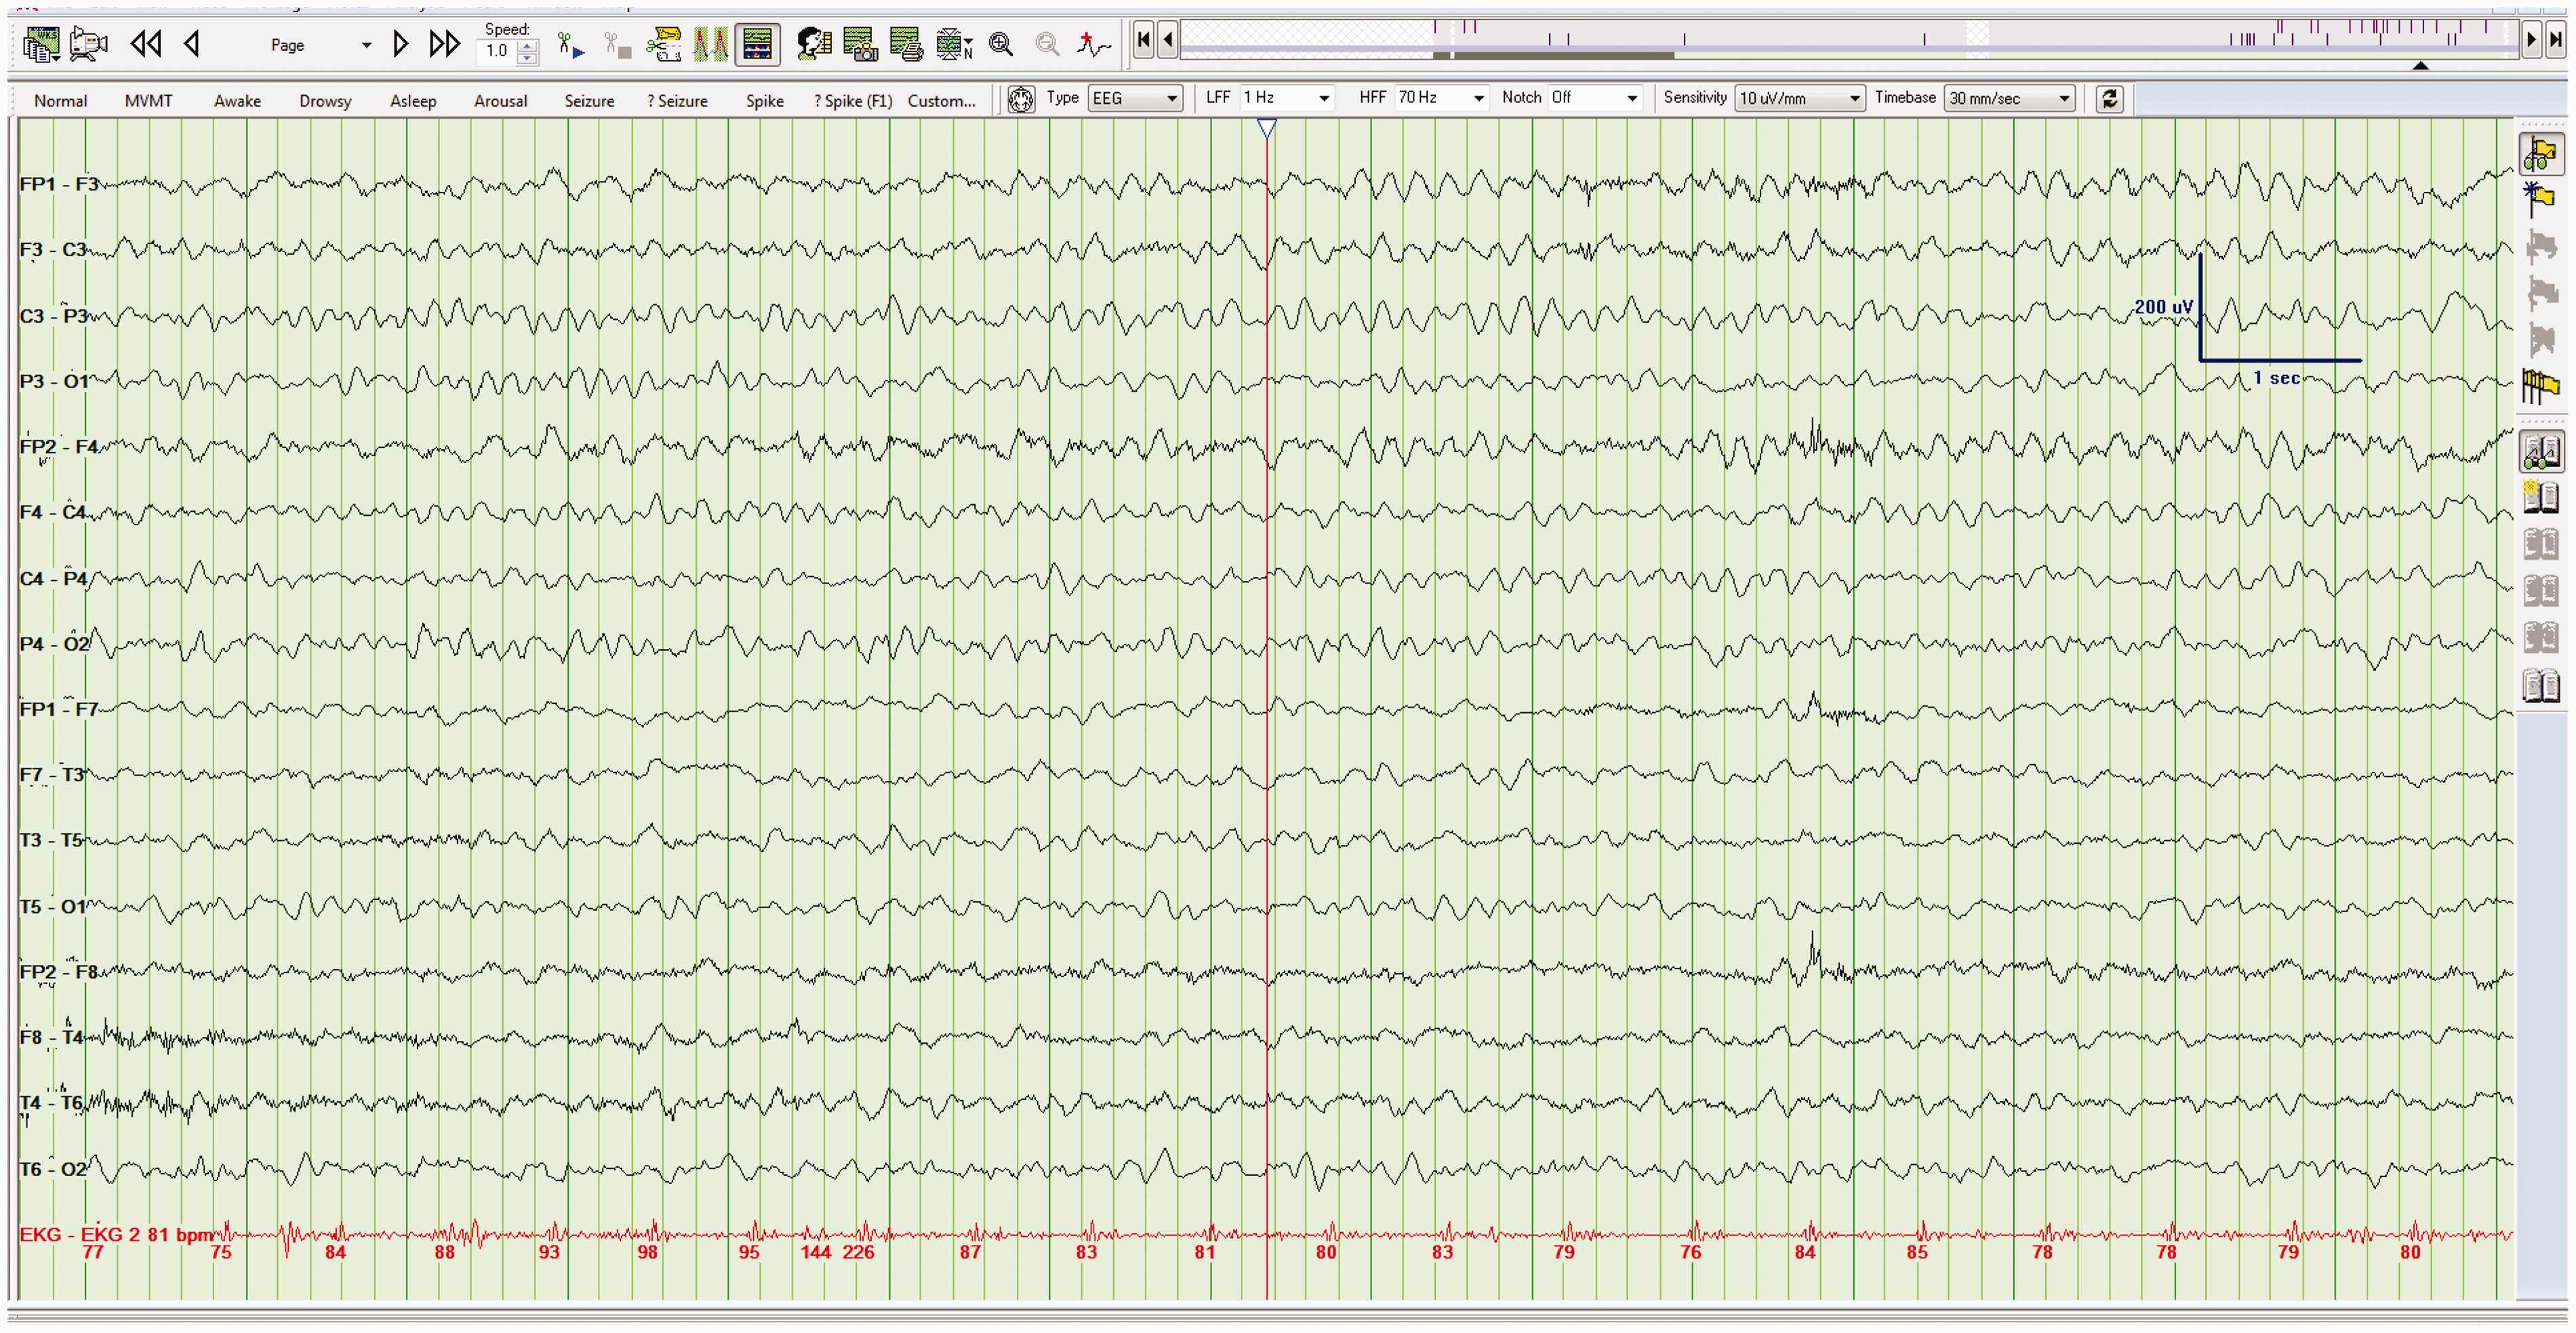
Importantly, the presence of diffuse EEG slowing, severe slowing, or PDA rarely pinpoints the diagnosis. This does not mean, however, that such nonspecific EEG patterns are automatically clinically unhelpful. PDA occurs in myriad important clinical situations, the most common of which are hepatic failure, renal failure, sepsis, drug intoxications, hypoxia, and head trauma; 7 however, because these findings are nonspecific, the EEG is also nonprognostic. Instead, the prognosis reflects the underlying pathology more than the EEG tracing.
Focal slowing (Figure 5), on the other hand, is more clinically specific. This is because focal slowing indicates a lesion in the underlying parenchyma.
8
There are numerous causes of focal slowing, which include abscesses, hematomas, tumors, cerebral ischemia, and recovery from a focal seizure.
9
Again, prognosis is varied, as it depends on the underlying etiology. Importantly, pure cortical lesions do not produce slowing but rather a decrease in EEG waveform amplitude.
8
Left temporal slowing. EEG showing slowing (delta band) over the left temporal head region.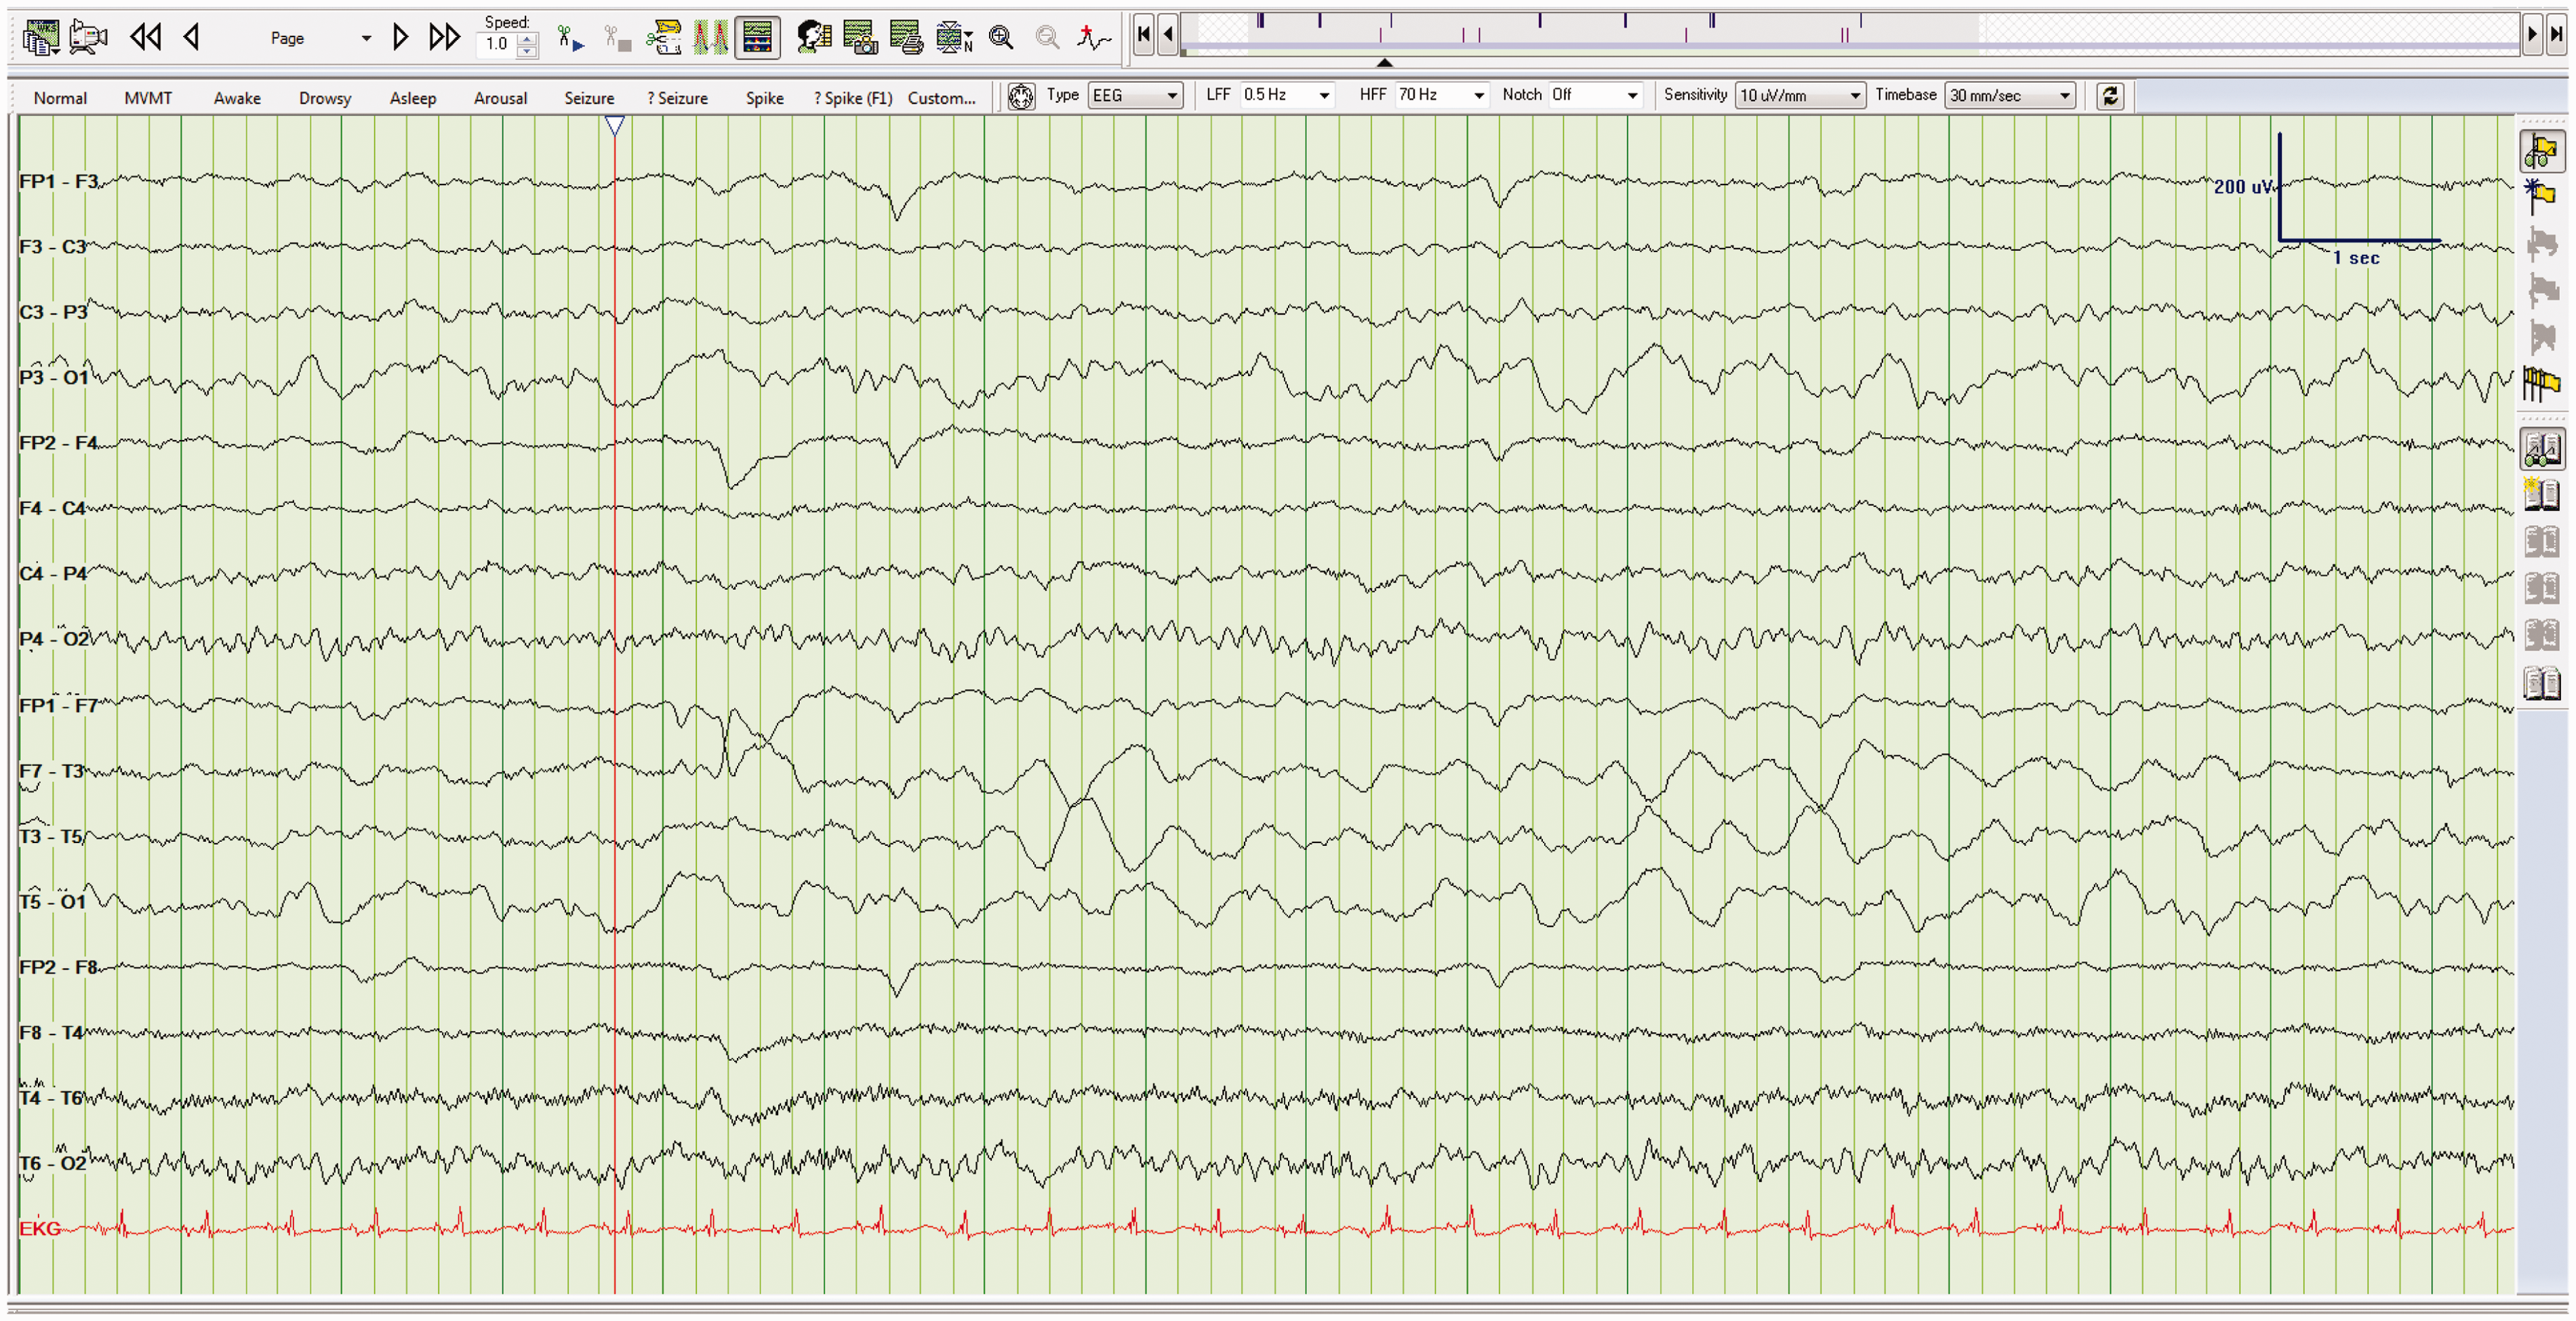
Take home point(s)
As encephalopathy deepens, the EEG becomes progressively slower. PDA is nonspecific and could reflect hepatic failure, renal failure, sepsis, drug intoxications, hypoxia, and head trauma. Focal slowing indicates a lesion in the white matter.
Pattern 3: Periodic epileptiform discharges
Periodic epileptiform discharges (PEDs) are common in ICU patients. They refer to an EEG waveform that contains recurrent and sharp waveform abnormalities. PEDs that have been well characterized include periodic lateralized epileptiform discharges (PLEDs), bilateral independent PLEDs (BIPLEDs), generalized periodic epileptiform discharges (GPEDs), stimulus-induced periodic, rhythmic or ictal discharges (SIRPIDs), and triphasic waves. What follows is a brief discussion of each of these EEG patterns.
Pattern 3a: Periodic lateralized epileptiform discharges
When a PED is lateralized, it is termed a PLED. PLEDs are epileptiform complexes that recur every 1–2 s (Figure 6). It should be noted that some experts use the term lateralized periodic discharges (LPDs) instead of PLEDS. The clinical significance of PLEDs is debated but they indicate an acute, destructive lesion of the underlying brain parenchyma,
10
with acute stroke being the most common.
10
Other causes include herpes encephalitis, autoimmune encephalitis, and rapidly expanding tumors.
10
Though PLEDs are epileptiform in appearance, they are not necessarily indicative of a current seizure (aka “ictal phenomenon”).
11
Right-sided PLEDs. EEG showing PLEDs over the right hemisphere. The patient in this case had a right middle cerebral artery stroke.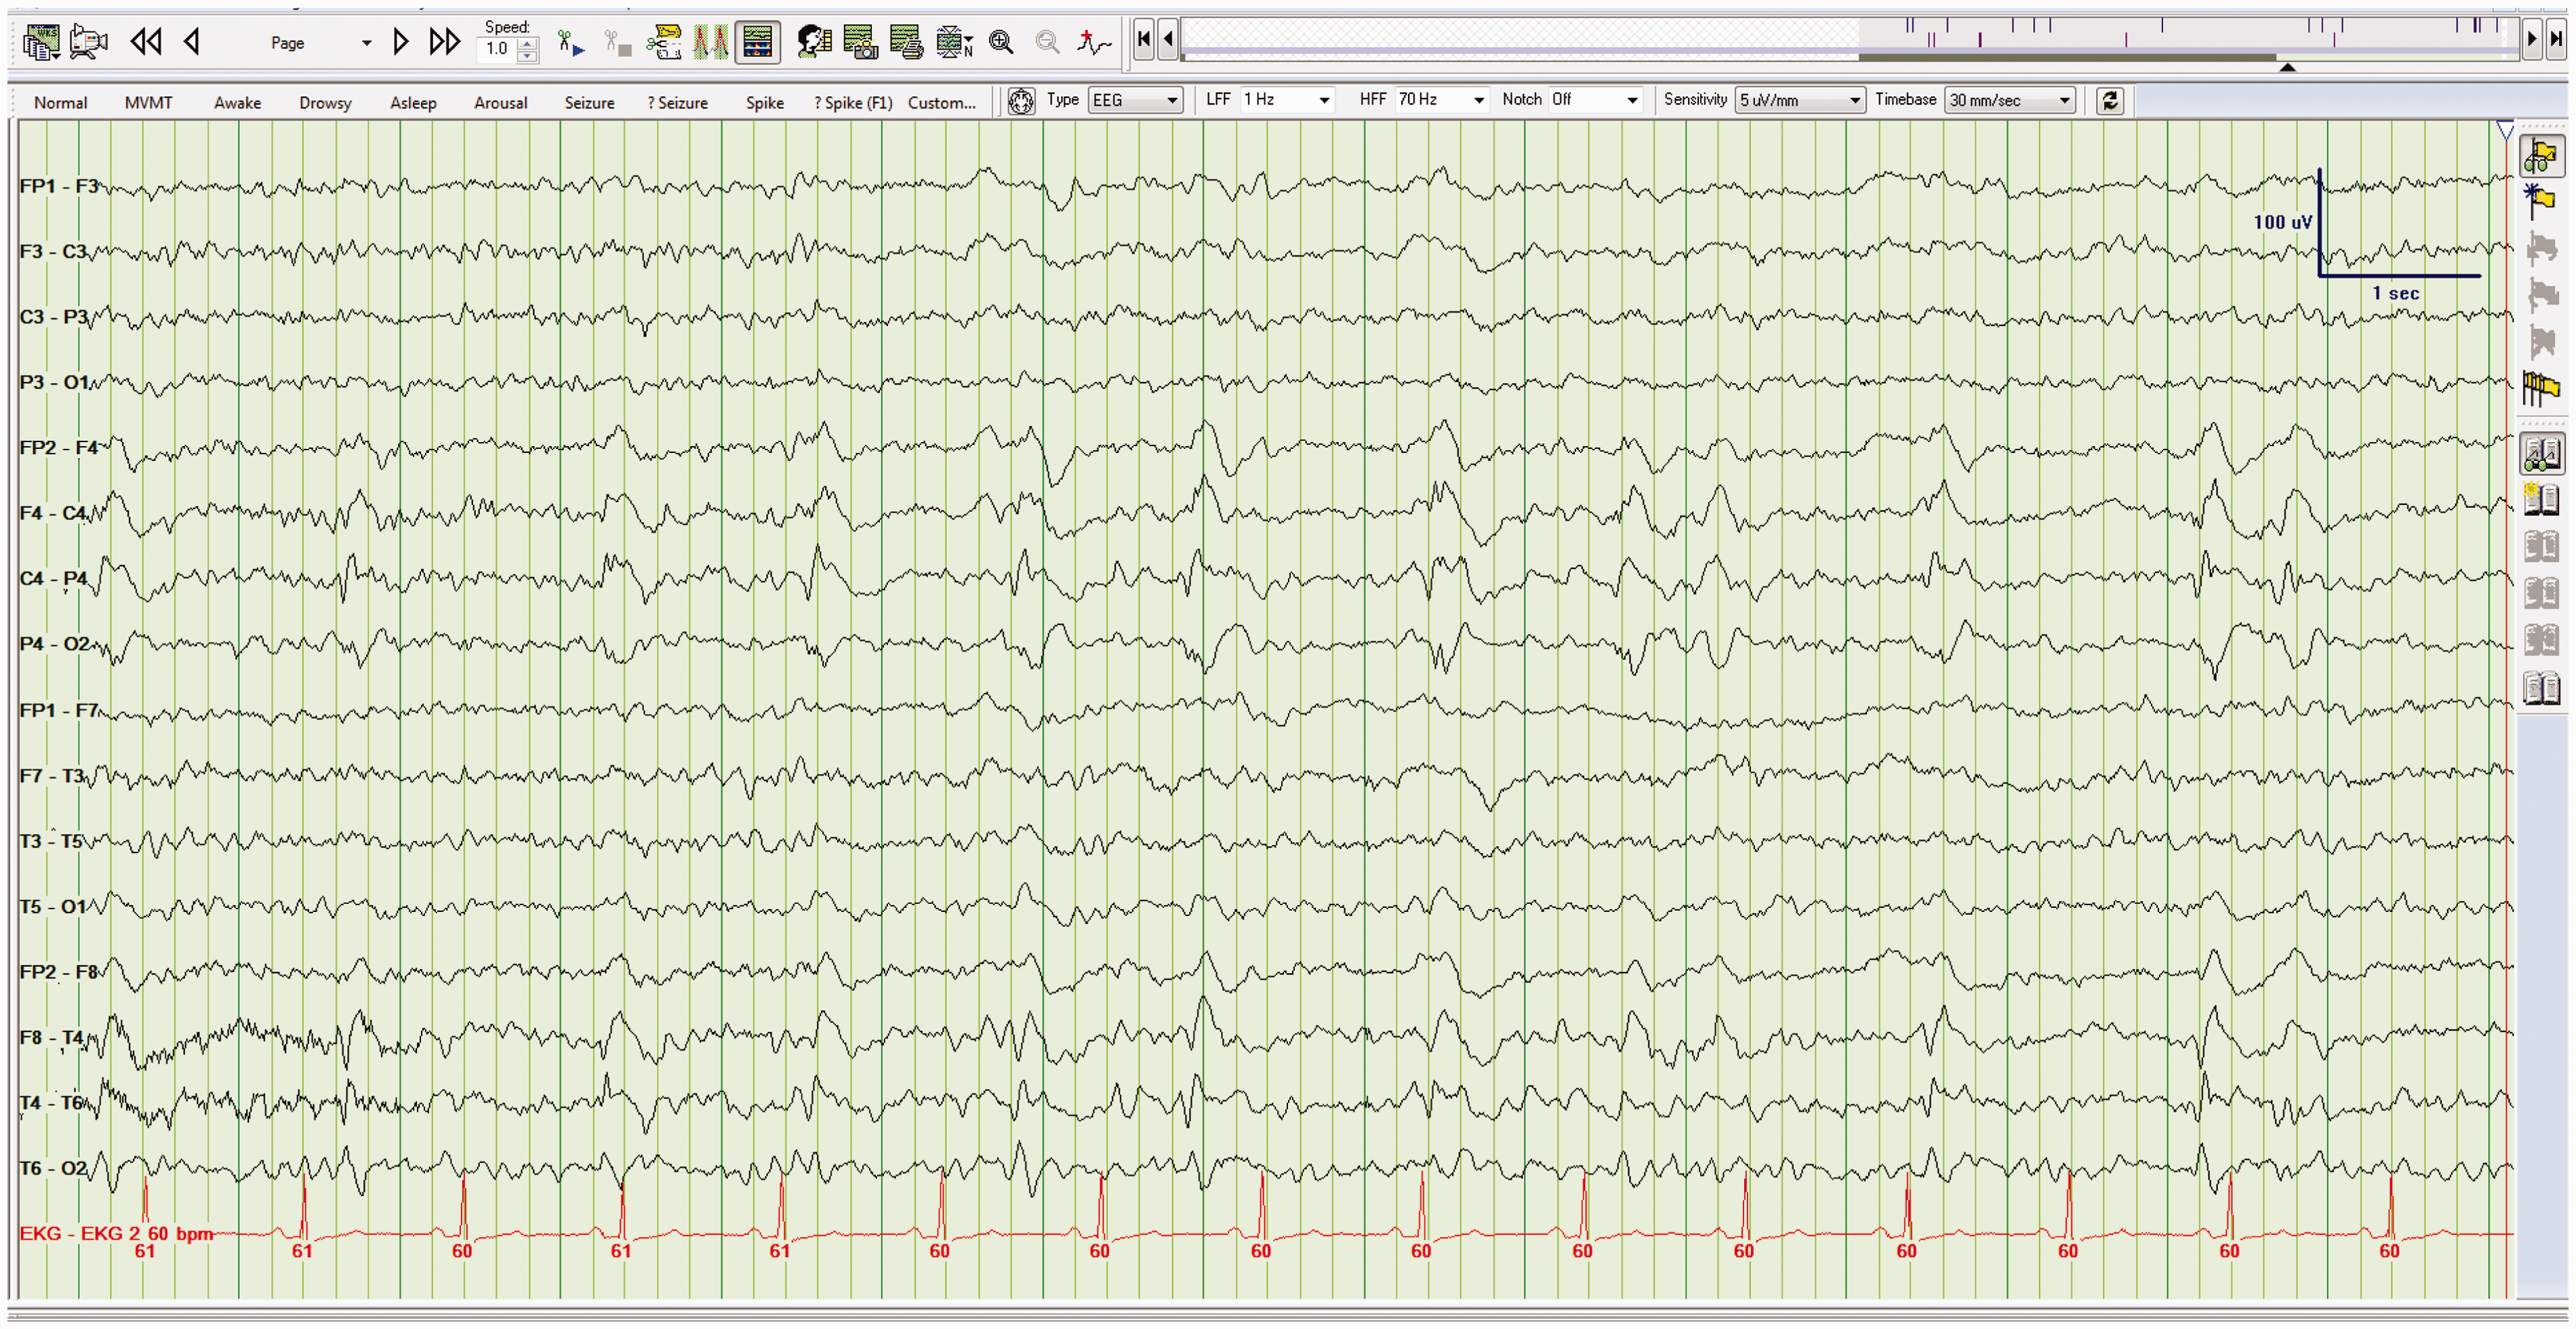
It is better for the clinician to think of PLEDs as being on a continuum (the so-called the ictal-interictal continuum). This matters clinically because patients with PLEDs are not seizing but are at high risk of developing seizures. 11 When a patient with PLEDs has an unequivocal electrographic seizure (ES), the EEG typically becomes faster and more rhythmic. 11 Irrespective of etiology, PLEDs are transient and cease within days to weeks and do not necessarily need treatment with AEDs.10,11
Take home point(s)
PLEDs are indicative of an acute, destructive lesion of the brain parenchyma. PLEDs do not mean that the patient is seizing but do indicate a high risk of developing a seizure. This means some (but not all) specialists will recommend a follow-up EEG and/or even brief treatment with AEDs.
Pattern 3b: Bilateral independent periodic lateralized epileptiform discharges
When PLEDs occur in both hemispheres, and those hemispheric discharges are asynchronous and independent, they are referred to as BIPLEDs (Figure 7). This pattern is less common than PLEDs, though the underlying cause is the same: an acute destructive lesion.12,13 As compared to PLEDs that are confined to one hemisphere, BIPLEDs are associated with a more diffuse or multifocal process.
14
The most common causes of BIPLEDs are anoxia and central nervous system infection.12,13 As with PLEDs, patients with BIPLEDs are at high risk of developing clinical seizures.12,13 Patients with BIPLEDs typically have a worse mental state (deep coma) and a worse prognosis when compared to patients with PLEDs.12,13 BIPLEDs. The patient shown here had an anoxic injury.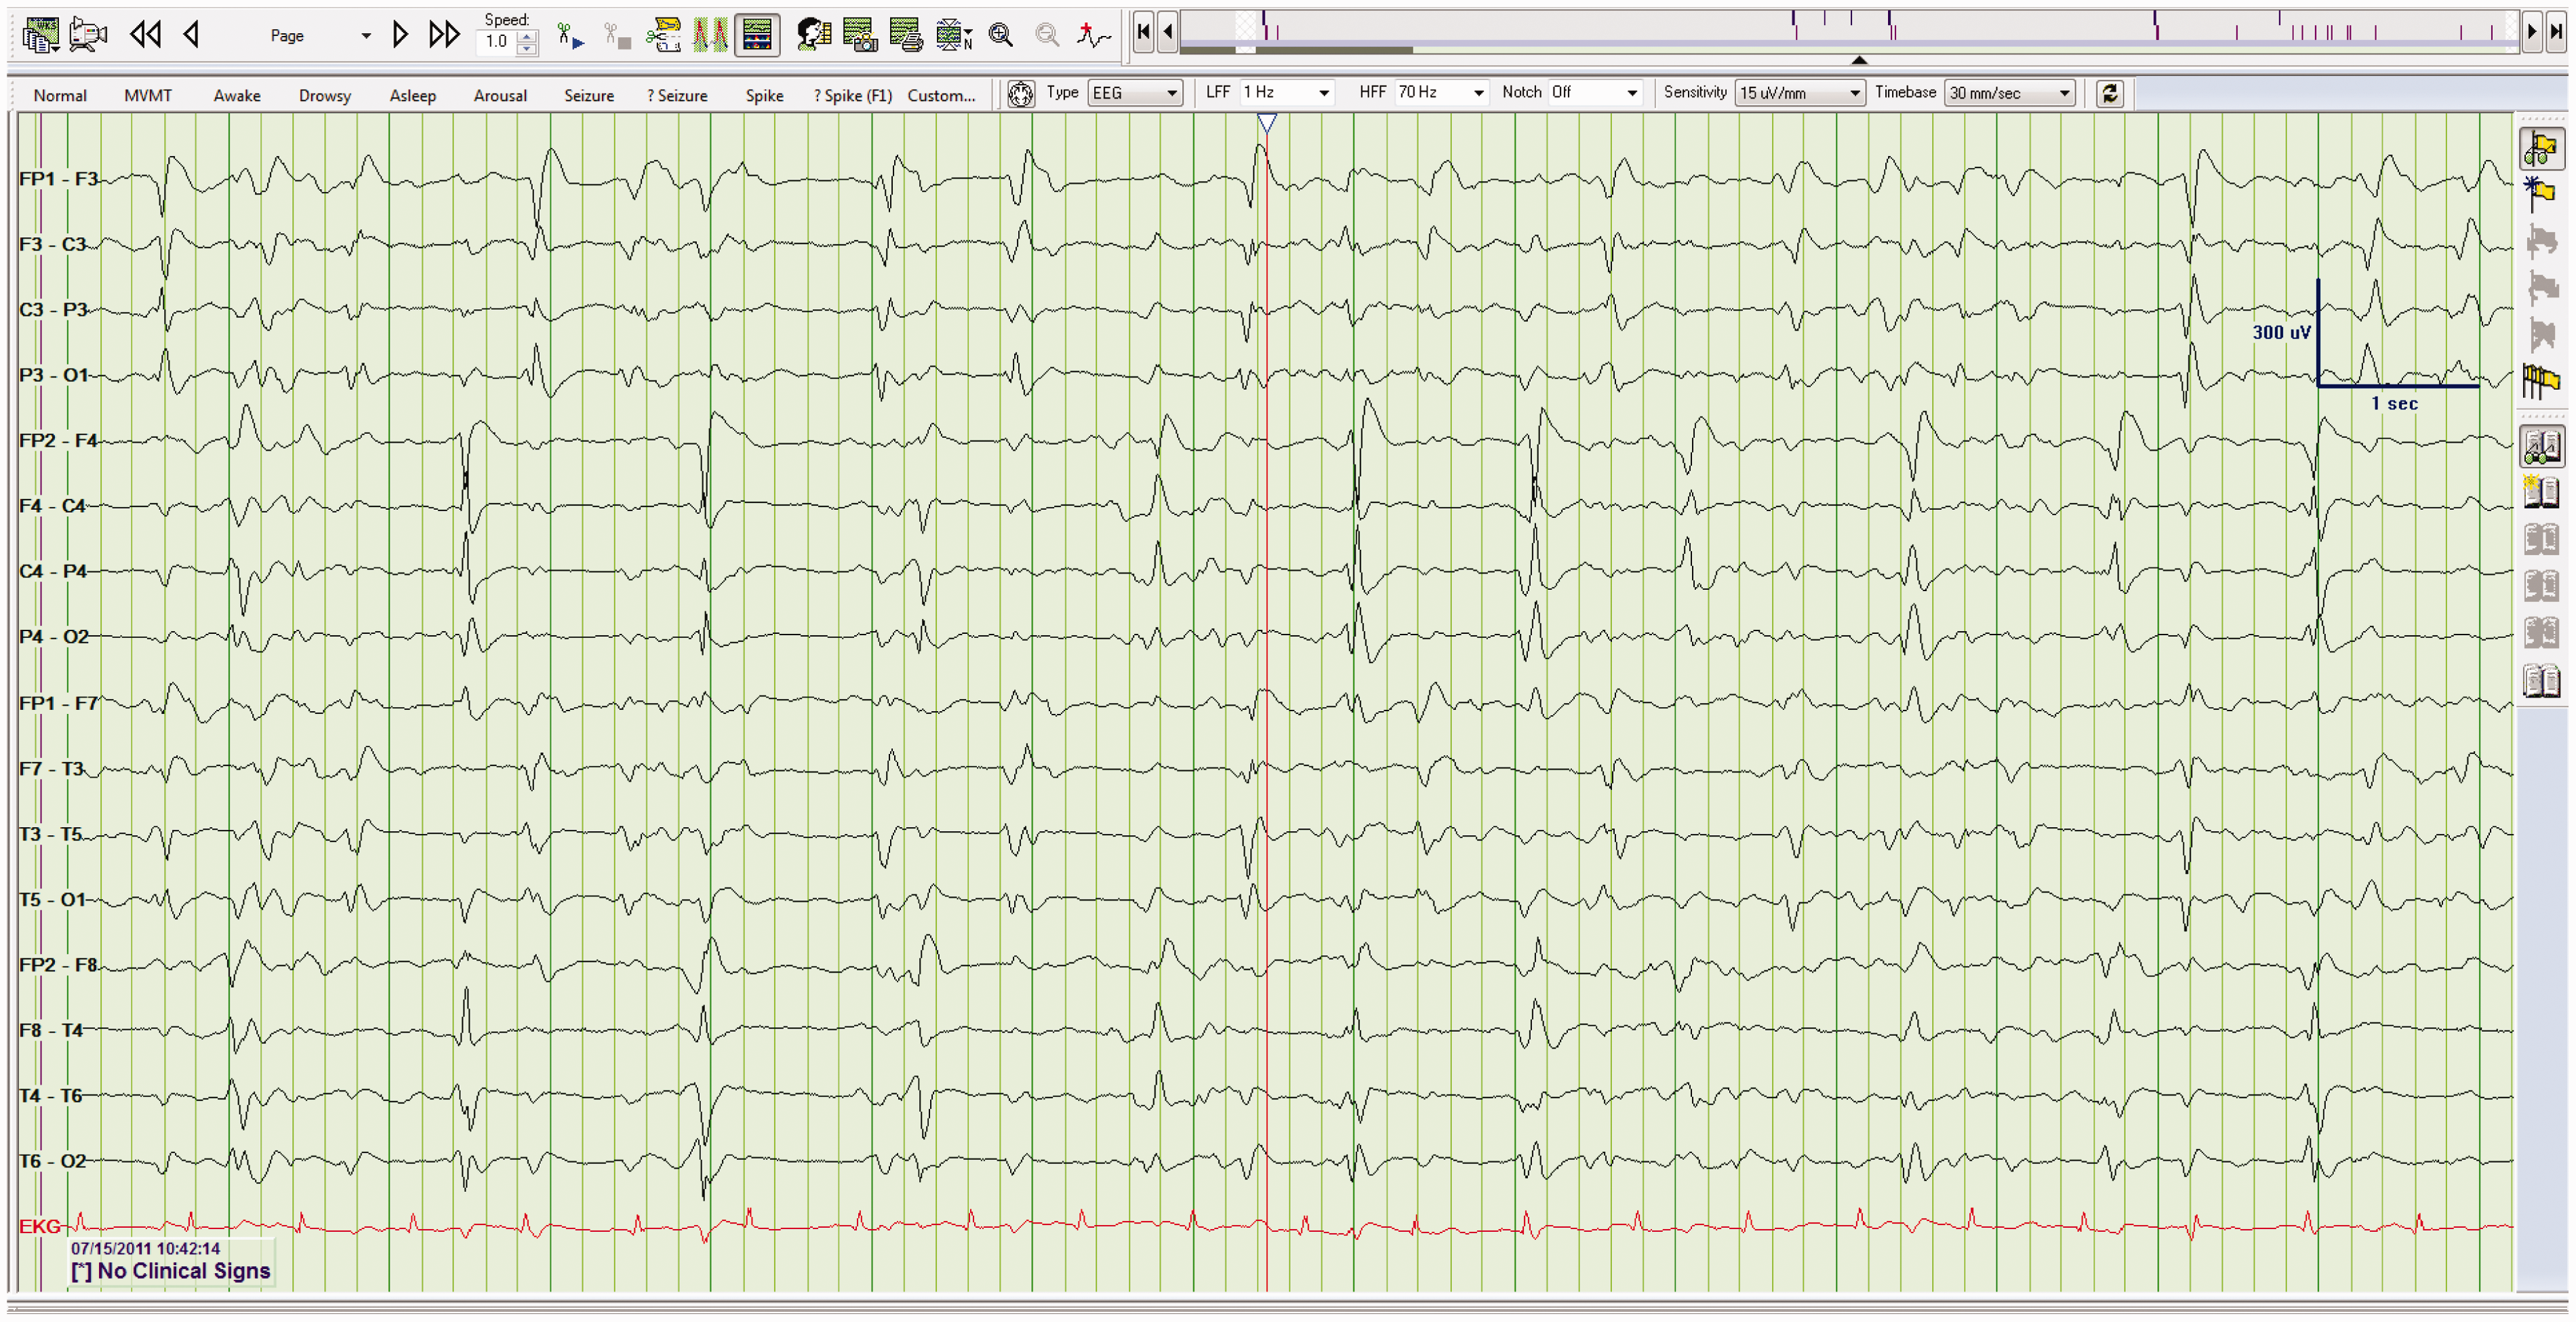
Take home point(s)
Like PLEDs, BIPLEDs indicates an acute, destructive lesion; however, the process is often more diffuse. Patients with BIPLEDs are at high risk of developing clinical seizures. BIPLEDs typically portend a worse prognosis, when compared to PLEDs.
Pattern 3c: Generalized periodic epileptiform discharges
When PEDs occur across both hemispheres, and when those discharges are synchronous and symmetrical, they are called GPEDs (Figure 8). Similar to other broadly distributed patterns, GPEDs are indicative of diffuse dysfunction of underlying cerebrum.
15
Causes of GPEDs are myriad but include anoxia, Creutzfeldt–Jacob disease, Hashimoto's encephalopathy, drug intoxication including baclofen and lithium, and end-stage Alzheimer's disease.
15
Similar to PLEDs, GPEDs are highly associated with seizures, with roughly half of all patients with GPEDs going on to have seizures during their acute illness.
15
GPEDs. EEG demonstrating GPEDs (2–3 per second) in a patient with Creutzfeldt–Jacob disease.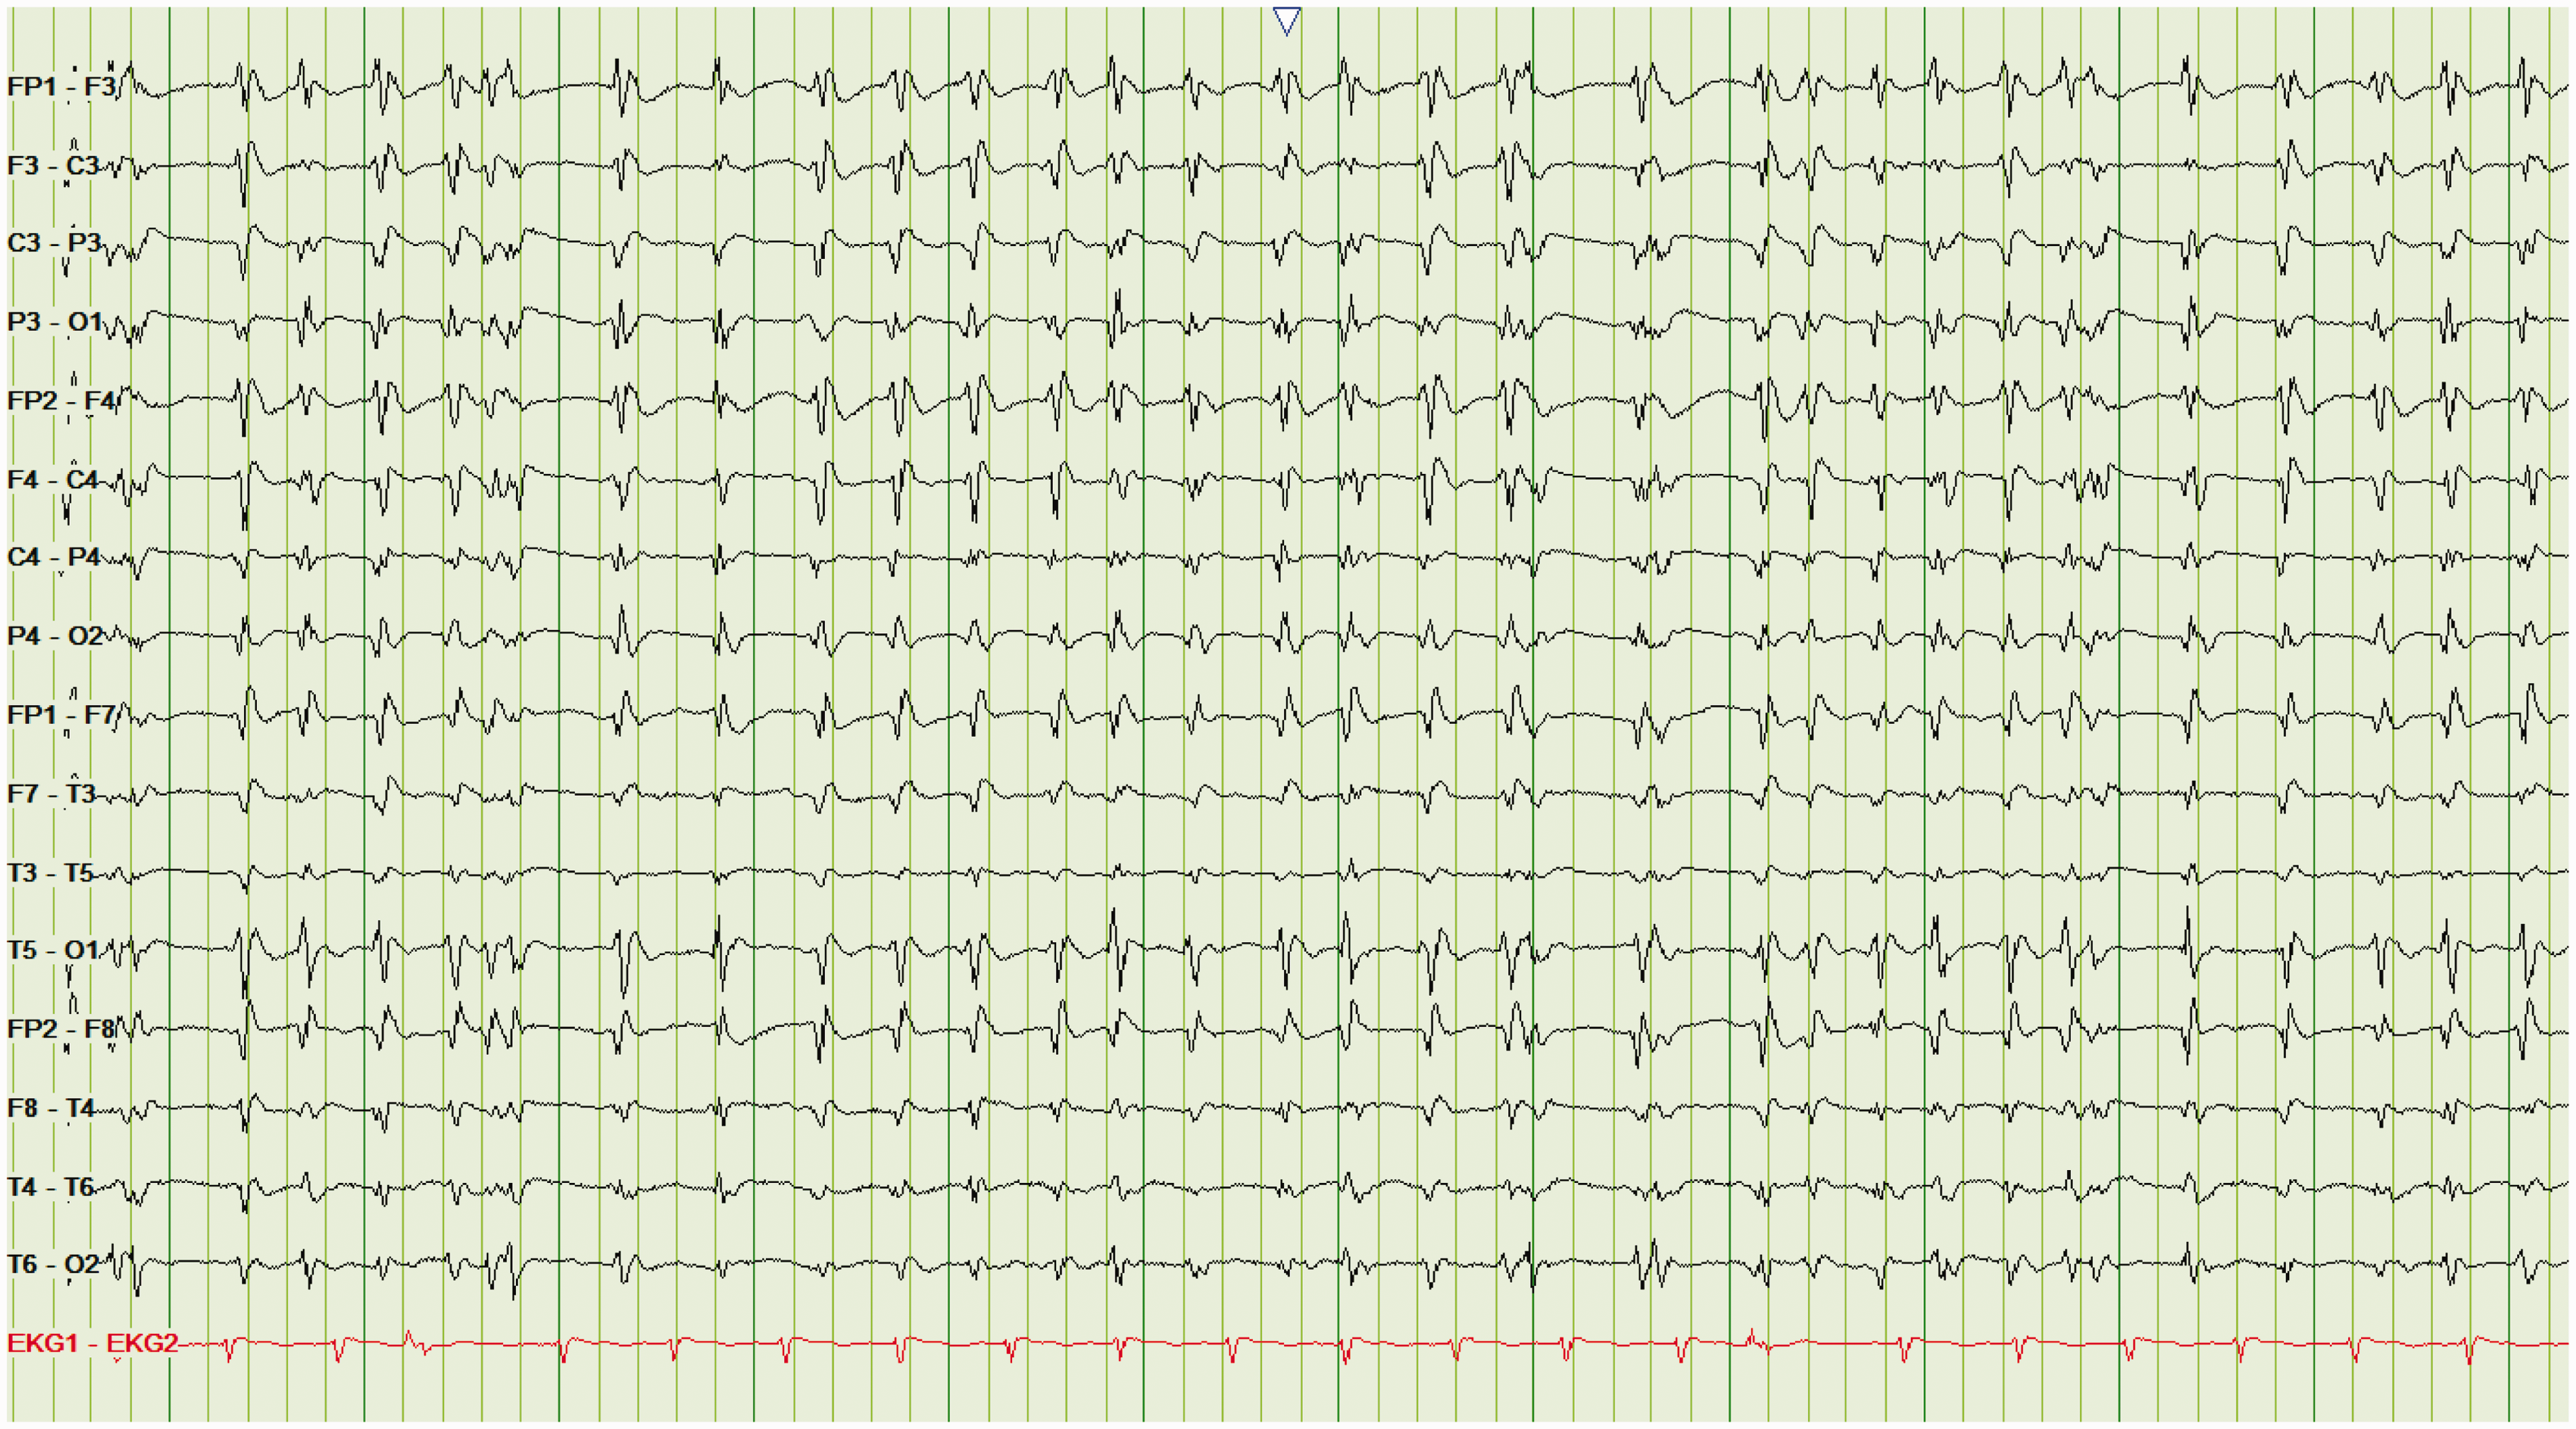
Take home point(s)
GPEDs result from many illnesses and indicate diffuse cerebral dysfunction that is often severe. Like PLEDs and BIPLEDs, GPEDs are highly associated with progression to clinical seizures.
Pattern 3d: Stimulus-induced periodic, rhythmic or ictal discharges
There is growing interest in prolonged video-EEG recordings (aka continuous EEG). The rationale is that the longer the EEG the more likely we are to capture ESs; especially if those seizures are intermittent. The downside is that the longer the EEG duration the more likely that the recording will contain abnormalities that, in turn, need to be clinically understood. In some critically injured patients, the EEG is altered by stimuli such as suctioning, background noise, and pain.
16
These are known as “alerting stimuli”. These can create periodic discharges or frank ESs, which can either be focal or generalized.
16
The duration and amplitude of the stimulus-induced pattern often correlates with the duration and intensity of the stimulus.
16
This phenomenon is called stimulus-induced rhythmic, periodic, or ictal discharges (SIRPIDs) (Figure 9).
16
To date, SIRPIDs are typically assumed to be a purely electrographic phenomenon, with no clinical correlate, nor need for AEDs;
16
however, as with many aspects of EEG interpretation, there is ongoing debate about SIRPIDs.
16
SIRPIDs. In this example, periodic discharges (diffusely, though more prominent over the left hemisphere) develop with alerting stimuli (asking the patient to open their eyes), consistent with SIRPIDs. The patient was deeply comatose, following an anoxic injury.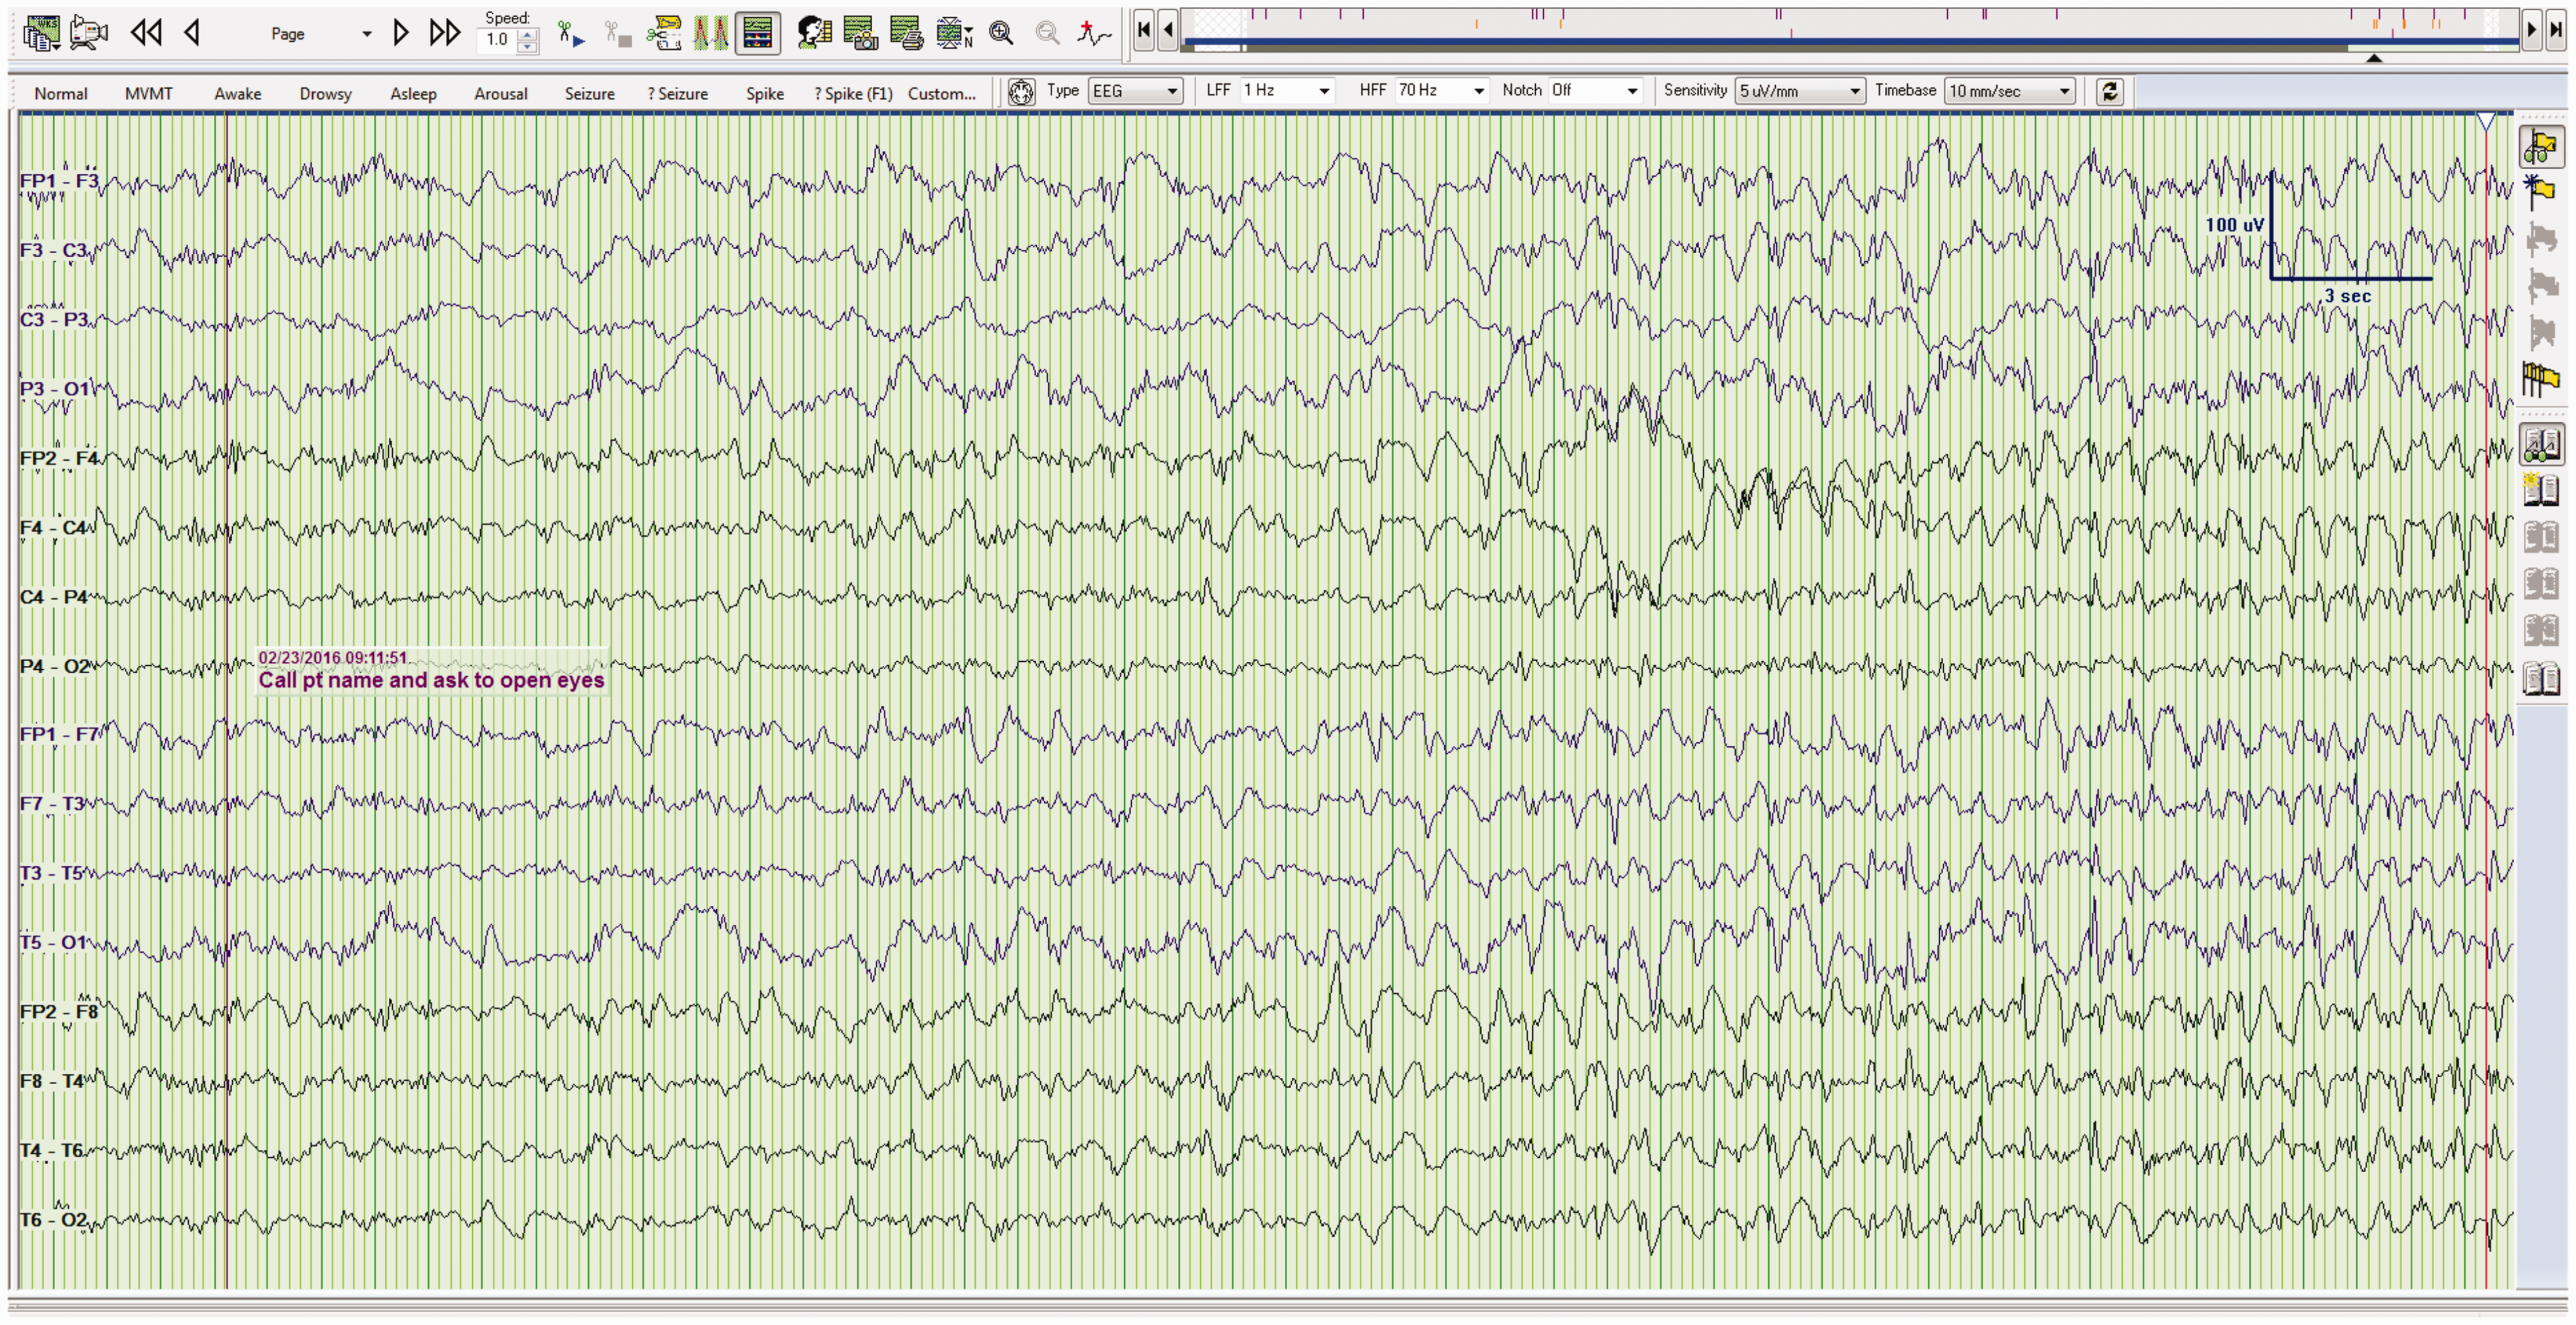
Take home point(s)
Stimuli (aka alerting stimuli) can cause periodic EEG discharges or even ESs in comatose patients. These are called SIRPIDs. SIRPIDs are currently of unclear clinical significance.
Pattern 3e: Triphasic waves
Triphasic waves were previously thought to be diagnostic for hepatic encephalopathy. It is now accepted that many toxic/metabolic encephalopathies can produce this pattern.
17
Triphasic waves are generalized, periodic, symmetric, and bisynchronous (across both hemispheres) (Figure 10). The waves often appear blunt, which gave rise to the alternate term “blunt spike and wave”.
18
Triphasic waves tend to recur at a rate of about 1 or 2 per second and often wax and wane during the recording.
18
Critically, triphasic waves of metabolic encephalopathy often appear similar to nonconvulsive status epilepticus on EEG.
17
Benzodiazepenes will obliterate both patterns. As such, these two patterns can only be accurately distinguished post hoc, namely, depending on whether the patient clinically improves.
19
Triphasic waves. Triphasic waves (1–2 per second) in a patient with hepatic coma.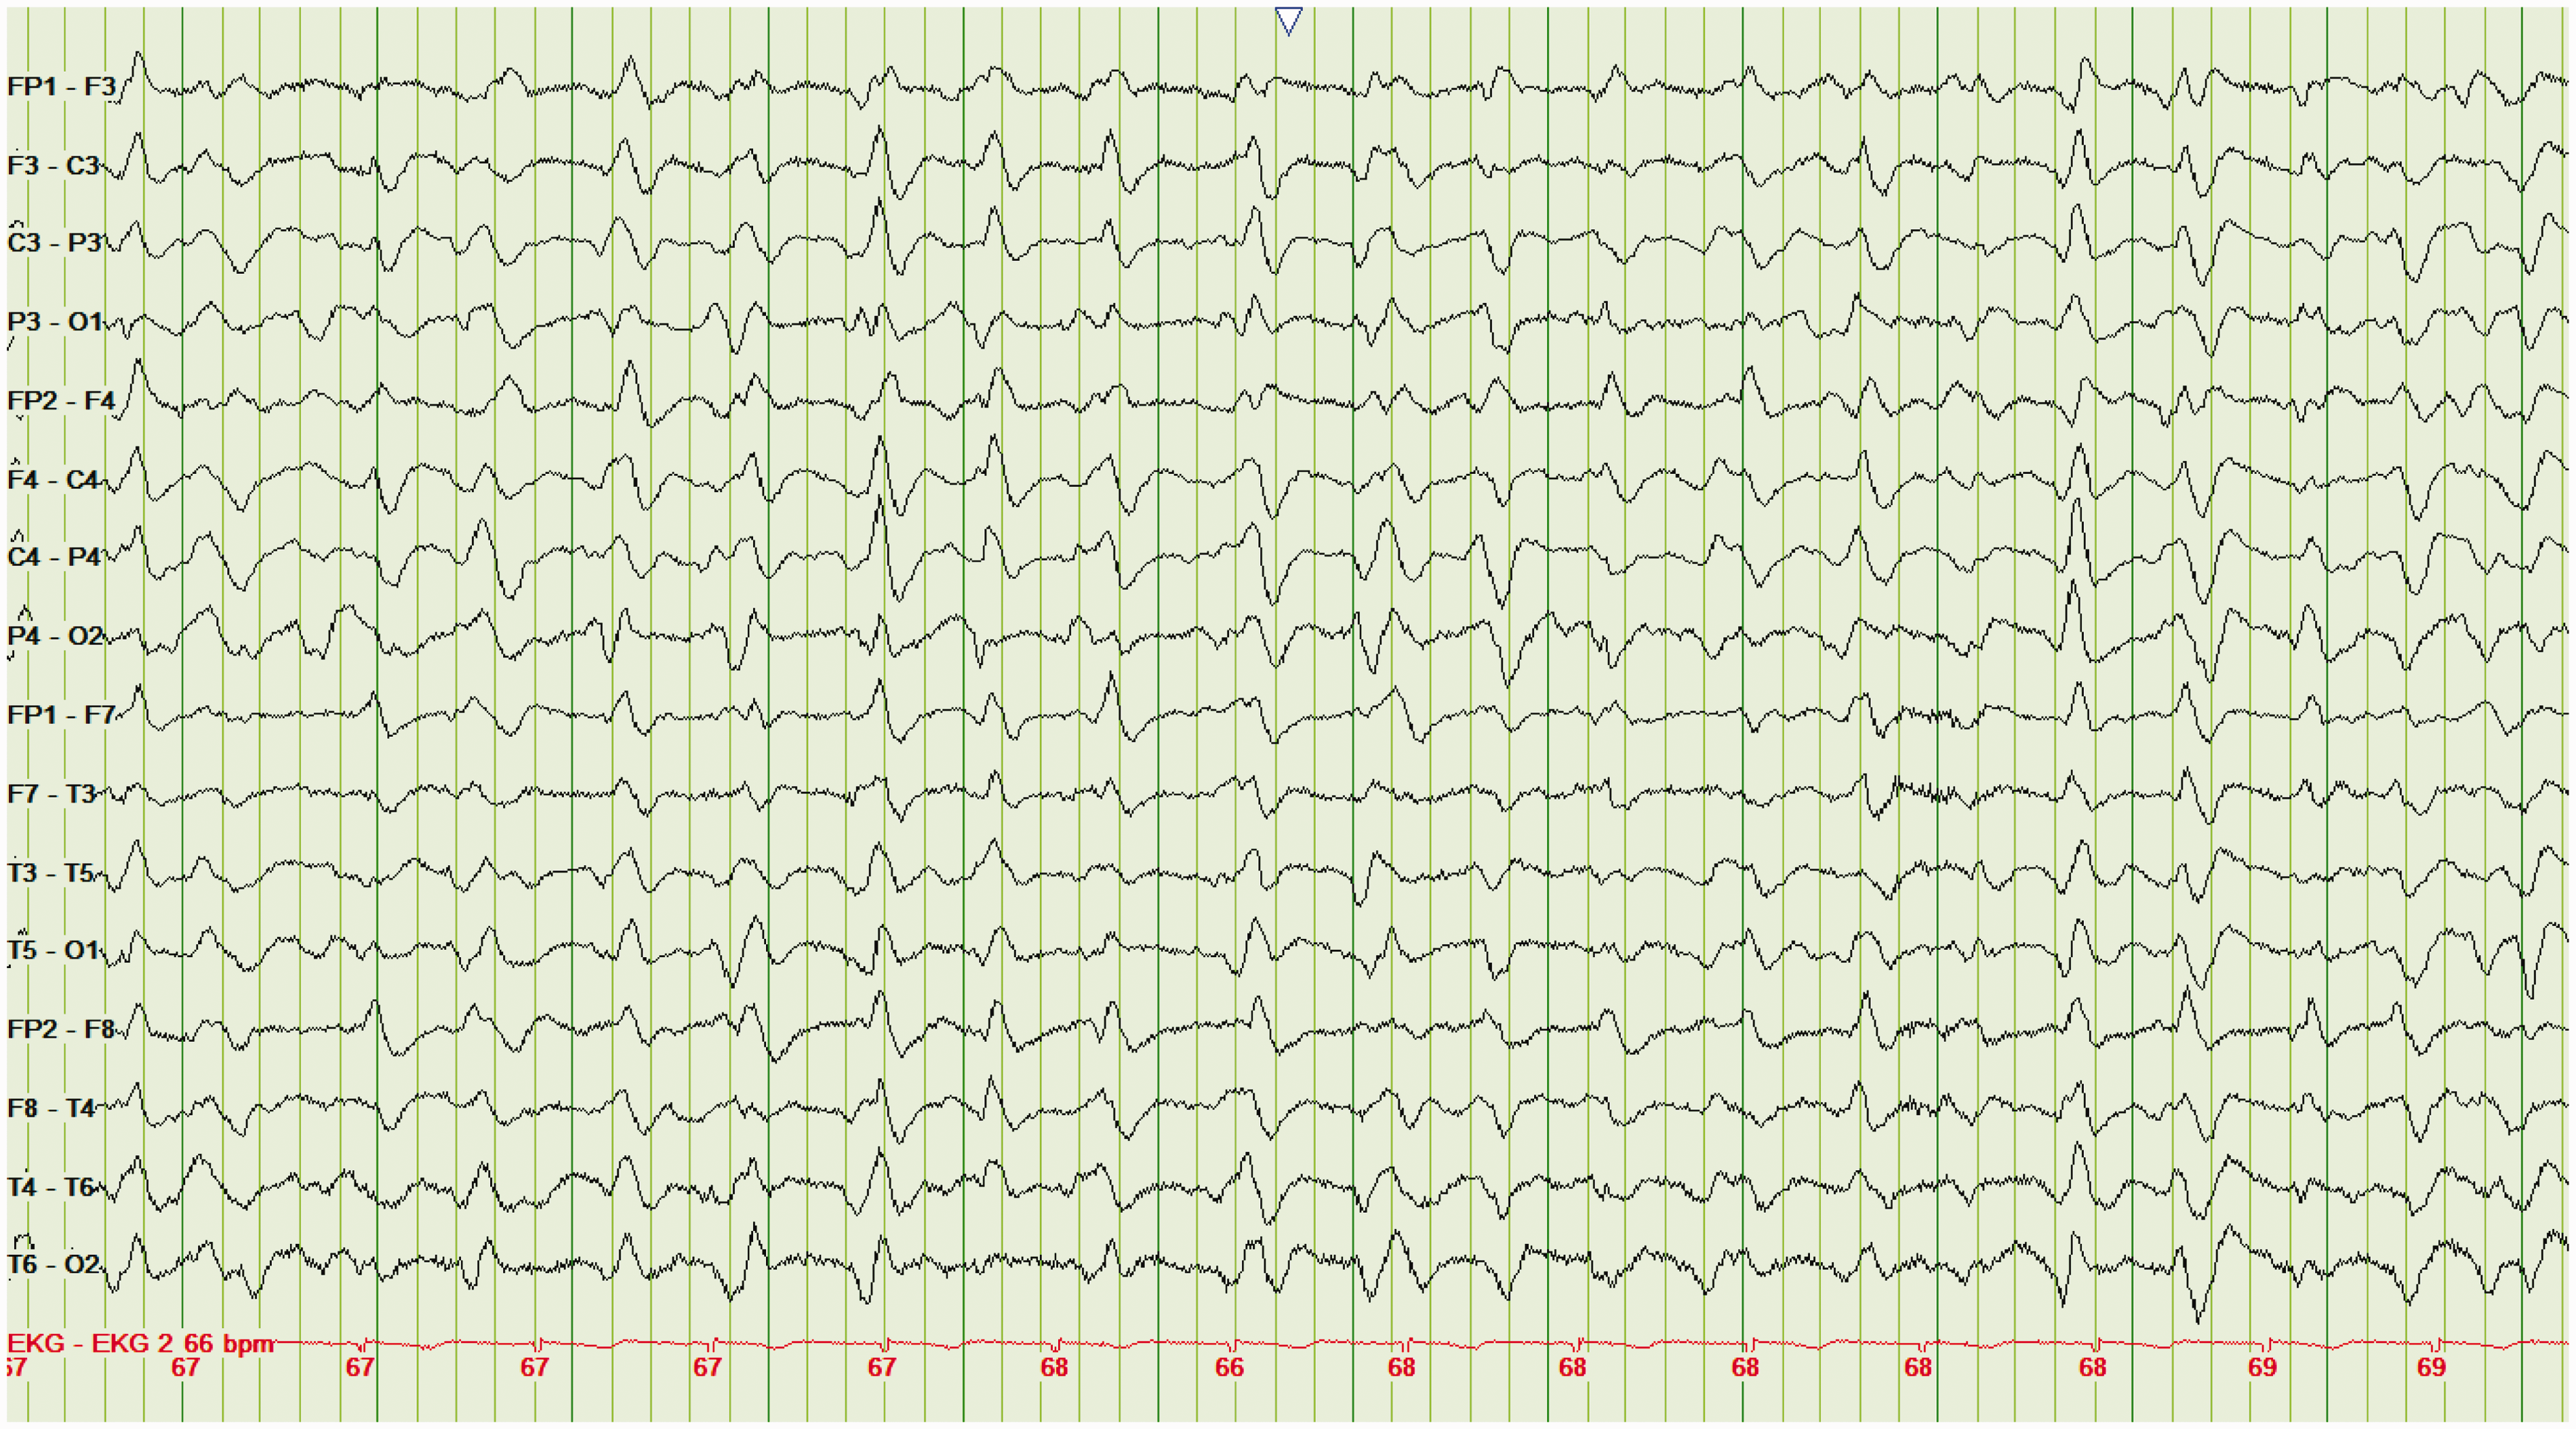
Take home point(s)
Triphasic waves are seen in various toxic/metabolic encephalopathies, not just hepatic encephalopathy. Triphasic waves appear similar to the EEG pattern seen with nonconvulsive status epilepticus.
Pattern 4: Burst-suppression
Burst-suppression (BuSu) is characterized by periods of high-voltage EEG activity, alternating with periods of suppressed electrical activity (Figure 11). It indicates diffuse cerebral dysfunction and is almost exclusively seen in deeply comatose patients.
20
Once again, this EEG pattern does not pinpoint the cause, but often confirms a poor prognosis. This is because the BuSu pattern can be seen following cerebral anoxia from cardiac arrest
21
or head trauma,
6
drug intoxications including baclofen
22
and carbamazepine,
23
hypothermia,
24
and end-stage status epilepticus.
25
Importantly, however, it can also be seen in patients on very high sedation.
26
Burst suppression. EEG showing burst suppression in a patient with anoxic encephalopathy.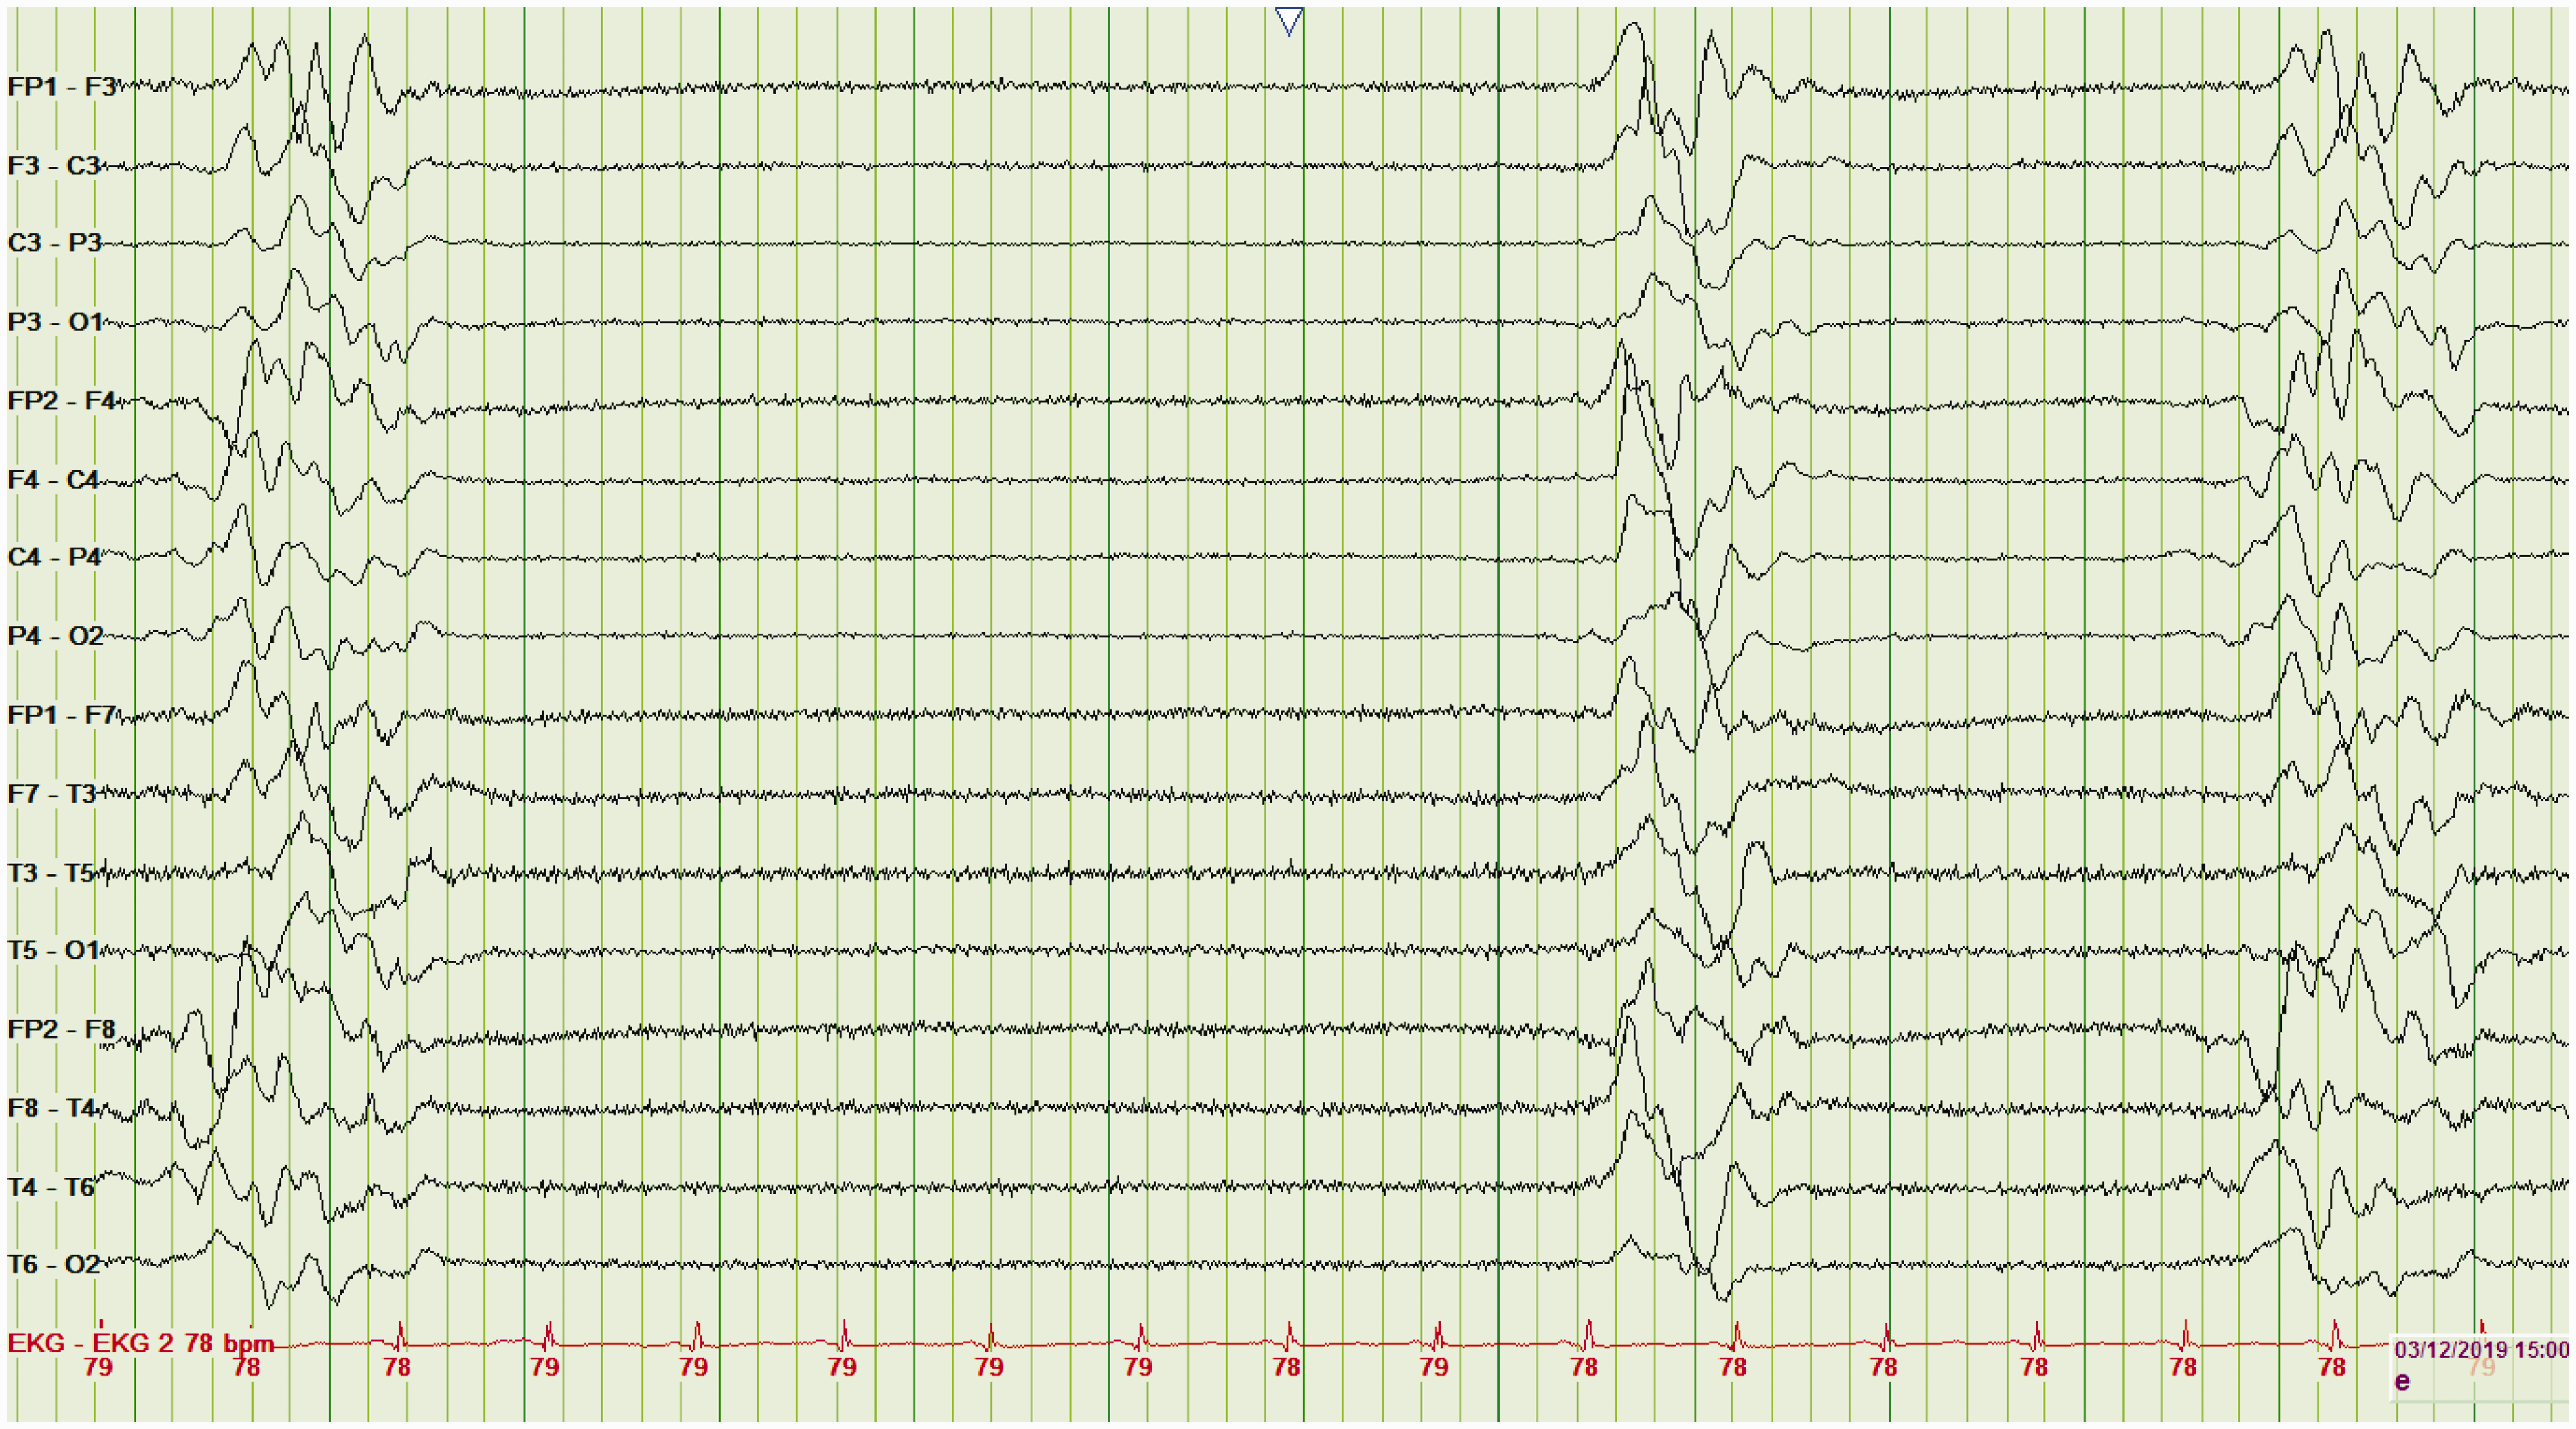
A BuSu EEG indicates a poor prognosis if the clinician suspects there is nothing reversible. A common example is after cardiac arrest with prolonged downtime and suspicion of severe anoxic encephalopathy. 27 Clinicians should be cautioned, however, because EEG BuSu can be caused by residual deep sedation/anesthesia and hypothermia.
In addition to prognostication, ICU clinicians may titrate sedatives to achieve BuSu. Examples include patients with resistant status epilepticus or intractable intracranial hypertension. This is because once BuSu is achieved the patient is maximally sedated and further dosing will only increase drug-related side effects without added clinical benefit.
Take home point(s)
Burst suppression typically indicates a poor prognosis. Caution must be exercised, however, as pharmacologic sedation can produce this EEG pattern.
Pattern 5: Electrographic seizures
ESs are common in obtunded and comatose patients. ESs can be associated with motor movements (e.g. subtle ocular movements), but most are not. Accordingly, clinicians often order 30 min or 60 min EEGs for patients with unexplained altered mental status. The risk of not doing these tests is that we miss subtle but treatable seizures. On the other hand, this approach means that a lot of EEGs will be ordered, and most will be noncontributory. Again, this illustrates the importance of dialogue between clinician and epileptologist.
The shorter the EEG, the less likely we are to pick up a rare ESs. Continuous EEG is increasingly requested by clinicians, in order to detect those with nonconvulsive (i.e. nonvisible) status epilepticus (NCSE).6,7 Rather than universal EEGs, clinicians should appreciate that the risk of NCSE is higher in patients with known epilepsy (aka historical epilepsy), those presenting with a generalized convulsion, or following intracranial hemorrhage.6,7
Salzburg EEG criteria were developed (and have been validated) for diagnosing nonconvulsive ES activity in the critically ill. 28 Each of the following three EEG patterns supports the diagnosis of nonconvulsive ES: (i) sharp waves or spikes occurring at >2.5 Hz for any 10 s period; (ii) epileptiform activity occurring at <2.5 Hz but with spatiotemporal evolution (change in frequency, voltage, and/or locational spread), or (iii) improvement in the electroclinical status following an intravenous AED trial (e.g. benzodiazepine).
Pattern 4a: Focal electrographic seizures
Many nondiffuse cortical pathologies can be associated with electrocerebral irritation and can result in focal ESs. These include hemorrhagic or ischemic stroke, viral or autoimmune encephalitis, brain abscesses, brain tumors, and post-traumatic gliosis.
11
Focal ESs occur over one cerebral hemisphere (Figure 12) and are often restricted to a particular region. They can evolve from PLEDs, or arise de novo. Focal electrographic seizure. EEG demonstrating a focal electrographic seizure over the right temporal lobe.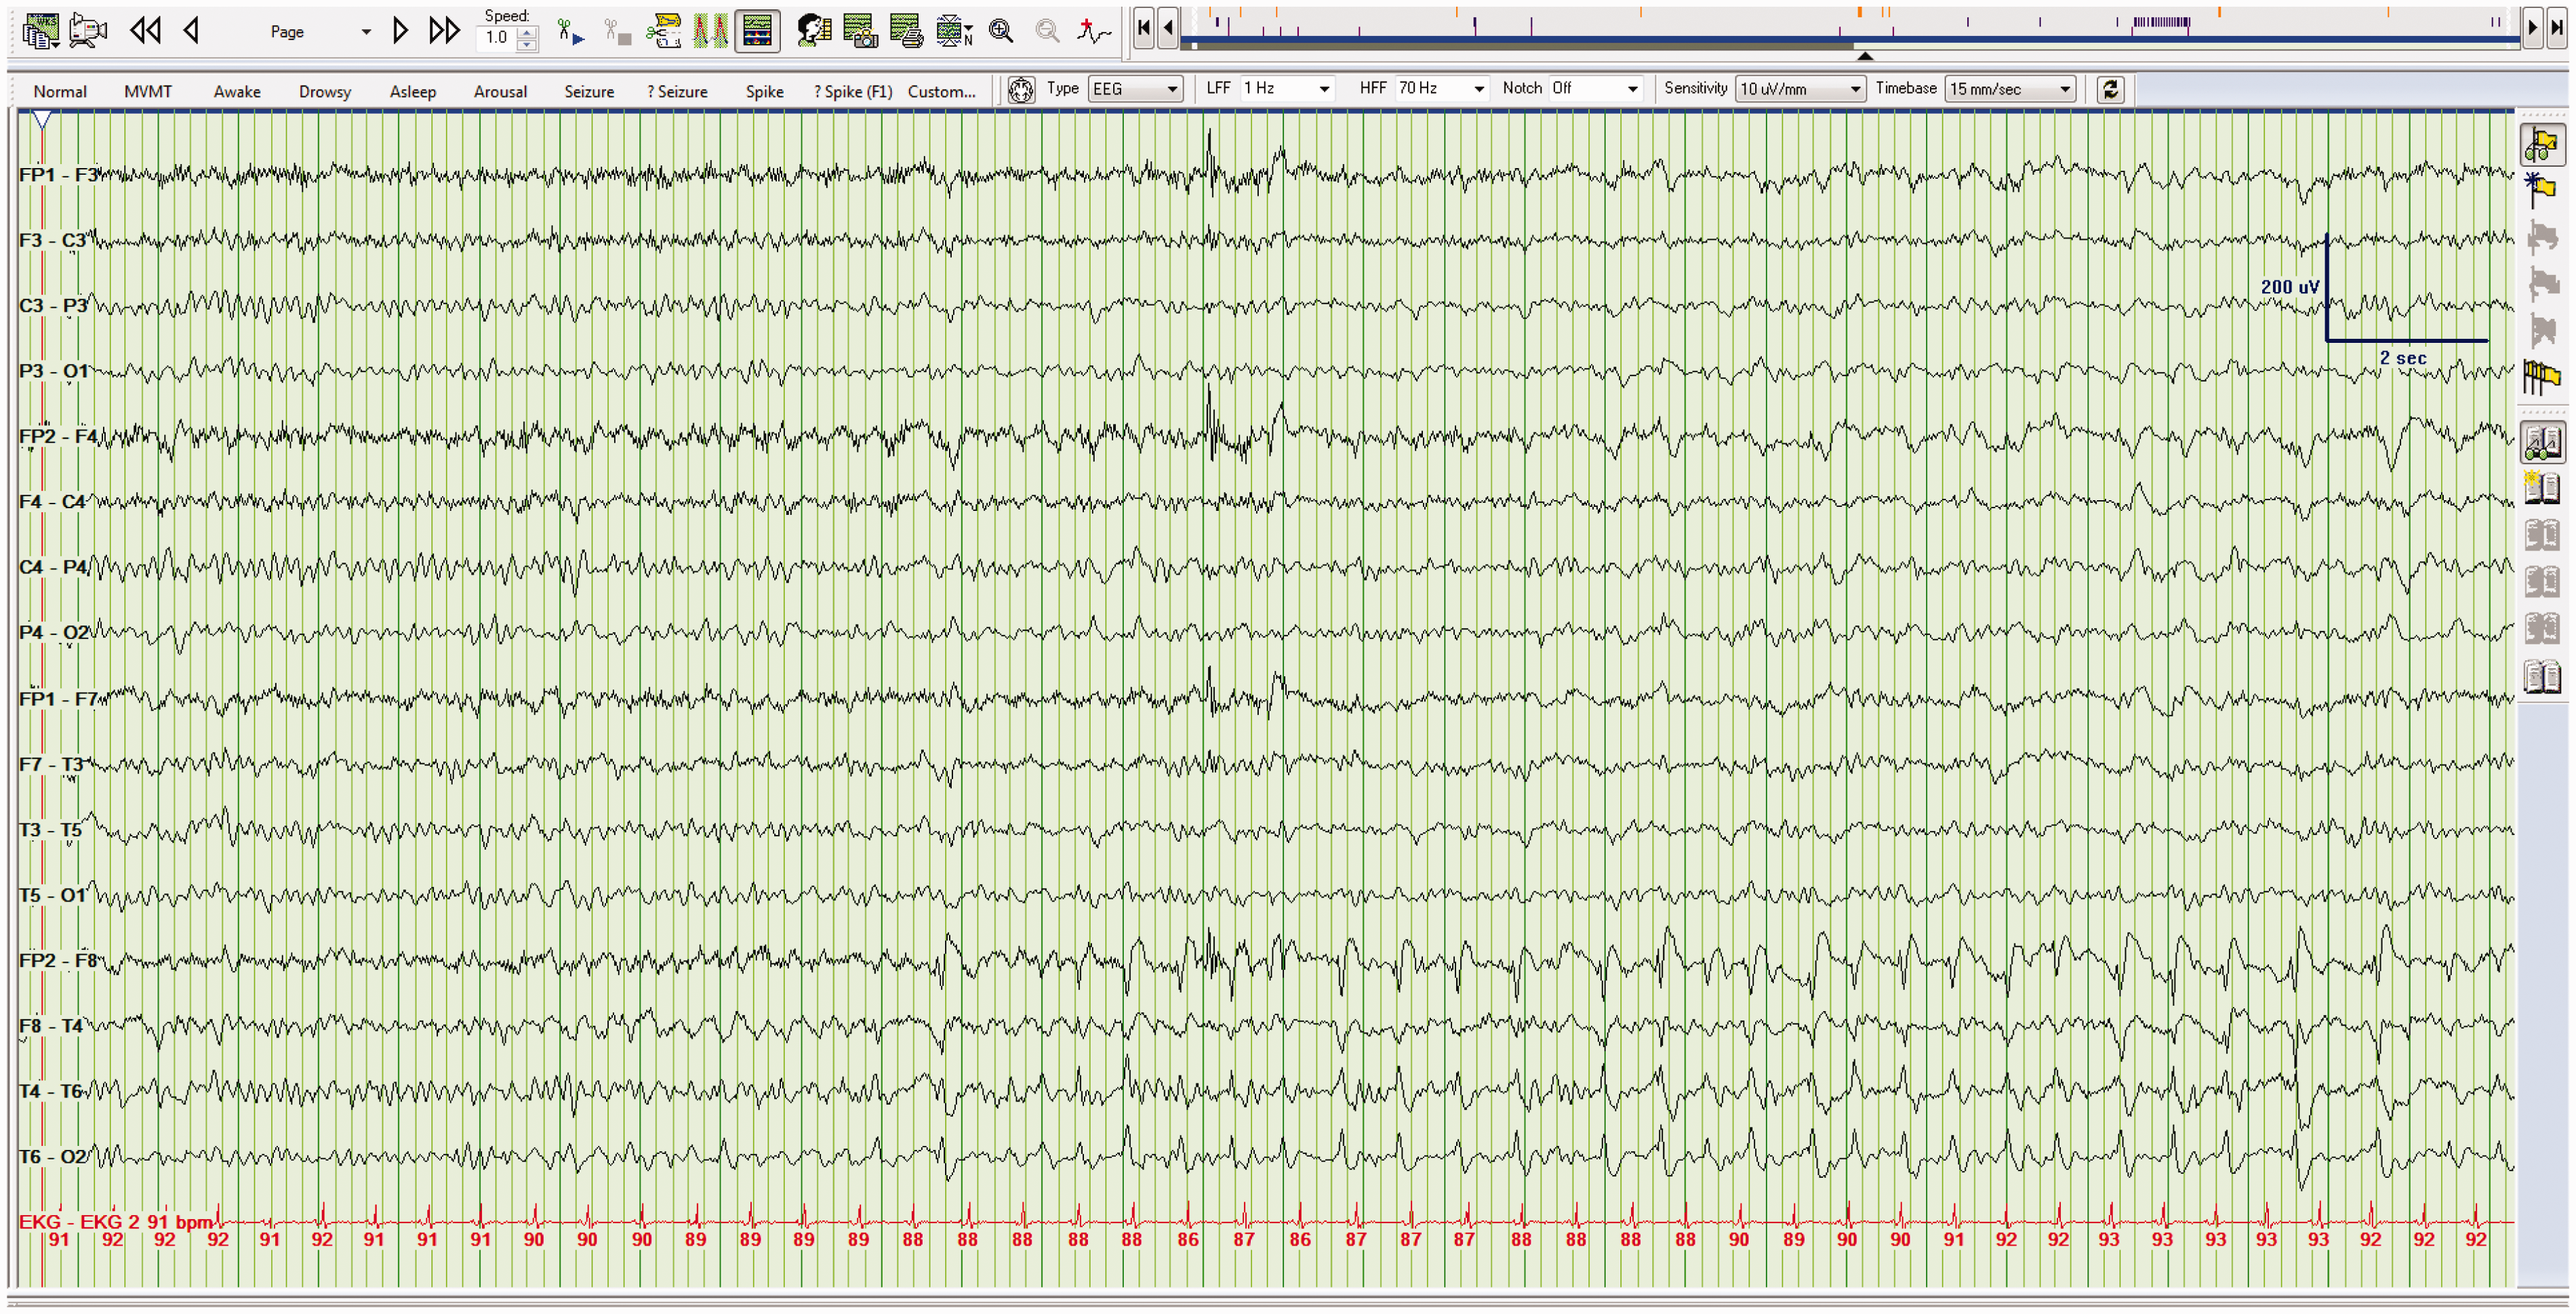
Take home point(s)
Focal ESs are caused by localized cortical pathologies and, as such, occur over one hemisphere.
Pattern 4b: Generalized electrographic seizures
Focal brain disease can also cause generalized ESs throughout the brain. Despite the focality of the clinical disease, these are called generalized ESs. This is because the term “generalized” refers to the EEG abnormality not the brain lesion. Generalized ESs can also occur in patients with idiopathic/cryptogenic epilepsy.6,7 The belief is that the EEGs are most often ordered after focal ESs have spread to involve both hemispheres, and therefore it is difficult to isolate/lateralize the cause (Figure 13). Generalized electrographic seizure. Generalized electrographic seizure in a comatose patient with an underlying seizure disorder.
Take home point(s)
As with focal ESs, generalized ESs may be the result of focal pathologies.
Conclusion
Acute care clinicians often order tests with the hope of receiving simple answers. For example, when ordering an EEG they likely wish to ascertain (i) is my patient having a seizure? (ii) will my patient benefit from AEDs? (iii) will a follow-up EEG be useful? (iv) does this EEG help me prognosticate? Our hope is that this article demonstrates why these questions are understandable but not always straightforward. In so doing, it should better explain why EEGs should be ordered prudently and interpreted by experts. The science of electroencephalography is nuanced and the first step is to have a common understanding, alongside empathic communication between specialists. This means developing mutual understanding and mutual appreciation between those who order EEGs and those who interpret them.
This article is the result of bringing key stakeholder groups together. As a result, this is more than just an educational resource that provides a basic understanding and shared language. It is also an important step in terms of building, maintaining and future proofing our EEG service. This will require ongoing collaboration and commitment to education, dialogue, and strategizing across specialties. While the science of EEG is hard, managing and molding medical culture is harder. This article represents the first step in an ongoing and lengthy process to ensure that our patients and colleagues feel appropriately cared for. In other words, there is more to electroencephalography than can be delivered via a single basic primer, but it represents a useful starting point.
Footnotes
Acknowledgements
We thank Dr Adam Romanovsky for critical appraisal of the article.
Declaration of conflicting interests
The author(s) declared no potential conflicts of interest with respect to the research, authorship, and/or publication of this article.
Funding
The author(s) received no financial support for the research, authorship, and/or publication of this article.