
Abstract
Lung protective ventilation is becoming increasingly used for all critically ill patients being mechanically ventilated on a mandatory ventilator mode. Compliance with the universal application of this ventilation strategy in intensive care units in the United Kingdom is unknown. This 24-h audit of ventilation practice took place in 16 intensive care units in two regions of the United Kingdom. The mean tidal volume for all patients being ventilated on a mandatory ventilator mode was 7.2(±1.4) ml kg−1 predicted body weight and overall compliance with low tidal volume ventilation (≤6.5 ml kg−1 predicted body weight) was 34%. The mean tidal volume for patients ventilated with volume-controlled ventilation was 7.0(±1.2) ml kg−1 predicted body weight and 7.9(±1.8) ml kg−1 predicted body weight for pressure-controlled ventilation (P < 0.0001). Overall compliance with recommended levels of positive end-expiratory pressure was 72%. Significant variation in practice existed both at a regional and individual unit level.
Introduction
Lung protective ventilation (LPV) is one of the few interventions in critically ill patients with a proven link to improved outcome, through the reduction of ventilator-induced lung injury (VILI). Mortality in critically ill patients with acute respiratory distress syndrome (ARDS) was significantly reduced by the application of low tidal volume ventilation (6 ml kg−1 predicted body weight (PBW)) in a landmark large randomised controlled trial. 1 An increasing body of evidence now exists demonstrating improved patient outcome, with a reduced incidence of pulmonary complications and shorter duration of mechanical ventilation, along with reduced duration of plasma cytokine production, if LPV is applied to healthy lungs at the onset of mechanical ventilation, prior to the recognised development of lung injury.2–9 This evidence in patients without ARDS combined with the fact that clinician under-recognition of ARDS is surprisingly common, 10 and delaying initiation of low tidal volume ventilation worsens outcomes in ARDS 11 means a default lung protective ventilatory strategy for all patients ventilated in critical care units is now used in a number of intensive care units (ICUs) across the United Kingdom (UK).
Compliance with the universal application of LPV in the UK ICU population is unknown. An insight into UK ICU practice in patients with ARDS can be gained by analysing the control group of the High Frequency OSCillation in ARDS (OSCAR) Trial 12 and the Simvastatin in the Acute Respiratory Distress Syndrome (HARP-2) trial. 13 In the OSCAR study, the average tidal volume in the control group for the first three days after enrolment was 8.3 ml kg−1 PBW. In HARP-2, both intervention and control groups had baseline mean tidal volumes of 8.1 ml kg−1 PBW.
In our study, we describe compliance with LPV and recommended positive end-expiratory pressure (PEEP) levels for all mechanically ventilated patients on a mandatory ventilator mode in multiple ICUs across two regions (Severn and Wessex) in the UK.
Methods
The audit was carried out prospectively within seven out of the eight general ICUs (one of which is a mixed general and neurocritical care unit) within the Severn region during a 24-h period at the local data collector’s discretion from 08:00 to 07:59 the following day at any time during the month from 15 December 2014 to 15 January 2015. All patients being invasively ventilated on a mandatory ventilation mode were included. In the Wessex region, data were collected prospectively over a seven-day period from 08:00 5 January 2015 to 07:59 12 January 2015 in all nine general ICUs within this region and one cardiac ICU. In Wessex patients were excluded from the study if strict control of PaCO2 was required. There were no exclusion criteria in the Severn region. As the audit was initially carried out separately between the two regions and was run over different time frames, we adopted a pragmatic approach to standardising and combining the data collection between Severn and Wessex and selected the 24-h period for each unit from the seven days audited in the Wessex region which contained the most patient ventilator hours. In both regions, ventilation data were collected at two-hourly intervals. PBW was calculated for each patient as has been described previously. 1 Patient height was determined for all patients in order to calculate PBW, this was either via direct measurement, ulnar length measurement or taking the data from the patient’s preoperative assessment clinic documentation. Audit approval was sought individually from each local trust Research and Innovation department.
Data were collated, anonymised and analysed using Microsoft Excel software (Microsoft Corporation, Redmond, WA, USA) and GraphPad Software Inc QuickCalcs (GraphPad Software, Inc., 7825 Fay Avenue, Suite 230, La Jolla, CA 92037, USA). Comparison between groups was made with the Student’s t-test or Fisher’s exact test where appropriate. Differences were considered to be statistically significant at the level of P < 0.05. Ventilation was defined as being compliant with low tidal volume ventilation if the tidal volume was ≤6.5 ml kg−1 PBW, as this was the upper mean tidal volume patients were exposed to in the ARDSnet study. 1 PEEP level compliance was derived from the lower PEEP strategy found in the 2004 ARDSnet randomised controlled trial. 14 Results are expressed as mean ± standard deviation or median and interquartile range.
Results
Demographic data.
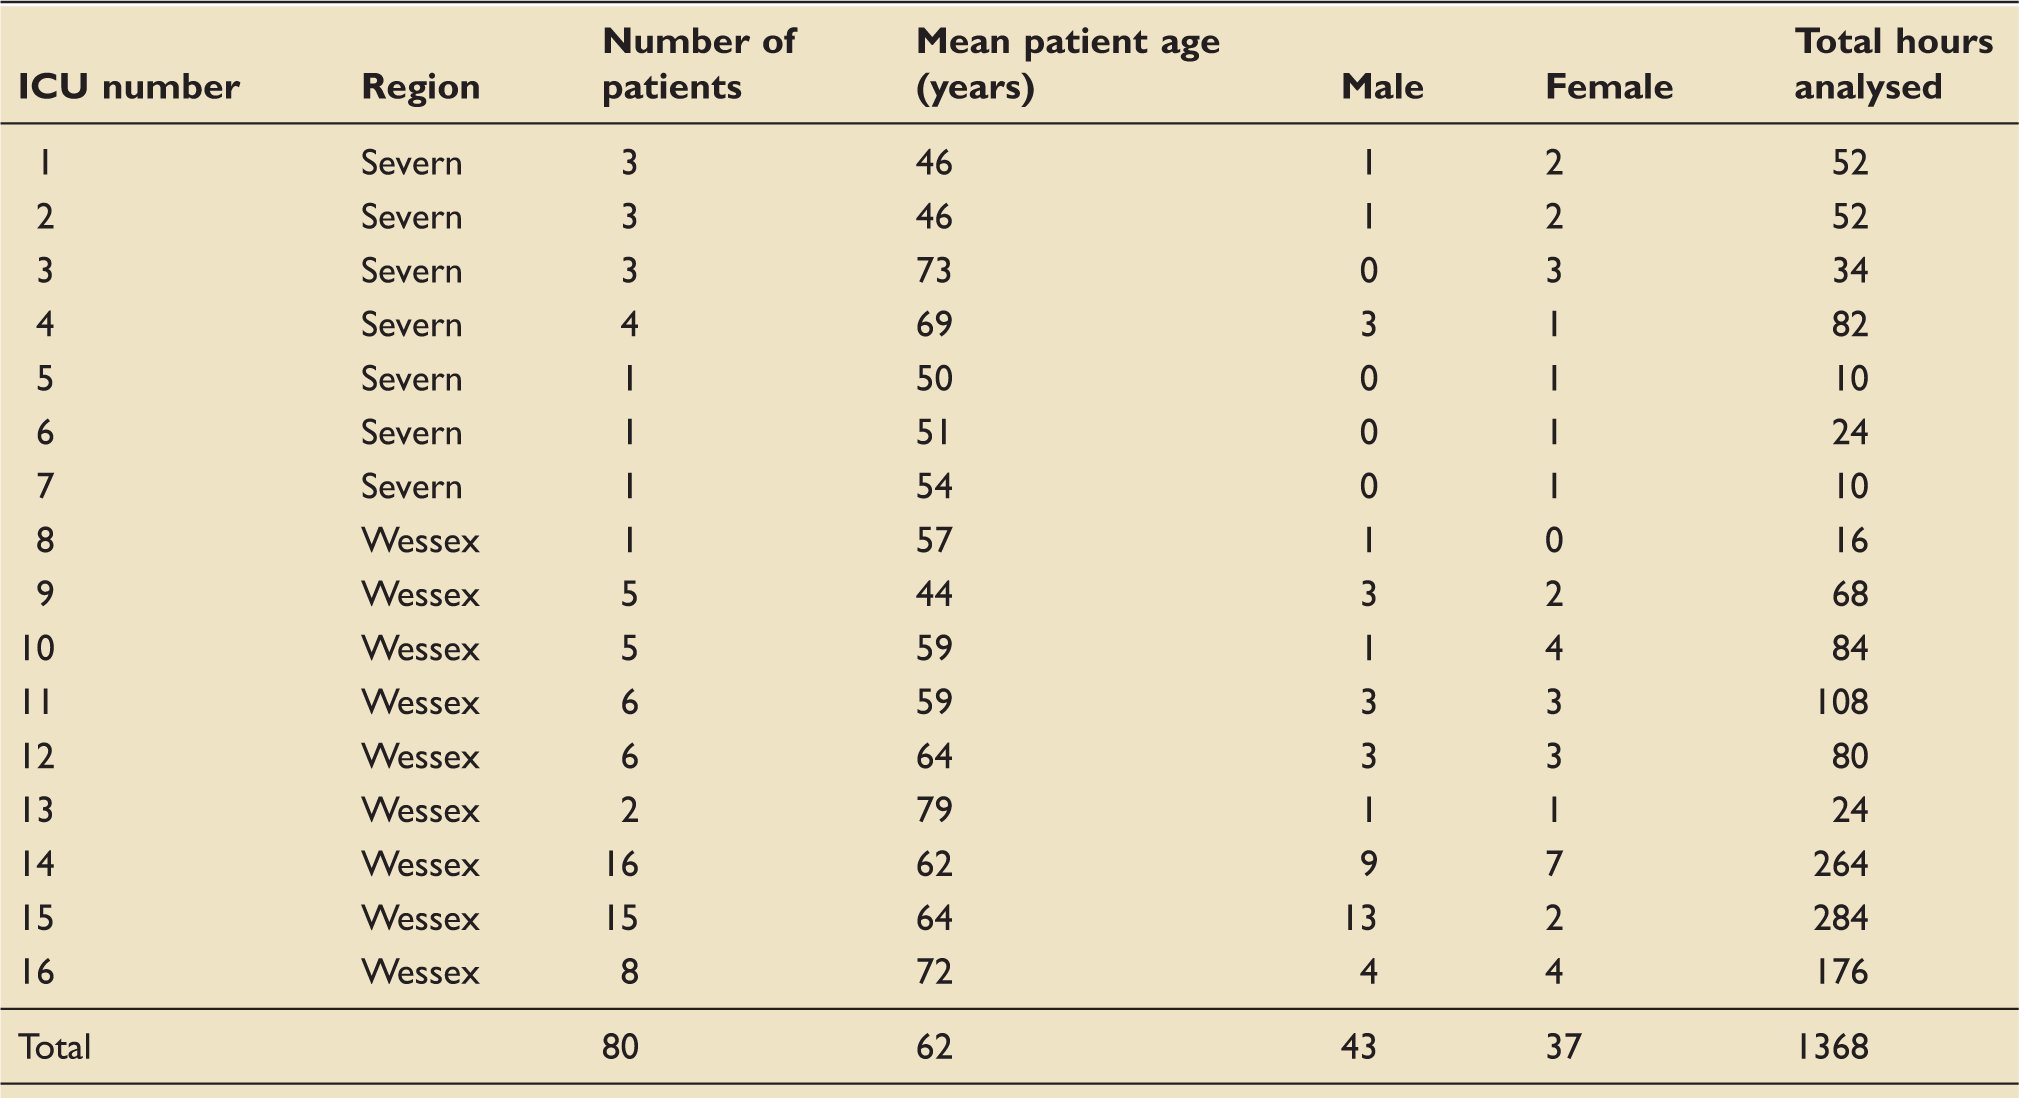
ICU: intensive care unit.
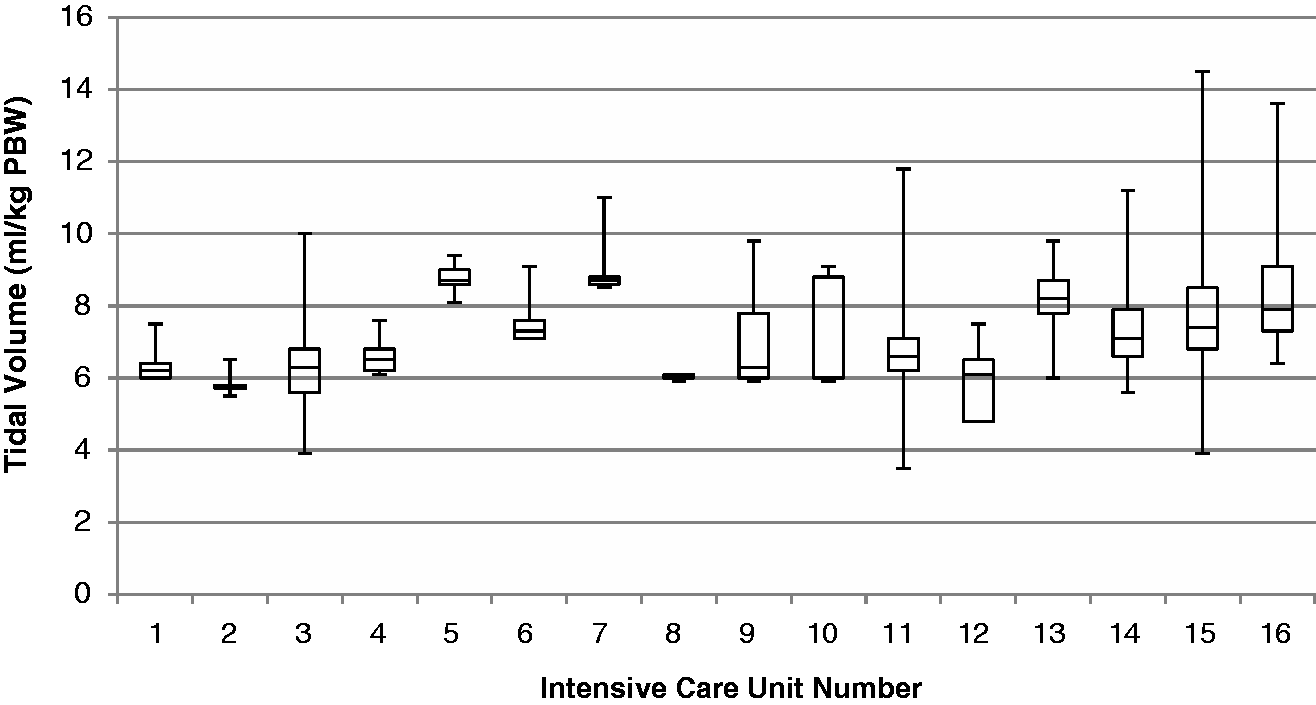
Variation in tidal volume between units (median, IQR, min/max values).
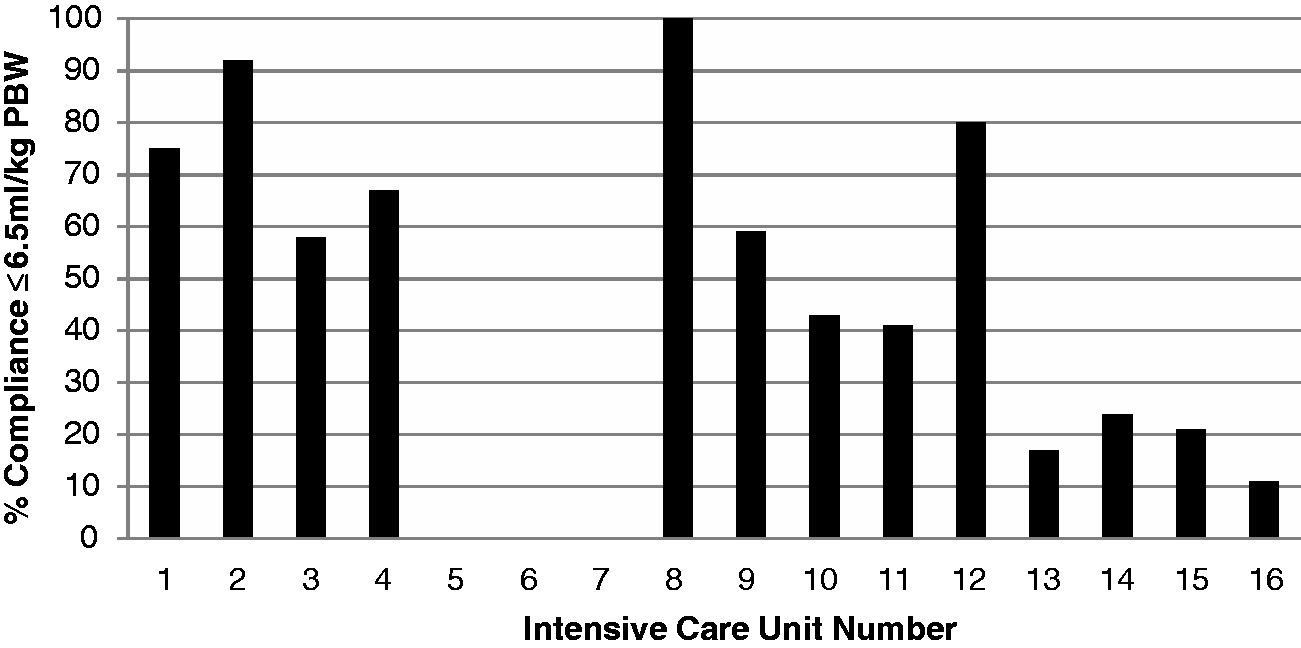
Total time ventilation compliant with <6.5 ml kg−1 PBW per unit.
Compliance with recommended PEEP settings for a given FiO2
14
across all units is demonstrated in Figure 3. Centre number 8 was excluded from the PEEP compliance analysis as the one patient included from this centre in the audit had incomplete PEEP data available. Overall compliance with minimum recommended levels of PEEP was 72%.
Total time compliant with recommended PEEP levels (Centre 8 omitted as incomplete data for PEEP settings).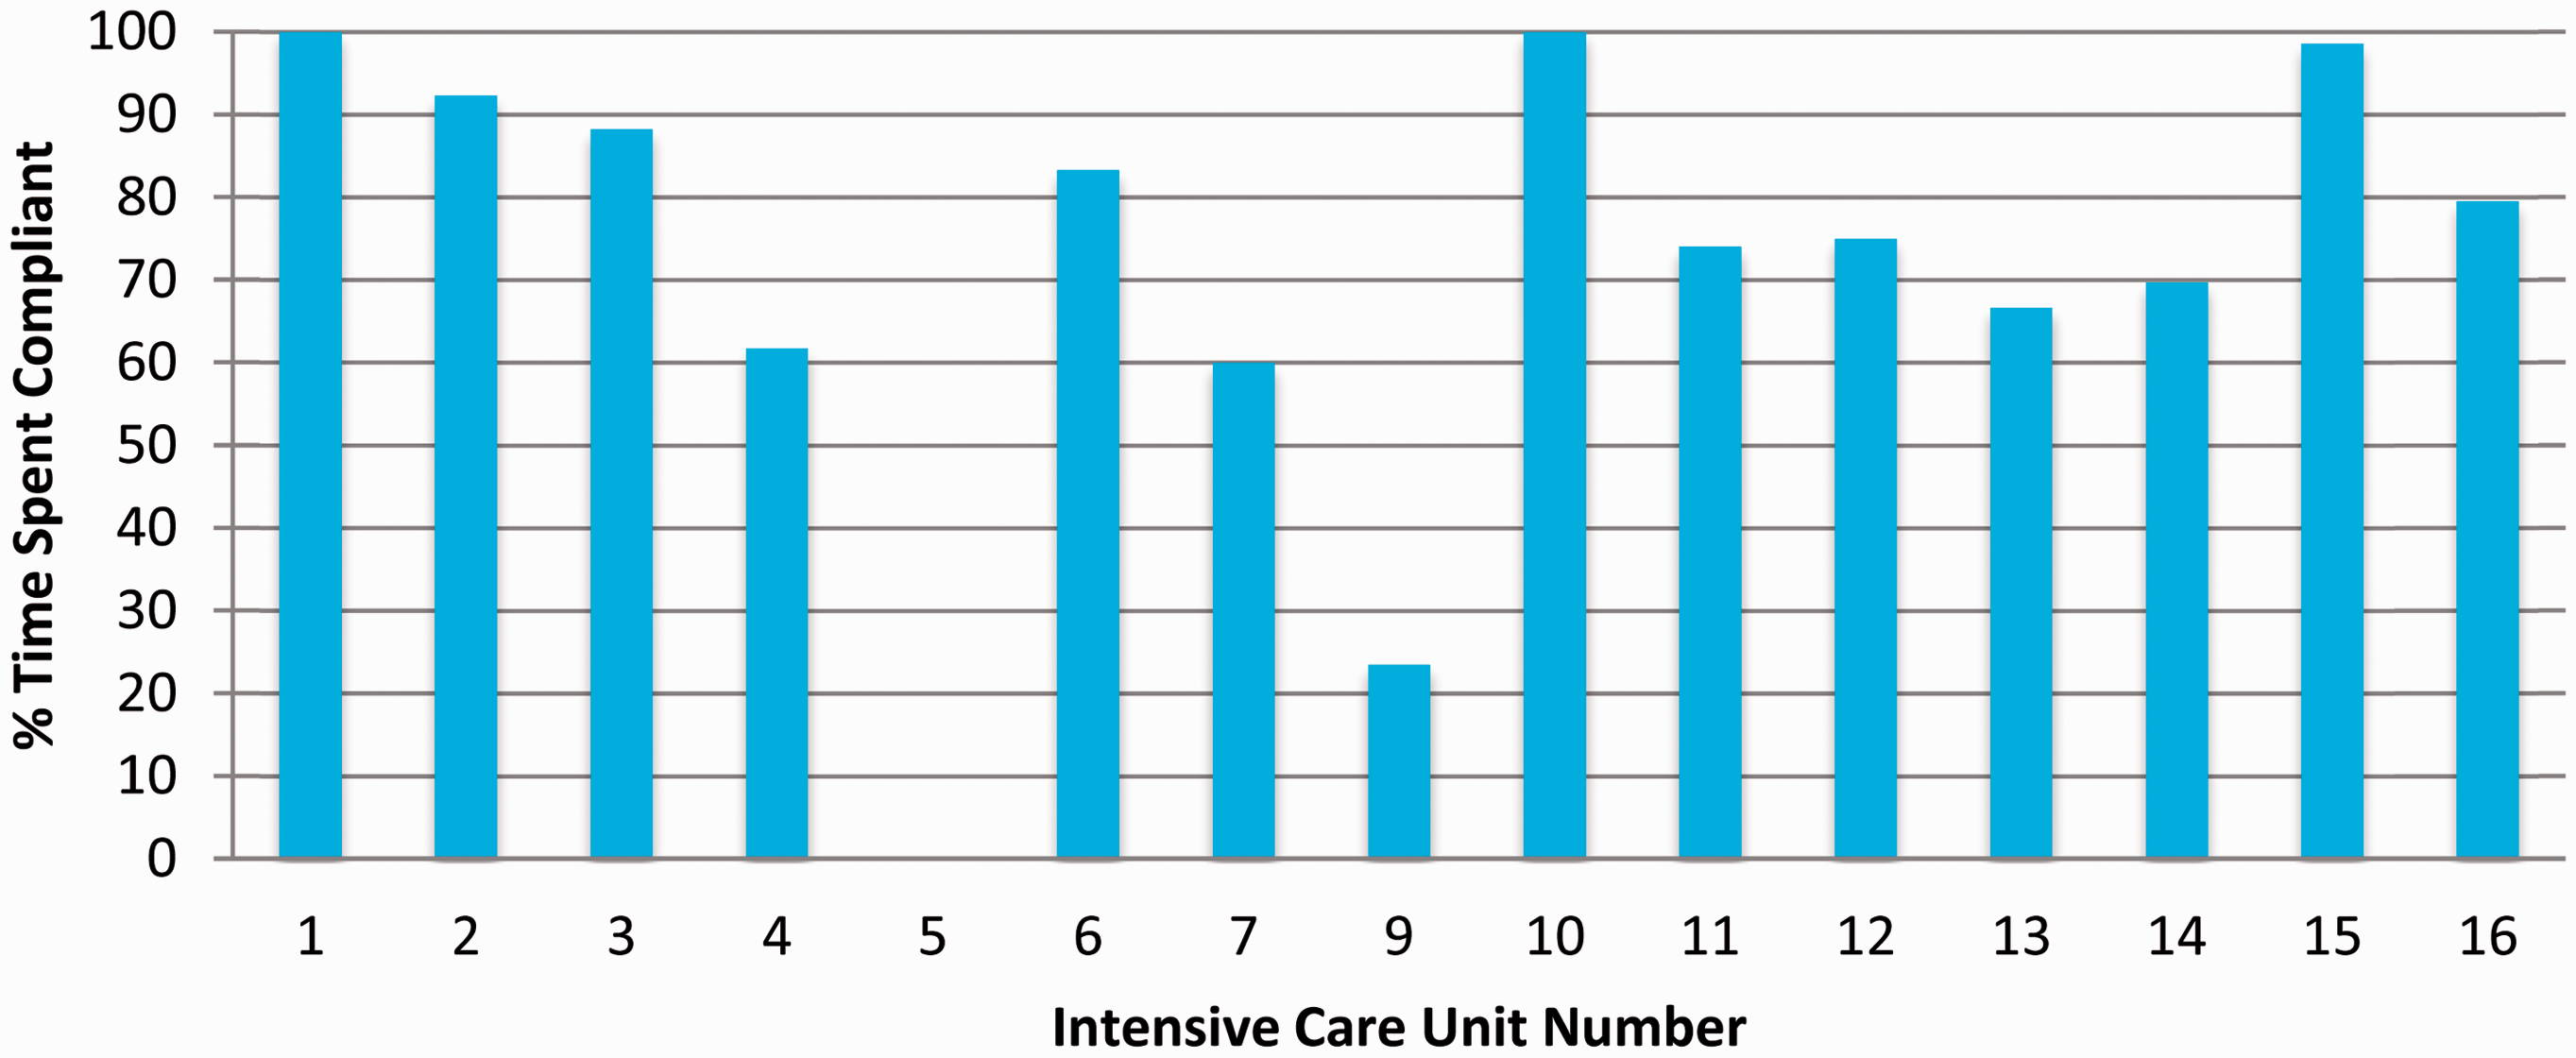
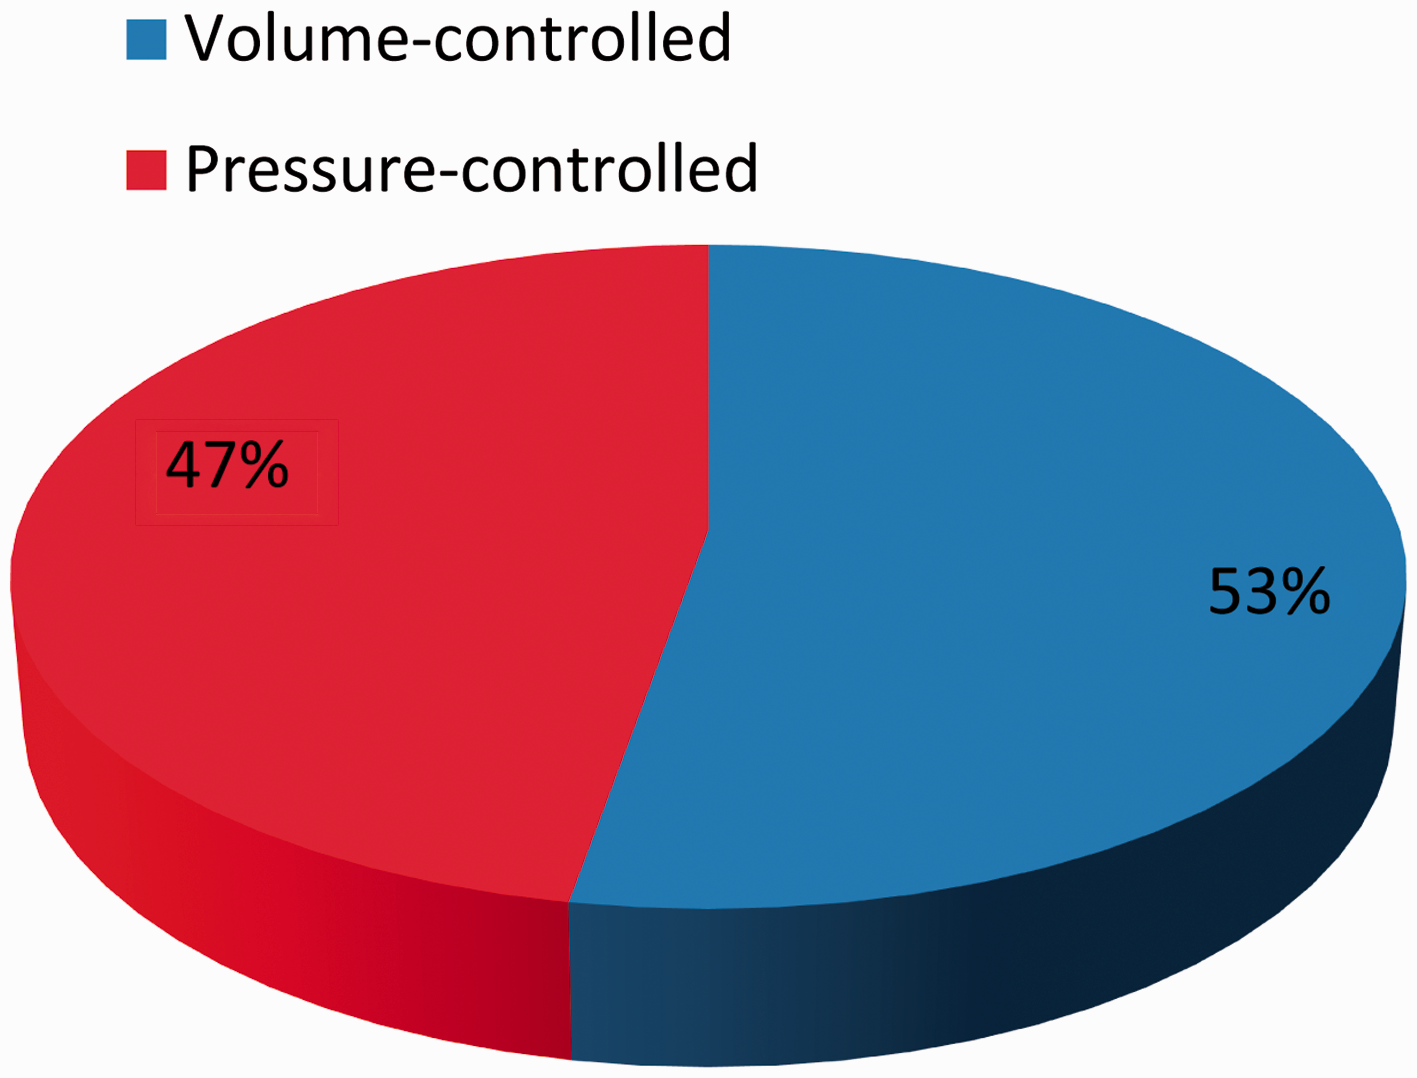
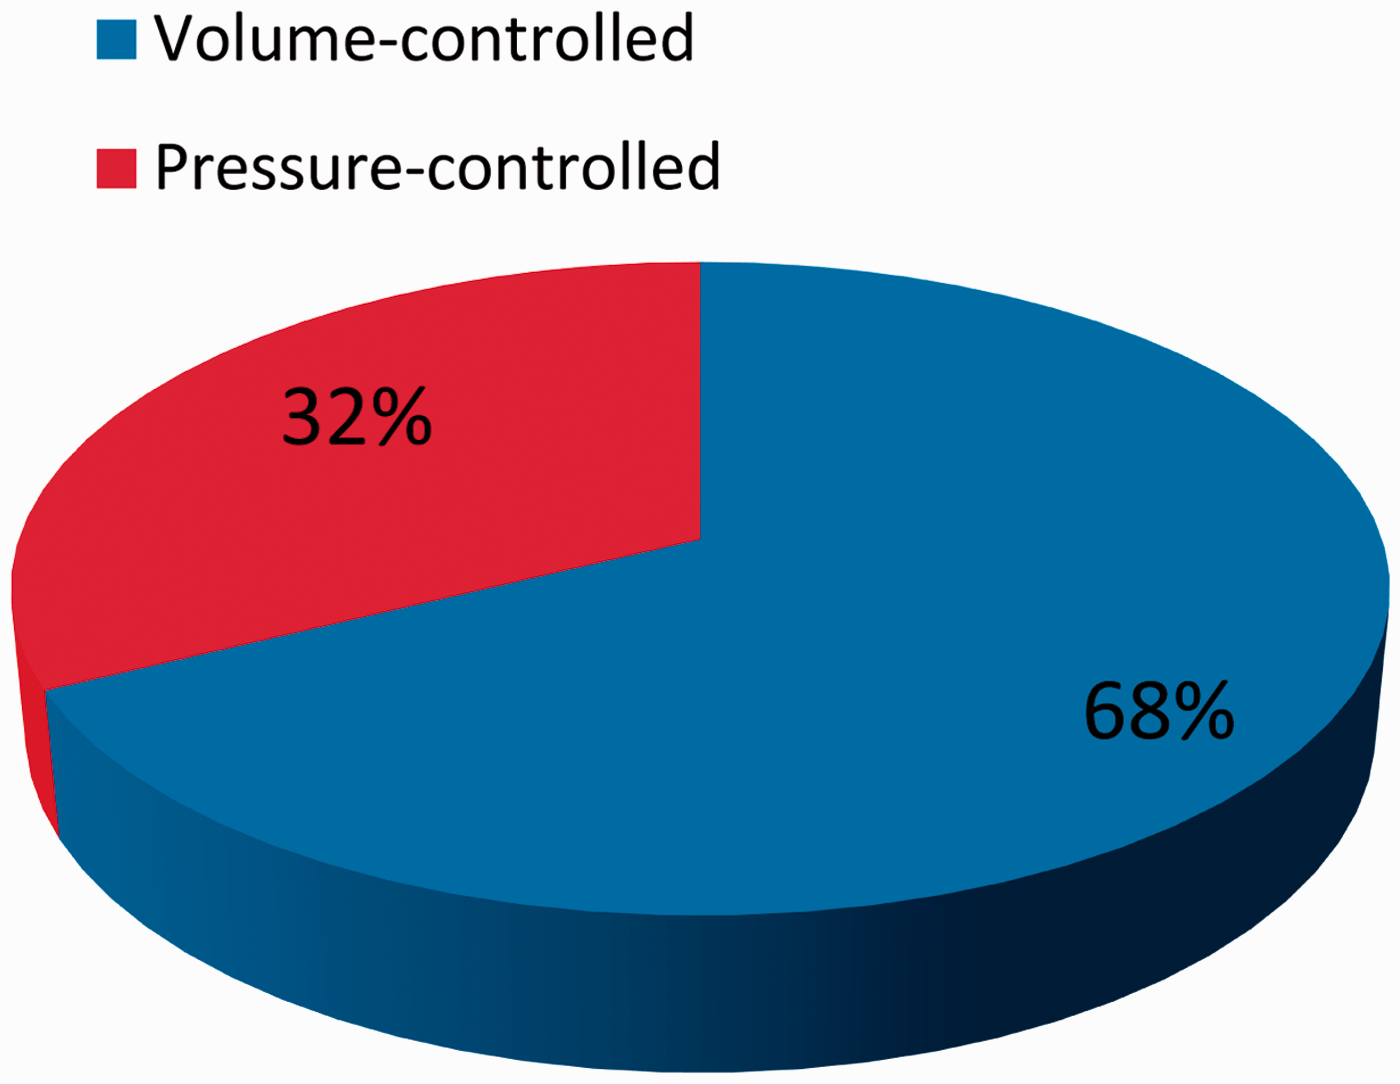
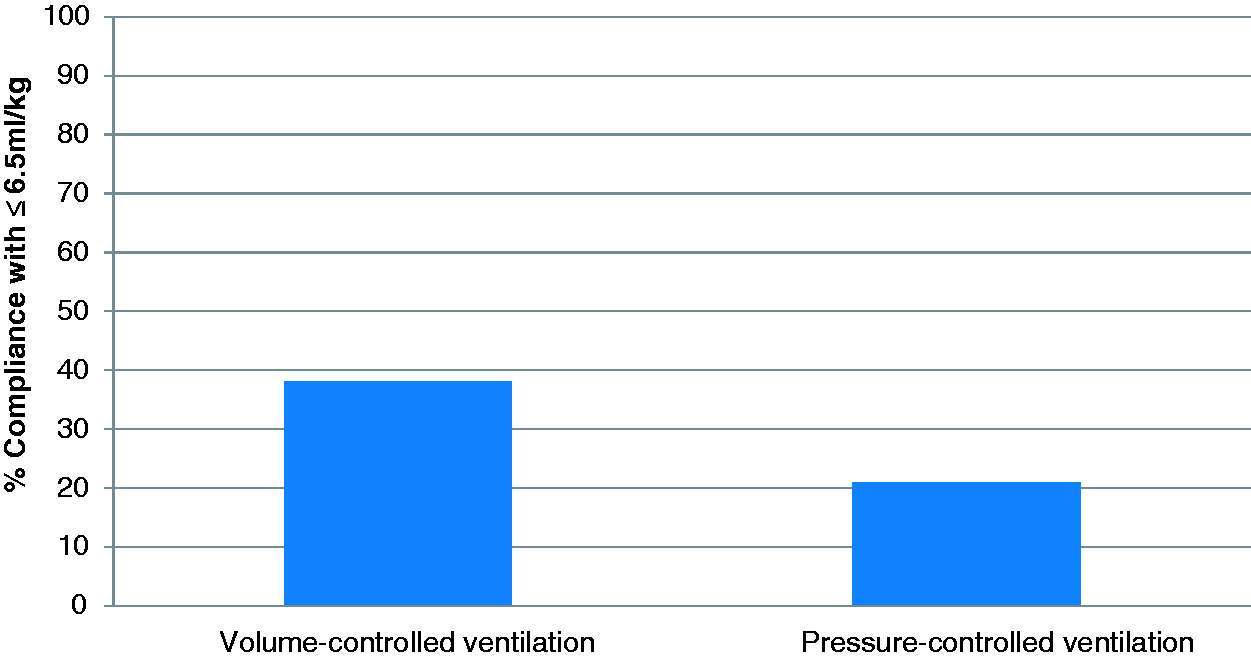
The mean tidal volume for patients ventilated with volume-controlled ventilation (which included pressure-controlled, volume-guarantee modes) was 7.0(±1.2) ml kg−1 PBW and 7.9(±1.8) ml kg−1 PBW for pressure-controlled ventilation (P < 0.0001). The use of volume- and pressure-controlled ventilation modes between regions was significantly different (P < 0.0001) and is illustrated in Figures 4 to 6. Compliance with ventilation at ≤6.5 ml kg−1 PBW for volume-controlled ventilation was 38% and for pressure-controlled ventilation was 21% (Figure 7).
Ventilator modes (Severn). Ventilator modes (Wessex). Ventilator modes Severn + Wessex combined. Compliance with <6.5 ml kg−1 PBW ventilation for VCV versus PCV.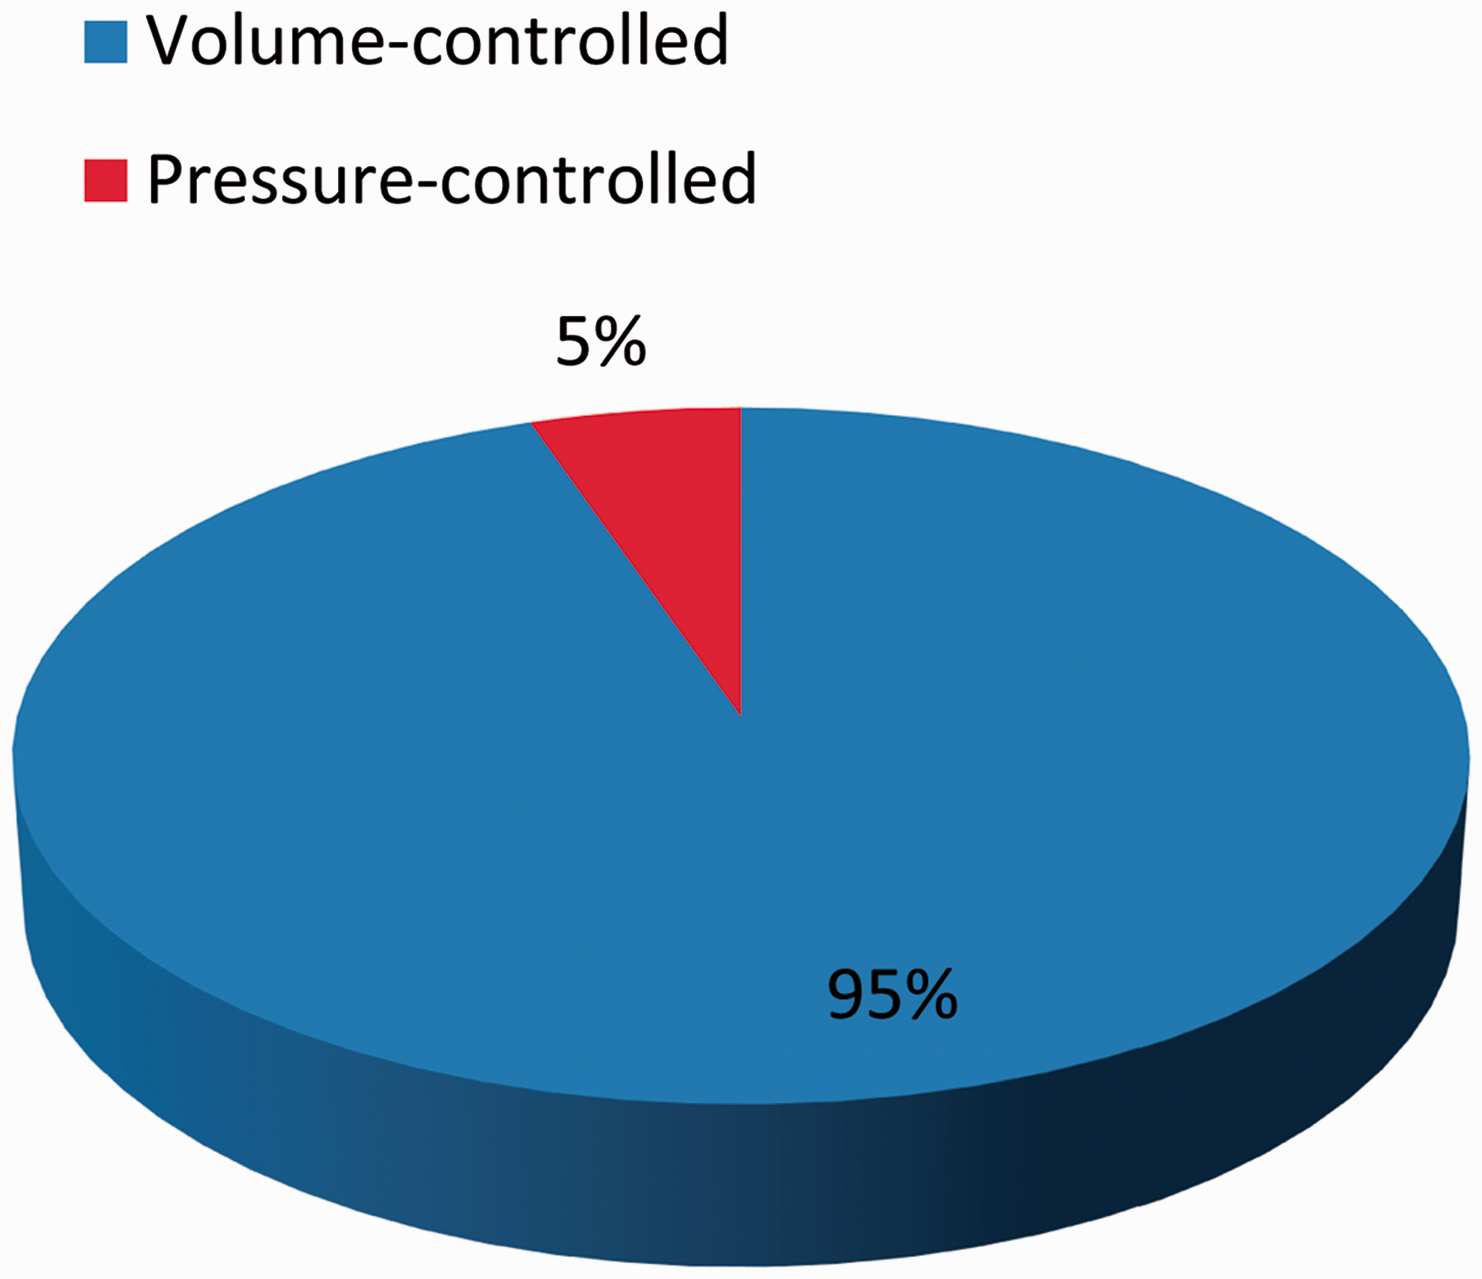
Discussion
The major strength of this study is that the data collected in the audit represents a large ‘real life’ cohort of critical care patients undergoing mandatory ventilation, providing a valuable insight into the day-to-day ventilatory practice in UK ICUs. The mean tidal volume for all patients (7.2 ± 1.4 ml kg−1 PBW) in the study is reassuring and represents an improvement compared with previous controlled study populations.12,13 Compliance with the audit standard of ≤6.5 ml kg−1 PBW was low however, at 34% and importantly significant variation in practice existed at multiple levels in this study: both within individual units, within each region and between regions. Even in similar units, such as the two neurocritical care units included in the audit, there was a difference in the adoption of the use of LPV. Reducing these variations is likely to confer an improvement in patient outcomes. 15 There was also significant inter-unit variation in adoption of recommended PEEP levels 14 for a given FiO2, although overall compliance was good at 72%. This is reassuring as inadequate levels of PEEP may lead to atelectrauma. 16
The use of a volume-controlled or volume-guaranteed ventilation mode was associated with a significantly lower tidal volume compared with a pressure-controlled mode (7.0 ml kg−1 PBW versus 7.9 ml kg−1 PBW) and showed significantly improved compliance with the audit standard of ≤6.5 ml kg−1 PBW (38% versus 21%). Given the apparent dose–response effect between tidal volume and pulmonary complications, 17 this is potentially clinically important. The more prevalent use of volume-controlled ventilation in the Severn region ICUs is one potential explanation behind the lower mean tidal volume of 6.6 ml kg−1 PBW in Severn compared to 7.3 ml kg−1 PBW in Wessex.
The patient numbers in Wessex were significantly higher than in Severn, which can partly be explained by the pragmatic way we standardised the data between the two regions; data in Wessex were collected prospectively over a seven-day period and the 24-h period with the most ventilator hours was selected for analysis. In Severn the audit was carried out prospectively over a 24-h period only. As the busiest time period was selected for analysis in Wessex, this may be an alternative explanation for the poorer compliance with the audit standard of ≤6.5 ml kg−1 PBW. Given the observational nature of the data collected, such conclusions can only be speculative.
Reasons behind the overall poor compliance with the use of LPV in this audit are likely to be multifactorial. The actual intent to implement LPV in the ICUs audited in this study is unclear. Previous studies have suggested a lack of education and concerns about hypercarbia, hypoxaemia and acidosis as well as the need for increased sedation as reasons behind the lack of implementation of LPV.18–20 Moreover, to date, there has not been a randomised controlled trial comparing ≤6 ml kg−1 PBW ventilation with higher volume ‘conventional’ (8–10 ml kg−1 PBW) ventilation in ICU patients ventilated without ARDS looking at mortality and duration of mechanical ventilation outcomes. This lack of a definitive study may potentially be influencing practice, but such a trial is currently in progress. 21
Even if there is an intent to deliver an intervention, there are numerous reasons why these practices may not be put into place. Clinicians may not always be delivering the care they think they are; in a previous study assessing the implementation of recommended interventions for the treatment of severe sepsis in German ICUs there was a significant disconnect between perceived and actual practice. 22
The multistep process of having to calculate PBW or ideal body weight (IBW) may be a significant barrier to the implementation of low tidal volume ventilation and can potentially be removed by making the ventilator default to a tidal volume 6 ml kg−1 IBW at the start of ventilation once patient height has been entered. This ‘nudging’ approach through the use of ventilator defaults was associated with improved compliance with low tidal volume ventilation in a recent study conducted in one of the units included in this audit. 23 In another study from the same centre, the use of large screen live dashboards displaying tidal volumes using data collected from a clinical information system was associated with a significant improvement in the implementation of low tidal volume ventilation. 24 The unit which utilises these interventions performed well in this audit, having 75% compliance with ≤6.5 ml kg−1 PBW and a median tidal volume of 6.2 (6.0–6.4) ml kg−1 PBW. More traditional quality improvement techniques involving education programmes have also been used to good effect. 25 Units 2, 3 and 12 had all undergone quality improvement programmes (QIP) in the 12-month period leading up to the audit and had median tidal volumes of 5.8 (5.7–5.8), 6.3(5.6–6.8) and 6.1(4.8–6.5) ml kg−1, respectively. The QIPs in these centres included education programmes, PBW/IBW height table laminates on ventilators, the use of ulnar length/height conversion tapes and a move towards the use of volume-controlled ventilation modes as the default for mandatory ventilation.
Weaknesses of this study include the absence of measurement of plateau pressures, which formed part of the package of ‘lung-protective ventilation’ in the ARDSnet study. Although volutrauma may be more influential than barotrauma in the development of VILI, 16 barotrauma is still important and plateau pressure measurement is also relevant for the calculation of driving pressure which may be associated with survival. 26 In addition, the study did not specifically determine how many of the audit cohort of patients actually had ARDS and the care they received. The overall results may also not be truly representative of normal UK ventilatory practice as ICU staff were aware that an audit was ongoing in the Severn region and in some centres in Wessex, so a Hawthorne effect 27 could have occurred. Direct comparisons between performances in the two regions are also potentially difficult to draw due to the different methods of selecting the 24-h period for data analysis between them and the difference in exclusion criteria.
In conclusion, large variation in the implementation of LPV exists between UK ICUs. This variation may adversely affect patient outcomes. The use of a volume-controlled ventilation mode was associated with a significantly lower tidal volume.
Footnotes
Acknowledgements
STAR and SPARC wish to thank all local data collectors: Jeremy Astin, Kate Crewdson, Helen Davies, Nick Dodds, Andy Grant, Sarah Heikal, Hussain Lahie, Kieran Oglesby, Andy Ray, Will Seligman, Sarah Bates, Alex Belcher, Sonya Daniel, Emma Fitzgerald, Rebecca Fry, Ian Jenkins, Aidan Joyce, Joe Kinsella, Dominique Melville, Andrew Nash and Anthony Sheperdson. This study was presented in part at the European Society of Intensive Care Medicine Annual Congress, Berlin 2015 and at the Wessex Intensive Care Society Summer Meeting, Salisbury 2015.
Declaration of conflicting interests
The author(s) declared no potential conflicts of interest with respect to the research, authorship, and/or publication of this article.
Funding
The author(s) received no financial support for the research, authorship, and/or publication of this article.
Appendix 1: Participating trusts
References
Supplementary Material
Please find the following supplemental material available below.
For Open Access articles published under a Creative Commons License, all supplemental material carries the same license as the article it is associated with.
For non-Open Access articles published, all supplemental material carries a non-exclusive license, and permission requests for re-use of supplemental material or any part of supplemental material shall be sent directly to the copyright owner as specified in the copyright notice associated with the article.