
Abstract
Background
Transferring the theoretical aspect of continuous renal replacement therapy to the bedside and delivering a given “dose” can be difficult. In research, the “dose” of renal replacement therapy is given as effluent flow rate in ml kg−1 h−1. Unfortunately, most machines require other information when they are initiating therapy, including blood flow rate, pre-blood pump flow rate, dialysate flow rate, etc. This can lead to confusion, resulting in patients receiving inappropriate doses of renal replacement therapy. Our aim was to design an excel calculator which would personalise patient's treatment, deliver an effective, evidence-based dose of renal replacement therapy without large variations in practice and prolong filter life. Our calculator prescribes a haemodialfiltration dose of 25 ml kg−1 h−1 whilst limiting the filtration fraction to 15%.
Methods
We compared the episodes of renal replacement therapy received by a historical group of patients, by retrieving their data stored on the haemofiltration machines, to a group where the calculator was used. In the second group, the data were gathered prospectively.
Results
The median delivered dose reduced from 41.0 ml kg−1 h−1 to 26.8 ml kg−1 h−1 with reduced variability that was significantly closer to the aim of 25 ml kg−1.h−1 (p < 0.0001). The median treatment time increased from 8.5 h to 22.2 h (p = 0.00001).
Conclusion
Our calculator significantly reduces variation in prescriptions of continuous veno-venous haemodiafiltration and provides an evidence-based dose. It is easy to use and provides personal care for patients whilst optimizing continuous veno-venous haemodiafiltration delivery and treatment times.
Background
The practice of continuous renal replacement therapy (CRRT) has received much scrutiny recently. Issues such as the timing of initiation, 1 timing of termination,1,2 type of therapy 3 and dose of therapy3−5 have received considerable attention. The need to write a daily prescription for patients who require CRRT is considered a marker of good clinical practice 6 and there is nowgood evidence for an optimal dose of renal replacement therapy (RRT). 5 In reality, transcribing the theoretical aspects of CRRT to the bedside and delivering a given “dose” can be difficult. There is a higher turnover of junior medical staff and the complexity of the machinery increases the chances of error.
Our unit is a 24-bedded critical care providing Level 2 and 3 care. In 2011, we had admitted 1326 patients. RRT was received by 157 individuals, resulting in 768 RRT days. We deliver continuous veno-venous haemodiafiltration (CVVHDF) using the Prismaflex (Gambro Ltd) machine. An audit revealed a huge variation in treatment regimes and that many of our CVVHDF circuits prematurely failed, usually well before the maximum 72 h recommended by the manufacturer. Changes in prescription, in particular alterations in blood flow rates are a recognized cause.7,8 This was costly and represented a failure to deliver adequate renal support due to the prolonged filter downtimes, a phenomenon that has been also been recognized. 9 A number of problems were identified. Our protocol was to prescribe high blood flow rates on initiation, up to 300 ml min−1. If the circuit access pressure exceeded −100 mmHg or the return pressure exceeded +100 mmHg then the blood flow rate was reduced so as not to exceed these limits. We had observed that early circuit failure occurred when blood flow through the indwelling vascular catheter was suboptimal due to kinking, hypovolaemia or inadequate anticoagulation. Our protocol directed the nursing staff to achieve as high a blood flow rate as possible and compounded this problem.
The medical staff wished to see evidence-based dosing of RRT. The literature now points to optimal effluent flow rates of 25 ml kg−1 h−1 although higher rates were the norm prior to the publication of the RENAL study.4,5 However, in our practice, this was not translating into consistent prescribing of ultrafiltrate and dialysate flow rates or an appropriate blood flow rate to support these goals. Our aim was to design an excel calculator which would personalise patient’s treatment, deliver an effective, evidence-based dose of RRT without large variations in practice and prolong filter life.
Method
The Yorkshire and The Humber Leeds East ethics committee granted ethical approval after proportionate review (ref. 14/YH/1004). Patient consent was not required.
A calculator had been designed in 2005 by Ricci et al. as a way of retrospectively auditing the delivered dose of RRT within their unit. 10 This used calculations that had been validated in a previous study. 11 We developed this further. The first premise was that the “dose” of CVVHDF should be 25 ml kg−1 h−1. The second was that the ultrafiltrate, dialysate and blood flow rates were appropriately matched and that the filtration fraction did not exceed 15%. The third was a blood flow checker. It is unnecessary to run blood flows as high as 300 ml min−1 for most patients. However, if blood flow rates are set too low, then clotting within the circuit is likely to occur. We estimated that a blood flow rate of 160 ml min−1 should be adequate for most patients. The fluid solutions were standard lactate-based solutions. If the patient was hyperkalaemic, a potassium-free solution was used for the replacement and dialysate. We converted to potassium free bags when the serum potassium was >5.5 mmol.L−1. The clinician prescribed the hourly fluid loss. Anticoagulation was achieved using unfractionated heparin, except for those patients with significant thrombocytopenia who received epoprostenol. In some patients with coagulopathy, no anticoagulant was used. This was done at the discretion of the clinician.
We recruited all patients who had CVVHDF who were aged 18 and over. We excluded patients who required CVVHDF for less than 24 h and who required CVVHDF for fluid removal only. The historical controls were all patients receiving CVVHDF between January 2012 and June 2012 (six months). The data were collected from the inbuilt Prismaflex (Gambro) data card. Additional patient details were then taken from the hospital computer system (when available). Epidemiological data were collected for the patients: age, sex, patient weights, APACHE2 and ICNARC scores.
In the prospective calculator group, the research team was informed when the clinical team decided to start CVVHDF. The clinical team used the calculator to prescribe the CVVDHF. Data regarding the therapy session were collected from a clean electronic data card within the Prismaflex machine as well as a manual recording form completed by the nursing staff attending the patient.
The primary hypothesis was that the calculator would provide an average hourly CVVHDF dose of 25 ml kg−1 h−1 with a reduction in the variation of practice. The secondary endpoints were an increase in the treatment time of each filter set and a change in the total volume of effluent fluid used. The prospective study would also examine the type and the number of changes made to the prescribed regime. The clearance rates were calculated based on the time that the filter was running, i.e. not including downtime.
A formal hypothesis test of whether the prospective effluent rates were significantly closer to the optimal rate of 25 ml/kg/h was performed. Let X denote the historical effluent rates and Y denote the prospective effluent rates. We constructed new variables Z_1 = (X-25) 2 and Z_2 = (Y-25) 2 to measure, respectively, how close the historical and prospective effluent rates were to the optimum. Since the historical effluent rates were significantly non-normal, we performed a Monte Carlo test of the hypothesis that the mean of Z_1 was bigger than the mean of Z_2 using bootstrapping from both empirical distributions. We also used this same method to compute an appropriate sample size for our data based on simulated uniformly distributed effluent rates (taking the place of Y in the above) with lower bound 25 ml/kg/h and upper bound u for various values of u. Our chosen sample size of 30 filter episodes provides easily enough power to detect a significant difference and ensures that we accurately represent the intervention population. Normally distributed data are presented as mean (standard deviation), non-normal data as median (interquartile range). Differences in treatment times and total effluent are calculated with the Mann-Whitney U test.
Results
Demographic data after introduction of the calculator.
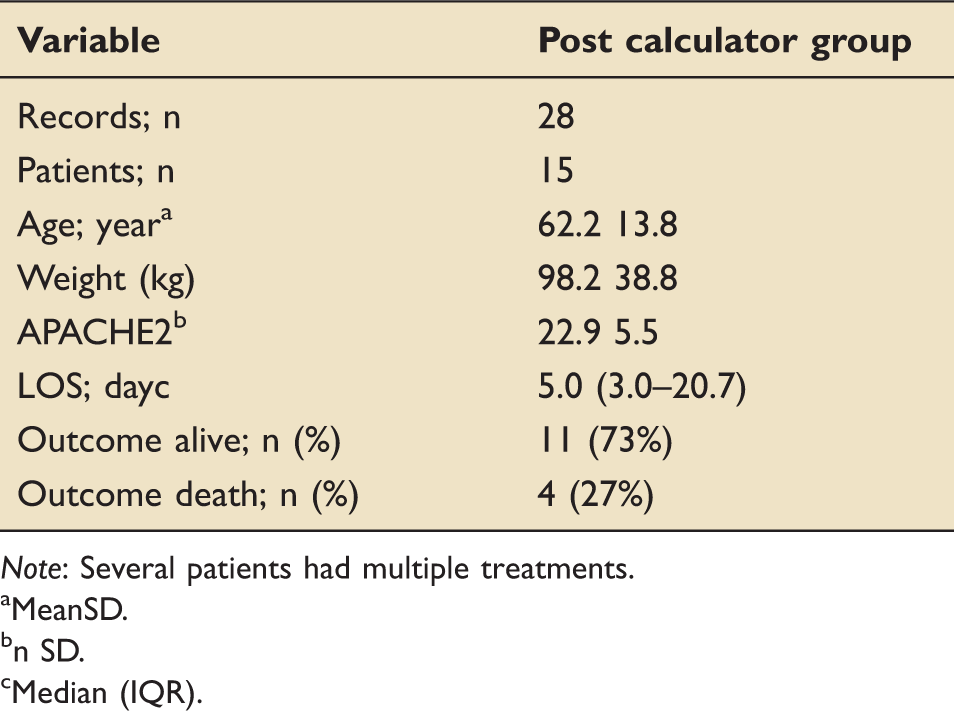
Note: Several patients had multiple treatments.
MeanSD.
n SD.
Median (IQR).
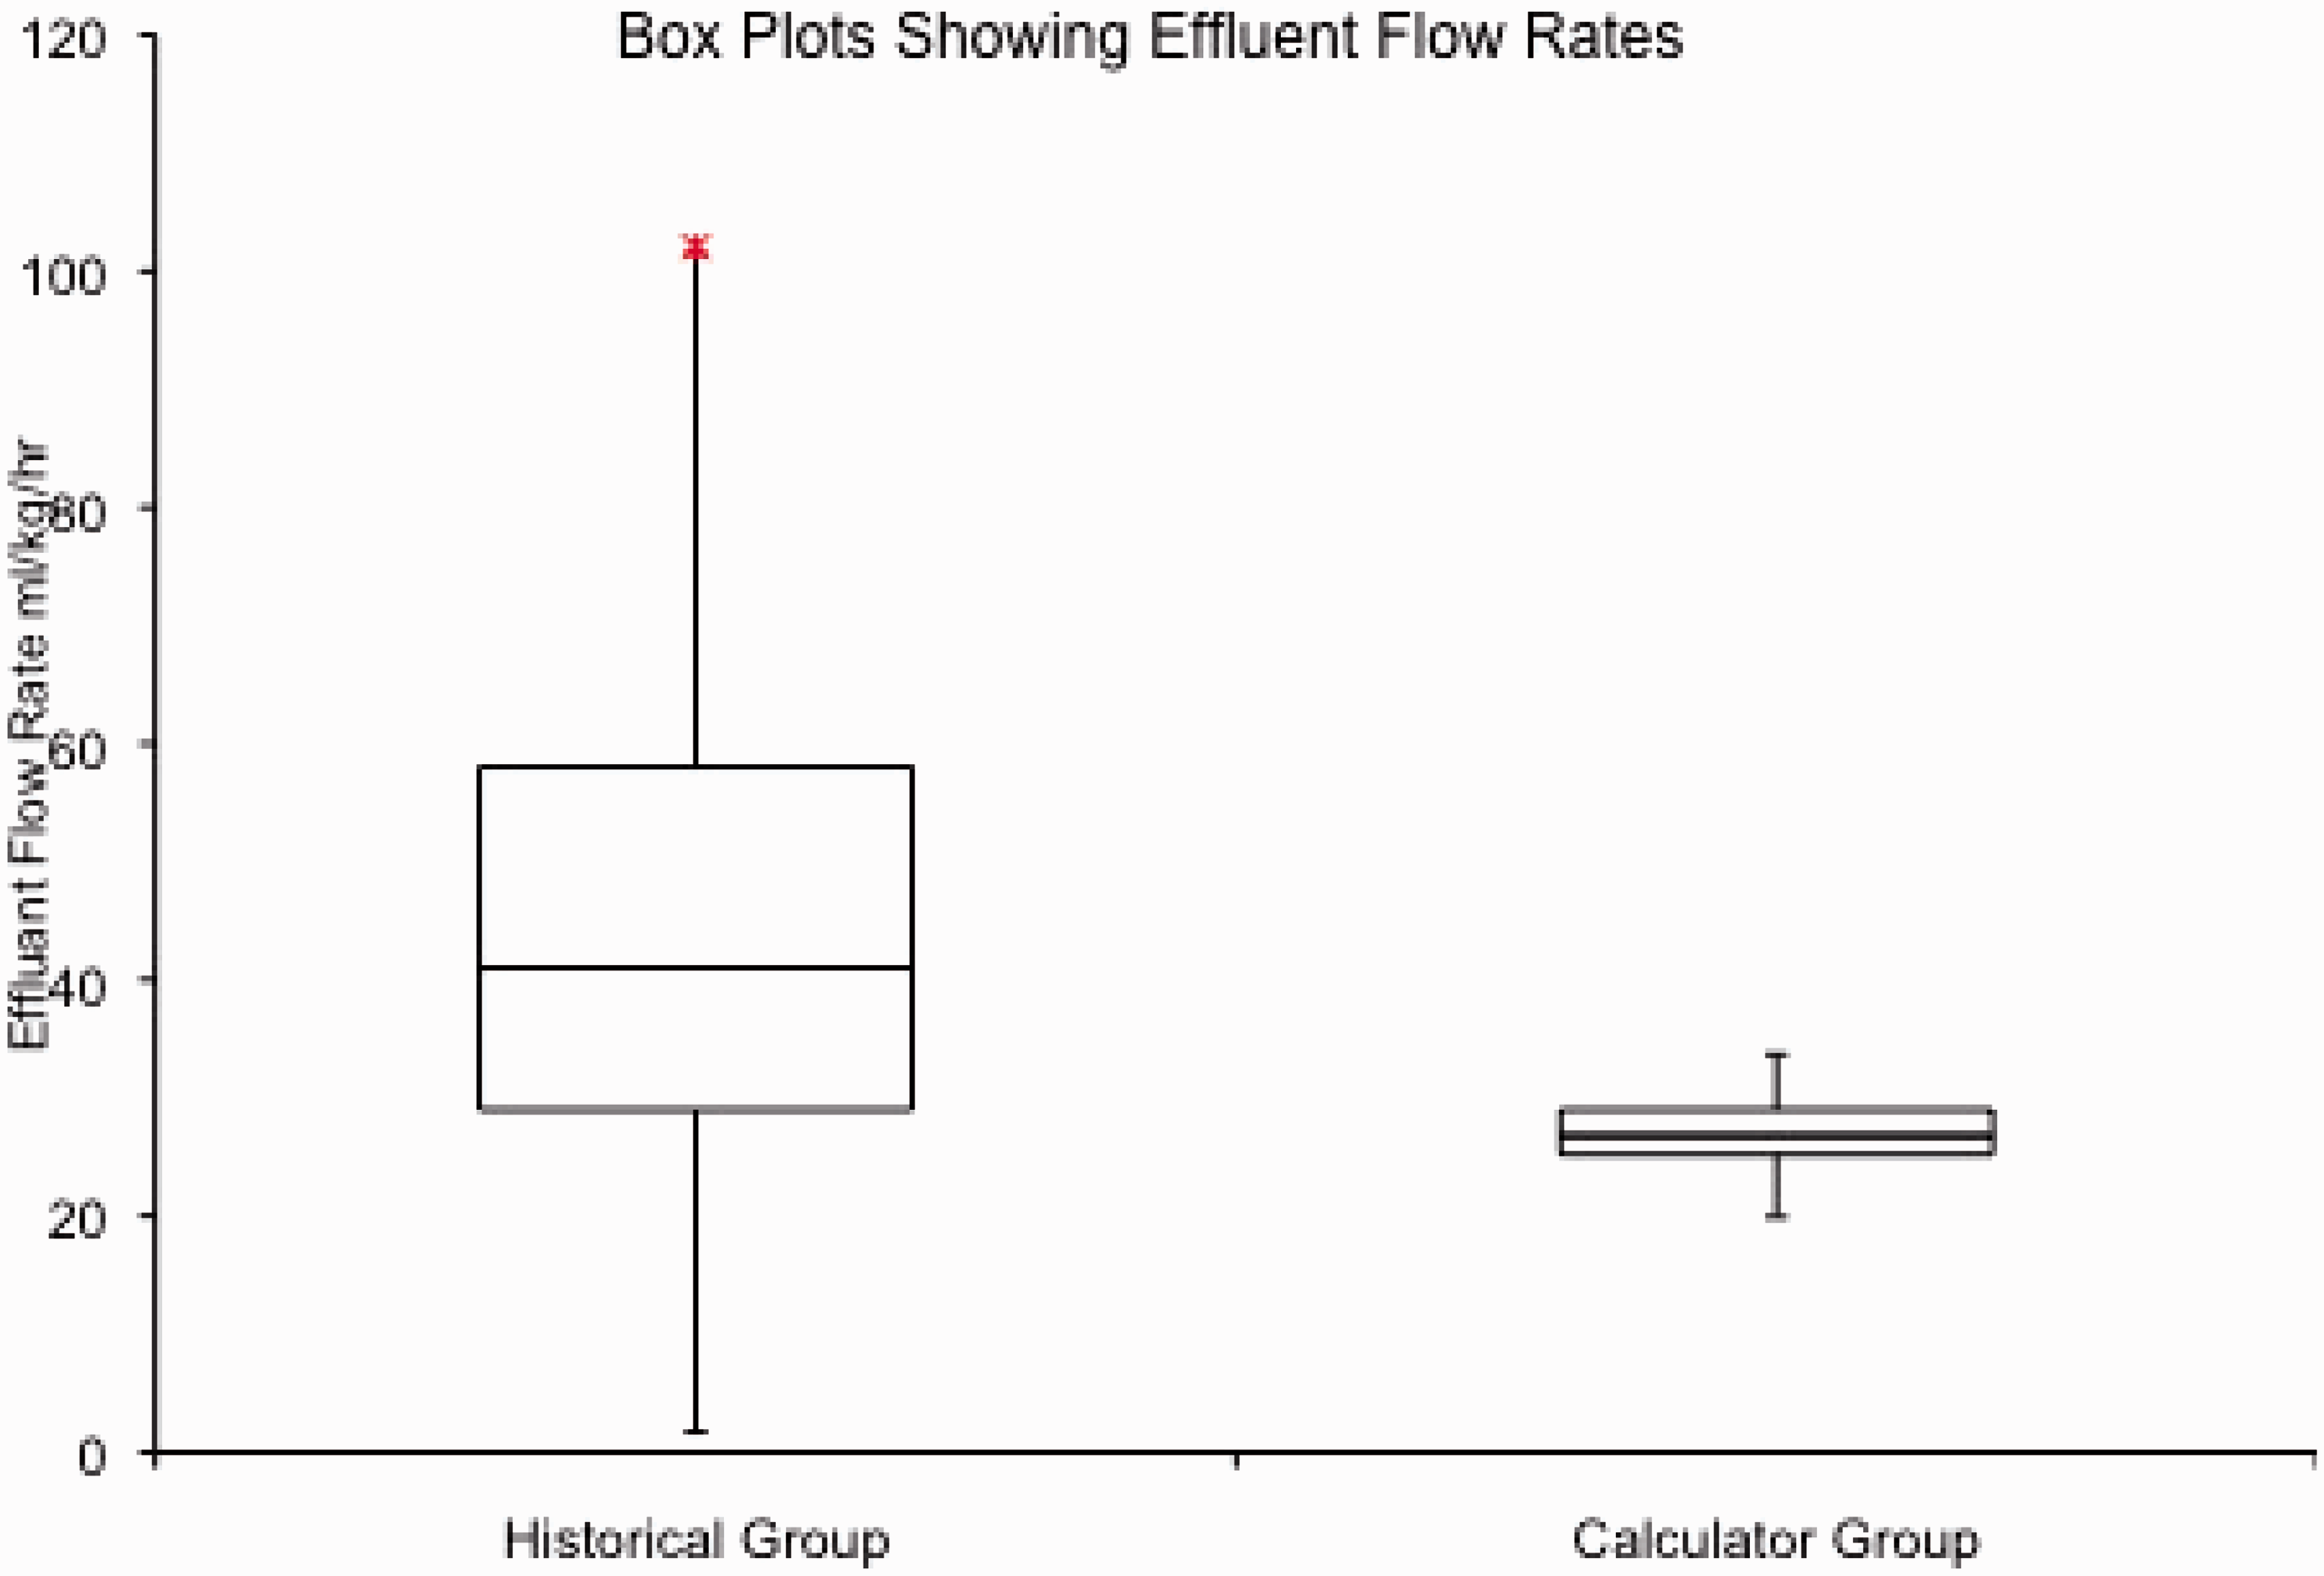
The patients in the calculator group had a lower median flow rate of 26.8 ml kg−1 h−1 (IQR 25.2–29.0) compared with the historical group that had a median flow rate of 41.0 ml kg−1 h−1 (IQR 29.0–89.0) (Table 2). The p-value of the Monte Carlo test described in the Method section was less than 1/10,000, showing the prospective effluent rates were significantly closer to the optimum of 25 ml/kg/h compared with the historical effluent rates. The effluent flow rates are compared in the boxplots in Figure 1.
Box plots show the median, interquartile range and outlying flow rates before and after the introduction of the calculator. The flow rates after the calculator was introduced were significantly closer to 25 ml kg−1 h−1 than those before the calculator with less variability (p < 0.0001). Flow rate and runtimes collected from the electronic data cards. Note: All data are median (IQR).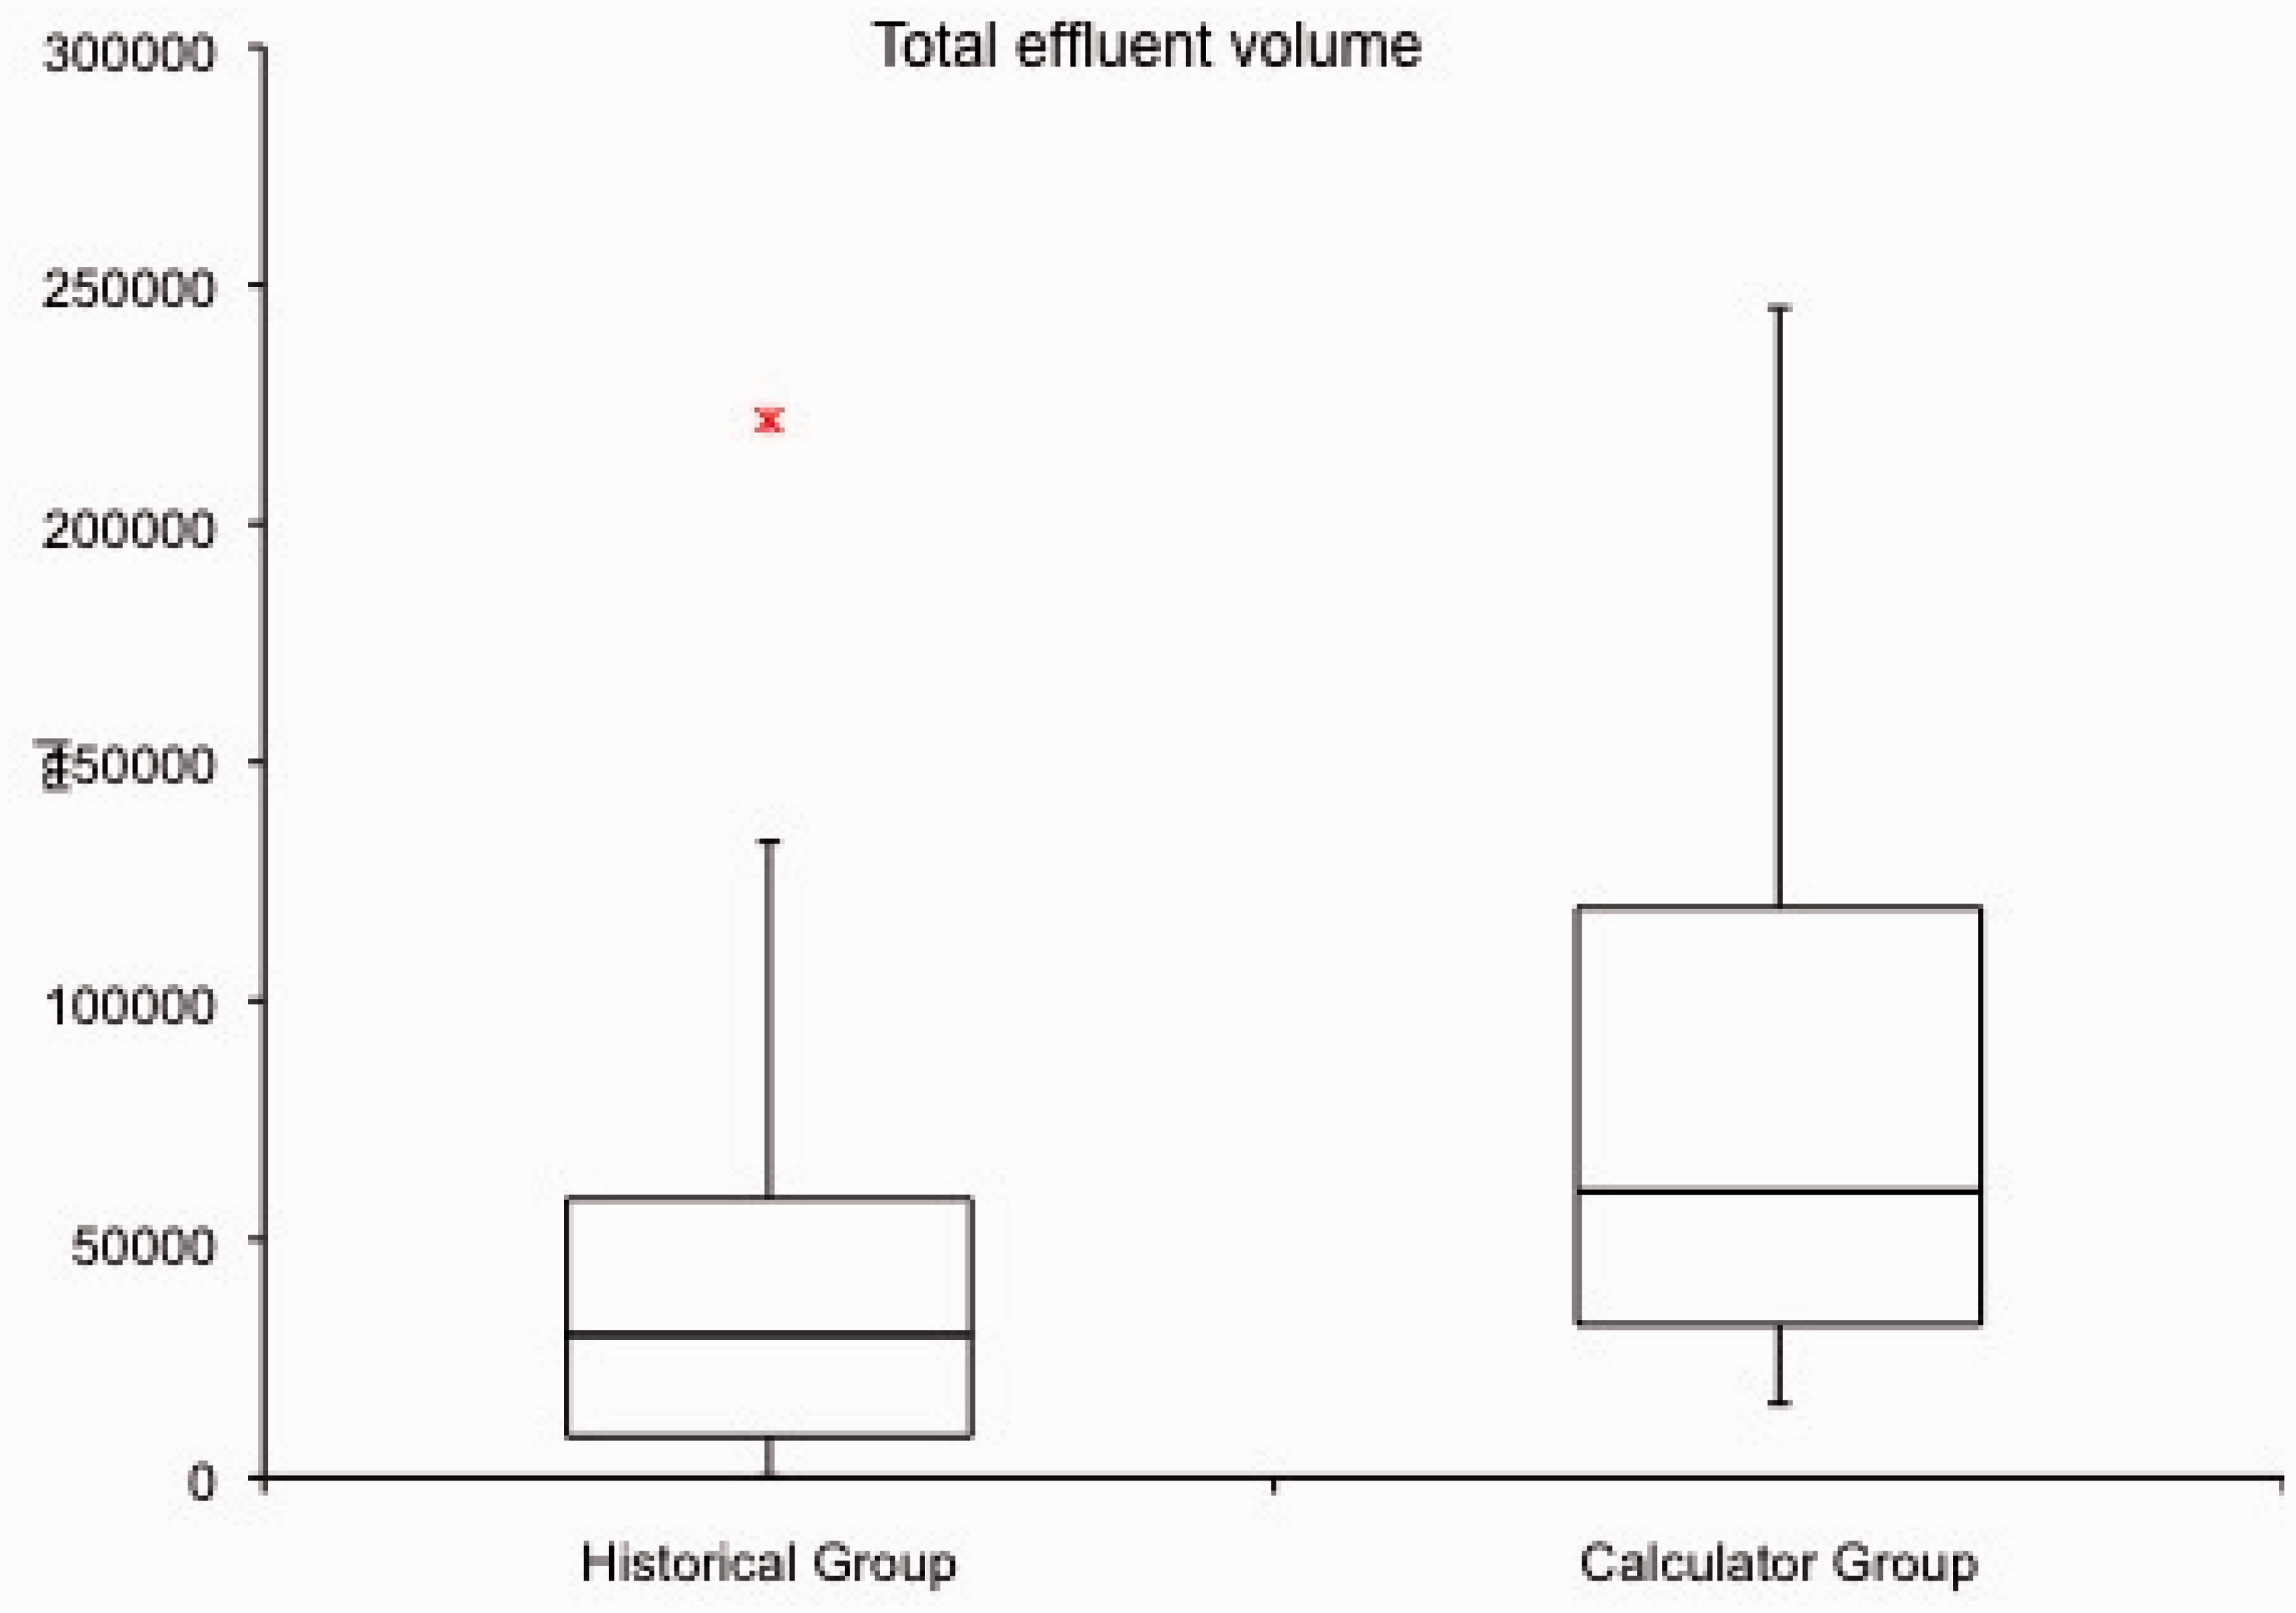
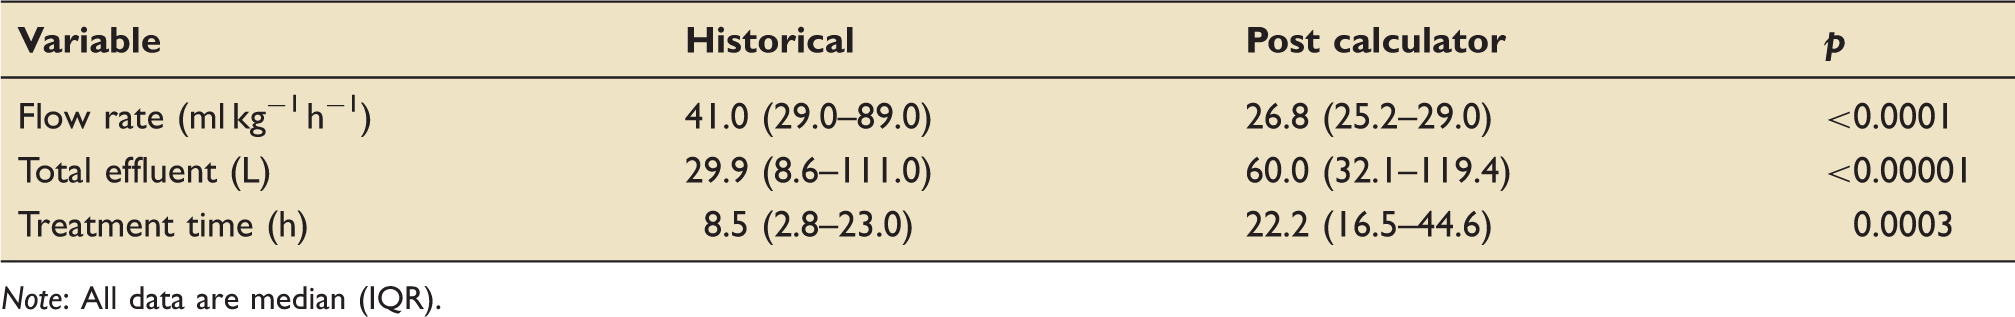
The treatment times were significantly longer in the calculator group. The median (IQR) was 22.2 h (16.5–44.6) as compared with 8.5 h (2.8–23.0). Mann-Whitney U test for non-parametric data showed p < 0.00001 (Figure 2). Before the calculator was introduced there were nine (12%) treatments that lasted less than 1 h compared with zero after the introduction of the calculator. As a result, the total effluent increased from 29.9 L (8.6–111.0) to 60.0 L (32.1–119.4), p = 0.003 (Figure 3). See Table 2.
Box plots show the median, interquartile range and outlying treatment times before and after the introduction of the calculator. The treatment times after the calculator was introduced were significantly longer than those before the calculator (p < 0.00001). Box plots show the median, interquartile range and outlying total effluent volumes before and after the introduction of the calculator. The total effluent volumes after the calculator was introduced were significantly larger than those before the calculator (p < 0.0003).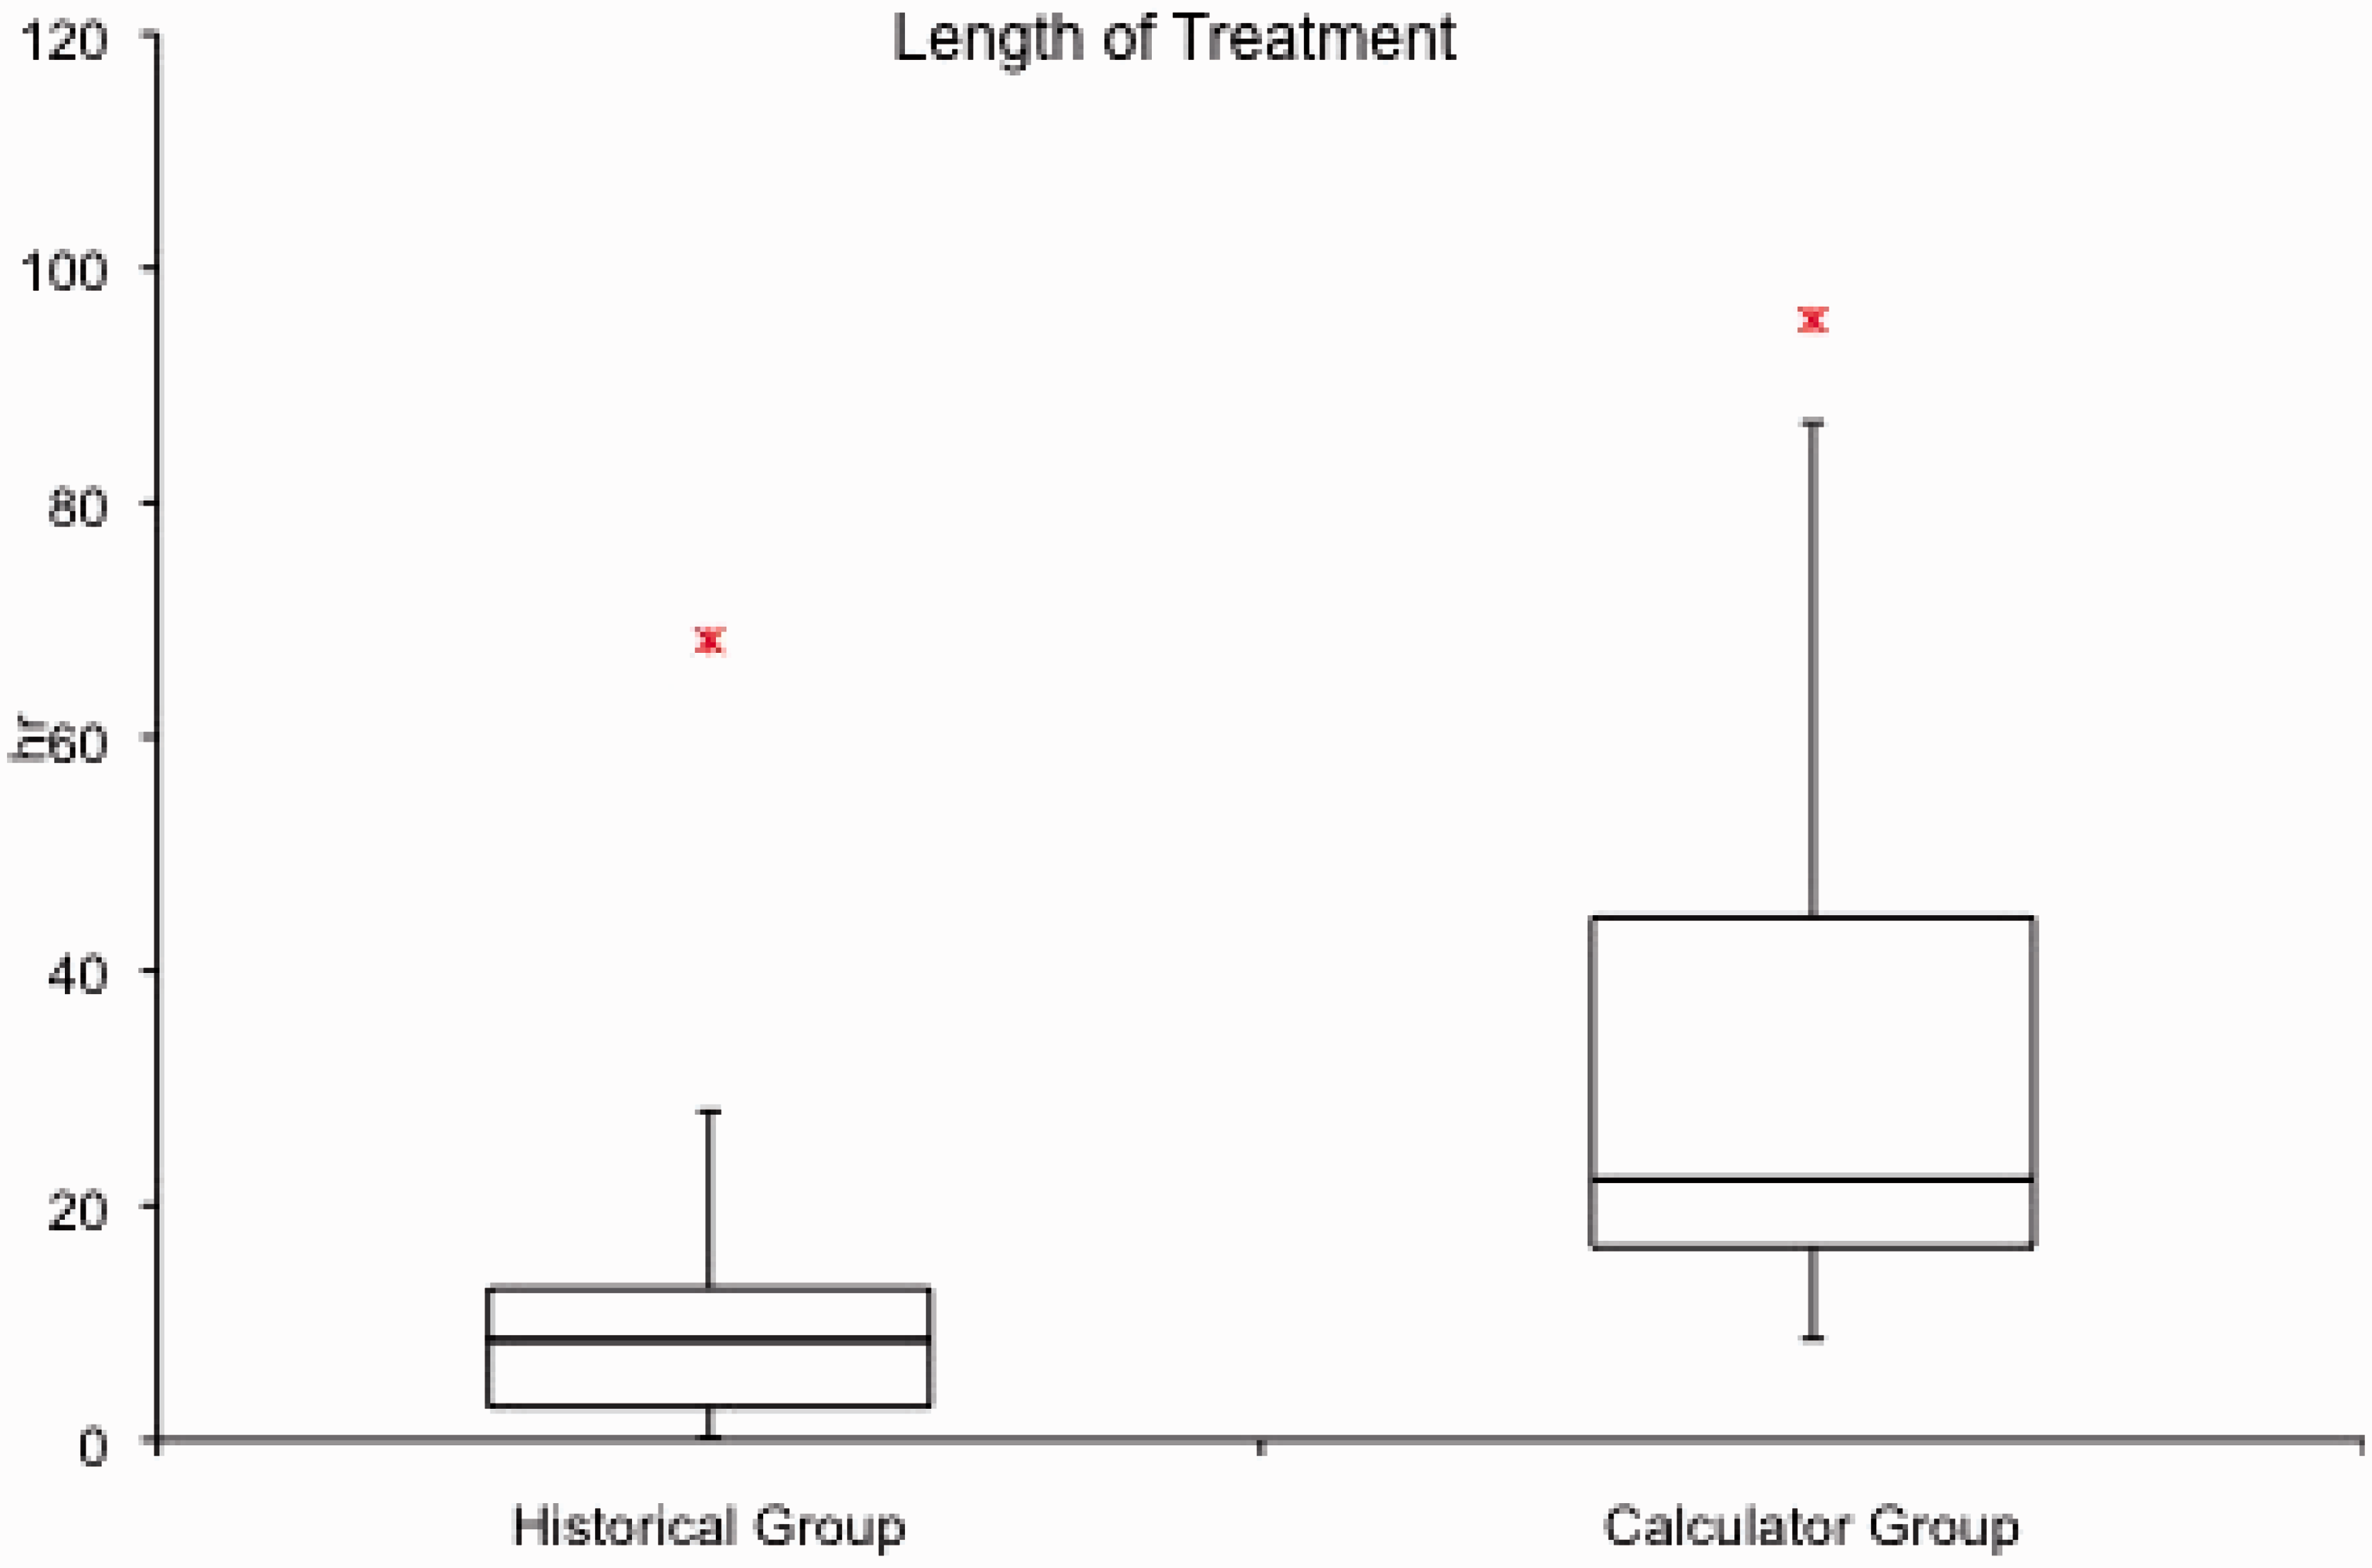
The number of treatments in the prospective group in which a treatment was changed after the calculator and how many changes occurred. Data presented as median (IQR).
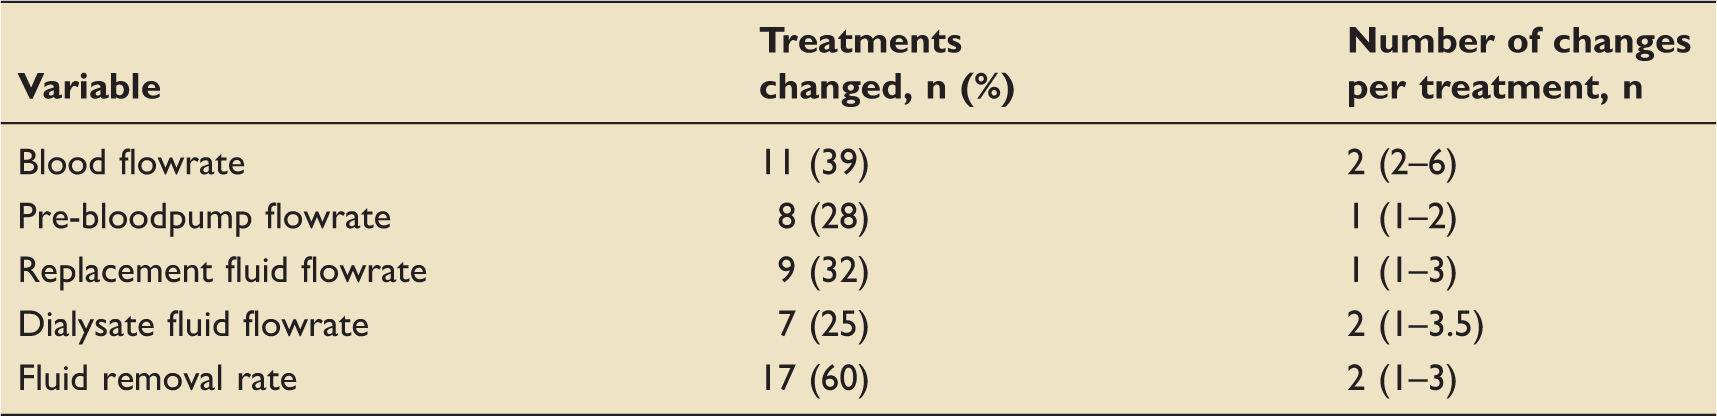
The median number of changes varied between one and two for each variable. The blood flow rate was changed the most number of times; median 2 (2–6), and the pre-bloodpump flow rate was changed the least number of times; median 1 (1–2).
Discussion
The study has proven its primary endpoint. The calculator achieved a median effluent flow rate of 26.8 ml kg−1 h−1 (25.2–29.0 ml kg−1 h−1). This is an absolute reduction of 14.2 ml kg−1 h−1 from 41.0 ml kg−1 h−1 and the reduction in the variance was highly significant (p < 0.0001). This proves that we have achieved our aim to introduce a spreadsheet calculator that is easy to use and successfully recreates flow rates that have been shown to deliver adequate clearance. 5 The reduction in variance of the prescriptions used indicates a more consistent approach to delivering CVVHDF as guided by previous evidence and has proved a valuable educational tool on our critical care. Removing human factors is important as critical care units in the UK are increasingly staffed by junior doctors without a background in intensive care, who rotate frequently. All new medical and nursing staff have training on the use of the calculator as part of their induction programme.
We attribute the significant increase in the treatment times from 8.5 hto 22.2 h (p = 0.0003) to ensure that the filtration fraction remained below 15%. Limiting fluid replacement according to weight and haematocrit prevents haemoconcentration within the filter and prolongs filter life. Further requirements for clearance are met with dialysate. Longer treatment times are more efficient at delivering CVVHDF as there are fewer periods spent without CVVHDF. The benefit to the patient increases as they receive greater clearance and lose less blood, whilst there is also a reduced cost of filter sets. Reducing the blood flow rate ensured that there were no filters that lasted less than 1 h and represents a major improvement in practice. It is noted that the median treatment time is 22.2 h which is still below the maximum time per filter of 72 h. However, treatments are stopped for other reasons such as being no longer required, or because the patient is transferred off the unit. The total effluent per treatment increased despite the marked reduction in the effluent flow rate. This reflects the increased treatment time and likely reflects an increase in the plasma clearance per 24 h.
Changes to the CVVHDF prescription occurred despite the use of the calculator. The most commonly changed (60% of treatments) was the hourly fluid removal rate. This was expected as this will change according to the clinical need. Changes to the replacement and dialysate rates would change the clearance. The fact that the median effluent rate is 26.8 ml kg−1 h−1 and not the intended 25 ml kg−1 h−1 indicates that these rates were increased, most likely guided by the patient’s biochemistry. Thirty-nine percent of the treatments saw an adjustment of the blood flow rate. This is more concerning as it directly effects the filtration fraction. It may explain why changes were made to the pre-blood pump dilution (28%) that may be required if the blood flow rate has been reduced too much. It is reassuring that whilst the median treatment time increased to 22.2 h the median number of changes for any of the flow rates was two.
Pisitkun initially designed and validated a calculator with the purpose of determining the clearance achieved by RRT across a number of modalities. Having been validated, the calculations were then used to test a number of different modalities of RRT including CVVHDF. 11 They used it to assess the adequacy of the clearance and filtration fraction for the flowrates that they had decided to use. They did not start with a desired dose and used it to predict the flow rates necessary to achieve it. Banks 12 described a similar calculator to ours, which he used in his unit. The main difference between our calculator and his was that he kept the dialysate and ultrafiltrate rate the same thereby producing a quadratic equation which gave an effluent flow rate to produce a desired clearance. Blood flow rates were variable and no attention was paid to filtration fraction. We took a different approach based on the audit of our previous practice. We fixed our blood flow rate and filtration fraction so as to determine replacement rates. Haemoconcentration is less likely to occur and so circuit longevity should be increased when the filtration fraction remains below 15%. Dialysate was added to provide a total effluent flow rate of 25 ml kg−1 h−1.
There are cost benefits in these improvements as well. Currently, the consumables for a filtration set cost £136 each, not including the replacement fluids. By extending the lifespan of a filtration set from 8.5 h to 22.2 h, we save on average £519 for every 24 h period that the patient received RRT. Our unit delivered 768 days of RRT in 2014 which equates to a potential saving of over £398,000.
There are problems with this study. It was not randomised or blinded. The calculator had been introduced into clinical practice and audit had been used to improve its usability. It was seen to bring about improvement and so it would have been unethical to withdraw it from practice in order to randomise. The educational elements were also changing practice. It was not possible to blind practice because of the nature of the intervention. Using historical controls introduces bias and it is possible that other improvements in practice occurred during that time. It is also possible that the CVVHDF was optimised in other ways because of the study conditions; line positions could have been optimised, treatments not “electively” stopped and more attention given to anticoagulation. There was no standard anticoagulation protocol in the study. In addition, the effluent flow rates were calculated over the time the filters were running. Therefore, it did not take into account any downtime. Given the nature of the calculator, it would be very easy to set it to deliver a higher effluent flow rate to attempt to compensate for this. Unfortunately, downtime is not a fixed variable and so we did not pre-emptively factor this into the calculations.
The study was a pragmatic one and alterations to the prescription were allowed. This requires further study. Improving our understanding of why changes are made will provide users with clearer instructions on how to change the prescription. Future additions to the calculator could include heparin or citrate infusions. If future randomised controlled trials mandate a change in CVVHDF flowrates, then the calculator equations can be changed and the change introduced immediately without further staff training. This is an additional improvement to change management. At present, the calculator uses Microsoft Excel. Therefore, in the event of an update, it would need to be physically updated on each computer. We are currently assessing the suitability of various web-based tools to solve this issue. Given the success of the calculator in our unit, there is a risk that staff become over reliant on it. We aim to prevent this happening by incorporating regular training on both the basic science and application of RRT into our internal medical education programme. This should enable senior medical staff to calculate an appropriate renal replacement regime from scratch in the event that the calculator is not available.
Conclusion
We have proven that our calculator significantly reduces variation in prescriptions of CVVHDF and provides an evidence-based dose. It is easy to use and provides personal care for patients whilst optimizing CVVHDF delivery and treatment times.
Footnotes
Authors’ contributions
DC and SM conceived the project, were involved in the study design, building the calculator, co-ordination of the project and drafting the manuscript. HW was involved in the historical group, gathering and analysing data and submission of the manuscript. RT was involved in the prospective patient group, gathering and analysing data. BT was involved in statistical analysis. All authors read and approved the final manuscript.
Declaration of conflicting interests
The authors declared no potential conflicts of interest with respect to the research, authorship, and/or publication of this article.
Funding
The authors received no financial support for the research, authorship, and/or publication of this article.