
Abstract
Within Industry 4.0, Digital Twins (DTs) have become essential services for monitoring, analysing, and optimising manufacturing systems. However, when multiple digital services – such as distinct DTs for machines and for production systems – operate within the same physical environment, a lack of integration can lead to fragmented decision-making and reduced overall system efficiency. This paper addresses this challenge by proposing a multi-level integration approach that connects machine-level and production system-level digital services, specifically the Digital Monitoring Service (DSM) and the Digital What-if Simulation Service (DWSS), to support joint decision-making. Using a proof-of-concept example focussed on integrating maintenance and production planning analyses, the paper demonstrates the main objectives of the proposed integration, namely (i) the event-driven multi-level integration – to determine how event-based local anomalies, such as increased machine downtime, can be propagated to assess their impact at production system-level; (ii) DWSS usage with a Simulated DSM (SDMS) – to determine how evaluations based on what-if scenario analyses that simulate also the monitoring service of the real system, that is, data and/or KPIs, enable consistent decision-making establishing coherent thresholds or control policies in production system with the overall production objectives. Furthermore, this paper discusses the practical benefits and challenges of implementing the proposed integration in real industrial environments, which can contribute in the long term to integrated decision-making among digital services in Cyber Physical Systems (CPSs).
Keywords
Introduction
Manufacturing systems are increasingly characterised by high levels of complexity, uncertainty, and operational risks, driven by the adoption of interconnected and data-intensive technologies. In this context, Digital Twins (DTs), within Cyber-Physical Systems (CPSs), have emerged as essential services for monitoring, analysis, and decision support 1 ; furthermore, their use is valued for their ability to process different field data, both online and offline, and for their role in supporting decision-making of a physical system. 2 Given the different roles, capabilities and functions they can offer, the authors will refer to them as digital services throughout the paper.
The reliability of digital services-supported decisions critically depends on how models, data, and assumptions are integrated across different system levels. Indeed, different professionals may rely on different models and simulation tools to analyse the same production system and support different decisions – even at different levels of detail for the same system – without ensuring mutual consistency between their decisions. 3 This fragmentation leads to the use of heterogeneous and often incompatible datasets, increasing the risk of conflicting or suboptimal actions. A practical example of information fragmentation in manufacturing is given by maintenance and production planning, considered as two of the most relevant activities in industrial operations. While production planning aims to optimise the allocation of jobs to machine(s) and timing of operations to meet customer demand at minimal cost and lead time, ensuring at the same time the required product quantity and quality, maintenance planning has the objective of scheduling interventions (e.g. repairs) on one or more machines of a production system to maximise equipment availability and lifespan, while minimising costs.4,5 These managerial responsi-bilities are usually delegated to distinct departments (i.e. production and maintenance departments), which traditionally operate independently, pursuing different performance indicator thresholds. 4 Isolated decisions from separated departments can often lead to suboptimal decisions, such as machine unavailability during expected production time or the delay of necessary maintenance in order to meet production targets. This disconnection increases the risk of breakdowns, unplanned downtime, and decreased overall operational performance. Therefore, integrating production planning and maintenance decisions can help minimise operational conflicts, improve resource utilisation, and support strategic goals such as reduced tardiness, minimised make span, and energy efficiency. 5
Industry4.0 (I4.0) technologies offer new opportunities to synchronise these digital services through real-time data and system-level visibility. 6 With the rise of IoT, big data, artificial intelligence, and cloud computing, manufacturing is shifting towards intelligent, connected, and automated environments. 7 These technologies significantly influence key manufacturing functions, such as production planning and control – supporting its goals (i.e. high schedule reliability, short lead times, high-capacity utilisation, and low inventory levels), 8 as well as maintenance planning supporting the goals of preserving machine performance and operational cost savings. 9
This paper focuses on researching the integration of different levels of analysis in manufacturing – hereafter referred to as “multi-level integration”– to support event-driven what-if scenario simulations. The objective is to jointly manage decision-making strategies that affect multiple levels of detail. With this aim, this paper focuses on integrating production planning and maintenance by (i) proposing the integration within different levels of detail – while consistently involving their monitoring system – in support of what-if scenario analyses for reliable decision-making and (ii) simulating a proof-of-concept example that, joining production planning and maintenance analyses, demonstrates the benefits of the approach considering an event-driven what-if scenario.
Related works
Digital twin for multi-level integration
According to Kritzinger et al., 10 depending on their level of interaction with the physical system, digital services may take the form of a Digital Model (DM), a Digital Shadow (DS), or a Digital Twin (DT). While DMs are typically manually updated and mainly used for modelling and offline analysis purposes, DSs should automatically reflect the changes in the physical system and should be adopted for monitoring. A DT should further extend these capabilities by enabling bidirectional interactions and, if necessary, act on the physical system when triggered by some threshold. Within complex manufacturing environments, Liu et al. 11 highlighted a range of activities that could be improved through the application of a DT, such as real-time monitoring, production control, process evaluation and optimisation, asset management and production planning. Nevertheless, the increasing adoption of DTs across different functions and levels introduces complexity: multiple DTs may coexist within the same CPS, or even for a Cyber-Physical Production System (CPPS), 12 each addressing different objectives, lifecycle phases, or levels of detail. To ensure coordinated and consistent decision-making, these services must be able to operate in an integrated and interoperable manner across the system.
Effectively managing this multiplicity of digital services requires structured mechanisms to connect data, models, and analyses within CPS(s). This role is commonly associated with the concept of the Digital Thread,13,14 which provides a continuous and traceable flow of information across the system lifecycle, enabling the consistent reuse of data and models among different analyses. In parallel, recent research has explored the use of ontologies and semantic models to formalise system knowledge and support the integration of heterogeneous representations. In this context, Cognitive Digital Twins leverage semantic relationships to link data, models, and reasoning mechanisms to improve system understanding, adaptability, and decision quality. 15
Despite these advances, several challenges remain: DT-based analyses often refer to different types of analysis, and they are often developed in isolation, each focused on specific problems or individual professional perspectives. 3 In practice, different professionals may adopt different interpretations of what constitutes a DT, how it is created, and how it should be used. As a result, they may rely on distinct models and simulation tools to analyse the same production system and support different decisions, without guarantees that these decisions are mutually consistent. Hence, integration and consistency are worth studying, since the role and impact of a digital service strongly depend on its type and degree of integration with the set of data, models, and simulations developed for the same system, which should coherently populate and interact. Especially within a CPS or a CPPS automated context, it is crucial to obtain such consistency to simulate and make decisions on a system coherently.
DT usage for production planning
The literature on DT uses for production planning highlights how decisions are strongly tied to machine and process parameters that define the operational capacity of the system. Martin et al. 16 proposed an agent-based simulation approach, as an alternative to classic simulation paradigms, for the simulation of a pharmaceutical process chain, and evaluated production planning in terms of machine capacity, batch size, and process variability, parameters that can affect performance on productivity and batch quality. Ralph et al. 17 used a Python-based, data-driven machine learning DT model trained on measured rolling mill data, enabling process-level prediction and decision support, emphasising setup times, capacity constraints, and machine availability as critical for scheduling decisions. Zhu and Ji 18 presented a DT-driven method for online quality control to realise real-time monitoring, evaluation, and optimisation of process parameters, predict product quality, generate optimised control plans, and introduce operation adjustment guidance through a two-way mapping physical-virtual production system. Song et al. 19 through their DT model that can accurately predict the loss-width curve at the head and tail of the slab in real-time, presented how these real-time machine parameters can be integrated to adjust production planning dynamically, therefore impacting performance related to process quality and production costs. Finally, Koulouris et al. 20 addressed production planning with a focus on synchronisation of operations; a recipe-based DT represented the production process as interconnected operations consuming resources, where production scheduling is considered by generating feasible schedules that respect real plant constraints; in this sense, the parameters considered include capacities, process variability and product-specific constraints.
DT usage for maintenance planning
Maintenance planning is widely recognised in literature, and DT applications have been used for condition monitoring and predictive analyses, highlighting reliability parameters as essential for machines optimal conditions. DTs have been proposed to model degradation dynamics and estimate Remaining Useful Life (RUL), enabling predictive maintenance and reducing unplanned downtimes. 21 In addition, Aivaliotis et al. 22 presented a comprehensive review of DT applications in maintenance, highlighting parameters such as Mean Time Between Failures (MTBF), Mean Time To Repair (MTTR), and failure rates, showing their link to performance indicators such as machine availability, Overall Equipment Effectiveness (OEE), and maintenance cost efficiency. Similarly, Savolainen and Urbani 23 considered maintenance DTs that integrate sensor data and learning models, highlighting degradation indicators and RUL as core parameters. Other parameters have been considered by D’Urso et al. 24 who presented a condition-based DT, using real-time indicators such as vibration, temperature and wear to schedule machine interventions.
Integrating production and maintenance planning
Independently of DT applications, in research, the integration of production planning and maintenance has long been recognised as crucial for effective operations management 25 which, as also highlighted by Fede et al., 4 it is assessed through comprehensive key performance indicators (KPIs) such as availability, OEE, throughput rate and MTTF.4,26 Indeed, performing maintenance tasks directly affects production-related KPIs, either by requiring production stoppages or by ensuring smooth operation of the manufacturing system or supporting high quality and safety performances. 4 Hamasha et al. 27 conducted a comprehensive literature review highlighting that several critical factors should be jointly considered when choosing a maintenance policy, covering factors such as: business scale, cost of machine failure, impact of machine failure on production scheduling, worker safety and the workplace environment, spare parts availability, and machine lifespan. Their analysis emphasised the complexity of maintenance decision-making and emphasised the importance of integrated approaches that account for interdependencies between technical and operational factors, especially when analysed across multiple system levels.
Given that this paper focuses on multi-level integration that links machine-level and production system-level models to support joint decision-making between maintenance and production planning, it is relevant to note that the need for integrating these two functions has been widely addressed in the literature, even in the absence of explicit DT implementations. Hnaien et al. 28 co-optimised preventive maintenance and lot-sizing on a single machine using a mixed-integer linear programming model to minimise production and maintenance costs. Alimian et al. 29 extended this to a multi-state system, applying robust optimisation to select between imperfect and perfect preventive maintenance based on demand fluctuations. Alves and Ravetti 23 integrated maintenance with lot-sizing and scheduling problems considering two parallel machines environment and a sequence of dependent setup times. The problem is solved hierarchically: first, the preventive maintenance problem is solved, then the lot-sizing problem is considered. Fakher et al. 30 proposed the integration of production, maintenance, and quality: experiments are performed to analyse the trade-offs between these three elements through the development of an integrated optimisation model where the objective is to maximise the expected profit. Nourelfath et al. 31 considered the integration of production, maintenance, and quality for an imperfect process in a multi-period multi-product, capacitated lot-sizing context, to respond to the objective of minimising the total cost, while satisfying the demand for all products. To this aim, the authors applied a double-layer Q-learning algorithm (DLQL) as a reinforcement learning-driven DT. Ouahabi et al. 5 addressed the joint flexible job shop scheduling and maintenance planning problem, considering new job insertions and multi-component machines with economic dependencies among components with the objective of minimising both the expected total tardiness and maintenance cost, considering opportunistic grouping of maintenance activities on components and breakdown costs associated with failure risk. Finally, Arena et al., 25 presented a supporting digital cockpit for production-and-maintenance-integrated scheduling where a DT is employed to predict the RUL of the system for each production schedule, in this way identifying the critical schedules whose execution could potentially lead to system failure. However, as highlighted by Fede et al., 4 the degree of integration in the work by Arena et al. is limited, since the tool is primarily designed to assist maintenance operators and considers the production schedule as a fixed input to the optimisation – that is, maintenance decisions are dependent on prior production planning choices and not executed simultaneously.
Research gap and objectives
Despite the increasing adoption of DTs in manufacturing, the authors identify the following critical gaps (G) that still limit their effective use for reliable and integrated decision-making.
Given the three gaps illustrated, a key open issue lies in the lack of integrated, model-driven approaches that consistently link monitoring-oriented and simulation-oriented DTs across multiple levels of detail, enabling event-driven what-if analyses that faithfully reflect system dynamics and support coherent, risk-aware decision-making. To address these gaps, this paper proposes a multi-level integration for what-if scenario analysis, a structured pipeline introduced with the long-term objective of enabling the integration between models used for decision-making, even at different levels of detail, that is, a machine-level DT that automatically triggers higher-level analyses, ensuring that local events and conditions are coherently reflected in production system-level decision-making. Furthermore, a proof-of-concept model is presented to illustrate the benefits of this integration with respect to the gaps, showing the potential behaviour of a real system when simulating event-driven what-if scenarios (i.e. enabling, in future work, the exploration of integrated control policies across levels of detail).
In detail, the proposed work is a research progress from an initial investigation by the authors of the current paper: the previous work demonstrated a proof-of-concept application on integrating what-if event-driven simulation for joint decisions, showing the benefits of integration of maintenance and production planning at the machine-level.
32
Building on this foundation, the work has the following objectives aligned with the identified gaps.
Proposal of multi-level integrated digital services for what-if scenario analyses
Building on the Cyber-Physical System (CPS)-based framework introduced by Cimino et al., 32 which is based on the harmonisation of DTs analyses through the lifecycle, 3 Figure 1 outlines the envisioned multi-level integration pipeline. To provide a clear context for proposing a multi-level integration in manufacturing, the authors introduce the levels – production system-level (i.e. production system-level) and machine-level (horizontal blocks in Figure 1, taken into account as the paper’s proof-of-concept deals with two levels of detail) – through the services used at those levels, noting that the services needed for the machine-level can also be applied at the component-level, that is, a machine component, i.e., such as a motor or a compressor:
–
–

Example (“Ex”:) of a pipeline for multi-level integration to support joint decisions: the example refers to an integration that monitors KPIs at both the machine- and production system-level for the establishment of actions on every single machine.
Overall, within the Digital Layer (vertical block in Figure 1), the authors identify a new level of abstraction that can help classify a DM/DS/DT according to the digital services offered. Two main service types should be considered among the digital services offered within a CPS, to support integrated decision-making across multiple system levels:
–
–

General pipeline of the services to be jointly managed in order to consistently define monitoring and/or control policies through the defined DWSS.
The reader can observe that, by definition, a DT must provide both the DMS and the DWSS services. However, many DT applications implement only one of these services, which often leads to confusion regarding the definition of a DT and its intended use. To address this issue, this paper proposes shifting the focus from the DT itself to the underlying digital services, clarifying what these services provide and how they should be connected. This perspective enables the creation of services – provided by DMs, DSs, or DTs – that support consistent decision-making, with the possibility of accounting for multiple levels of detail within the system.
The models used in the DWSS (as stated in the prior work of the authors 32 ) can be continuously updated throughout the design phase until the physical system is created. However, once the actual production system is well-defined and operative, a DMS used for real-time monitoring must be aligned to the SDSM model(s) used in the DWSS to ensure consistent decision-making with respect to the monitoring system. To reach this objective in a multi-level system, a pipeline is proposed in Figure 1, taking as an example the machine- and production system-level introduced: (i) a DMS of a production system should track the physical system via sensor data, updating KPIs and threshold values in real-time; a DWSS should initially be used – as per its definition – for designing the DMS. However, if the DMS identifies system states for which, i.e., some KPIs fall outside the initially considered ranges, the DWSS should then leverage online data to evaluate these previously unanticipated scenarios. (ii) At the machine level, each production asset (e.g. a machine, robot, or workstation) should also be paired with a DMS that monitors its status and can run localised what-if analyses with a DWSS on that single machine with its relative SDMS (e.g. to predict an impending failure or performance degradation). (iii) At the higher level, a production system-level DWSS should simulate the overall production flow, incorporating inputs from the machine-level DTs to reflect any dynamic change(s). (iv) Whenever the machine-level DMS observes a significant “change event” in the system, (v) if a policy is not already present to deal with that “change event,” it should trigger the integrated machine- and the production system-level DWSS to run simulations assessing the potential impact of machine(s)’ condition changes on production and maintenance performance. Finally, (vi) both the machine- and production system-level DWSS can identify the thresholds to be monitored at both machine and production system-level and in the evaluation of control policy to act on the overall system, eventually adding those monitoring and/or control activities within the DMS (vii). The proposed pipeline should be based on the fact that a DMS must be integrated at different levels, that is, a “change event” at point (iv) can be identified at the production system-level and propagated to the machine-level.
Following the schema of Figure 2, when a DMS – independently of the level of detail of Figure 1– is monitoring its real system, i.e., through a threshold data set depending on some policy
Indeed, the pipeline describes all the possible services that should be considered to maintain consistency; this evaluation depends on the specific services involved:
– In a CPS context, the system is continuously monitored, and decisions must often be made in response to unexpected, discrete events, such as a sudden machine failure or degradation. Most existing simulation-based studies rely on periodic or steady-state event assumptions, which are used to describe average system behaviour. When an event occurs, i.e., the alarm in Figure 2, the key challenge is not estimating average effects, but understanding how a specific event propagates across different levels of the system and impacts multiple, interdependent performance indicators over time.
– When using the DWSS to replicate the exact real system behaviour in order to define additional policies, as shown in Figure 2, a DMS must be consistently simulated within its DWSS through the SDMS. The latter should always be updated to replicate the DMS, and in turn, the DMS should be updated to include any additional data/KPIs monitored identified by the pipeline. This will enable a consistency check to update monitored data and/or KPIs.
– To enable multi-level integration and maintain consistency, the two pipelines should be regarded as complementary. The pipeline in Figure 2 focuses on intra-level consistency, illustrating how, before introducing new thresholds or control policies into a DMS, the corresponding DWSS should integrate historical data and, when necessary, additional simulated scenarios. For each analysis, even at different levels of detail, it could happen that a certain subset of the monitored data and/or KPIs may need to be shared with other analyses. Hence, before updating thresholds and control policies, a consistency check must be performed. This could occur between different analyses at the same level of detail or as part of a multi-level analysis, that is, as illustrated in the pipeline of Figure 1, which exemplifies specific multi-level decision-making. Only after such evaluation, and through an explicit consistency check between the SDMS and the real DMS, can new monitoring thresholds or control policies be safely introduced into the operational system. This clarifies how the proposed DWSS approach supports both vertical integration across multiple levels of detail and horizontal consistency between monitoring and simulation services, ensuring that what-if analyses contribute to coherent and reliable decision-making rather than to isolated or potentially conflicting actions.
Some important considerations, however, must highlight the challenges posed by the proposed pipeline. Implementing the pipeline depicted in Figure 1, while ensuring that every single policy is respected and integrated locally (Figure 2), is challenging. When multi-level integration is used to monitor one level, the integration must account for policies and KPI thresholds originating from other levels; for example, machine-level maintenance decisions may need to be adjusted based on production system KPIs. Secondly, even after overcoming this initial challenge, the pipeline currently enables the use of multiple models and their simulation through data exchange only in scenarios where changes are limited to parameter deviations. The challenge becomes significantly more complex when simulating scenarios triggered by unexpected events, as this requires capturing their propagation across different levels and understanding their overall impact on system behaviour. The same pipeline can be used to simulate event-driven what-if scenarios. However, this requires the explicit identification of relevant events and the consistent modelling of their propagation across levels – for instance, through the integration of discrete-event simulation mechanisms. This remains a challenging task, since some simulation environments – used by different professional figures (see gap G1 in Section “Research gap and objectives”) – are inherently unable to combine event-driven with continuous-time models. Overall, it becomes evident that simulating event-driven scenarios within this pipeline is highly challenging. To address this point, a proof-of-concept is presented using a single, already integrated model for simplicity (see Section “Proof-of-Concept Example”). This choice aligns with the objectives of the paper and the exploratory nature of the study. In particular, the work is conceived as a proof of concept aimed at illustrating the benefits of using a DWSS with its SDMS. Adopting an integrated model makes it possible to directly observe how monitoring logic, event detection, and what-if simulations can be coherently linked within the same modelling environment, without the additional complexity introduced by coupling external models. Moreover, although the proposed pipeline explicitly supports the integration of heterogeneous models through well-defined interfaces, the practical realisation of fully parallel, synchronised, and tightly coupled multi-model simulations remains strongly dependent on the adopted coupling mechanisms. In this context, the use of an already integrated model allows the analysis to focus on the conceptual aspects that the multi-level integration is intended to support – namely, the propagation of events, the interaction across levels of detail, and the consistency of decisions – rather than on tool-specific integration constraints.
Finally, being a proof-of-concept, the proposed work does not address the validation of the DMS/DWSS under standard operating conditions, nor the quantitative assessment of simulation quality. Such evaluations would require a real system and fall outside the scope of this study, whose objective is instead to illustrate the effects of multi-level, event-driven what-if analyses when production planning and maintenance decisions are integrated across different levels of detail, highlighting how event propagation and cross-level interactions influence system-wide decision-making.
Proof-of-concept example: Applying the DWSS following the pipeline
As anticipated, a proof-of-concept example is presented to illustrate the simulation of multi-level event-driven what-if scenario analysis, focussing on the integration of production planning and maintenance. The proof-of-concept example demonstrates the benefits of establishing a general communication channel (i.e. through a triggering mechanism), ensuring that a significant event in one domain (e.g. impending machine failure and thresholds related to the maintenance domain) immediately informs and adjusts another domain (i.e. the production schedule). The example provides a preliminary exploration before applying the authors’ proposal to more complex or real-world scenarios. The proof-of-concept illustrates the development of a simplified multi-level model that enables the integration of machine-level and production system-level analyses for what-if scenario simulation, corresponding to the DWSS detailed in Figure 1. In particular, the example shows how event-driven what-if scenarios can be developed to simulate the behaviour of a physical system realistically, while accounting for the evolution of the monitored data through the associated SDMS, which is embedded within the DWSS. Finally, some considerations are made regarding how to establish control policies for decision-making in production planning and maintenance, basing the decision not only on historical data but also on data from simulation.
The multi-level integrated model for the DWSS
As previously mentioned, the multi-level integration proposal aims to integrate a DWSS of the production system and a DWSS of individual machines for what-if analyses, ensuring consistency between them. As a starting point, the example shown herein will consider the machine-level model implemented in the paper by Cimino et al. 32 (see Figure 1, where each machine of the production system is represented through this machine-level model) with some improvements that will be detailed in the following. In short, the model was built to replicate the PT behaviour, taking into account historical data on service times and downtimes related to maintenance. This representation is extended within the current paper, by introducing again the so-called “unplanned events”– referred to as “change events” in the system in previous sections – that allow the evaluation of variations in production downtime due to unplanned breakdowns that lead to maintenance of the individual machine. The aim in the use case is to (i) evaluate the impact of those variations at machine-level on the overall production system, (ii) analyse the multi-level DWSS data evolution through time that should indicate some relation between the two layers, i.e., to unwanted behaviours, and (iii) evaluate the possible decisions that should be made based on a certain scenario(s) evolution. The three objectives listed above are connected to the objective O2 of the paper (Section “Research gap and objectives”), and they will all be shown using the proof-of-concept example that can tackle them, exploring the DWSS using a model that simulates the system alongside its monitoring system. This model type aims to show a (multi-level) simulation model that describes how and how often the DMS involved should monitor the real system, that is, deciding which parameter set to monitor, and help design the DMS for automatic decision-making.
Regarding the multi-level model, MATLAB/Simulink has been selected as the environment for the creation of the production system-level DWSS analyses, based on the previous successful experiences of the authors with the machine-level model, 32 which formed the basis of the current work. As a result, the whole model leverages a Discrete Event Systems (DEVS)-based simulation environment to model both the machine and production system levels. DEVS is indeed well-suited for this purpose due to its ability to represent complex behaviours and timed interactions in manufacturing systems: the machine-level DWSS has been modelled as a discrete-event component that simulates machine operations and degradation, while the production system-level DWSS is a higher-level model that simulates the overall production flow and incorporates the machine-level dynamic changes (e.g. machine downtime events) in its logic. This section presents the proof-of-concept example, showing the model development and the modelling modules added to the model modified by Cimino et al. 32 and the uses made as a DWSS.
The proof-of-concept example
The proposed proof-of-concept example considers a system composed of three machines, configured as a production system where the product passes through all machines in sequence to be manufactured. Each machine is characterised, as specified in Table 1, by its service time, mean time between failure (MTBF), and mean time to repair (MTTR), which in real production system should be derived from historical data. The authors made a simplistic assumption of deterministic service time, to simplify the visualisation of the results in Simulink, noting that the uncertainty that has been studied in this work is not derived from uncertain service times, but is the one caused by unplanned breakdowns and the different time to repair that may be achieved. Therefore, the demonstration of the proposed application approach is not limited by this assumption. The MTBF and MTTR related to the machines that compose the production system are represented as normal distributions with the parameters found in Table 1.
Historical operational data of the machines involved in the production system.

Comparing DWSS: Different what-if analysis simulations
The parameters in Table 1 present the historical production system behaviour, considering service time and breakdown. Moreover, having a model that connects the machine- and the production system-level allows relating the machine state evolution to the production system’s operation over time. In principle, it is possible to extract this type of data from historical records; nevertheless, having a simulation model that allows evaluation of the impact of each single machine’s dynamic behaviour on the production system could be useful to validate these relations and avoid misinterpretation from the historical data. To develop and simulate the entire model – the DWSS with its SDMS – the following steps have been applied.
Machine-level DWSS model creation
As stated above, the machine-level model from the work by Cimino et al. 32 has been used as a foundation to propose the multi-level model. The authors recall that the machine-level model for the DWSS allows modelling a machine with planned periodic breakdowns (both already present in the original MATLAB example at the basis of the modelling 33 ) and unplanned breakdowns, developed in the cited paper, as well as the DWSS of the simulated system (see Figure 3). Herein, the said DWSS of a machine has been updated to monitor not only some reliability parameters, such as status, MTBF and MTTR, but also the machine availability and the number of breakdowns for that machine.

Proof-of-concept example – model of the machine-level DWSS (left) with the embedded SDMS (right) to simulate the data and KPIs of the machine-level to be monitored in the real DMS.
Production system-level DWSS model creation
The production system-level model (Figure 4) has been developed using the machine-level models (updated as described above), introducing a DWSS with an embedded SDMS for the production system that monitors its KPIs relevant to the use case. For this example, the updated machine-level model has been applied only to Machine 2, while Machines 1 and 3 are still described using the previous model developed by Cimino et al., 32 finite buffers are modelled between consecutive machines, each with a capacity of 25 units. This choice was made to focus the analysis and to observe variations at the production system-level that depend exclusively on changes in Machine 2. This is another simplifying assumption that does not limit the results of the demonstration, since in future works, starting from the example proposed in this paper, additional scenarios could be simulated to explore decision-making processes that include prioritising machine interventions according to their impact on the overall production system performance, which has not yet been addressed.
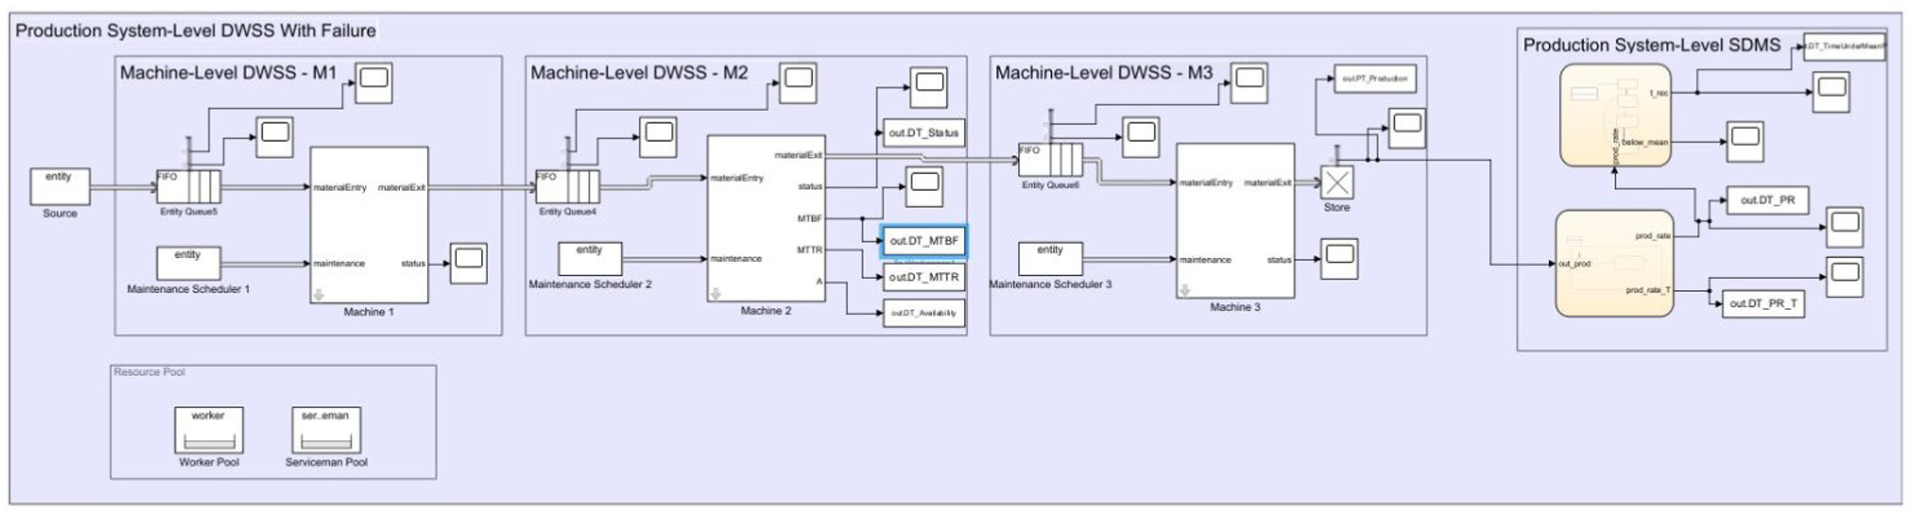
Proof-of-concept example – model of the production system-level DWSS (left) with the embedded SDMS (right) to simulate the data and KPIs of the production system to be monitored in the real DMS.
Focussing again on the production system-level model development, once the production system model was completed, the SDMS module for the production system-level has been implemented to monitor the simulated production system in terms of production rate, considering that the production rate can be globally estimated or can be derived by selecting a monitoring window of period T (that in the DWSS has been implemented with a fixed period but can be improved to become a moving window) along with an additional monitoring function that tracks the total time during which the production system operates below its baseline average production rate (computed using simulations based on historical data and set at 0.44 pcs/h). This analysis evaluates the system’s recovery time, that is, how long the production system-level takes to return to its nominal operating regime after breakdowns that cause a temporary decrease in the production rate.
The use of this specific model to represent each machine in the production system represents the first step towards integrating the two levels. This model allows the connexion between machine-level performance indicators and production planning at production system-level, creating a unified analysis where operational reliability and scheduling decisions are jointly considered. Considering these factors in production planning is essential to avoid schedule deviations, ensure workload balancing across machines, and support the definition of preventive maintenance strategies that minimise disruption to the production flow.
DWSS using planned and unplanned events
To explore different breakdown possibilities, the production system model – integrated with machine-level models – was simulated under different breakdown conditions. The initial configuration was based on the historical data reported in Table 1. To perform what-if analyses, considering the integrated multi-level DWSS, the authors considered the occurrence of unplanned events corresponding to machine breakdown events. It was assumed that, when unplanned event(s) occur(s), maintenance is performed immediately and the duration of maintenance interventions remains unchanged (this is an additional simplifying assumption that does not affect the validity of the demonstration). Considering a simulated period of 2000 h, the following what-if scenarios were simulated with the integrated DWSS. In these scenarios, unplanned breakdowns could occur on Machine 2 during the simulation; in particular, the example considers a 300 h time interval (in the simulation time range [400–700 h]) and evaluates three different scenarios in which, at the same time range, two, four or six unplanned breakdowns may occur. A total of four scenarios were simulated: the first, referred to as the baseline scenario, in which no breakdowns occur, where the system evolves according to the MTBF and MTTR average parameters, and three additional scenarios including two, four, and six unplanned breakdowns, respectively.
Using the developed multi-level model illustrated in Figure 4, the historical MTBF and MTTR values were modelled as periodic events (following good practices for DEVS system modelling) using the planned periodic breakdown generator shown in Figure 3. Unplanned breakdowns were simulated through random unplanned events occurring within the selected time interval, triggered by the unplanned breakdown generator, also shown in Figure 3. To statistically assess the variability introduced by the timing of breakdown events, a simulation campaign was conducted for each scenario, consisting of 20 independent runs. For each independent run of each scenario, a set of performance metrics was evaluated, representing the historical data obtained by simulating the system under specific conditions – for instance, the total number of parts produced at the end of the simulation period of a run. Moreover, after completing the simulations for each scenario, the time-averaged values of several continuously varying parameters were computed.
The results presented in Figure 5 illustrate the monitoring of KPIs derived from both machine- and production system- levels. In particular, MTBF and availability refer to Machine 2, and both indicators show a noticeable decrease as the number of unplanned breakdowns increases. This confirms the expected degradation in machine performance due to higher failure frequency. At the same time, the effect of these local breakdowns on the overall system can be observed through the global production rate of the system, which decreases by slightly less than 0.05% in the worst case, corresponding to an approximate 35% reduction in MTBF. Although the variation in the production rate appears limited, its impact accumulates over time. The total production metric highlights this cumulative effect: in the worst-case scenario, the total number of produced parts decreases by about 30 units over the simulation period, corresponding to an overall production loss of approximately 30%. The final metric considered is the time to recover, which monitors the duration required for the production system to return to its steady-state operation once the production rate drops below the average value (approximately 0.44 pcs/h). The results show that, as the number of unplanned breakdowns increases within a selected 300 h period, the recovery time becomes significantly longer – particularly when moving from four to six unplanned breakdowns: it can be observed that the boxplot does not represent all the simulation runs, since the production rate does not return to its mean value before the end of the simulation.
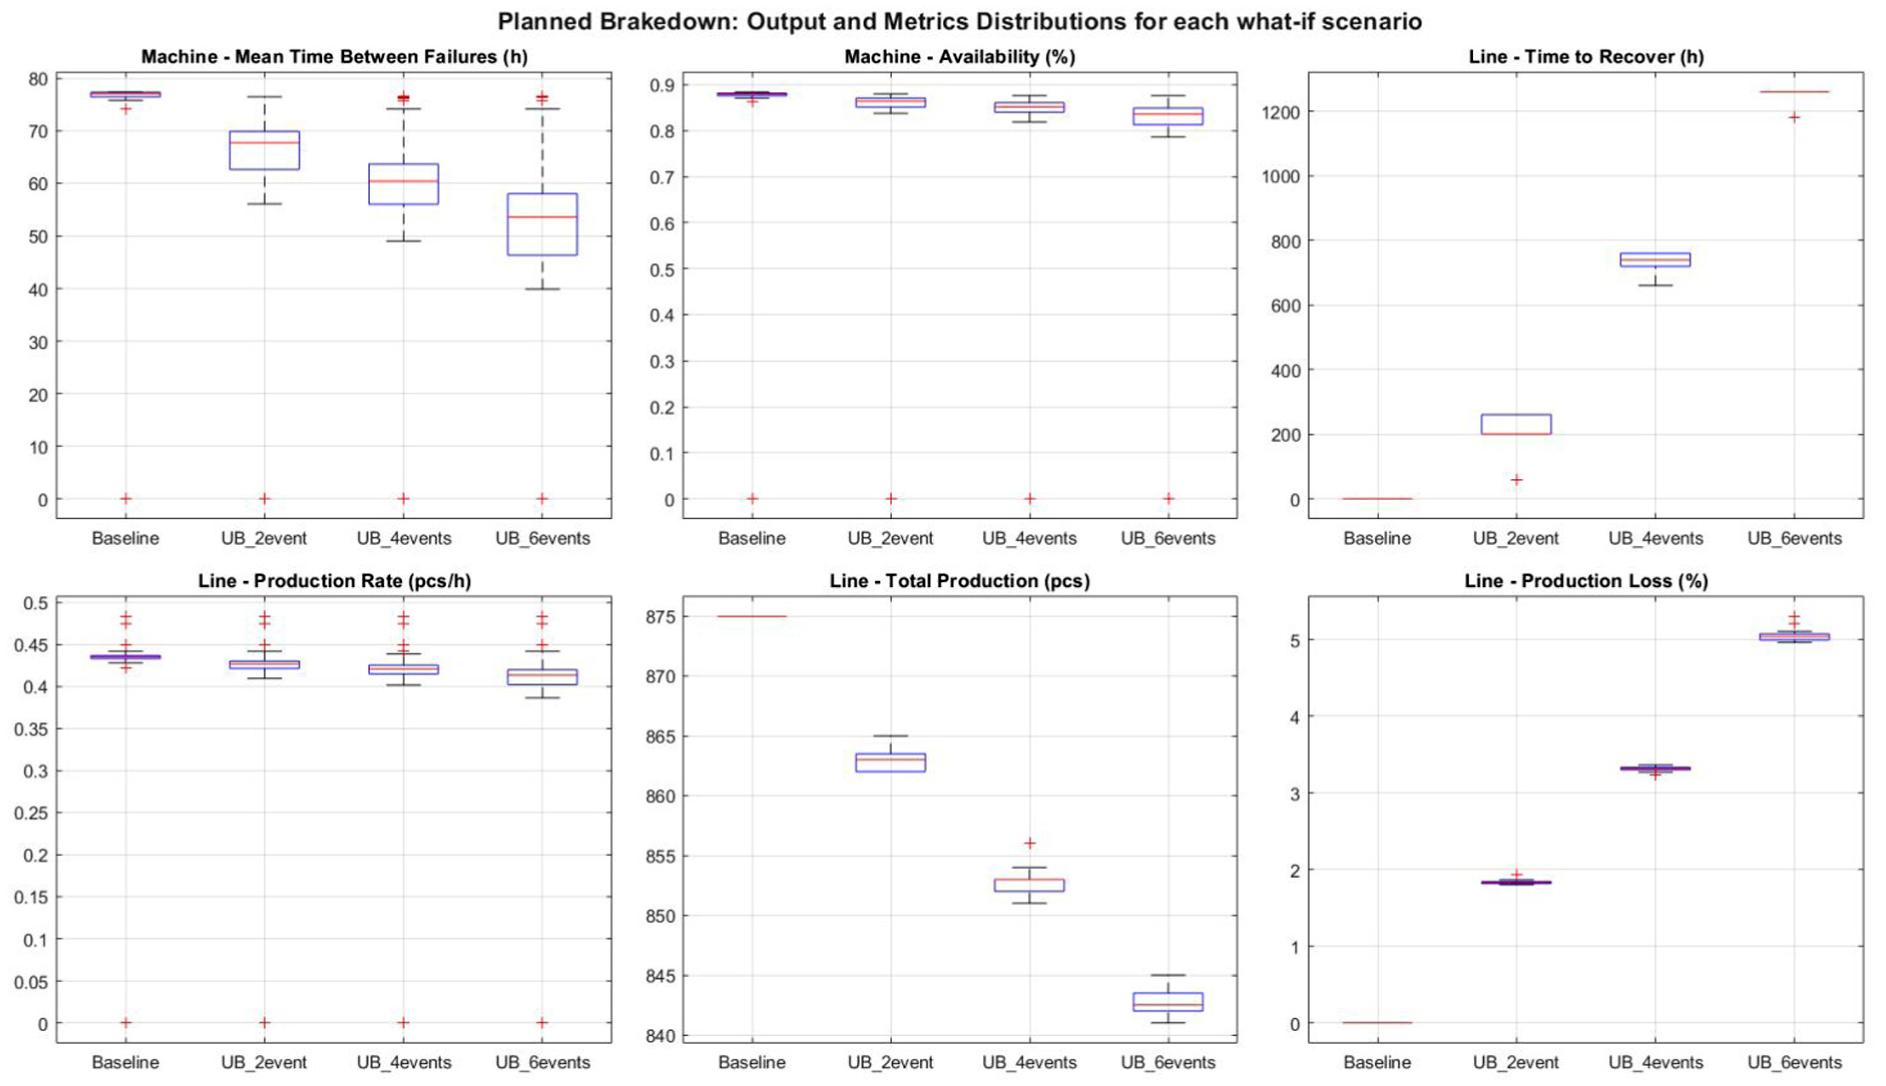
Proof-of-concept example – boxplot resulting from the simulated campaign of the integrated DWSS for different scenarios (the model used periodic planned events to replicate the historical MTBF and MTTR data and unplanned events to simulate the occurrence of unplanned breakdowns).
This described behaviour emphasises how localised machine-level degradations can significantly affect the performance of the entire production system, even when global KPIs appear only marginally affected in the short term. As this study serves as a proof-of-concept example, a quantitative assessment of the statistical significance is beyond its scope. The main objective of the authors is to demonstrate the applicability of the proposed pipeline and explore the connections between levels, which can enable integrated decision-making support according to specific production objectives (that can vary from one case to another). For instance, a reduction of 30 units in total output could be considered critical if the production strategy prioritises the minimisation of scrap rates and/or production time, particularly when the batch is required to be completed within a defined timeframe.
DWSS using only unplanned events
Since the proposed model aims to simulate the entire multi-level system as realistically as possible, the DWSS can be fully reproduced through the use of unplanned events, which represent all potential machine breakdowns (excluding any planned events). The model consistently adheres to the same conditions – namely, the presence of breakdowns spaced according to the historical MTBF (with a duration equal to MTTR) – while additional unplanned breakdowns are introduced separately. From a purely technical modelling and simulation perspective, the coexistence of both planned and unplanned events may lead to event overlaps (as illustrated in Figure 6, left). Conversely, when only unplanned events are considered (Figure 6, right), event management and model handling become more straightforward. This approach also aligns with the overall purpose of the simulation following the authors' proposal, which is to reproduce real-world conditions as accurately as possible.

Comparison of the results obtained using different methods to incorporate unplanned breakdowns into the simulation. Two simulation approaches for the scenario with six unplanned event in the time interval (400–700 h) h in the x axis: on the left the simulation modelling the MTBF with planned breakdowns (status = 2 on y axis), with unplanned breakdowns modelled with unplanned events (status = 3 on y axis); on the right the whole breakdowns simulated with unplanned events (status = 3 on y axis).
For the sake of completeness, Figure 7 presents the results from the same simulation campaign conducted using the model that incorporates both planned and unplanned events. Given that this variation is applied to a simple proof-of-concept example – and that the example itself is constrained by historical data (MTBF and MTTR) – the results remain consistent with the relationships among the parameters previously analysed, as expected. The only differences observed can therefore be attributed to the modelling approach employed (see also Figure 6). It is worth emphasising once again that the inclusion of variability introduced through unplanned events enables the simulation of realistic and scenario-specific situations –for instance, those derived from conditions observed during actual production –which can then be further explored through simulation to identify preventive or corrective policies, as suggested by the analysis shown in Figure 2.

Proof-of-concept example – boxplot resulting from the simulated campaign of the integrated DWSS for different scenarios (the model used only unplanned event to replicate the historical MTBF and MTTR data and the occurrence of unplanned breakdown).
DWSS usage: Setting threshold and simulating the controlled monitored system
Based on the results obtained from the what-if simulation, it can be inferred that, by consistently analysing – and preliminarily validating the model under known operating conditions – both the historical data of the system (e.g. data derived from a DSM of the real system) and the data generated by the what-if simulations, it becomes possible to define automatic control thresholds for the real system. Indeed, a DWSS can also be used to simulate a system within its control policy, always with the embedded SDMS to be executed and analysed, enabling the following:
– The use of unplanned events to create realistic simulation conditions, thus allowing the controlled system to be tested under unexpected circumstances and to observe how it reacts to variations.
– The evaluation of system performance evolution once the control actions have been executed.
Specifically, referring again to the example, Figures 5 and 7 (respectively mixed planned/unplanned the planned and unplanned modelling approaches) show that, as the number of unplanned breakdowns increases within a 300 h period, the time required to return to the average production rate becomes significantly longer – particularly between 4 and 6 additional breakdowns – with the percentage of lost production nearly doubling, considering the difference between those two scenarios. A possible control action to mitigate the occurrence of multiple consecutive breakdowns could involve starting a corrective-triggered preventive maintenance, that is, an intervention that not only repairs the immediate fault but also triggers a preventive maintenance scheduling, for inspecting potential root causes that may contribute to future failures. Although this type of maintenance may take longer than simple corrective maintenance, it could prevent repeated machine stoppages in the long term. It is important to emphasise that such decisions should not rely solely on data directly obtained from the simulation, but also on failure types and historical fault information, when available. Accordingly, the multi-level integration pipeline, the threshold-setting pipeline (as illustrated in Figures 1 and 2) could operate as follows: a dedicated DMS monitoring module could be implemented at the machine-level with a sliding monitoring window (starting from the one in Figure 3), taking into account the number of breakdowns that occurred within a given time interval. From the simulated campaign of DWSS, it is known that up to three unplanned breakdowns within a 300 h period does not cause severe performance degradation at the production system-level. Therefore, for the first two failures, corrective maintenance may be sufficient. However, when a third breakdown occurs, the system could trigger both corrective maintenance and the scheduling of a preventive maintenance task, for instance, at the end of the following shift. Once simulated, the monitored and controlled model can be used to assess the feasibility and effectiveness of this control policy, evaluating its robustness under varying operational conditions and determining whether the benefits of the proposed preventive maintenance strategy remain consistent across different scenarios. This approach lays the foundation for integrating data-driven decision-making into the multi-level integration (following the pipeline of Figure 2), enabling the definition and validation of adaptive control policies that enhance the overall resilience and efficiency of manufacturing systems.
Impacting factors for integrated decision-making simulations
The integrated what-if scenario analysis provided by the proof-of-concept example is intended to support more informed and holistic decision-making in maintenance and production planning. While the model itself does not include production planning decisions, it offers insights into how different future scenarios would work, enabling decision-makers to anticipate issues and evaluate trade-offs before committing to actions. In particular, linking machine-level and production system-level simulations means seeing system-wide effects, helping managers decide on interventions such as whether to perform preventive maintenance or keep running the machine to failure, depending on the overall production system performance. This integration avoids the fragmented decision-making that occurs when production and maintenance are planned separately and instead unifies these perspectives so that maintenance schedules and production plans can be jointly optimised. 32
In the previous authors’ contribution, 32 the feasibility of simulating what-if scenarios at machine-level has been demonstrated. The current work extends that initial concept realised at machine level into a multi-level approach, integrating both machine- and production system-level decision layers, considering that each digital service at each level can offer both monitoring and/or what-if-scenario simulation services through the herein defined DMS and DWSS with its embedded SDMS. This advancement allows not only the evaluation of local maintenance strategies but also their propagation across levels, ultimately supporting the definition of cross-level operational thresholds (e.g. maximum acceptable failure rate or downtime) that can trigger specific maintenance strategies.
In an integrated maintenance-production planning scenario, any future decision should depend on a combination of both technical and operational factors, as also highlighted by Hamasha et al. 27 and presented in Section “DT usage for maintenance planning”. The proof-of-concept example provided in this paper confirms that:
Metrics such as MTBF or failure rate highly influence maintenance strategy selection. By examining failure data (e.g. how often breakdowns occur), maintenance engineers can decide whether adopting a preventive approach is more convenient than a corrective approaches. In the present study, the simulated scenario that increases the breakdown frequency (i.e. reduced MTBF) showed a clear negative impact on online availability, suggesting that preventive actions could be justified beyond a certain threshold.
Production rate and scheduling performance are also impacted by maintenance timing. Although explicit production planning decisions were not modelled, the results show that delaying maintenance after multiple breakdowns causes significant recovery delays and cumulative production losses. Therefore, simulation-based what-if analyses (i.e. through DWSS) can help identify when maintenance should be scheduled to minimise overall disruption.
It is clear how decisions in a real-world environment depend on the type of work environment and type of machine considered; therefore, they cannot be generalised to one use case. However, while these results are derived from a simplified proof-of-concept, they demonstrate the potential of the proposed integrated model to explore multiple decision scenarios and to support the design of coordinated maintenance-production strategies in more complex, real-world applications.
Discussion
Key insights for multi-level event-driven what-if simulations
The proposed work provides an overview of how an integrated, multi-level event-driven approach can support joint decision-making between maintenance and production planning, bridging the gap between traditionally siloed functions. The presented proof-of-concept demonstrated that through integrated machine- and production system-level digital services, one can capture production and maintenance variations in an interdependent manner, identify optimal control thresholds, and even compare different maintenance strategies (e.g. corrective vs preventive) in a virtual setting.
The proof-of-concept example shown particularly highlights the value of combining different analyses at varying levels of detail, and the potential for data exchange between levels. Furthermore, it also shows that simple data exchange is insufficient when dealing with what-if analyses triggered by unpredictable events that propagate through the system. The example addresses this limitation by illustrating how system dynamics and cross-level effects (i.e. at different levels of analysis) require event-driven model interactions. In this context, the work advances current integration approaches, which typically rely on exchanging static data, by focussing instead on the need to simulate causality and temporal evolution across levels within CPSs.
Generalising, this capability ultimately supports decision-makers in balancing production objectives with maintenance constraints, thereby enhancing both production efficiency and equipment health management. Based on what has been presented in the previous sections, relevant insights can be drawn.
Enhanced decision consistency: the presented pipeline (Figure 2), which integrates machine-level and production system-level digital services through a triggering mechanism, allows understanding how a considered system can propagate local anomalies (at machine-level) to higher-level decision-making models. This linkage ensures that production-level KPIs (e.g. production rate) are continuously aligned with machine-level indicators (e.g. MTBF, MTTR).
Multi-level consistency: a multi-level approach allows an integrated view, capturing impacting behaviours that may not be visible when each level is analysed separately. Indeed, in simulation, while on one hand the machine-level SDMS monitors machine conditions and the DWSS simulates their conditions (including failure events and recovery events), on the other hand, the production system-level SDMS can evaluate the impact on the overall system KPIs.
What-if simulations benefits: the introduction of the DWSS provides a controlled environment for exploring how both maintenance and production decisions impact the overall system behaviour. By considering both planned and unplanned breakdowns, the model allowed assessing conditions under which a system’s performance significantly deteriorates, and accordingly how it could react to improve the overall system productivity. The model aimed at highlighting how what-if analyses are relevant not only to forecast a system’s performance, but also to establish operational thresholds and integrated control policies. Indeed, decision-makers can vary parameters such as machine reliability (e.g. MTBF), production demand, or permitted downtime in the simulations to explore how the system would perform under those conditions. This flexibility can enable the exploration of multiple what-if scenarios and help in making the appropriate decision for different future situations.
Towards integrated digital services for CPS(s) design
The advantages of using what-if analyses for the creation of realistic simulation scenarios have been highlighted, showing how the selection of different parameters according to specific objectives at a given level of detail can completely modify the resulting simulation scenarios and, consequently, the decisions taken on the real system.
Compared with existing multi-level integration frameworks that allow for DT to act on the system,34,35 the proposed pipeline developed in this study – enhanced by the inclusion of digital services (i.e. DMS and DWSS) at each controlled level – can enable, in future developments, the simulation of various monitoring configurations. These include the possibility of simulating different monitoring strategies, for instance by adopting distinct metrics or identical metrics with varying periods time or monitoring policies, as well as simulating the behaviour of the monitored and controlled system through integrated digital services. This allows for the analysis of how, and after how long, the monitored metrics return to their desired operational state. Furthermore, a deeper level of detail can be achieved by simulating the physical behaviour of the machine system. The strategy developed for the machine level in the presented example is limited to the integration of machine models based on MTBF and MTTR. However, this level of detail can be further expanded by simulating the machines under their specific operating conditions, thereby enabling the analysis of the physical implications of certain faults on the system and their consideration within the decision-making process. 36 Moreover, MTBF and MTTR could themselves be computed as statistical measures derived from these physics-based simulations. 37 This highlights how the proposed pipeline is not limited to the considered machine- and production system-level structure, but can also be extended to incorporate lower levels of detail, such as component-level monitoring within machines. This would allow the DWSS and SDMD to track also the health status and performance of individual components, enhancing the granularity and accuracy of multi-level event-driven what-if analyses.
The multi-level event-driven integration proposal leads to an expansion of the role of simulation in design – both for the development of a digital service at a single level of detail and for the coordinated design of multiple digital services to verify their integration. Consequently, it contributes to the design of CPSs for complex systems, which must be capable of managing the integration among different system levels, monitoring them, generating simulations or estimations of the system outputs, and ultimately supporting decision-making processes across these interconnected levels.38,39
Challenges in implementing multi-level integrated digital systems in a real industrial scenario
Despite its promise, the proposed multi-level event-driven integration pipeline has certain challenges and practical considerations that should be acknowledged, presented as follows:
Modelling simplification: The current modelling assumptions introduce simplifications that limit fidelity. The machine-level digital services are based on KPI measures – taking as an example the assumptions on MTBF and MTTR considered in the proof-of-concept example presented in this paper – rather than data-driven models of failure behaviour coming from a real system. This means certain failure modes or dynamic effects are not captured, potentially affecting the accuracy of predictions. Similarly, the proof-of-concept case was relatively simple (i.e. single-line, single-product scenario) and results might not directly be generalised to more complex production environments with multiple product types or production interdependencies. These simplifications imply that additional development – for example, incorporating more detailed machine specifications – would be needed before applying the multi-level integrated digital services to an industrial setting.
Scalability challenges: If wanting to scale up to larger and more complex systems, scalability could be challenging. These systems can be characterised by high machine numbers, which complicate the production system-level; therefore, multi-level simulations will require substantial computing power and efficient algorithms to overcome long simulation runtimes40; furthermore, it will require integration among different analyses both in the same simulation environments (Matlab, e.g. Modelica 41 ) or in separate ones. 3 This issue can hinder real-time or large-scale deployment of the approach. Furthermore, implementing a DT across different machines and production systems would require installing numerous sensors and handling large volumes of data, which increases costs and complexity. 42
Data integration: Integration remains a challenge since it requires data reliability, interoperability, and timeliness. As previously highlighted, DT-based analyses are often developed in isolation by different professionals, each relying on specific models and simulation tools, which usually results in fragmented analyses. Establishing a seamless bidirectional connection requires a robust IT infrastructure and standards that are often lacking 42 ; if high-quality and real-time data feeding the DT is lacking, what-if analyses might not reflect the true state of the system, limiting the use of multi-level integrated digital services to offline analyses based on the operator’s engineering analysis capabilities, which could still be one of the uses of the proposed pipeline.
Implementation complexity and system interoperability: Many industrial environments rely on existing modelling systems, that is, production planning or maintenance management tools, that were not originally designed to work jointly with other digital services, that is, especially if they are simulated in different environments; therefore, integrating the proposed multi-level digital services could be even more challenging. Furthermore, the absence of widely accepted standards for DTs creation in manufacturing increases the complexity of each implementation, reducing reusability and raising deployment costs. 43 Indeed, implementing digital services that need to be connected with the real systems across machines and production systems requires sensor installations, connectivity upgrades, simulation licences, and staff training, all of which can represent a high investment.
Despite these challenges, from an industrial perspective, an integrated multi-level system offers promising benefits but can also face implementation challenges. On the impact side, closer coordination between production and maintenance enabled by digital services can improve overall efficiency and consistency of operations. For example, remaining in the context of the proof-of-concept example presented in this paper, literature has shown that jointly optimising production schedules and maintenance plans can significantly reduce long-term operational costs in manufacturing systems. 44 By avoiding conflicting decisions (e.g. a machine being shut down for maintenance just when production demand increases), the proposed integrated approach can enhance throughput and machine availability. The ability to run what-if scenarios, considering also the event-driven ones, before implementing changes in the real factory can improve decision-making and risk management.
Conclusions and future works
During the design phase, it is difficult to foresee all possible scenarios that may arise during the operational phase of a production system. To address this challenge, the paper considered integrated multi-level digital services that link machine-level and production system-level models to support joint decision-making through event-driven what-if simulations. By coupling these two traditionally separated levels of analysis through simulation-based “what-if” scenarios, the presented approach enabled a more holistic understanding of multi-level system interdependencies. Considering to have for each level and each analyses a simulated what-if scenario that include the simulation of the monitored data (i.e. DWSS with its embedded SDMS), that must be kept consistent with the real monitoring system (DMS), the presented approach enables an event-driven multi-level what-if integrated simulation where local anomalies can propagate across system levels, revealing broader impacts on production KPIs and system-wide performance. The proof-of-concept example illustrated the conceptual feasibility of the proposed multi-level integration by simulating how event-driven what-if analyses can inform coordinated decision-making across multiple system levels. Specifically, it demonstrated how local events – such as machine-level failures – can propagate and affect production system-level KPIs, enabling the identification of critical thresholds and supporting the evaluation of maintenance strategies. Rather than aiming to optimise control policies, the proof-of-concept served to show how a DWSS, in combination with its embedded SDMS, can reproduce realistic system dynamics under different conditions and support the design of such policies in future developments. The simulation of unplanned events highlighted how unexpected behaviours can be captured and evaluated before they occur in the real system, allowing the DWSS to act as a decision-support tool. While limited to a simplified environment, this use case shows the benefits of aligning monitoring and simulation services for joint analysis of production planning and maintenance. More broadly, it exemplifies how integrated models and data can be used across the lifecycle of a production machine. As the system evolves, digital services such as the DWSS and SDMS can be continuously updated with new operational data, gradually improving the accuracy of decision support. The proposed approach supports consistent decision-making across multiple levels of detail by ensuring that monitoring and control logic are aligned through the structured integration of models. By bridging decisions from machine-level to production system-level – ensuring model coherence and data consistency – the pipeline offers a concrete step towards more robust, integrated, and adaptive manufacturing systems.
Future research should expand the presented approach towards lifecycle management to allow accumulated operational data to inform design modifications, maintenance planning, and production optimisation over time. Additionally, economic and multi-objective optimisation aspects, assessing trade-offs between cost, reliability, and production performance under varying external conditions (e.g. demand fluctuation) should be considered. From a technical perspective, future works emerging from the limitation of the proposed multi-level what-if integration will focus on the integration of different models built in heterogeneous simulation environments and on standardising the joining of simulated data with historical data for decision-making purposes and the definition of policies that ensure lifecycle data is consistently used to validate and update the different models employed. Moreover, it becomes necessary to define mechanisms that can ensure consistency and coherence when decisions are taken using different models on the same system. For example, when a DWSS is used to simulate a specific what-if condition, if a decision is derived from that simulation, the decision should remain compatible with the ones already stated for the same system (possibly derived by other data-driven or what-if model-based scenarios in another DWSS) without invalidating other decisions. Future work will address this interoperability challenge by introducing coordination frameworks capable of managing dependencies and interactions across multiple models and data, ensuring that decisions remain consistent with each other.
Footnotes
Funding
The authors disclosed receipt of the following financial support for the research, authorship, and/or publication of this article: This study was carried out within the MICS (Made in Italy – Circular and Sustainable) Extended Partnership and received funding from the European Union Next-GenerationEU (PIANO NAZIONALE DI RIPRESA E RESILIENZA (PNRR)–MISSIONE 4 COMPONENTE 2, INVESTIMENTO 1.3 – D.D. 1551.11-10-2022, PE00000004).
Declaration of conflicting interests
The authors declared no potential conflicts of interest with respect to the research, authorship, and/or publication of this article.