
Abstract
Technological advancements and volatile customer demand over the globe have forced manufacturing industries to adopt smart and sustainable manufacturing practices. Now the industries are moving towards the Industry 4.0 to satisfy the mass customization demands as well as to create sustainable value creation. Indian industries are considered as one of major manufacturing hub for the automobile components in world and plays an important role in development of Indian economy. However, the adoption level of Smart manufacturing practices in India is limited due to technological, economical and other challenges. Industries are still struggling with the adoption of smart and sustainable manufacturing practices in the developing economies like India. Therefore, this study aims to find the relationship between sustainable and smart manufacturing practices in the emerging economies. In the present study we have used the hypothesis modelling approach to link the manufacturing competitiveness and top management commitment with the sustainable and smart manufacturing practices. The data is collected with the help of questionnaire survey from the Indian manufacturing industries. Further, Structural equation modelling approach (SEM) is used. The results of this study highlights how manufacturing industries can adopt the smart and sustainable manufacturing practices in the developing economies like India.
Keywords
Introduction
India is one of the most rapidly growing economies in the world. It holds the world’s sixth largest economy which averages a growth of 7% every fiscal year. It has a nominal GDP of 2.44 trillion US Dollars. The industry or manufacturing sector renders up to 26% of the GDP and 22% of the total workforce of the country. 1 Germany and USA have already coined terms like Industry 4.0 and smart manufacturing that encompass new manufacturing paradigm involving robotics, interconnectivity and cloud excess across the world but the adoption level of these concepts is still limited in the developing economies like India.2–4 The major industry sectors in India are petroleum, pharmaceuticals, engineering, jewellery, textile, mining, defence, automotive and iron and steel which helps in the employment generation and economy development in India.5–7 The Indian government has recently launched the initiatives like ‘Make in India’ and ‘Digital India’ to prioritize on in-house manufacturing which aims at attracting the foreign investments, enhancing infrastructural facilities, ease of business operations and global competitiveness.7–9 In order to deliver ‘Make in India’ successful and make a mark on global index, India is driven towards the concept of smart manufacturing (SM). 10 On the other hand, industrialization and rapid manufacturing expansion in Indian industries have led to environmental degradation to alerting levels. The reasons may vary from weak industrial and legislative policies to overpopulation and unplanned urbanization.11–14 This has compelled industries to actively adopt sustainable manufacturing (SS) and smart manufacturing practices.15–18 In the developing country like India, it is much prominent to adoption and implantation of SM and SS Practices.
The present research contributes for the adoption of SM and SS practices. The specific objectives of this study are to develop a theoretical model for the adoption smart and sustainable practices for Indian manufacturing companies and develop a Structural model to validate the proposed theoretical model to achieve manufacturing competitiveness by adopting smart and sustainable practices. This research tries to bring forward a concept of Sustainable and Smart Manufacturing which considers the significance of both SM and SS. An effective understanding of this integration can help the Indian industries perform better both domestically and globally.
In the next section of paper, the literature review and hypothesis development are discussed. In the section 3 research methodology for this study is discussed. In the section 4 data analysis is done. In the section 5 results and discussion of present study is discussed. In the last section of paper conclusion and future recommendation are discussed.
Literature review
In the past few years there has been a great interest among the policymakers, scholars and practitioners toward the smart and sustainable manufacturing practices. 19 Similarly the recently published studies in this area show that there is great interest of practitioners from the emerging economies in the adoption of Smart and Sustainable manufacturing practices.20–22 However, limited literature is available on the sustainable manufacturing and smart manufacturing practices from the emerging economies.3,23 We have started our research with the relevant article collection from the Scopus database. Scopus database is one of the largest databases which include the scientific articles, book reviews and editorial notes from reputed publishers.3,24,25 The following search keywords are used for the article collection: ‘sustainable manufacturing’ AND ‘smart manufacturing’ OR ‘Industry 4.0’. In the search a total of 90 articles were found which are further utilized for literature review purpose.
Smart manufacturing
Smart Manufacturing is one of the latest trends in global industrial scenario which talked about the change in the industry. 22 On the other hand, Sustainable Manufacturing has been there for a while, but due to negligence, its full potential has not been harnessed.20,26 Smart Manufacturing works towards improving the current work processes and enabling the technical makeover of the current traditional practices.27,28
Sustainable manufacturing
Sustainable Manufacturing aims at reducing the carbon footprint of the industry. In a world, where resources are decreasing at an exponentially faster rate, sustainability helps in minimization and optimum consumption of materials and energy that helps control environmental degradation.5,12,29,30 These both manufacturing practices have an impact on the competitiveness of the industry and can help increase their productivity and business gains. 31 India being a developing nation has been restrictive to new manufacturing practices, but with the growing pressure from the world economy, it has to pace up in order to make a mark among the best.6,8,32
To realize the dream of global excellence, Indian manufacturing sector has to understand the importance of both sustainable and smart manufacturing.20,33–35 SM and SS in collaboration can fetch greater results as SM will promote economic development while SS will enable environment preservation and social awareness.16,36,37 This discussion reveals that there is number of studies on smart and sustainable manufacturing conducted in various countries. In Indian context, no research has been found on the adoption of smart and sustainable manufacturing. To fill this research, gap the following research questions are framed:
RQ1: What is the role of top management Commitment in the adoption of smart and sustainable manufacturing practice in Indian context?
RQ2: Is there positive relation between smart manufacturing and sustainable manufacturing?
RQ3: How can manufacturing competitiveness be achieved by the adoption of smart and sustainable manufacturing practice?
On the basis identified the gap in the literature and research questions framed, this research focuses to analyse the relationship between top management, smart and sustainable manufacturing practice to achieve manufacturing competitiveness in Indian manufacturing companies. The theoretical model is shown in Figure 1.
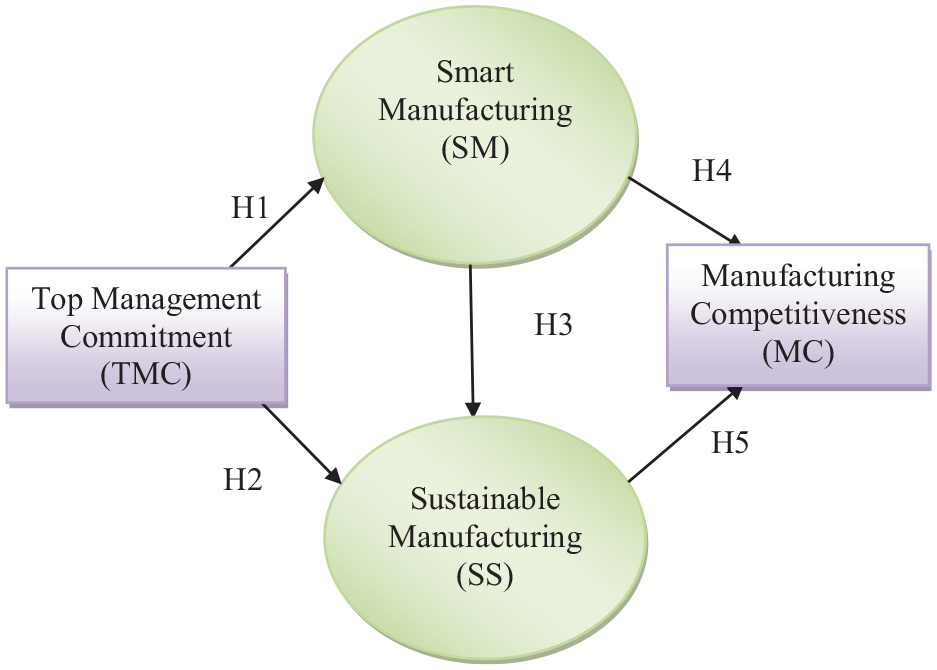
Theoretical model.
Development of hypotheses
The research hypotheses have been developed to answer the framed research questions as discussed. As per the literature, to give the answered of the RQ1, RQ2 and RQ3 the following hypotheses are formed.
RQ1: What is the role of top management in the adoption of smart and sustainable manufacturing practice in Indian context?
Top management commitment and smart manufacturing
The top management is the guide to everything and anything in the company. The top management must be persistent and involved in activities that can help the company achieve quality and service excellence. 38 In order to move from traditional plants to smart factories, a major transition at shop floor level is required. This is attributed to the integration and changeover of the conventional machines to cyber system. 39 As the prices of PLC’s and sensors have reduced to the relatively significant amount, they can be used to complete the above transition. The emergence of robotics has been a major change in the operational capabilities of the industry. 40
H1: Top management commitment has positive effect on Smart Manufacturing
Top management commitment and sustainable manufacturing
The top management comprises of the board of directors and CEO level personnel. They have a chief position as they are the conveners of any policy design that will go from to top to bottom. 41 The role of stakeholders and government regulators is very important in promotion of sustainable manufacturing practices. 42 The management must be committed to the future goals in order to set an example for their organization to follow. Also, support from top level management is required for the successful implementation of sustainability practices in organization. 43
H2: Top management commitment has positive effect on Sustainable manufacturing
RQ2: Is there positive relation between smart manufacturing and sustainable manufacturing?
Smart and sustainable manufacturing
Due to the increase in advanced technologies and growing competitiveness, a new industrial revolution has taken place, known as Industry 4.0. 44 The beginning of this revolution has opened gateways for new and more efficient business models. 21 Industry 4.0 business models have made new business opportunities for manufacturing industries of developing nations as now MNCs (Multi-National Companies) are investing more in developing nations due to cheap labour costs. 34 Under the umbrella of Industry 4.0, advanced manufacturing termed as Smart Manufacturing has evolved. 45 With the increasing pressure from stakeholders and environmental regulators, sustainable manufacturing is soon to become a compulsion rather than an option.12,36 This not only helps protect the environment but leads to the well-being of their workers and employees. 46 Moreover, the government has also stepped by engaging strict norms and regulation to keep a check on waste generation and pollution by industries.
H3: Smart manufacturing has positive effect on sustainable manufacturing
RQ3: How can manufacturing competitiveness be achieved by the adoption of smart and sustainable manufacturing practice?
Smart manufacturing and manufacturing competitiveness
As a global economy, companies are growing are growing internally as well as externally. The companies have plants at different geographical locations. Also, companies are engaging in inter-corporation relations to help to share technology and information. 47 Smart manufacturing helps in integration of all the plants irrespective of their geographical location, which helps in reducing the cost of warehousing and logistics management. 48 In smart manufacturing, the workforce will not only be the important factor of operation but will also be a crucial competitive advantage for the industry. 49
H4: Smart Manufacturing has a positive effect on Manufacturing Competitiveness
Sustainable manufacturing and manufacturing competitiveness
Sustainable Manufacturing is a set of economic, technical and social methods and practices that aim at minimizing the negative effect of manufacturing on the environment.50,51 At the core of it, lies the triple bottom line that targets to achieve the sustainability in all three aspects i.e. socially, economically and environmentally. 52 The growth of the manufacturing industries at the cost the natural resources in order to feed the consumer’s every dying demand has exhausted the regenerative ability of nature and environment.53,54 The competitive advantage in an industrial environment is most desirable. Any company with a competitive advantage over the other can control the market and pricing of the products. 55
H5: Sustainable manufacturing has positive effect on manufacturing competitiveness
The hypothesis H1 connects TMC and SMM, while H2 connects TMC and SSM. Hypothesis H3 connects SMM and SSM. Hypothesis H4 connects SMM and MC, awhile H5 connects SSM and MC. The hypothesis signifies the relationship between the two connected constructs. The hypothesis validation is done using structural model to understand whether the hypothesis under consideration is supported or unsupported. From the same, inferences are drawn and justified using current industrial scenario.
Research methodology
The aim of this study is to identify the use of the smart and sustainable manufacturing practices in the Indian industries. In the study data is collected using the questionnaire survey. Experts from these industries were approached for the data collection. In the initial phase of study, a wide search was taken to identify the prospective industries to which the questionnaire can be sent. The industries were selected based on their geographical region, industry sector type, size of industry and turnover. The questionnaire was sent to the different industries i.e., automobile, machine, electrical, etc. amounting to a total of 782 industries from India.
Research design
The research is designed in a structured manner to find substantial results that can help the industries. The structure of the research design is shown in Figure 2. The conceptual background of the research has come from an extensive literature review conducted across literary sources of high accreditation. The data for present study is collected from the Indian manufacturing industries based through survey questionnaire. The present research is aimed to analysed the relationship between top management commitment, smart manufacturing, sustainable manufacturing and manufacturing competitiveness. No existing survey-based research has been found that analysed the above hypotheses for the manufacturing industries.
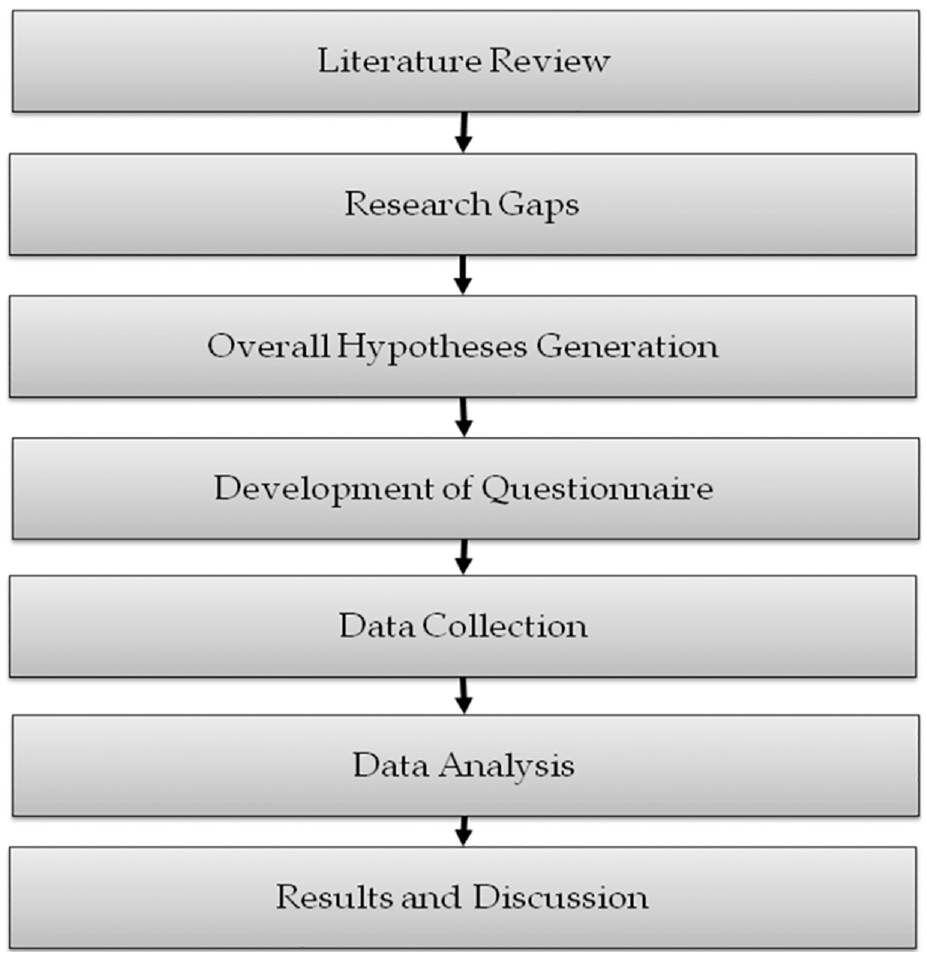
Design flow of research.
Development of questionnaire
A questionnaire uses a set of predefined questions with a given choice of answers that help obtain the inputs. 26 It was observed that no particular questionnaire survey method was used for sustainable and smart manufacturing practices for Indian industries. The questionnaire was targeted at the different level employees of the company especially focusing on management level ones. The management level employees can better attribute to decisions that have organization-wide changes and impact. Both, smart and sustainable manufacturing practices have changes that are introduced in any company through the top management.
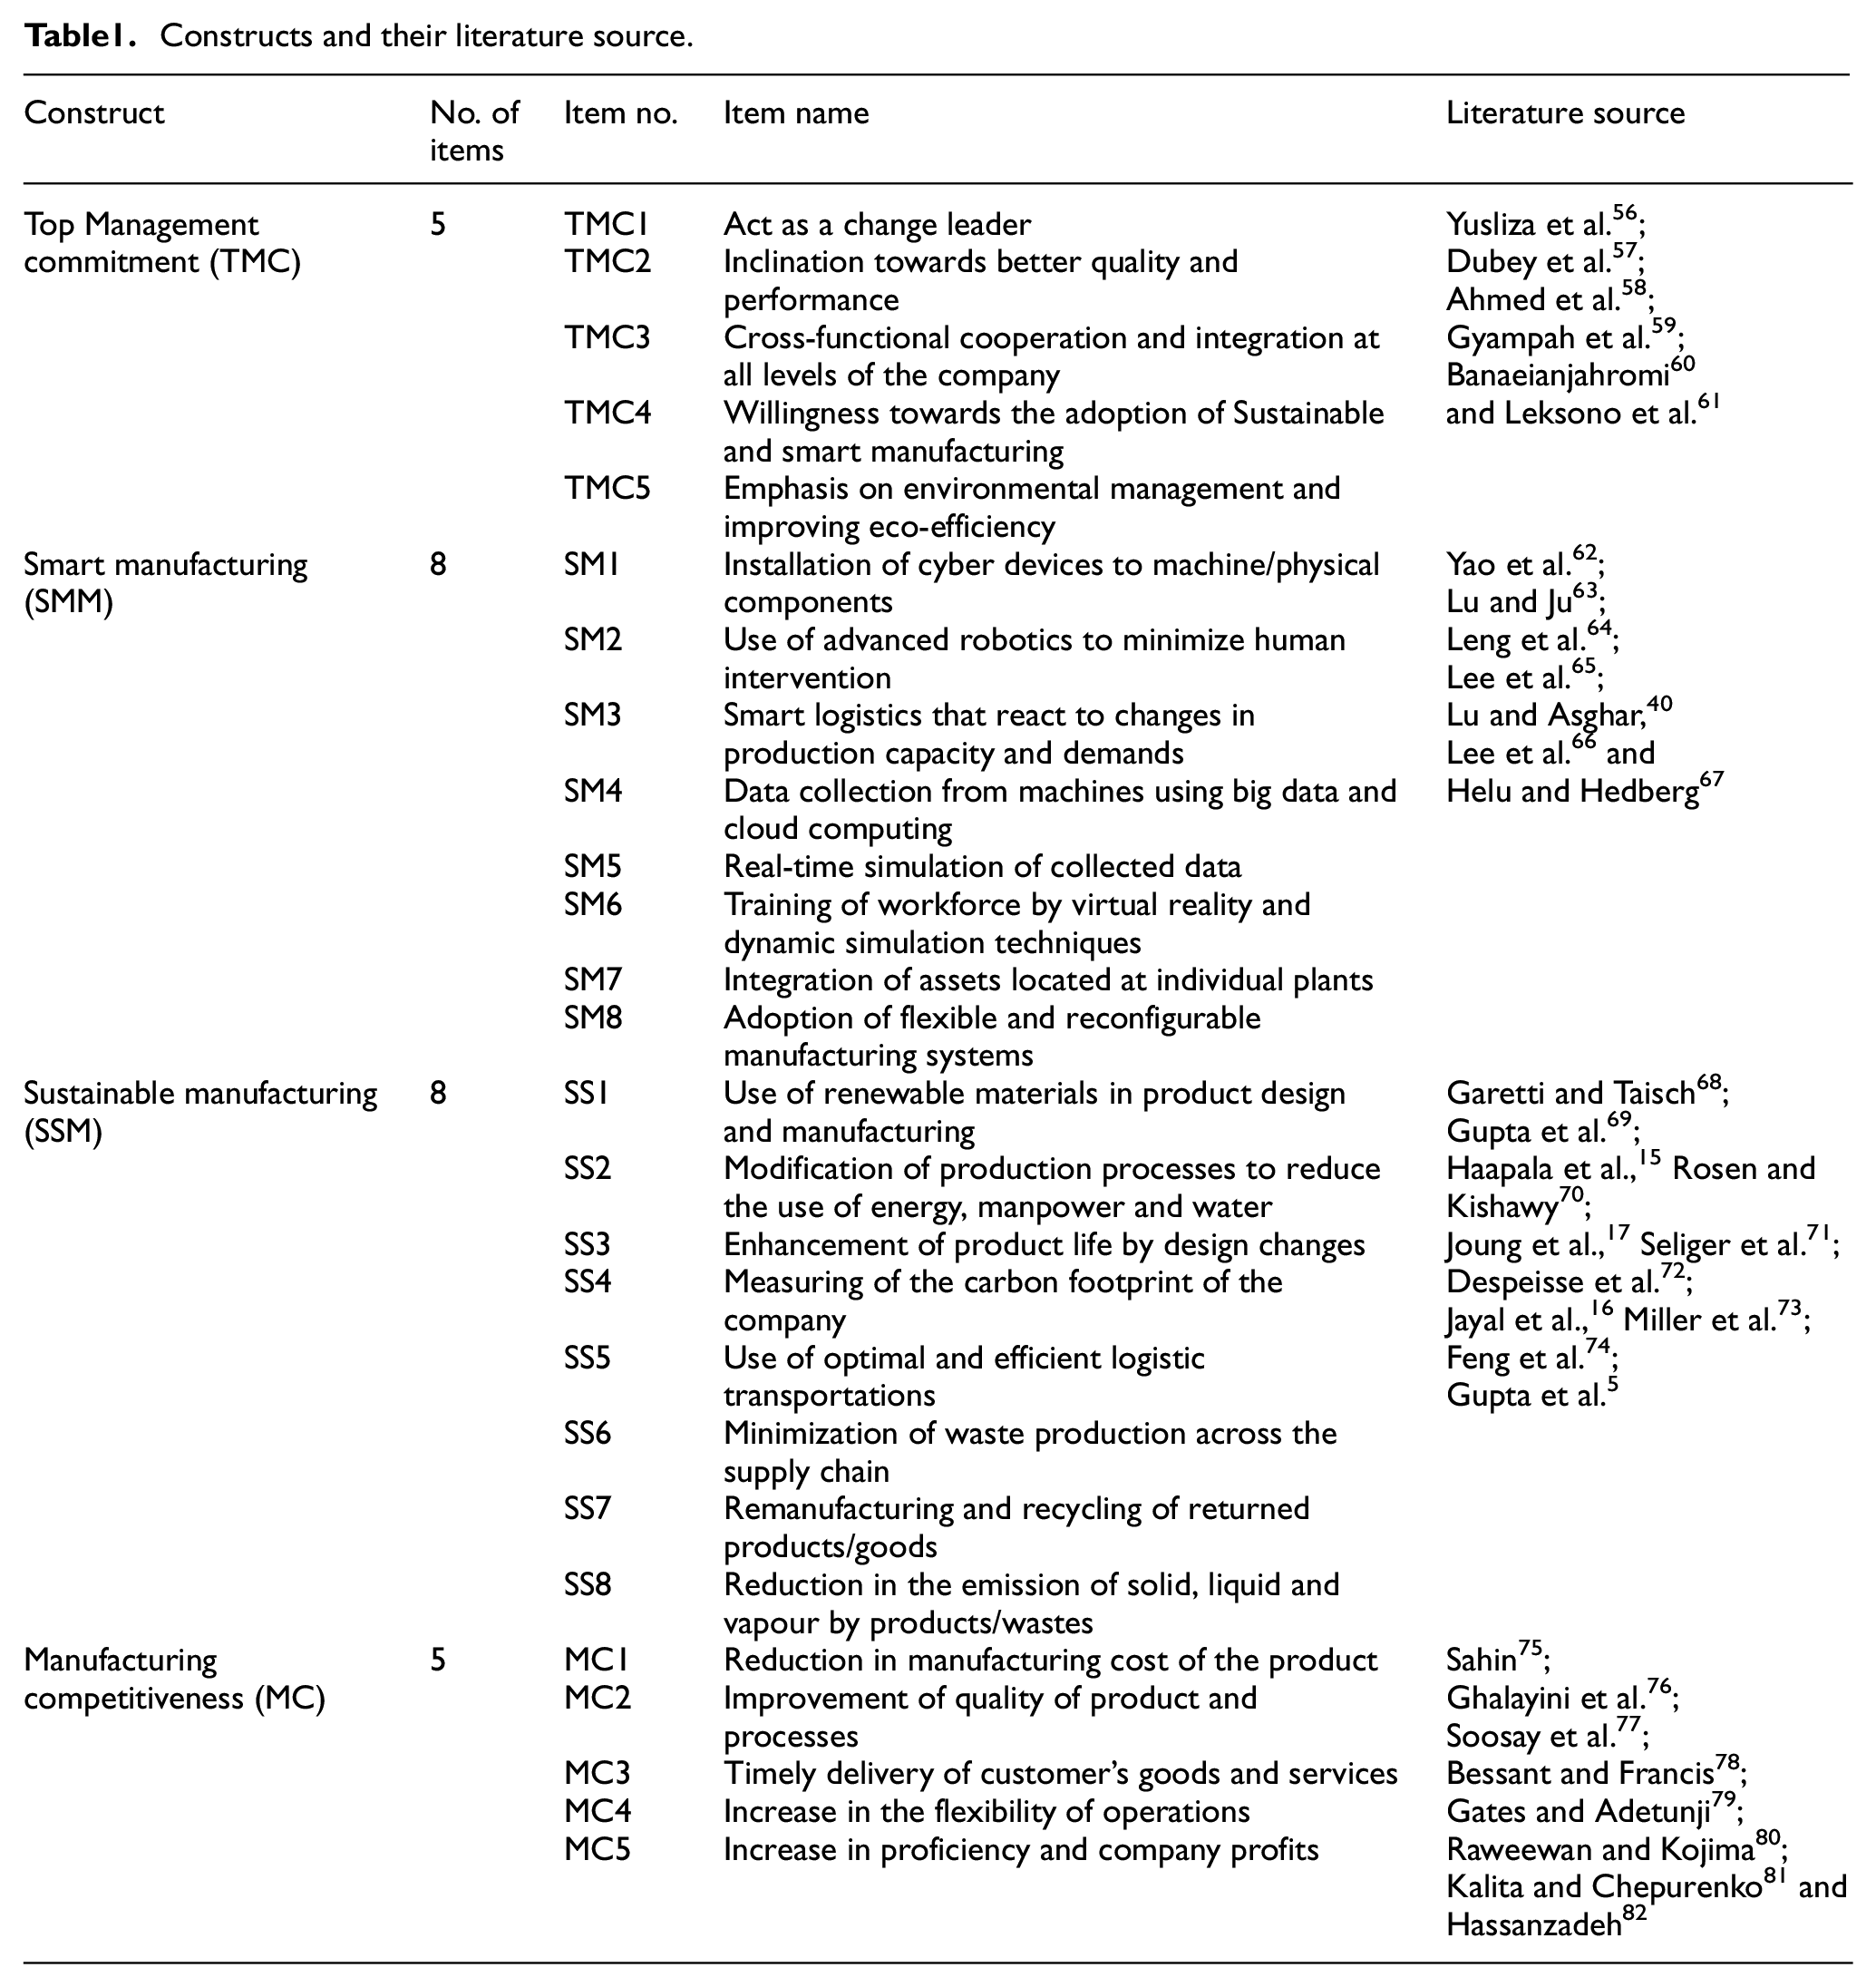
The questionnaire was framed on the basis of a 5-point Likert Scale. In questionnaire, the respondents rate the practices on the bases of this scale with 1 = very low/totally disagree, 2 = low/disagree, 3 = moderate, 4 = high/agree and 5 = very high/totally agree. The questionnaire has been split into six sections discussed in Appendix. Section 1 has 7 questions regarding the personal details of the respondent. The questions are their name, age, gender, industry experience, position in the company, association with the company and field of work. The questions are about the name of the company, region and ownership, type of company, annual sales turnover and number of employees, parent company and growth in the last 3 years. Table 1 shows the issues/concerns that have highlighted from the literature review and summarizes accordingly.
Constructs and their literature source.
Pilot study
For the motive of this research, a pilot study was undertaken. The preliminary questions were sent to academia to verify the questionnaire and provide sample responses. After this, the questionnaire was sent to several industry experts so that they could scrutinize and suggest any changes. The received corrections or changes were incorporated so that a generalized questionnaire could be formed. By this, the questionnaire was double checked and was ready for communication.
Reliability and validity
Reliability and validity are concepts that are used to test the quantitative research. They are important while designing the research and analysing and judging the results. Reliability is the ability to measure the attributes or the items in the primary construct, whereas validity is the ability the measure these attributes correctly to the greatest extent. The reliability is the degree of correlation among the attributes and is consistent as it avoids any repetition in context to the same subject. The validity measures the correctness of the measures attributes and whether something has been measured or not. The validity may be of different types: construct, content, discriminate and convergent validity.
Data collection
A wide range of industries from different sectors of India was selected for investigation. The data regarding management of these industries were collected from different web sources like Confederation of Indian Industry (CII), etc. The questionnaire was developed in google form to enhance communication speed and make it ergonomic to fill and collect responses. The email addresses of different industry experts were collected and a main with Google form was drafted to communicate the above respondents.
Data analysis
A total of 782 email addresses were mailed for the data collection. In response total of 133 responses were secured that could form the foundation for data analysis to further the research work. Hence the rate of response achieved is 17%, which is significant when considered to any previous surveys that have been conducted in the Indian industrial environment. 5
Descriptive statistics
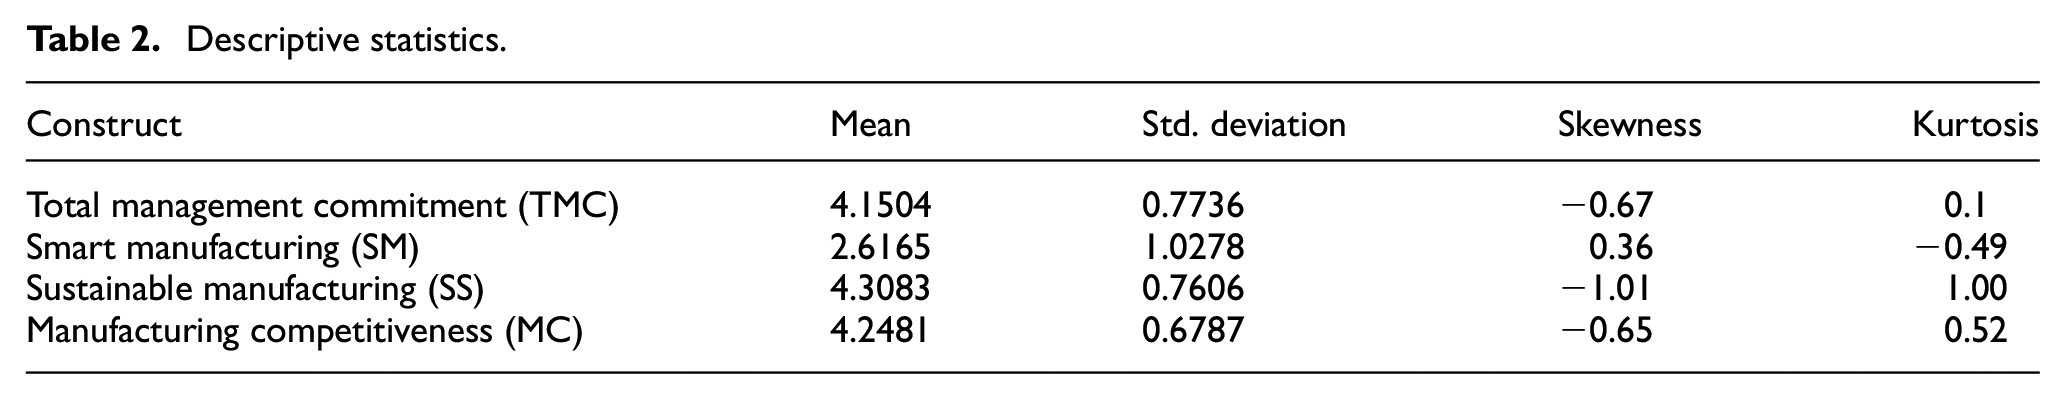
The descriptive analysis guides on the impact of the various practices under sustainable and smart manufacturing and their impact and influence on manufacturing competitiveness and management role respectively. The Table 2 shows the various statistical inferences attained on the research constructs like mean, standard deviation, skewness and kurtosis.
Descriptive statistics.
Normality of data
There are a number of tests and methods that help us assume that variables that are under consideration. Majorly, skewness and kurtosis are considered measures to find the normality of data. It is suggested that the values of skewness and kurtosis must lie between +1 and −1, for the distribution to be considered normal. The values of skewness and kurtosis lie between −1 and +1 and close to zero which shows that the responses are consistent as shown in Table 2. Also, the highest value of skewness and kurtosis is 0.36 and 1.2, which is again close to +1.
Company statistics
An aggregate of 133 responses was collected from Indian industries. A response rate of 17 % was observed. Figure 3 shows the distribution of responses according to their region. It was seen that the majority of companies were from northern region (100, 75%). Companies from the east region were 2, companies from southern region were 16 and companies from the western region were 15.
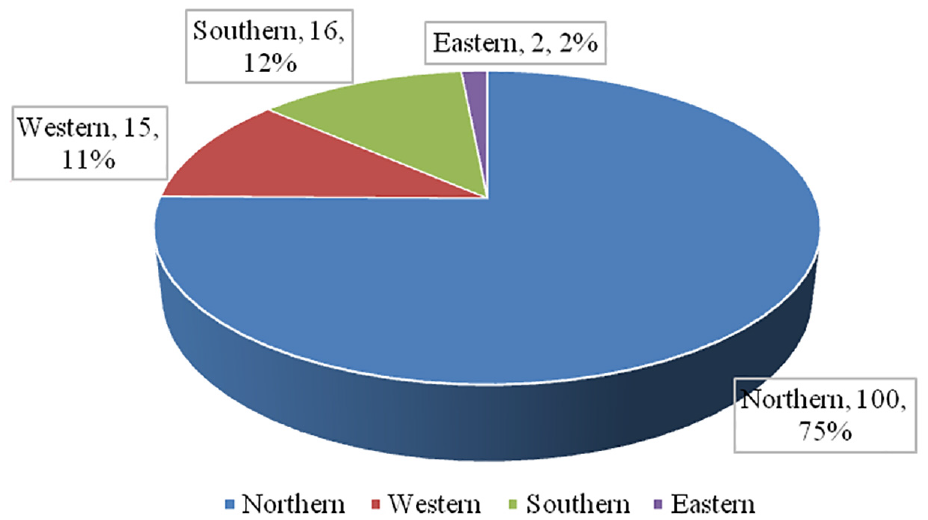
Company statistics according to region.
Tables 3 to 7 shows the complete statics of the respondent companies in tabular form. The following heading of distribution has been used namely nature of ownership, type of company, Annual Sales Turnover, Number of Employees and growth of the company.
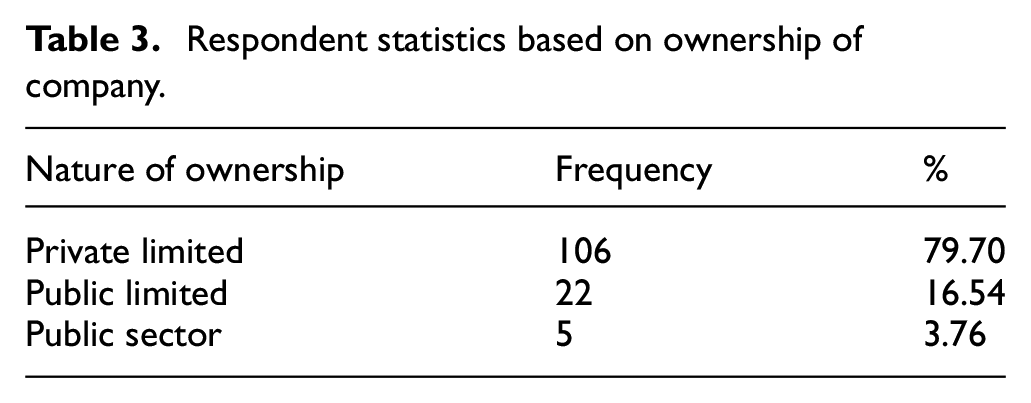
Respondent statistics based on ownership of company.
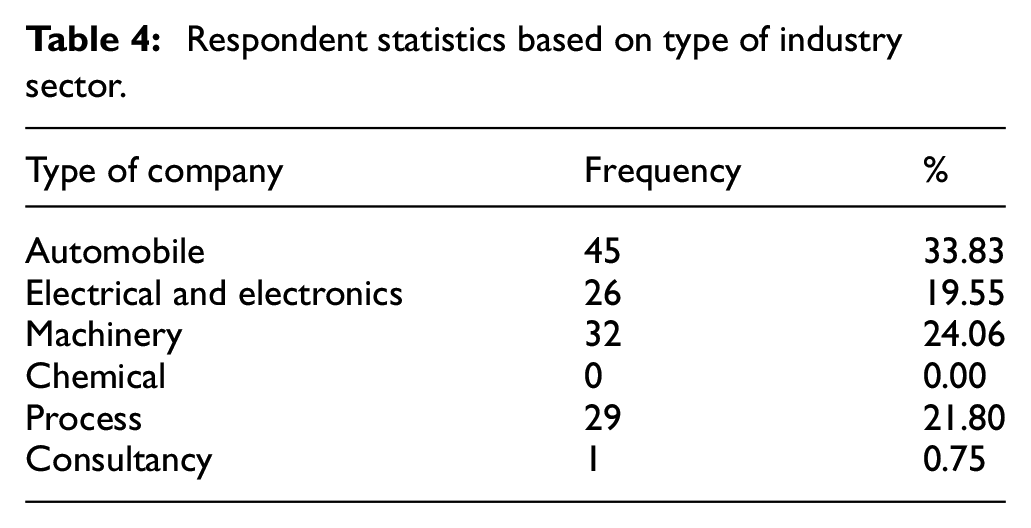
Respondent statistics based on type of industry sector.
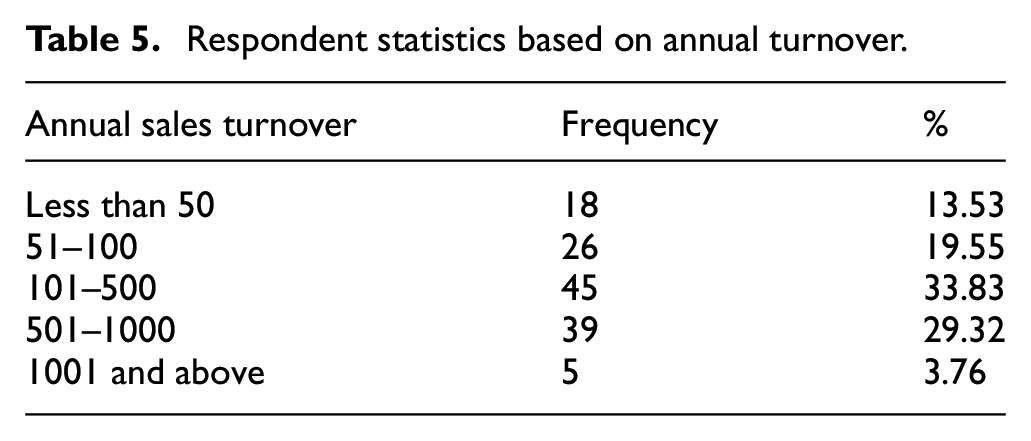
Respondent statistics based on annual turnover.
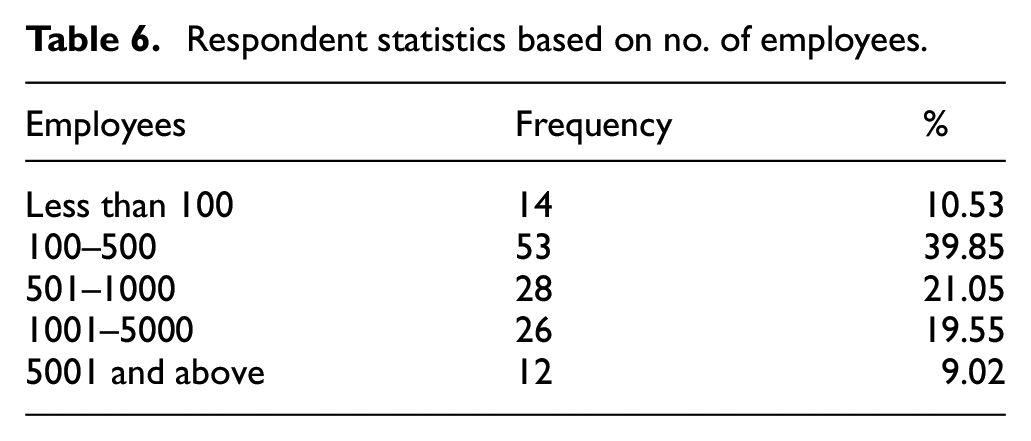
Respondent statistics based on no. of employees.
Respondent statistics based on annual growth of industry.
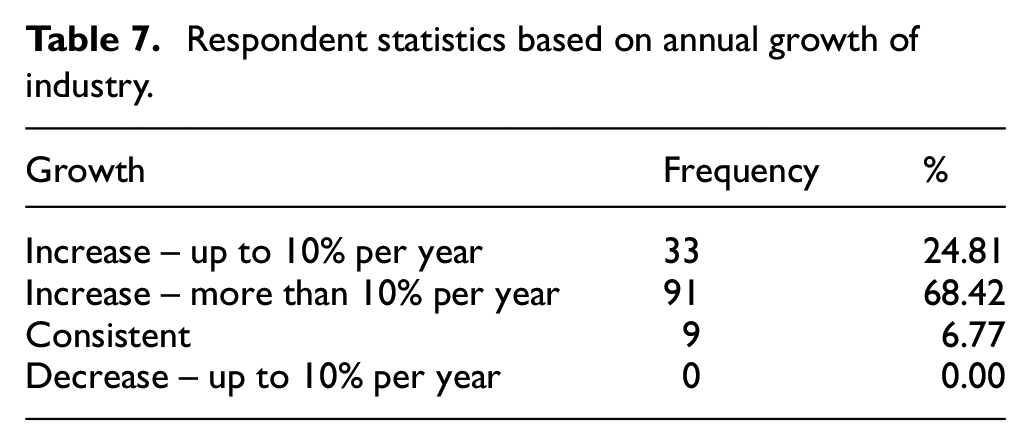
Maximum companies were private limited in nature (106, 79.70%). The automobile companies were highest (45, 33.83%) followed by process companies (29, 21.80%). In case of estimating annual sales turnover of the companies, about 45 companies (33.83%) were in the band of 101–500 crores. The maximum number of companies (53, 39.85) in case of a number of employees lied in the band of 100–500 employees. The companies (33, 24.81%) recorded an average growth of 10% per annum while maximum companies (91, 68.42%) recorded a growth rate of more than 10%.
Respondent’s statistics
According to industry experience (in years)
It can be seen from Figure 4, that 21 respondents (16%) have 1–5 years of industry experience. The number of respondents from with 6–10 years of industry experience is 51 (38%). The number of respondents with 11–15 years of experience is 21 (16%), while respondents with 16–20 years of experience have 26 (20%) responses. Respondents with experiences of 21–25 years are 11 (8%) while the ones with 31–35 years are 3 (2%).
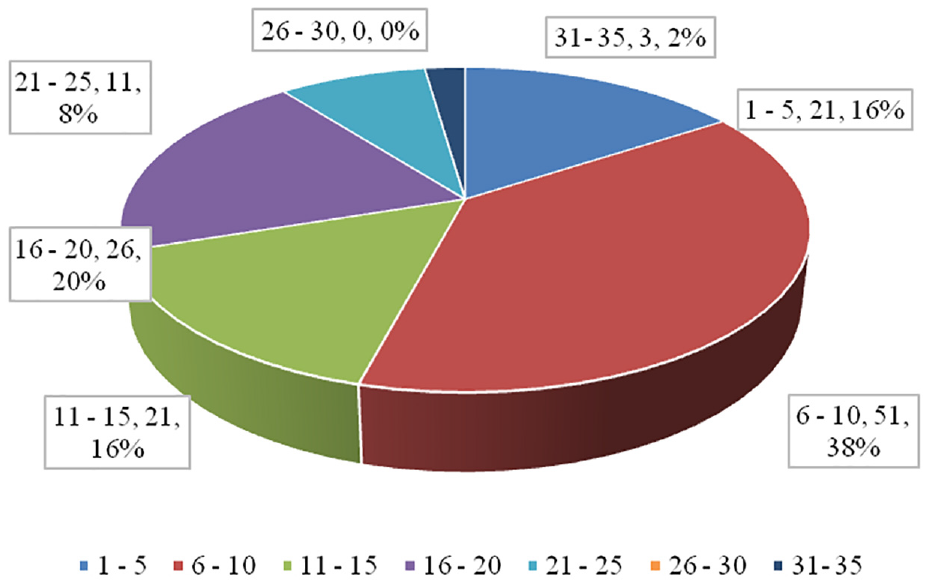
Respondent statistics according to industry experience.
According to level/position in company
Figure 5 shows the profiling of the respondents by their position in the company. Middle Management received highest respondents with 62 (47%) responses while senior management received 34 (25%) responses. On the other hand, junior management received 29 (22%) responses and owner/promoter/CEO category received 8 (6%) responses. Thus, we can say the survey received the responses from almost all levels of management administration.
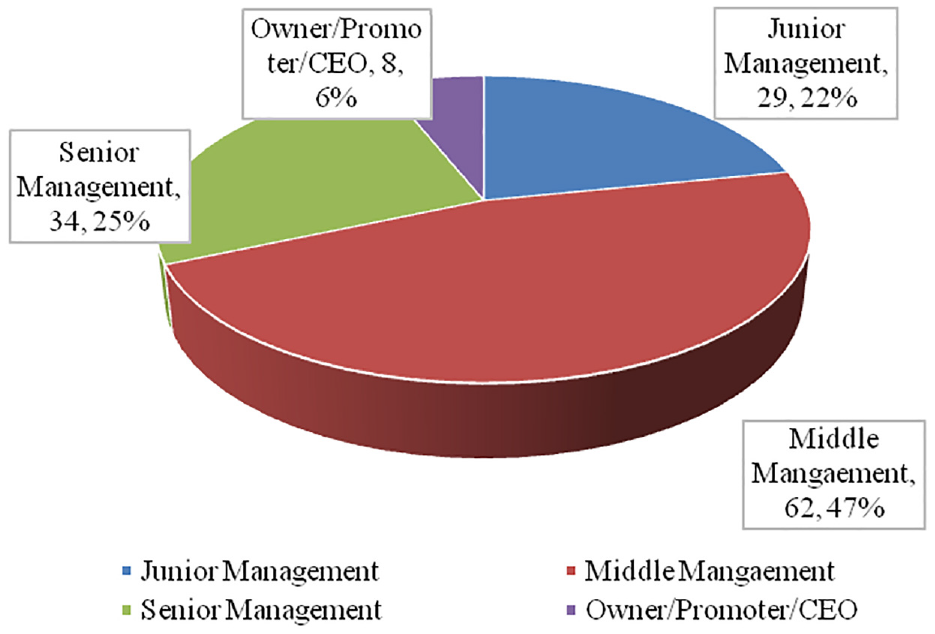
Respondent statistics according to a position in the company.
According to experience in the current company
The respondents profiling by their experience in current company is shown in Figure 6. Respondents which have experience less than 3, 3–6, 6–12 years and more than 12 years are 40 (30%), 52 (39%), 26 (20%) and 15 (11%) respectively. The maximum number of respondents lie in the band of 3–6 years; hence these respondents have appropriate experience to answer questions about the policies of the company.
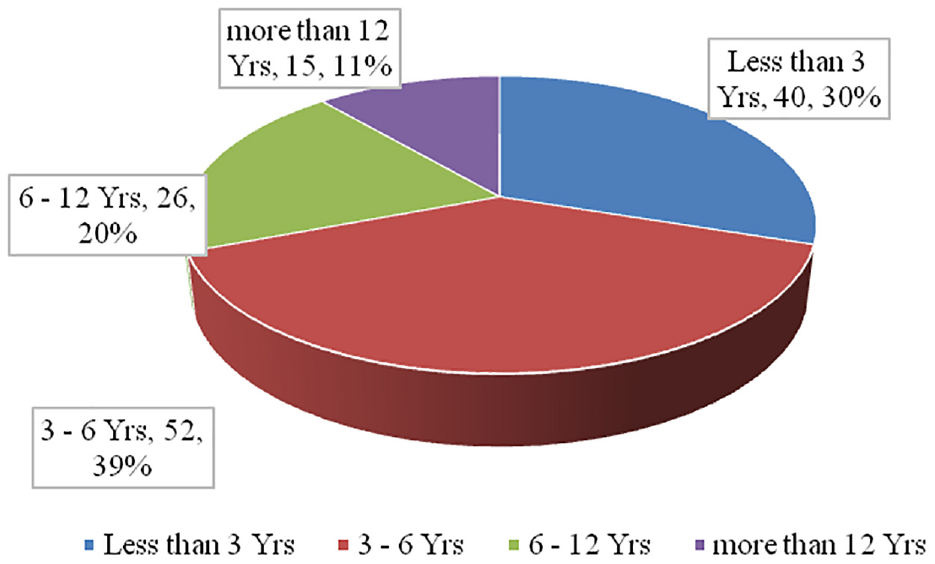
Respondent statistics according to current experience.
Identification of research constructs by factor analysis
In an attempt to find the no. of constructs that are used to identify a series of multiple variables, factor analysis is used. 83 It is used for reducing the dimensions and extracting the factors among the available variables. Here, extraction of factor means to find the underlying central ides or the construct among a set of described set of items.
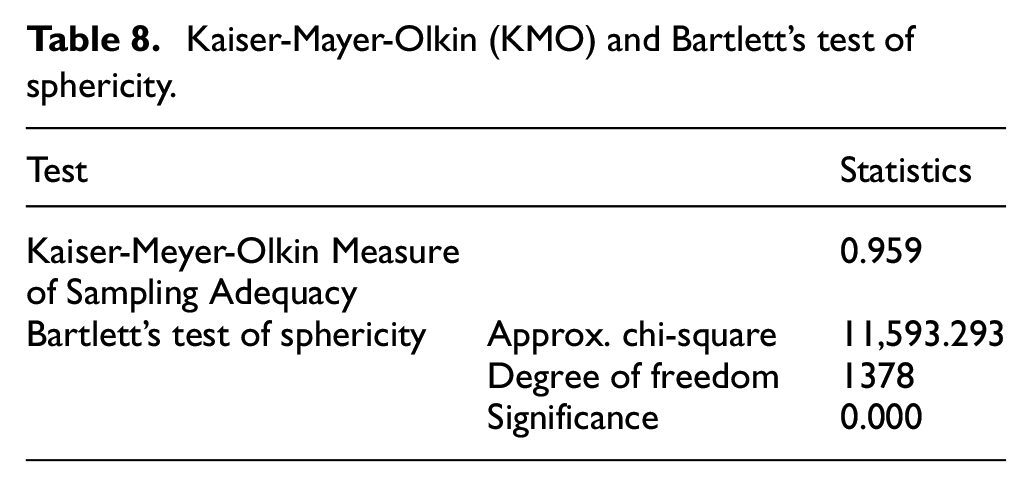
Bartlett’s test of sphericity and Kaiser-Mayer-Olkin (KMO)
The variables must be tested with Bartlett’s test of sphericity and KMO to find if they are adequate. Values of KMO varies from 0 to 1 and the overall value has a maximum of 0.60. The correlation matrix is governed by Bartlett’s test. The significance of Bartlett’s test should be close to zero. In our research, Table 8, the value of KMO is 0.959, which lies between 0 and 1. Also, the significance of Bartlett’s test comes out to be 0.00.
Kaiser-Mayer-Olkin (KMO) and Bartlett’s test of sphericity.
Internal consistency analysis of research constructs
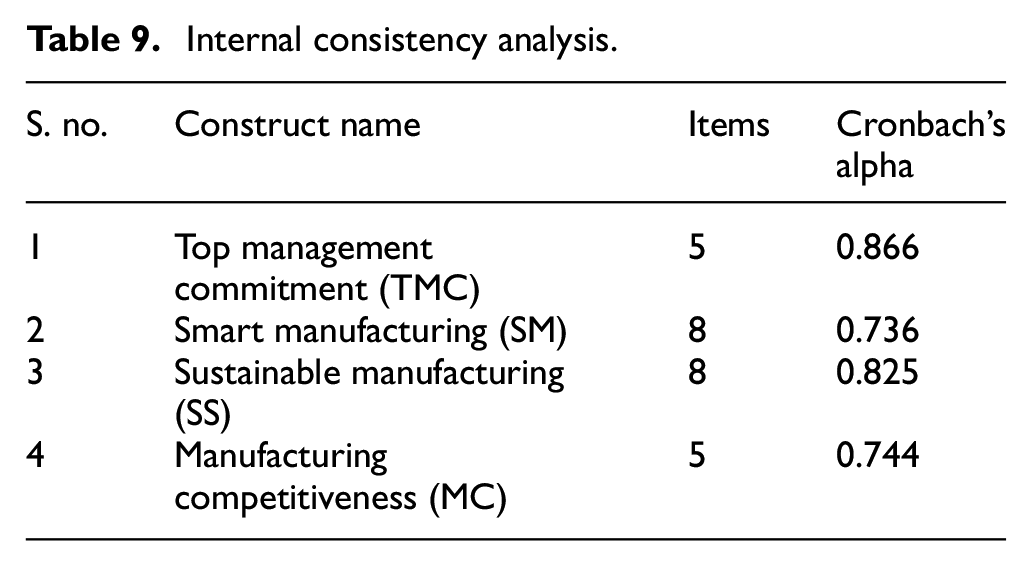
The reliability method is used to identify and compute the internal consistency of constructs. The reliability is measured by a coefficient i.e. Cronbach’s Alpha. Values of Cronbach’s Alpha ranges from zero to one. The higher the value of alpha the better is reliability. The most preferred value is 0.7. Table 9 shows the value of alpha for the different constructs and their internal items within each construct. In the table, the value of alpha ranges from 0.736 to 0.866.
Internal consistency analysis.
Structural equation modelling (SEM)
This section focuses on statistical validation of hypothesis presented in the previous chapters. For this motive, the structural equation modelling (SEM) is adopted. It will help to examine the causal relationship between top management commitment, smart manufacturing, sustainable manufacturing and manufacturing competitiveness. SEM comprises a series of statistical tools that help in examining the relationships among different variables. 84 The structure of variables is expressed in the form of statistical models that can be considered alike to a series of many regression equations. These models represent the interrelationship of the selected constructs under study. Usually, SEM comprises a measurement and structural model.
Model indices
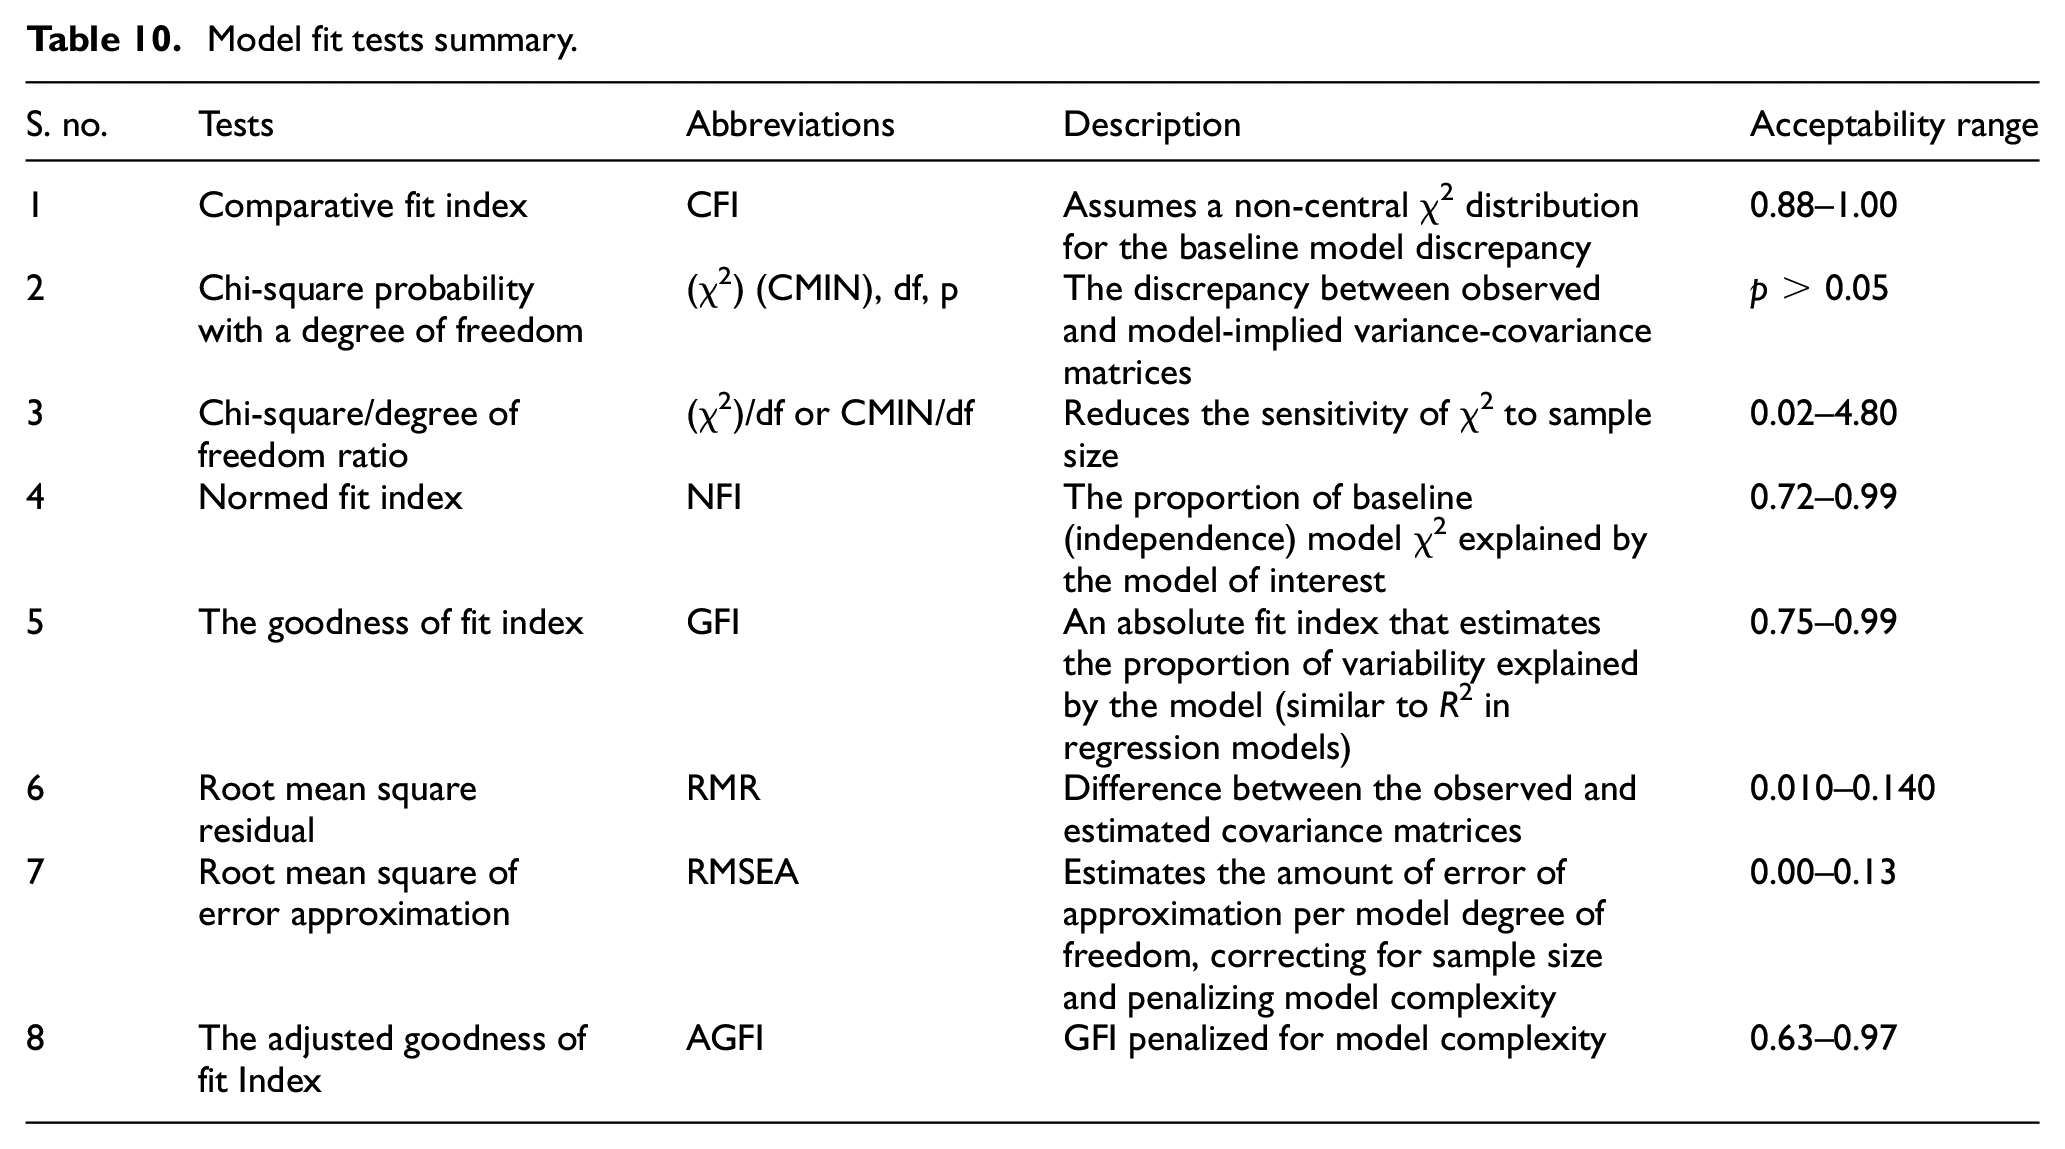
It is recommended to conduct fitness tests for the constructs of the model. It indicates how well the constructs of the model are connected and how well the indicators of the constructs are reflecting upon themselves. For the same, at least four tests were recommended. The various tests are a comparative fit index (CFI), chi-square (χ2) (CMIN), normed fit index (NFI), the goodness of fit index (GFI), root mean square residual (RMR) and adjusted goodness of fit index (AGFI), etc. The meaning and an acceptable range for the tests has been shown in Table 10.
Model fit tests summary.
SEM process
SEM comprises of measurement and structural model. A measurement model is made to specify the indicators of each construct and then helps in examining the construct validity for the same. The flow of the SEM process is given as follows:
Define the constructs for all variables.
Draw the model for measurement.
Examine reliability and model validity.
If above model is found valid then specify the structural model.
Examine the validity of the above model.
Extract inferences from above.
Multi-factor model
The process of analysis of the multifactor model is similar to the one-factor model, the only difference lying in the no. of factors being examined. This technique employs the same fitness tests and techniques shown before to inspect the structural and measurement model. The multi-factor model is used to analyse the connection linking top management commitment, smart manufacturing, sustainable manufacturing and manufacturing competitiveness. The multi-fit indices used covariance study like chi-square (χ2) (CMIN), ration of chi-square to degree of freedom (χ2/df) or (CMIN/df), comparative fit index (CFI), normed fit index (NFI), goodness of fit index (GFI), root mean square residual (RMR) and adjusted goodness of fit index (AGFI) for viewing the different statistical areas.
Multi-factor model to study the connection of constructs (TMC, SM, SS and MC)
In order to examine the relationship between top management commitment (TMC), smart manufacturing (SM), sustainable manufacturing (SS) and manufacturing competitiveness (MC), a measurement model was established. Also, a structural model was suggested to examine the hypotheses. The following hypothesis is considered: H1 (between top management commitment and smart manufacturing), H2 (between top management commitment and sustainable manufacturing), H3 (between smart manufacturing and sustainable manufacturing), H4 (between smart manufacturing and manufacturing competitiveness) and H5 (between sustainable manufacturing and manufacturing competitiveness). In order to test the proposed hypotheses, a structural model was developed with the maximum likelihood method by using AMOS 22.0 software package
Examination of the measurement model
The CFA which is confirmatory factor analysis is implemented to develop a measurement model. The measurement model is developed for the research constructs such as (TMC, SM, SS and MC). To examine both validities of the model and reliability, various tests were performed.
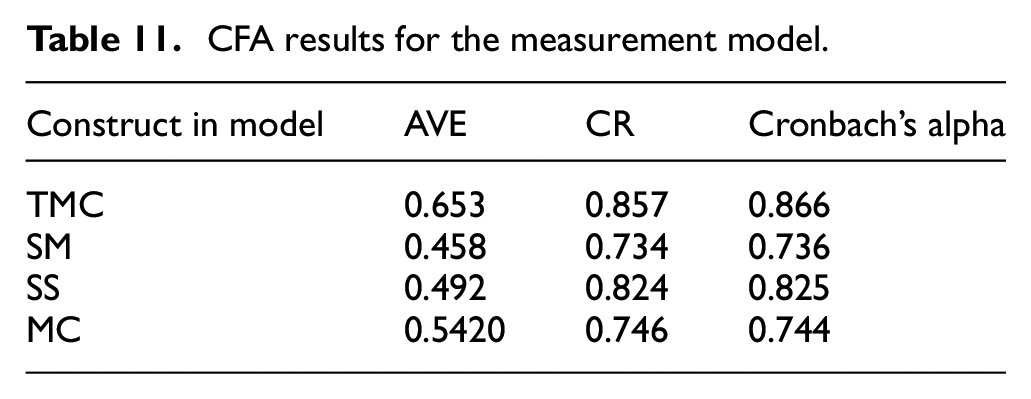
CR or composite reliability is used to obtain the connection with the internal reliability of the constructs. Composite Reliability of all of the constructs should be >0.7. In the present research, the value of Composite Reliability for all the constructs is >0.7. In the previous studies, it is stated that value for Cronbach’s alpha should be >0.7 for all the constructs. The values for the standardized estimates is >0.5. This gives the high convergent validity for all the constructs.
Convergent validity or CV was also confirmed by the use of average variance extracted (AVE) as shown in Table 11. The Average Variance Extracted of TMC and MC were above 0.5, which denotes a satisfactory degree for the convergent validity and AVE for SM and SS is near to 0.5 that indicates that the convergent validity of the constructs is acceptable.
CFA results for the measurement model.
Discriminant validity or DV which is evaluated using two approaches. Firstly, the correlation between two constructs should be equal or greater than 0.30. Secondly, the comparison of Cronbach’s alpha of a latent construct to its mean correlations with other model latent variables. Cronbach’s alpha and correlation matrix with the mean of correlations of latent constructs (TMC, SM, SS and MC) on the diagonals was calculated. The value of Cronbach’s alpha was higher than the mean of correlation of latent construct. Both the analysis is confirmed by the discriminant validity for all the constructs as shown in Table 12.
Means, standard deviations, Cronbach’s alpha and correlations of the constructs.
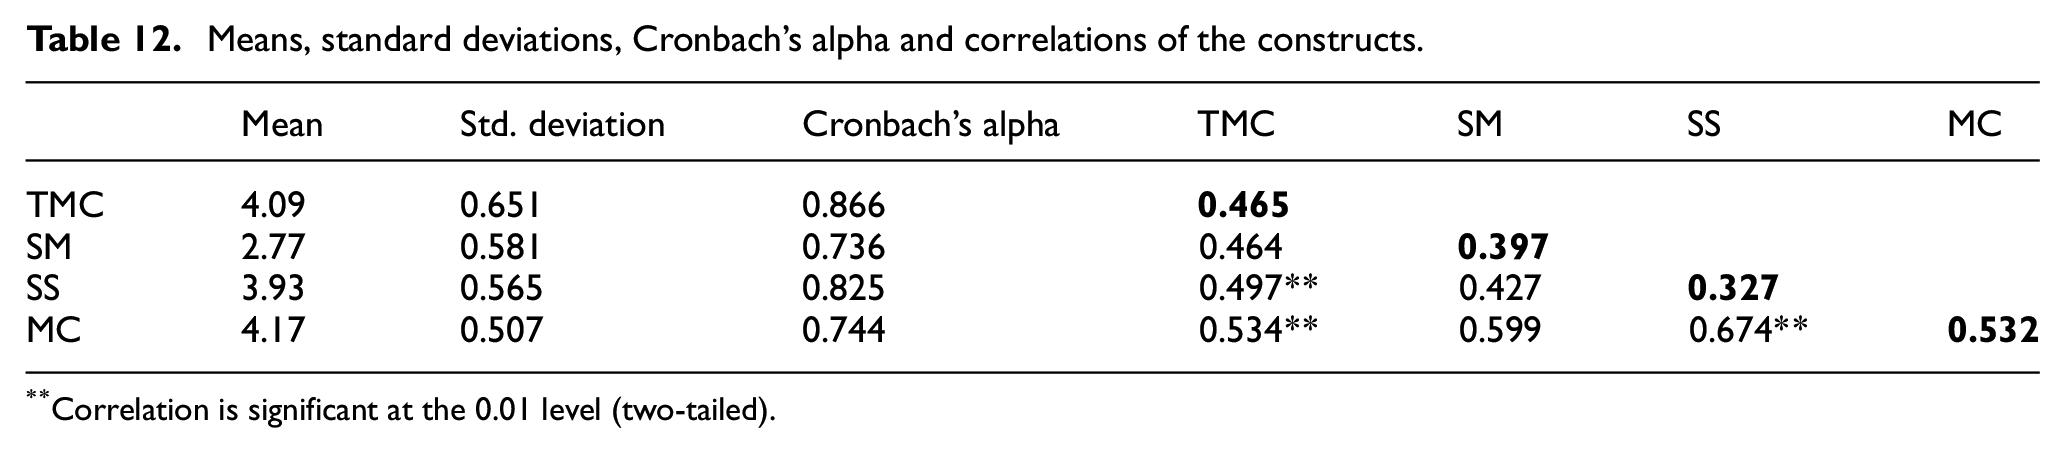
Correlation is significant at the 0.01 level (two-tailed).
Examination of structural model
To examine the hypotheses, the multifactor structural model is made by confirmatory factor analysis using AMOS 22.0 software package (Figure 7).
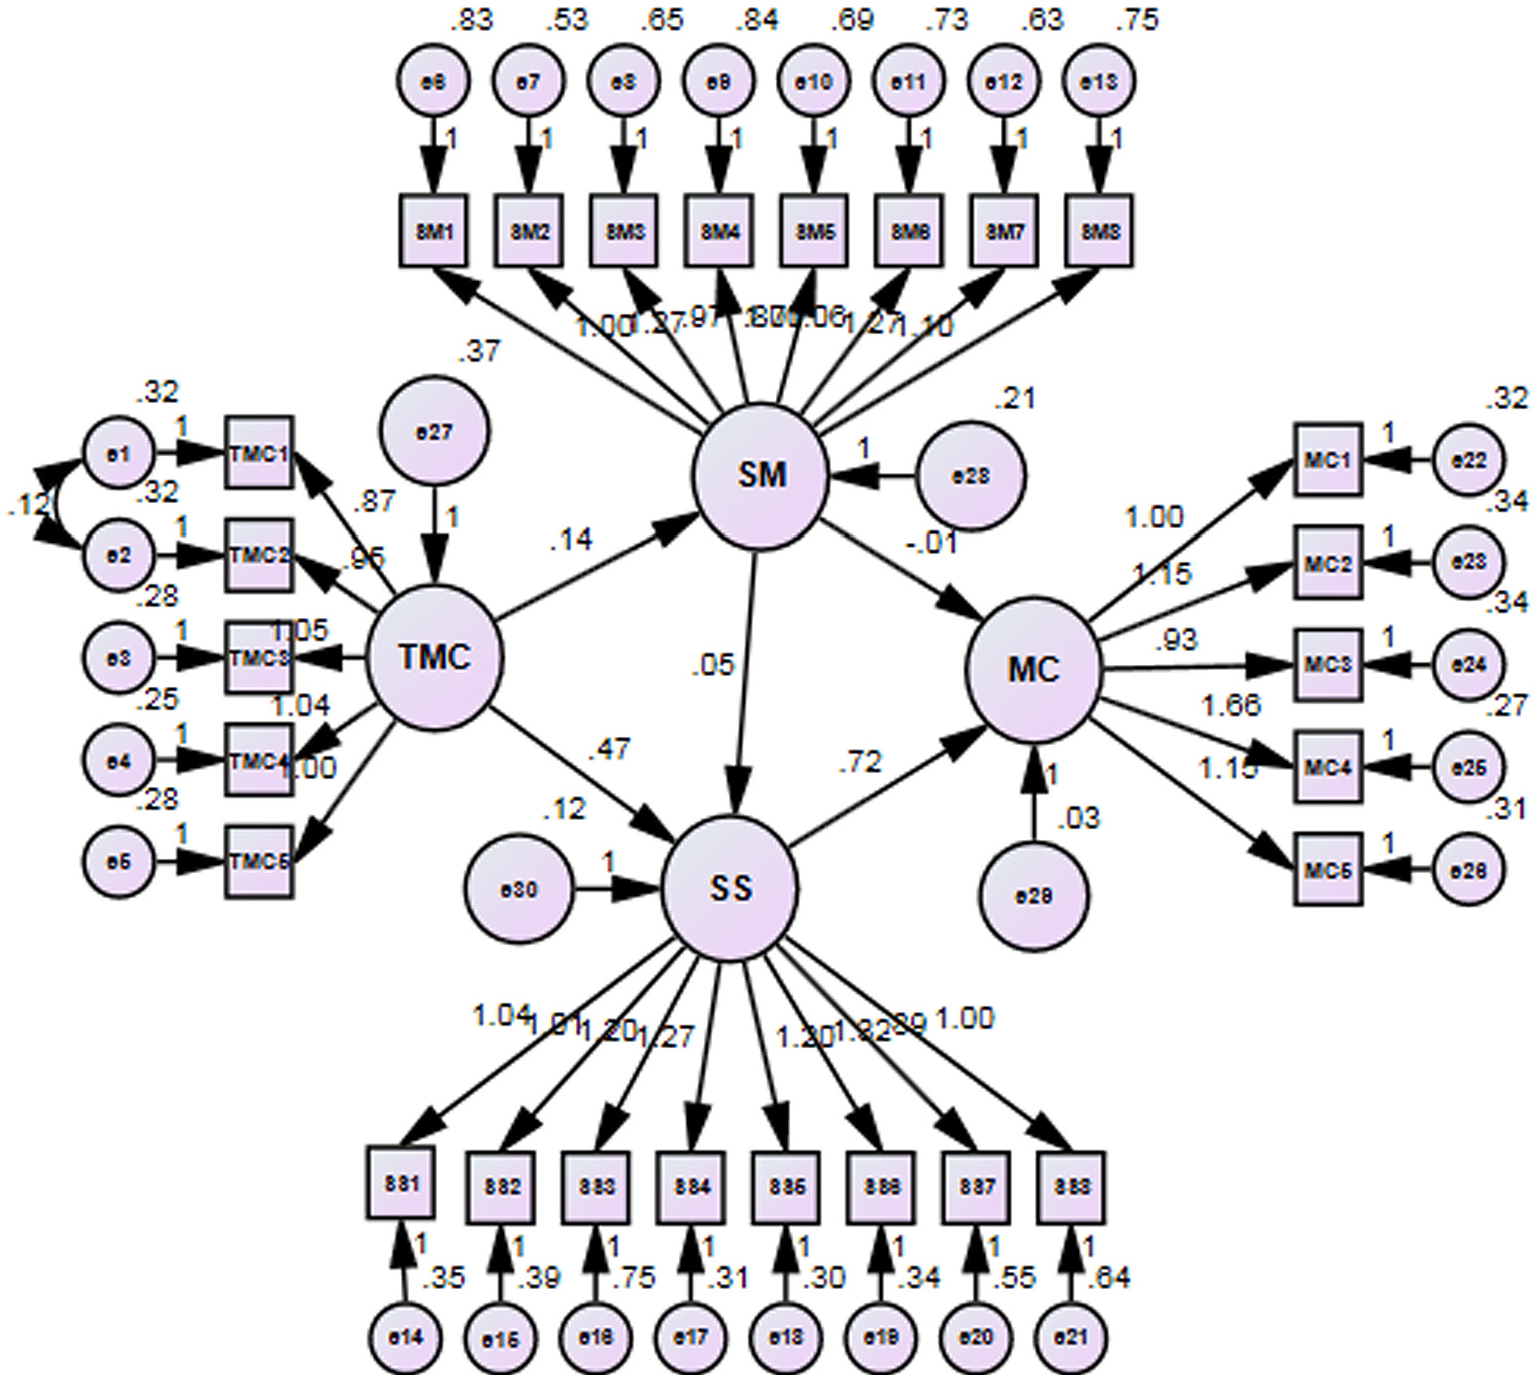
Multifactor structural equation model.
A structural model was developed to test the proposed hypothesizes i.e. H1, H2, H3, H4 and H5 as shown in Figure 4. The structural model was analysed based on the fit between the theoretical model and the data through the goodness of fit indices. The model fit indices were computed as the values of (χ2)/df = 1.53, GFI = 0.811, AGFI = 0.774, RMR = 0.057, NFI = 0.687, CFI = 0.860 and RMSEA = 0.063. All these values were satisfactory with respect to the recommended range value.
The model fit Indices suggest an acceptable fit of the structural and perfect description of the relationship of TMC, SM SS and MC. Table13 Shows, how the top management commitment (TMC), smart manufacturing (SM), sustainable manufacturing (SS) and manufacturing competitiveness (MC) are associated with each other in the Indian context
Hypothesis between the research constructs.
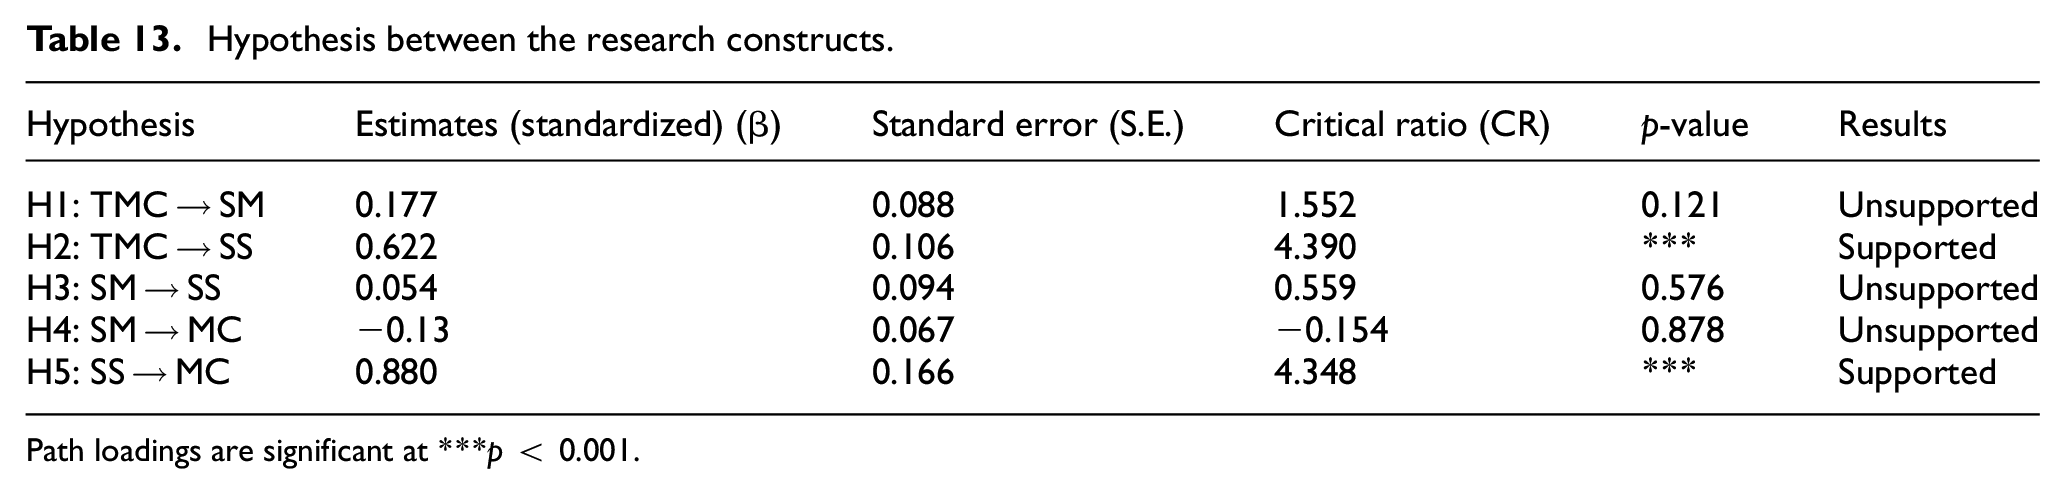
Path loadings are significant at ***p < 0.001.
The results show that the scale items to measure the model’s constructs are reliable and valid, and fit between the theoretical model and the data model.
Examination of mediation effect
In order to examine the mediation effect, the bootstrapping was used. It was observed that the indirect (mediated) effect of Top management commitment (TMC) on Sustainable Manufacturing (SS) is significantly different at the 0.001 level (p = 0.416 two-tailed) and It was also found that the indirect (mediated) effect of Top management commitment (TMC) on Manufacturing Competitiveness (MC) is significantly different at the 0.001 level (p = 0.012 two-tailed). Smart Manufacturing (SM) is not related to Top Management Commitment (TMC), Sustainable Manufacturing (SS) and Manufacturing Competitiveness (MC) from which it is possible to conclude that Hypotheses H1, H3 and H4 are not supported. Therefore, mediating effect is only relevant for Top Management Commitment (TMC), Sustainable Manufacturing (SS) and Manufacturing Competitiveness (MC).
Results of hypotheses testing discussion
The results indicate that the scale items to measure the model’s constructs are reliable and valid, and an excellent fit between the theoretical model and the data model.
Relationship between top management commitment (TMC) and smart manufacturing (SM) H1
From the results, it is confirmed that H1 (β = 0.177; p > 0.001) which focuses on the relationship between top management commitment (TMC) and Smart Manufacturing (SM). The hypothesis is insignificant due to the higher p-value. p-Value is the level of marginal significance within a statistical hypothesis test. As smart manufacturing is an all-new way of manufacturing that comprises of technologies ranging from automated machines to cyber collection of data and its analysis. As smart manufacturing comes with technologies that either update the current technological system or completely replaces it, it involves a much cost.
Relationship between top management commitment (TMC) and sustainable manufacturing (SS) H2
The result indicates a positive and significant relationship between top management commitment (TMC) and sustainable manufacturing (SS) which support H2 (β = 0.622; p < 0.001). Indirect mediation effect was also observed between top management commitment (TMC) and sustainable manufacturing (SS). Sustainable Manufacturing is a series of practices that help lessen the influence of industrial applications and processes on the environment. Due to increasing pressure on customers and government initiatives, industries have started embracing sustainable manufacturing practices, and in the process have reaped benefits from its implementation. The responses are in sync with the same. The management is actively trying to incorporate practices of sustainable manufacturing in their daily works.
Relationship between and smart manufacturing (SM) and sustainable manufacturing (SS) H3
From the results, it is confirmed that H3 (β = 0.054; p > 0.001) which focus on the relationship between smart manufacturing (SM) and sustainable manufacturing (SS). The hypothesis is insignificant due to the higher value of P. Due to the high value of P, the hypothesis was unsupported. The practices of smart manufacturing may lead to sustainable manufacturing in the long term. Several practices of sustainability can be incorporated into smart manufacturing like updating of machinery rather than complete replacement, which will reduce machine wastage. The insignificance of the relation may be due to lack of awareness of smart manufacturing technologies as it is fairly a new topic for Indian industrial environment.
Relationship between smart manufacturing (SM) and manufacturing competitiveness (MC) H4
The analysis results are concerning with H4 (β = −0.13; p > 0.001) which focus on the relationship between smart manufacturing (SM) and manufacturing competitiveness (MC). The hypothesis is negatively insignificant thereby providing support predominant opinion among the researcher concerning Smart Manufacturing. Although, a new more advanced manufacturing system like smart manufacturing must result and lead to manufacturing benefits and increased profits. But the hypothesis states that smart manufacturing does not affect manufacturing competitiveness significantly. This can be due to the following reasons: (a) inconsistency in responses received due to lack of awareness as well lack the use of smart manufacturing technologies and (b) in industries, where smart manufacturing has been implemented may reap benefits in the long term and may not be able to see any current increase in profits.
Relationship between sustainable manufacturing (SS) and manufacturing competitiveness (MC) H5
Similarly, there is a positive and significant relationship between sustainable manufacturing (SS) and manufacturing competitiveness (MC) H5 (β = 0.880; p < 0.001) the hypothesis is supported. Indirect mediation effect was also observed between Sustainable Manufacturing (SS) and Manufacturing Competitiveness (MC). Sustainable Manufacturing has been prevalent in India for a while now. Though the industries were reluctant to adopt sustainable manufacturing when it first came into the picture, when few industries started to get benefits from its adoption, the other industries followed. Sustainable manufacturing helps in eradicating the bad effects of industrial processes on the environment. This helps in supporting the concerns of customers as well as fulfilling government compliances. Due to this, companies have observed customer loyalty increasing profits. Also, due to better machinery reducing wastages, the productivity and proficiency have increased.
Results and discussion
In the present study a literature survey was conducted to study the Industry 4.0, its components and barriers associated with its implementation. The responses for the same were received from an automobile company in Delhi-NCR Area. Literature survey was conducted for smart manufacturing and sustainable manufacturing to understand the current status and adoption levels. Major practices for the same were summarized and presented. Hypotheses were generated between top management commitment, smart manufacturing, sustainable manufacturing and manufacturing competitiveness and hypothesis model was presented. In order to evaluate the model, responses were taken from professionals from industrial environment ranging from the different level of management, in the form of a Google survey questionnaire. A total of 782 emails were sent, and 133 workable responses were received. Graphical statistics about the company and respondent’s data were presented. The responses were tested for descriptive statistics in MINITAB. After this, the measurement models and structural models were generated and evaluated through AMOS 22.0. Based on the results obtained following conclusions can be drawn:
Top management commitment and smart manufacturing
The relation between the connection between top management commitment and smart manufacturing is insignificant as the hypothesis was unsupported. As smart manufacturing is an all-new way of manufacturing that comprises of technologies ranging from automated machines to cyber collection of data and its analysis. As smart manufacturing comes with technologies that either update the current technological system or completely replaces it, it involves a very high cost. The top management as seen from the responses we got, is hesitant to invest such a big amount into smart manufacturing. This can be due two reasons: (a) the management is not far-sighted that cannot look beyond their current infrastructure into the future benefits of implementing smart manufacturing and (b) the majority of responses were received from small or medium enterprises for which smart manufacturing is not something they are ready to invest in the current economic scenario.
Top management commitment and sustainable manufacturing
The relation between top management commitment and sustainable manufacturing is positive and significant and the hypothesis is supported. Sustainable Manufacturing is a series of practices that help lessen the influence of industrial applications and processes on the environment. Due to increasing pressure on customers and government initiatives, industries have started embracing sustainable manufacturing practices, and in the process have reaped benefits from its implementation. The responses are in sync with the same. The management is actively trying to incorporate practices of sustainable manufacturing in their daily works.
Smart manufacturing and sustainable manufacturing
Due to the high value of P, the hypothesis was unsupported. This means that the relation between smart manufacturing and sustainable manufacturing is insignificant. The practices of smart manufacturing may lead to sustainable manufacturing in the long term. The relation that was wanted to be discussed was how sustainability of smart manufacturing can be achieved by finding the relation between smart and sustainable manufacturing. Several practices of sustainability can be incorporated into smart manufacturing like updating of machinery rather than complete replacement, which will reduce machine wastage. The insignificance of the relation may be due to lack of awareness of smart manufacturing technologies as it is fairly a new topic for Indian industrial environment.
Smart manufacturing and manufacturing competitiveness
In this also, the hypothesis is unsupported as the relation between smart manufacturing and manufacturing competitiveness is negatively insignificant. Although, a new more advanced manufacturing system like smart manufacturing must result and lead to manufacturing benefits and increased profits. But, the hypothesis states that smart manufacturing does not affect manufacturing competitiveness significantly. This can be due to the following reasons: (a) inconsistency in responses received due to lack of awareness as well lack the use of smart manufacturing technologies and (b) in industries, where smart manufacturing has been implemented may reap benefits in the long term and may not be able to see any current increase in profits.
Sustainable manufacturing and manufacturing competitiveness
The relation between sustainable manufacturing and manufacturing competitiveness is significant and the hypothesis is supported. Sustainable Manufacturing has been prevalent in India for a while now. Though the industries were reluctant to adopt sustainable manufacturing when it first came into the picture, when few industries started to get benefits from its adoption, the other industries followed. Sustainable manufacturing helps in eradicating the bad effects of industrial processes on the environment. This helps in supporting the concerns of customers as well as fulfilling government compliances. Due to this, companies have observed customer loyalty increasing profits. Also, due to better machinery reducing wastages, the productivity and proficiency have increased.
Conclusion
Indian manufacturing sector is evolving every day. With pressure global competitiveness and increased trade among the nation, the industries must compete and excel at the global level. The Indian government has launched many initiatives to help the industries cope up with oncoming globalization. Industry 4.0 and smart manufacturing are the major new phase shift at the foot of Indian industries. The research presented can help industrial personnel about the current scenario of Industry 4.0, smart manufacturing and sustainable manufacturing. The various practices of smart and sustainable manufacturing can be adopted at industrial level for increased profits. The study and questionnaire shown can be further used to analyse and understand the connections of various manufacturing parameters with smart and sustainable manufacturing. An implementation model can be derived from the study which can be comprehensive and give a descriptive guide for industry managers to adopt smart manufacturing.
Footnotes
Appendix
Declaration of conflicting interests
The author(s) declared no potential conflicts of interest with respect to the research, authorship, and/or publication of this article.
Funding
The author(s) received no financial support for the research, authorship, and/or publication of this article.