
Abstract
Attributes required for soccer performance may be developed through involvement in pitch-based training and its interaction with growth and maturation processes even in the absence of specific strength, speed, and power training. This study was designed to investigate the effects of training stimuli and its interaction with growth and maturation on changes in physical performance over a 7−8-month period. Highly-trained youth soccer players affiliated to a professional soccer club (PSA; age: 13.8 ± 0.53, stature: 162.8 ± 8.3 cm, body mass: 52.2 ± 7.1 kg) exposed to both pitch-based training and strength, speed, and power training, were compared to amateur (ASA; age: 14.3 ± 0.53, stature: 166.8 ± 8.9 cm, body mass: 55.4 ± 7.7 kg) players that undertook pitch-based training alone. Two age groups from each club completed an isometric squat test (ISqT), countermovement jump (CMJ), 10 m, 20 m, and 30 m sprint tests. PSA players improved (p = < 0.001 and 0.023, respectively) CMJ and ISqT relative peak force (rPF) scores by 3.53 cm and 6.75 N/kg respectively, compared to the ASA players. Maturation improved (p < 0.05) performance in all physical tests and metrics apart from ISqT rPF. The results suggest that maturation combined with pitch- and specific training results in greater improvements in muscle force production and CMJ height compared to maturation pitch-based training alone. Although maturation processes likely contributed towards a significant proportion of the improvements in aforementioned characteristics, practitioners should consider programming additional tailored training strategies to optimise these effects.
Introduction
Muscular strength and power are required to cope with match demands among soccer players. 1 Stronger and more powerful individuals are able to produce larger ground reaction forces (GRF), a key mechanical underpinning of jump, change of direction speed, and linear sprint performance.2,3 Evidence corroborates strong relationships between strength-based performance tests and surrogates of soccer performance such as sprint speed, 4 change of direction performance, 5 and jumping ability. 6
Maximum running velocities, accelerations, and high intensity running distance have been suggested to increase in youth soccer match play with progressions in age groups.7–10 The development of strength, speed, and power capabilities is important as youth players progress through a professional football academy, 11 with reliance on these capabilities increasing with player age 12 as a result of the aforementioned increments in high-intensity match demands. These attributes demonstrate discriminant validity in distinguishing between players who are at a more progressed stage along the development pathway compared to those at earlier stages. 13 Furthermore, less mature individuals have been shown to develop strength and power at a slower rate compared more mature individuals following specific training, 14 with more mature individuals displaying larger muscle thicknesses compared to their more immature counterparts. 15 Therefore, monitoring physical development in youth soccer players is fundamental to evaluate the efficacy of implemented training programmes. 16 Although cross-sectional studies corroborate the need for strength and conditioning programmes to develop these characteristics in academy settings,13,17,18 they are unable to disentangle the influence of growth and maturation from the training stimulus on these adaptations.
Comprehensive evaluation of muscular strength, speed, and power development in youth soccer is complex in an applied environment. Differences in maturity status may affect the changes in physical performance across players within the same age group,14,19 thereby masking the extent physical performance changes are due to training alone. Whilst the magnitude of change may depend on an individual's maturation stage, performance changes may be observed in youth over as little as 6 weeks following specific training.20,21 In addition, even in the absence of specific training, maturation changes alone may exert an influence on physical performance over ∼2−5 years,22,23 or while combined with soccer specific training. 24 Therefore, it could be speculated that maturation and soccer specific training could interact to induce changes in physical capabilities. However, research has not yet elucidated how this interaction affects youth soccer players’ physical performance characteristics over time. Indeed, to the authors’ knowledge a longitudinal study has not been conducted to determine and compare the changes in strength, speed, and power performance obtained via pitch-based or pitch-based and structured strength training while controlling for maturity stage. Therefore, the aim of this study was to investigate the combined effects of maturation, specific (strength, speed, and power) training, and on-pitch soccer training in a group of highly trained youth soccer players compared to the influence of maturation and soccer training alone in a group of amateur soccer players over a 7–8-month period. It was hypothesised that maturation would contribute to physical performance, and additional specific training would further optimise these effects.
Materials and methods
Research design
This study employed a longitudinal cross-sectional experimental design. Two age groups (U14 [PSA: 13.2 ± 0.2 years; ASA: 13.3 ± 0.5 years] and U15 [PSA: 14.6 ± 0.4 years; ASA: 14.7 ± 0.3 years] at study start) from two academies of differing competitive levels (four cohorts in total) completed sprint speed, jump, and power tests at baseline (testing session 1 [T1]) and 7−8 months later (testing session 2 [T2]). The two academies were identified as a professional soccer academy (PSA; age: 13.8 ± 0.5 years, stature: 162.8 ± 8.3 cm, body mass: 52.2 ± 7.1 kg, percentage of estimated adult height [%EAH]: 91.2 ± 2.8%, at study start), and an amateur soccer academy (ASA; age: 13.9 ± 0.8 years, stature: 165.8 ± 12.3 cm, body mass: 58.3 ± 17.4 kg, percentage of %EAH: 94.1 ± 3.7% at study start). Performance tests were performed across different days on consecutive weeks at the same time of day. However, the interval between performance tests did not differ longer than one month resulting in non-significant changes in maturation between these timepoints (change in %EAH: PSA: 2.3%; ASA: 1.2%). The data collection took place between the end of the season to midway through the following season for the PSA group, and in season for the ASA, as both academies had different seasonal timings. All positional groups were involved in the testing.
Participants
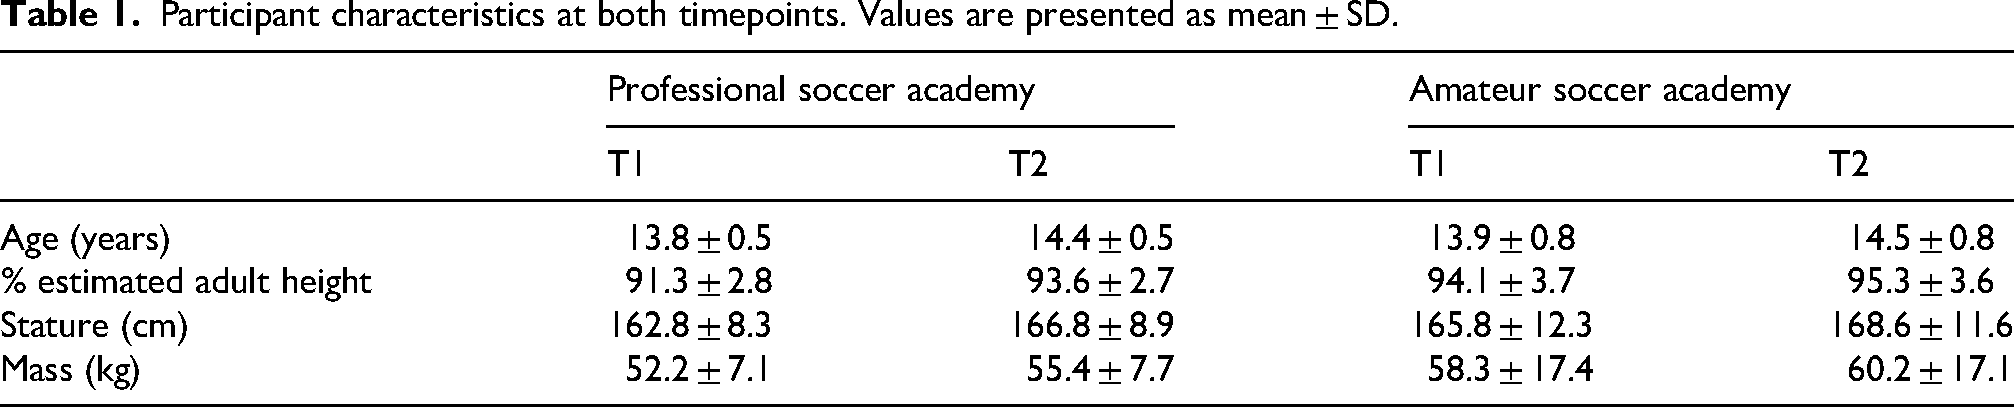
Fifty non-injured youth soccer players (Table 1) participated in this study. Due to high rates of unattendance at one or more testing sessions, the final number of participants completing both testing sessions for all performance tests was 11 in the PSA group and 10 in the ASA. The PSA group were routinely involved in 3 athletic development-based sessions for a total of 2 h per week (Figure 1). The PSA group participated in 5 pitch-based sessions per week for a total of ∼6 h and competed at the national level. The ASA participated in 2 sessions per week for a total of 3 h and competed at the local level. Therefore, the PSA players may be considered highly trained and the ASA players as trained/developmental. 25 The ASA group did not participate in regular targeted and supervised strength- or power-based training. Both groups competed in one match per week across the duration of this study on average. All procedures were conducted in accordance with the declaration of Helsinki and were approved by an institutional Ethics Board prior to study initiation.
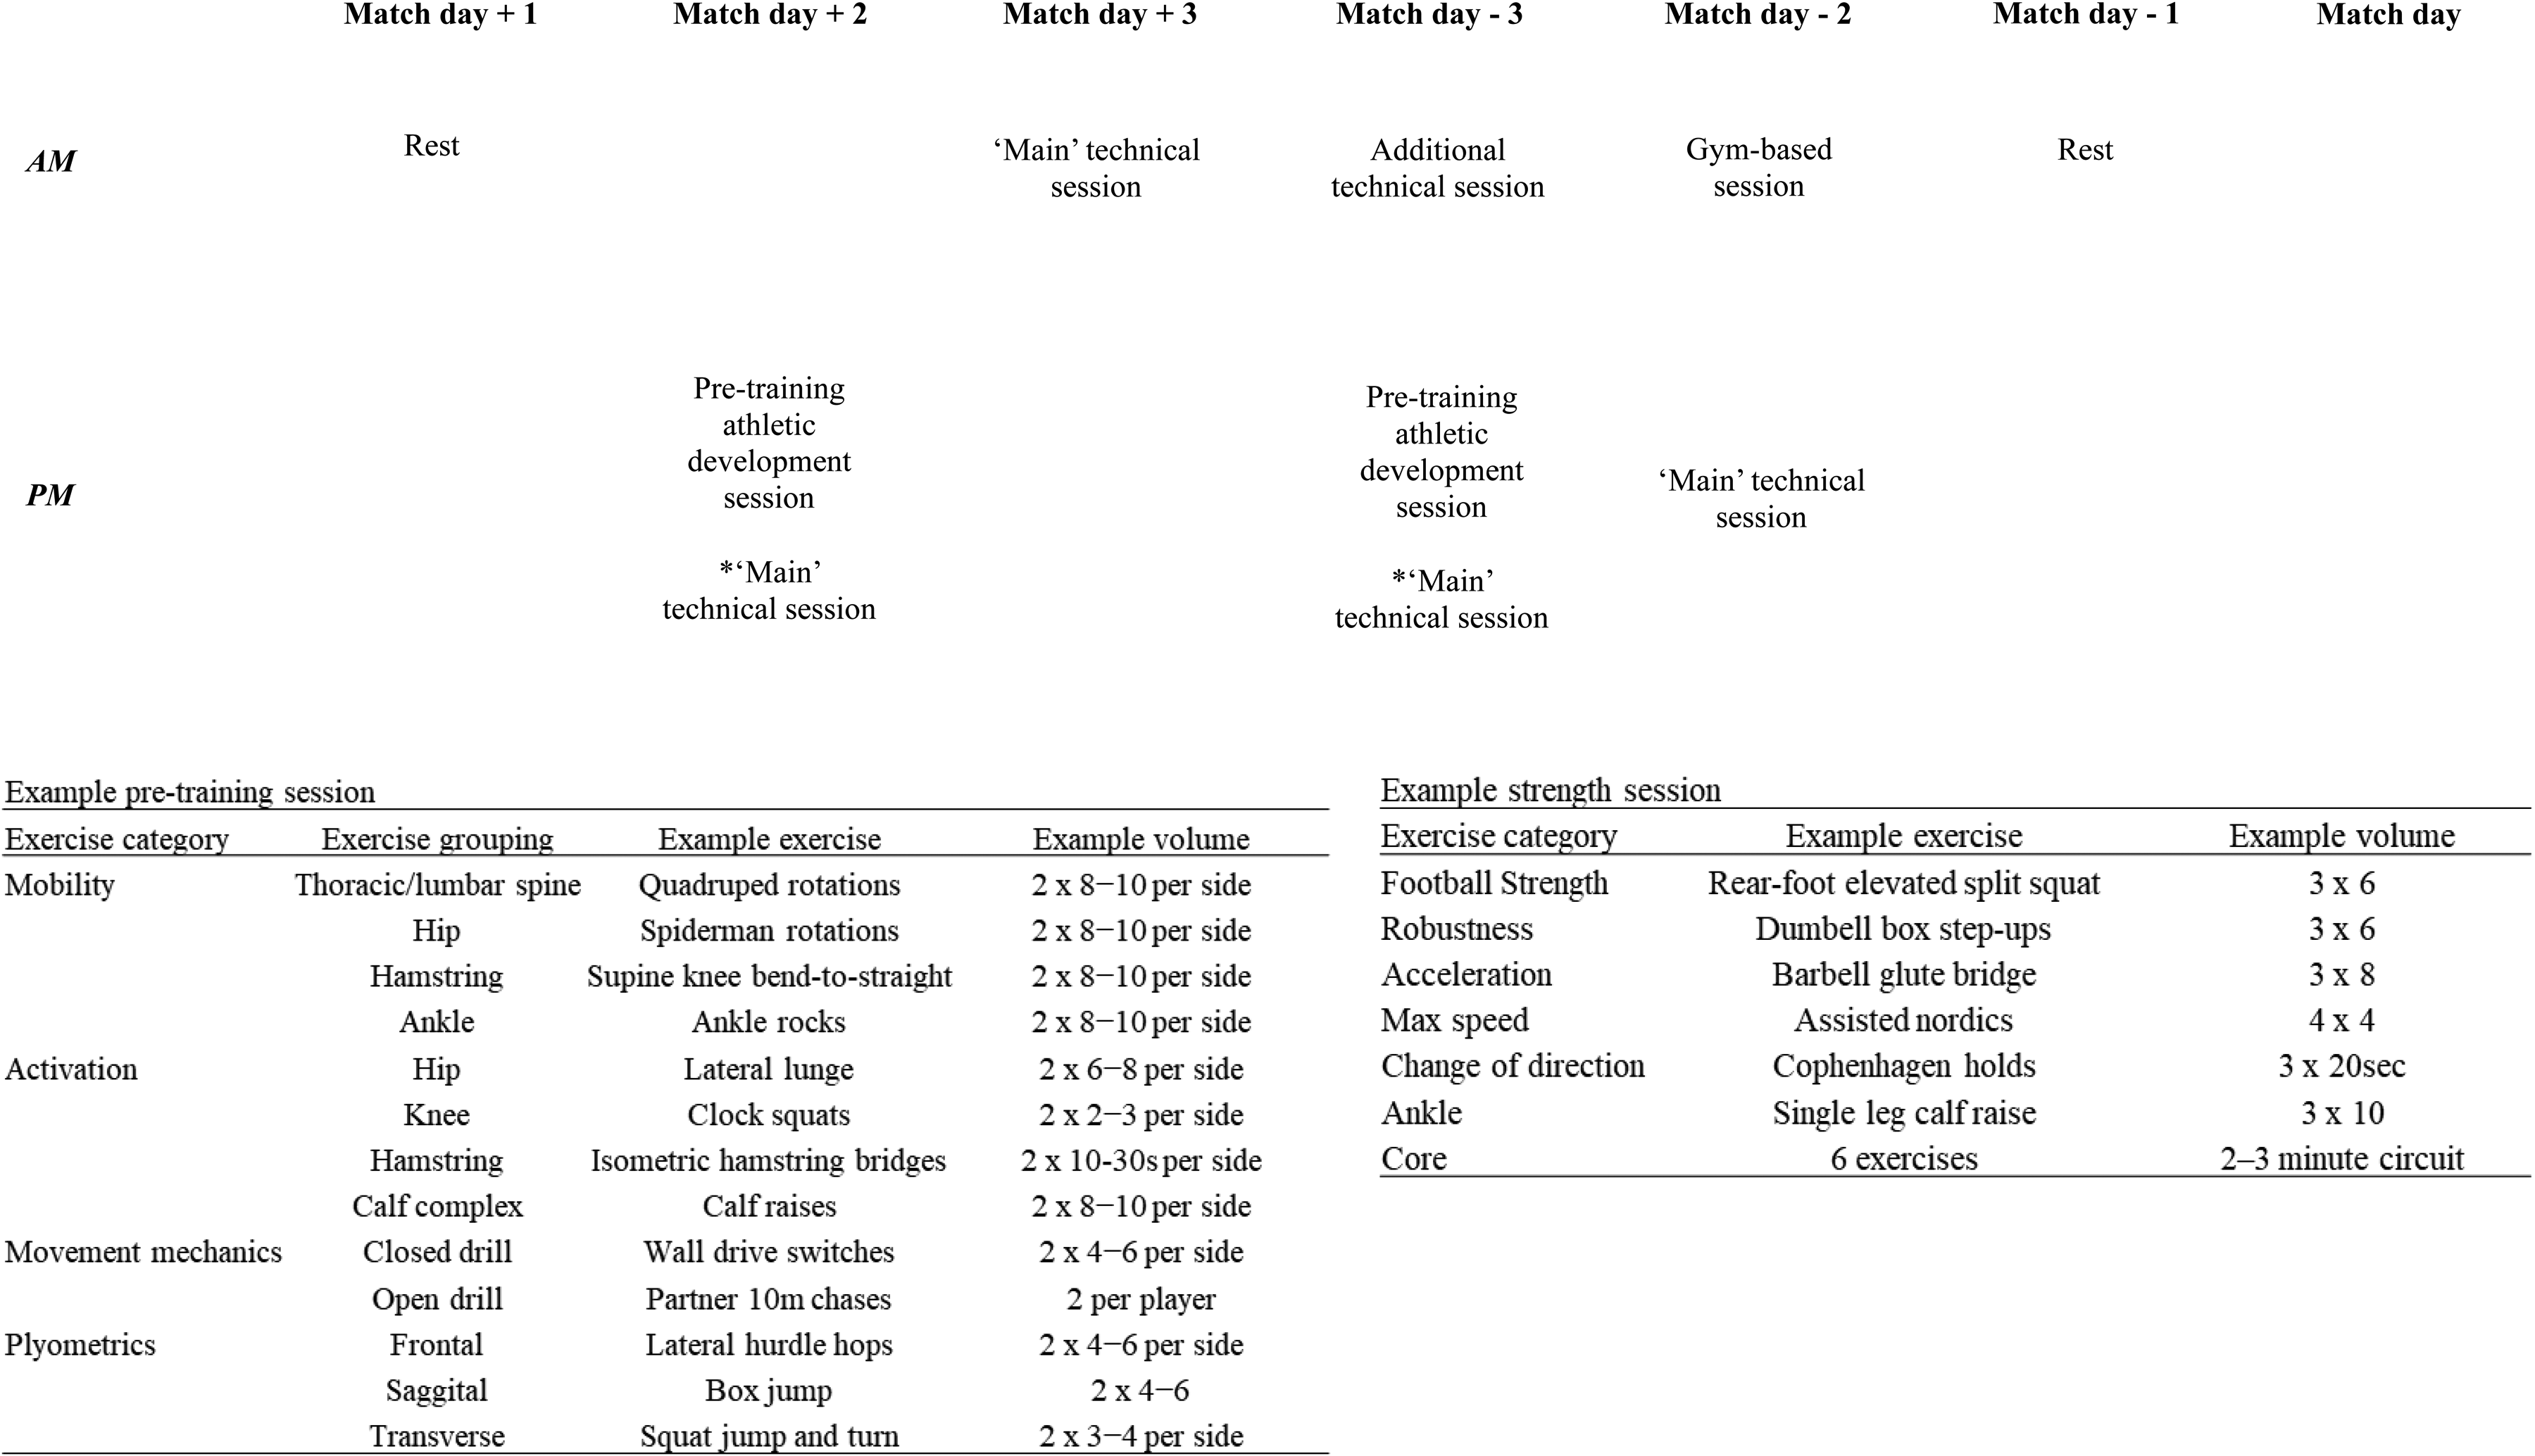
Example training schedule and athletic development sessions for the PSA group.
Participant characteristics at both timepoints. Values are presented as mean ± SD.
Procedures
Anthropometric measurements and adult height estimation
Standing stature (cm) was measured using a portable stadiometer (SECA, UK) to the nearest 0.10 cm. Stretch height was measured as the distance from the standing surface to the vertex of the head. Participants removed shoes and stood with an erect posture and the head was positioned in the Frankfort horizontal plane. Participants were instructed to maintain this position while gently inhaling. Percentage of estimated adult height was estimated using equations specific to European males’ chronological age based off mid-parent height. 26 The age-specific equations included chronological age, height and weight of the participant, and mid-parent height. Biological parental heights were adjusted for overestimation. 27 Body mass was measured prior to each jump or isometric squat testing using a force plate system (Forcedecks, Vald Performance, Newstead, Australia).
Physical performance testing
Prior to each session, a standardised warm-up lasting approximately 5 min consisting of dynamic mobility and activation (dynamic squatting, dynamic mobility, glute bridging, and lunging activities) were carried out. Participants completed testing in the following order: counter-movement jump (CMJ), isometric squat test (ISqT), and sprints.
Counter-movement jump
Participants completed three CMJ trials interspersed with approximately 30 s recovery with the best result utilized for further analysis. After an initial stationary phase of at least 2 s in the upright position, jumps were performed with arms akimbo so to eliminate the contribution of arm swing to jump performance. 28 Participants squatted to a self-selected depth and then pushed into the ground to accelerate upward attempting to gain maximum height. Subjects landed back, with their arms kept akimbo throughout the movement. If participants’ hands moved from their hips, the jump was repeated. CMJ height (cm) was assessed using the impulse:momentum relationship with a force plate system with a sampling rate of 1000 Hz (Forcedecks, Vald Performance, Newstead, Australia). Onset threshold was defined as the first ≥ 20 N instantaneous force output rise above the value of the weighing period. A fourth-order Butterworth low-pass filter with a cut-off frequency of 50 Hz was used to generate all the metric variables. Intra-session reliability statistics indicated acceptable reliability for jump height (CV: 6.3%; ICC: 0.98).
Isometric squat test
Participants underwent a familiarization session of the bilateral ISqT procedures prior to the experimental sessions, which were administered as described previously from our research group. 29 Briefly, participants carried out three warm-up bilateral isometric squats at 60%, 70% and 80% of their perceived maximum effort using a custom isometric rack with an adjustable bar height to the nearest 7 cm (IndigoFitness, Nuneaton, England). Portable dual-force plates (VALD Performance, ForceDecks, Queensland, Australia) were positioned directly below the isometric bar within the isometric rack and recorded GRF data at a sampling frequency of 1000 Hz. The body configuration adopted during the efforts was fully and autonomously selected by each participant (knee joint angle: 135.3 ± 7.6°; ICC: 0.77−0.88; CV: 6.9−10.8%; 29). Participants were instructed to lightly press their shoulders against the bar, and be ready to push in order to remove slack from the bar, remove space between the bar and the support, and minimise early compliance as a result of skeletal muscle compression during the maximal effort. 30 Participants were then instructed to hold this position and pressure against the bar to obtain a steady weighing period. A 1−3 s weighing period 31 was ensured prior to each isometric effort and confirmed by the researcher through visual inspection of the live force-time trace. Participants were then instructed to push the ground as hard and as fast as they could 32 following the auditory cue “GO” to initiate the start of contraction. Trials were stopped and discarded if participants force-time trace displayed a large (> 50 N) countermovement during the weighing period prior to the effort, reported any pain due to the test, or in the event of movement occurring (e.g., participant anteriorly rotating hips and rounding their lumbar spine, changing hip or knee angles by ‘shifting’ under the bar while pushing) during the trial. Contraction onset was defined as the first instantaneous force output rise ≥ 20 N above the value of the weighing period and was confirmed as the true onset by the researcher prior to final analysis. The methods collected for subsequent analysis were absolute peak force (PF), recorded as the highest instantaneous force recorded during a testing session; relative PF (rPF), calculated as PF divided by the participants body mass; and impulse at 50 ms (IMP50), 100 ms (IMP100), 150 ms (IMP150), and 200 ms (IMP200) 33 calculated by dividing the force at the relative time interval by the time duration. A fourth-order Butterworth low-pass filter with a cut-off frequency of 10 Hz was used to generate all the metric variables. If a 250 N change between ISqT trials occurred for an participant an additional trial was conducted and the outlier thereafter discarded. 34
Sprint assessment
Time to complete 10 m, 20 m and 30 m sprints were measured using single-beam timing gates set at a 0.75 m height with error detection (SmartSpeed, Vald, Queensland, Australia) previously shown to hold acceptable error rates of ≤ 0.03 s 35 and test-retest CVs (1.9−3.5%) and ICCs. 36 Sprint times were recorded for each 10 m intermediate split distance along the 30 m sprint. Players self-determined the sprint start from a 2-point start and timing commenced when the player passed through the first timing gate positioned 1 meter after the starting line. Players were required to be completely still prior to starting and were not permitted to rock or step forward prior to the start of the sprint. Each athlete was instructed to maximally sprint past a set of cones positioned 2.5 meters after the last (30 m) timing gate to ensure full effort was maintained for the full 30 m distance. Test-retest reliability of sprint assessment in youth has reported CV and ICC values of 1.3% and 0.90−0.96 respectively. 37
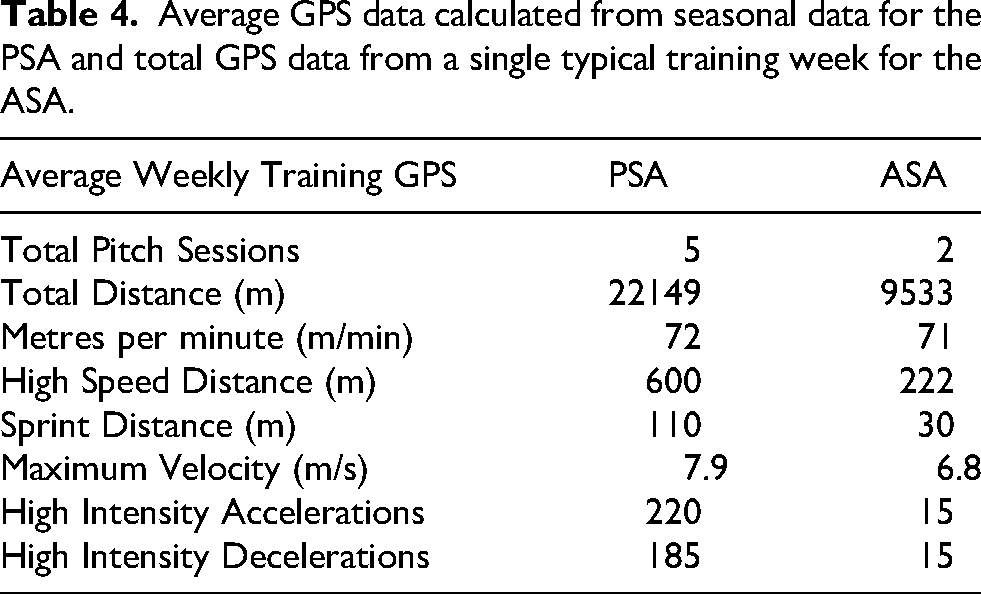
Monitoring of external load during pitch-based training sessions
External load was monitored during pitch-based training sessions for both PSA and ASA to provide a general overview of physical outputs throughout a typical training week. Training load metrics included total distance (m), metres per minute (m/min), absolute high speed (> 5.5 m/s) running distance (m), sprint (> 7 m/s) distance (m), maximum velocity (m/s), high intensity acceleration (> 2 m/s2) and deceleration (< −2 m/s2) efforts. The PSA carried out in-week periodisation which remained constant throughout the playing season. Briefly, four main pitch-based sessions were carried out which focused on small-to-moderate sized areas per player on a match day + 2; moderate-to-large area sizes per player on a match day + 3; high intensity running on a match day – 3; and match preparations on a match day – 2 (Figure 1). External loads from a typical in-season training week were monitored using Catapult Vector S7 unit GPS technology (Catapult, Melbourne, Australia; reliability statistics have been reported previously 38 ). Each participant was assigned a GPS unit, which was embedded in a vest worn the during the training sessions. Outdoor GPS measurements were measured at 18 Hz with a local positioning factor of 10 Hz and integrated 100 Hz accelerometer. GPS data was downloaded using the Catapult Openfield (version 3.7.3) software and stored on the online cloud storage platform for further analysis. Multiple weekly training loads were recorded and averaged for both squads and presented descriptively.
Statistical analysis
Age groups were pooled for the analysis for the PSA and ASA as maturation was controlled for in the statistical model. A linear mixed-effects model was used to evaluate the changes in physical performances between the two testing time points and teams as detailed below:
β0 represents the overall grand intercept and εi the residual error of the model. Team (β1; categorical variable with 2 levels: PSA and ASA), testing session (β2−3; categorical variable with 2 levels: T1 and T2), and EAH (β4; discrete variable ≤ 1.0) were treated as predictors of physical test performance changes (Y; i: individual participant), and were therefore analysed independently while controlling for the influence of the other predictor variables. 39 A team*time interaction was included in the model to determine if changes differed between teams across time points. Random effects were assumed for individual participants. Analysis was performed in R language and environment for statistical computing using the lme4, lmerTest, emmeans, and ggeffects packages. The assumptions of normality, heteroscedasticity, and the absence of multicollinearity were assessed using the performance package (version 4.0.5, R Core Team, Vienna, Austria). Interpretation of results replies upon change score estimates and their 95% compatibility intervals as opposed to dichotomously evaluating statistical significance through p values.
Results
Mean and standard deviation (SD) of performance test outputs for both teams are presented in Table 2. A significant interaction between team (i.e., PSA vs ASA) and timepoint was found for ISqT rPF and CMJ height (Table 3). On average, ISqT rPF (6.75 N/kg; 95%CI: 3.87–9.63 N/kg) and CMJ (3.53 cm; 95%CI: 0.53–6.54 N) improved significantly (p < 0.001 and p = 0.023, respectively) more among the PSA players compared to the ASA players over the study period after controlling for maturation (Table 3). A main effect of team was found for PF (p = 0.014), IMP150 (p = 0.045), IMP200 (p = 0.034), and 10 m sprint performance (p = 0.007), with all metrics significantly larger among PSA players than ASA players (Table 3). No significant effects of team or session number on 20 m or 30 m sprint performance were found (Table 3; all: p > 0.05). Maturation had a main effect (p < 0.05) on all performance tests apart from rPF (p = 0.001) when controlling for session number and team (Table 3). The average weekly pitch-based training GPS outputs for both sets of players is displayed in Table 4.
Average physical testing results at both timepoints. Values are presented as mean ± SD.
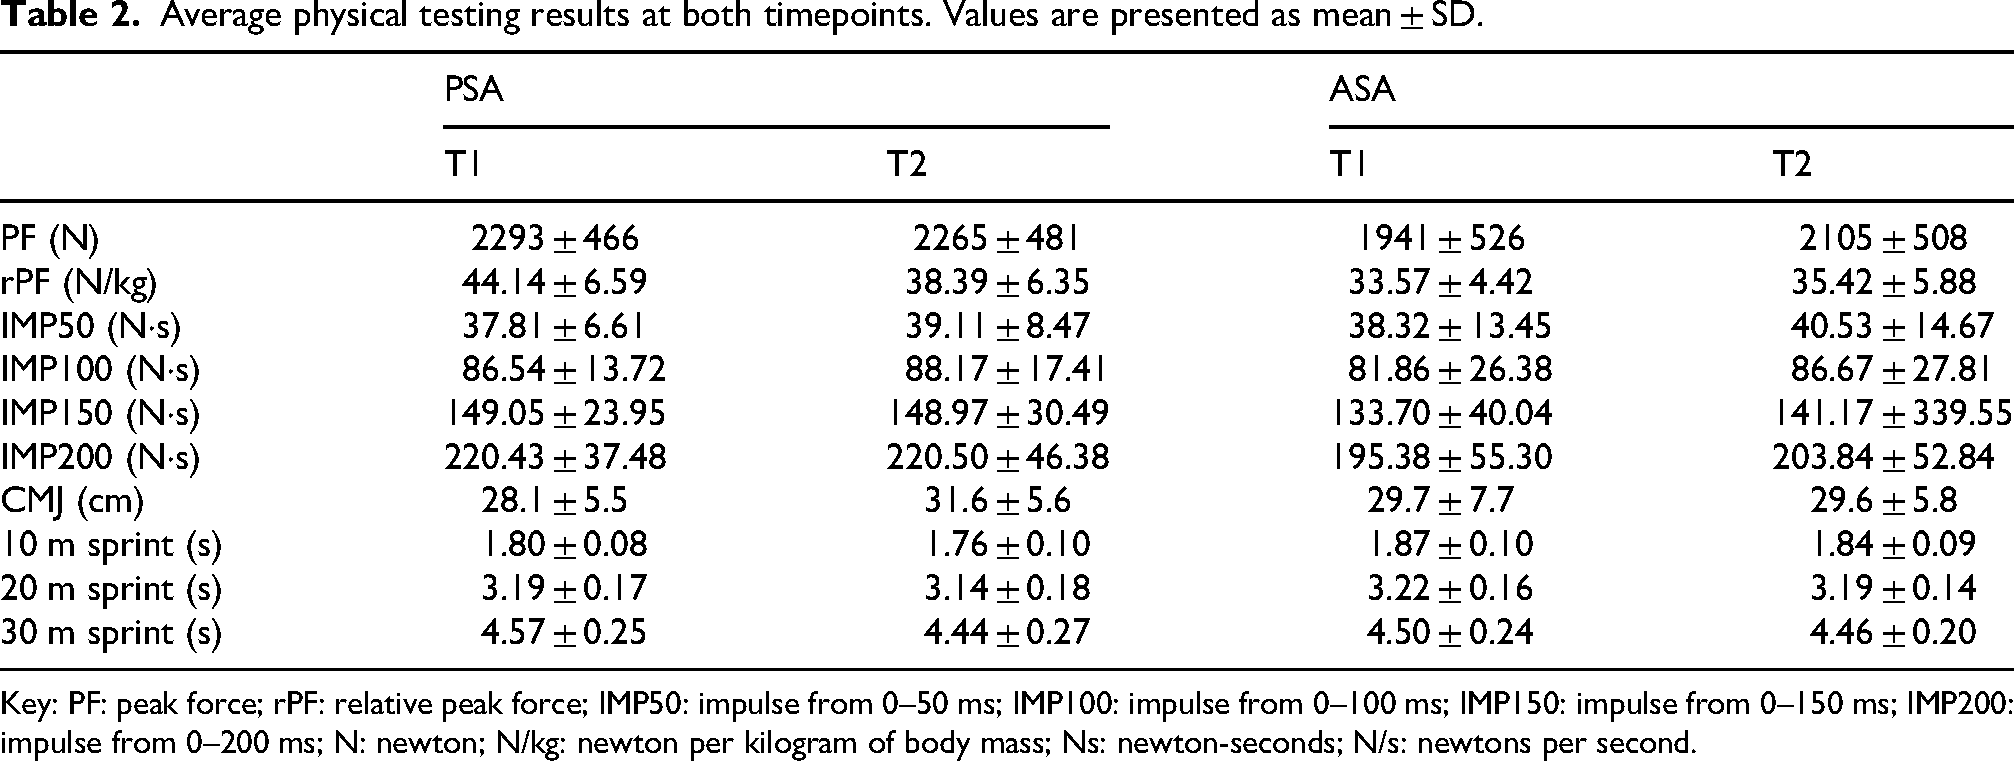
Key: PF: peak force; rPF: relative peak force; IMP50: impulse from 0–50 ms; IMP100: impulse from 0–100 ms; IMP150: impulse from 0–150 ms; IMP200: impulse from 0–200 ms; N: newton; N/kg: newton per kilogram of body mass; Ns: newton-seconds; N/s: newtons per second.
Main effects and interaction for changes in performance measures where values are representative of the ASA group compared to that of the PSA.
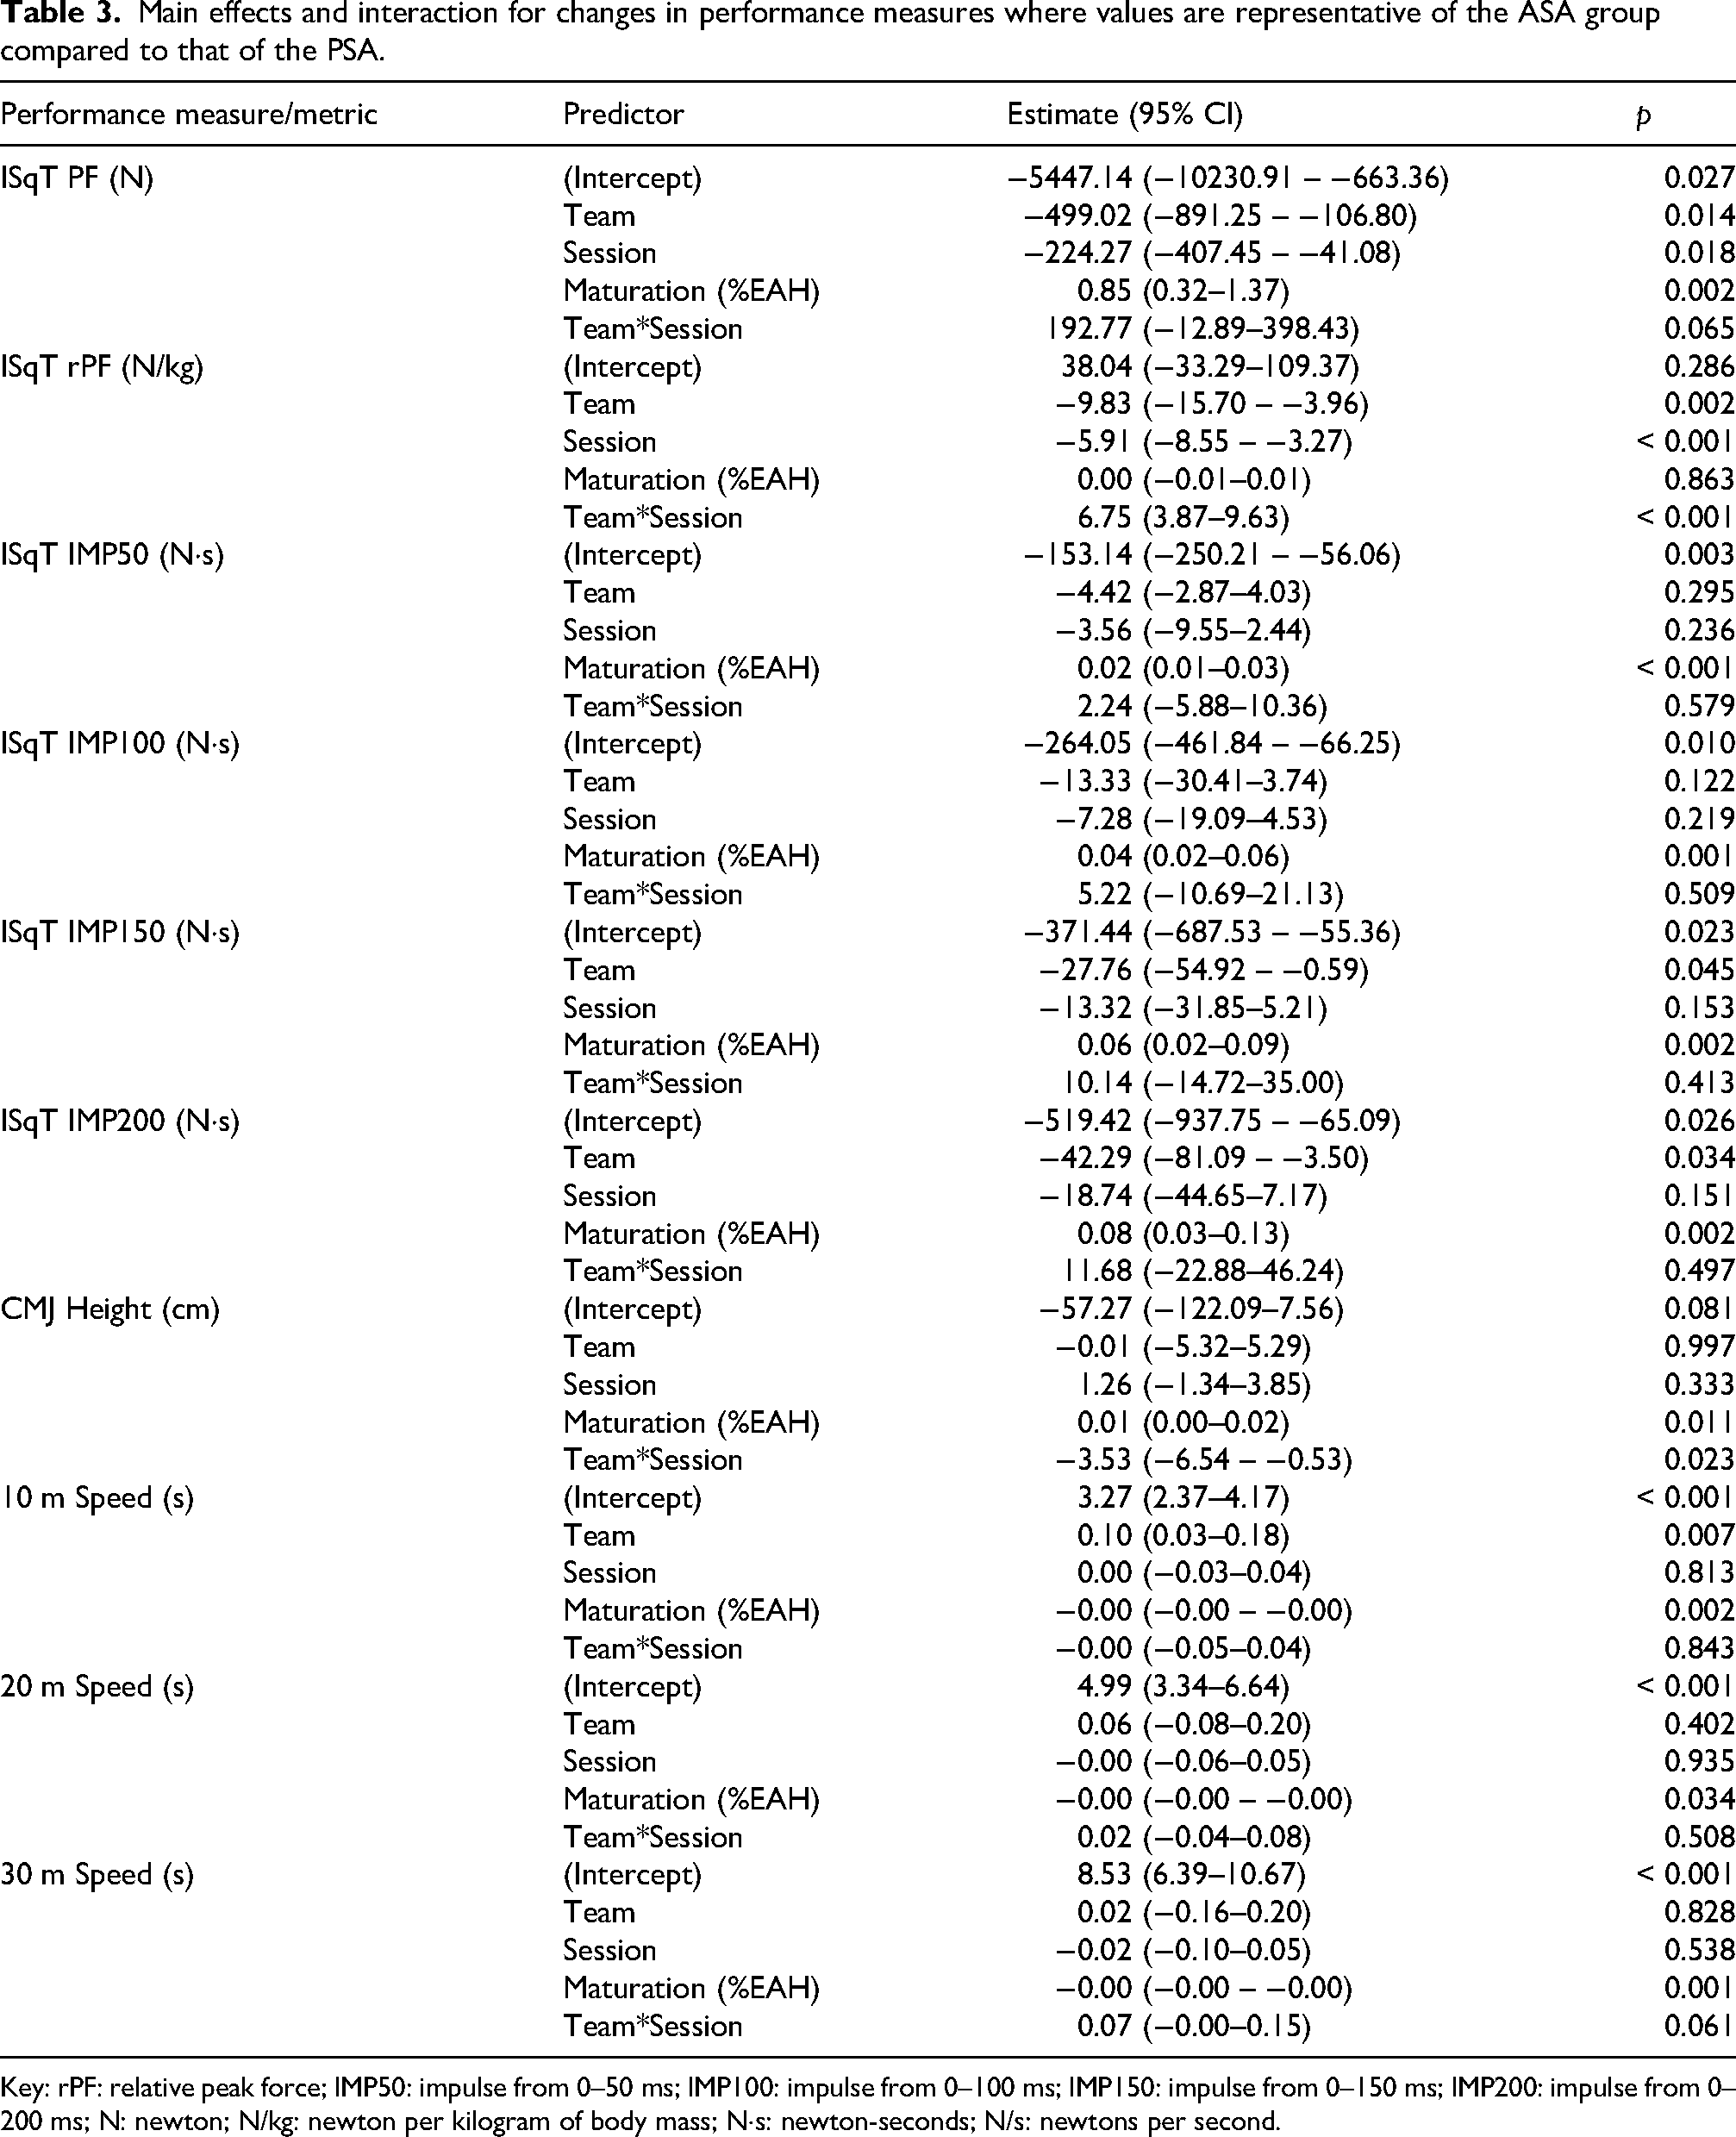
Key: rPF: relative peak force; IMP50: impulse from 0–50 ms; IMP100: impulse from 0–100 ms; IMP150: impulse from 0–150 ms; IMP200: impulse from 0–200 ms; N: newton; N/kg: newton per kilogram of body mass; N·s: newton-seconds; N/s: newtons per second.
Average GPS data calculated from seasonal data for the PSA and total GPS data from a single typical training week for the ASA.
Discussion
To the authors’ knowledge, this is the first study that investigated physical development in a group of highly trained 25 youth soccer players affiliated to a professional club compared to a control group of amateur players over a duration similar to a regular season, whilst controlling for the influence of maturation. The primary finding of the current investigation was that maturation influenced changes in physical performances in both PSA and ASA groups (Table 3). In addition, inclusion in a training environment which combines pitch and strength- and power-based training appears to promote greater improvement (Table 3) of ISqT metrics, CMJ height, and 10 m sprint performance over a 7−8-month period compared to pitch-based alone after controlling for maturation.
While a direct link between lower body force production capabilities and soccer-specific performance is difficult to connect, strength has previously been correlated with success in physical duels during match-play. 1 In the current investigation, ISqT PF was larger in the PSA group compared to the ASA group when controlling for maturation and session number (Table 3). In addition, rPF increased more over the study period in the PSA players compared to the ASA players when controlling for maturation as indicated by a significant (Table 3) team by timepoint interaction. Lower body maximal isometric force has previously been shown to likely improve in trained players compared to recreationally active age-matched control groups for pre- (age: 12.5 ± 0.7; maturity offset: −1.95 ± 0.63), circa- (age: 14.2 ± 0.85; maturity offset: −0.09 ± 0.64), and post-PHV (age: 15.7 ± 1.2; maturity offset: 1.52 ± 0.92) players over the course of a playing season 40 ; and 11−17 year old players over a 2-year period. 23 However, in the previously mentioned research, control groups did not compete in soccer specific training and so the performance change attributable to a combination of pitch-based training and maturity stage could not be elucidated.23,40 The increase in testosterone levels observed in youth male soccer players from the ages of 11 to 17 years old, 23 combined with specific training, has been suggested to enhance the development of lower body force production capabilities.40,41 While maturation had a statistically significant effect on maximal isometric force in the current study while controlling for the other variables (Table 3), participation in a strength and conditioning programme during adolescence was found to have an additive positive effect on maximal strength characteristics of soccer players whilst controlling for a proxy of maturation. Therefore, in order for youth soccer players to develop strength characteristics during adolescence, it may be recommended to undertake specific strength training,11,42 as the influence of maturation may not yield optimal adaptations and development alone (Table 3).
Similarly, ISqT IMP150 and IMP200 metrics were shown to be greater the PSA players compared to the ASA players (Table 3), but did not change differently for each group over the study period. However, IMP50 and IMP100 metrics were not significantly different between groups and did not change differently for the PSA group compared to the ASA group. To the authors knowledge, the current study is unique in evaluating longitudinal changes in impulse metrics derived from the ISqT. Due to the similarities in CMJ ground contact times and impulse time epochs reported here (e.g., ∼200 ms), and the dynamic correspondence between the ISqT and CMJ, it could be suggested that ISqT impulse has similar demands as required to perform a CMJ. However, while concentric impulse, similar to that recorded via the ISqT, has been suggested as a strong predictor of CMJ height, 43 no ISqT impulse metric recorded in the current study improved significantly over time for the PSA despite CMJ height improving significantly more for this group (Table 3). However, although CMJ concentric impulse and ISqT impulse are likely correlated, they may not improve comparatively as a result of specific training, with other strategy- and eccentric-related factors likely also contributing to improvements CMJ performance. 44
Jump height has previously been shown as related to heading success during match play, independent of stature in youth soccer players. 1 In the present study, we found a larger improvement of 3.53 cm in CMJ height in the PSA compared to the ASA players at circa-PHV after controlling for maturation (Table 3); a change suggested as meaningful for this performance test 40 and which exceeds previously published technical error statistics in youth soccer for this metric 45 further suggesting this as a meaningful change. In agreement with the current study, Morris et al. 40 evaluated differences in physical performance characteristics in circa-PHV highly-trained soccer and control groups over the course of a playing season and identified a greater increase in CMJ height in the professional group while controlling for maturation and initial test scores. Similarly, while controlling for the same variables, Wrigley et al. 40 demonstrated a greater improvement in CMJ height in a professional compared to a recreational control soccer group, both of which estimated as circa-PHV at the beginning of their 3-year study. It is likely that changes in CMJ height are greater as a result of training around circa-PHV individuals compared to those who are post-PHV. 46 CMJ height performance improvements as a result of growth and maturation appear to have been enhanced through specific training in the PSA group in the current study. Therefore, individuals working to improve jump height in youth individuals should aim to incorporate specific training aimed at developing force production capabilities, movement velocity and strategy optimisation throughout adolescence.
Sprint performance changes in the present study displayed smaller differences between groups compared to that of some previous research.41,47 However, the study period of previous research was 2−3 years in duration, with any chronic effects in sprint performance developing across a period at least 2 years longer than the current study. In addition, previous studies23,40,47 often included school children not participating in soccer via structured training within an academy setting as controls. Therefore, the participants of this research would naturally have a greater adaptative potential compared to the ASA players of the current study. This may explain some contrasting findings between this study and the previous evidence.
Physical performance talent identification indicators of soccer tend to consistently include sprint performance48–50 and it is possible sprinting capabilities improve through soccer participation, due to the demand to perform high intensity running activities during soccer match play (Table 2). 9 This may be a primary reason for some subtle differences in the results of the current study and those of previous research.23,24,40,41,47 For example, the accelerated development of maximal strength compared to sprint performance over a 2-year period in highly trained youth soccer players undertaking strength and power training compared to those participating in soccer training only has been demonstrated previously. 41 Additionally, a recent meta-analytical review demonstrates a lesser transference of resistance training to sprint performance compared to strength, jump, or power performance. 51 However, this research did not control for the impact of maturation on physical performance change.
The PSA group displayed significantly faster 10 m sprint times compared to the ASA regardless of timepoint and when controlling for maturation but did not change differently compared to the ASA, with no other team or timepoint interactions observed for either 20 m or 30 m performance (Table 3). This is surprising, particularly for the 10 m sprint performance as rPF and CMJ height improved significantly more over the study period for the PSA group compared to the ASA group, which indicates an improved ability to overcome inertia given acceleration is determined by increasing force output in shorter timeframes. In addition, the body mass of the PSA players likely increased over the intervention period (indicated in Table 2), thereby requiring even greater GRFs to overcome inertia. However, when controlling for maturation in the analysis both body mass and stature were included through the use of %EAH, with rPF also been shown to increase over the study period irrespective of changes in maturation which would indicate greater force production capabilities relative to body mass (Table 3). It is also likely that the training employed was not sufficient or sufficiently targeted at gaining improvements in running velocity to promote development of this capability.
It is therefore unclear whether the additional strength, power, and pitch-based training had a positive effect on PSA sprint performance in the stipulated timeframe. Indeed, resistance training adaptations have been suggested to have limited transference to sprint performance. 52 This is likely due to the higher requirement for coordination and movement skills compared with other performance characteristics, such as jumping, 53 and the lesser dynamic correspondence between resistance training exercises and sprinting. Higher on-pitch training volumes often experienced by youth PSA (Table 4) has been suggested as detrimental to sprint capabilities development, but not strength-based performance. 40 However, given the training programme illustrated in Figure 1 incorporated resistance, movement mechanic, plyometric, and sprint training, statistically significant changes would be expected over the study period.
Sprint performance has been shown to decrease due to high training loads, 54 potentially as a result of insufficient recovery, 55 rationalising the suggestion to avoid high workloads in the developing adolescent athlete, regardless of maturation status. 56 Conversely, it could also be argued that the training volumes the PSA players were exposed to throughout the current study period may have hindered optimal sprint development. However, it was outside the scope of the current investigation to monitor pitch-based loading week-to-week for both groups. Although annual data was used to determine the PSA average weekly GPS outputs (Table 4), it was not possible to use training load as a covariate in the statistical model in the current investigation. Further research controlling for the methodological contributors to change in sprint performance may therefore be required.
Despite this the PSA displayed greater performance in 10 m sprint times, IMP150 and IMP200 compared to the ASA when controlling for maturation and the time of assessment (Table 3). This is consistent with some previous research 57 which indicated IMP200 to correlate strongly with shorter distance acceleration (0–5 m) performance, but not sprint running over longer distances or split distances (10–20 m, 20–30 m, and 0–30 m). Indeed, the acceleration phase of sprint running has been suggested as characterised by longer (∼200 ms) GCTs allowing an individual more time to develop force.58,59 It is therefore likely that the PSA players were able to produce higher GRFs (as indicated in ISqT rPF performance) during longer GCTs, but perhaps lacked the ability to do so in faster timeframes as is indicated by the lack of difference in IMP50 and IMP100 between teams or over the intervention period (Table 3). Producing force in shorter (e.g., < 140 ms) timeframes would appear an important ability to influence performance in late acceleration (e.g., ∼ 20 m) and sprint running (e.g., ≥ 30 m) phases as GCTs decrease rapidly following early acceleration. Future research should therefore aim to determine how changes in force, and force generating capabilities translate to changes in global sprint performance.
Due to the potential influence of maturation on physical performance,14,60–62 the current and previous research40,47 opted to control for the impact of this variable on physical performance in longitudinal research. Due to the vast physiological changes which occur due to growth and maturation processes alone,
63
performance improvements may be augmented in adolescent populations24,40 Indeed, the results of the current study (Table 3) indicate that maturation at this chronological age exerts a positive effect on all evaluated measures of strength and power development. As a result, it is recommended that %EAH form the basis of performance prediction equations at this biological age such as provided in Table 3. For example, for any unit change (i.e., 1%) in %EAH, a corresponding increase/decrease of 0.01 cm (95%CI: 0.00–0.02 cm) in CMJ height on average is expected. To illustrate: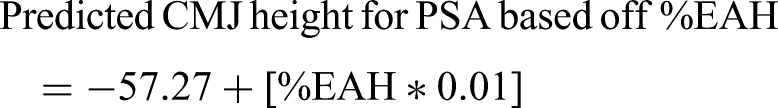
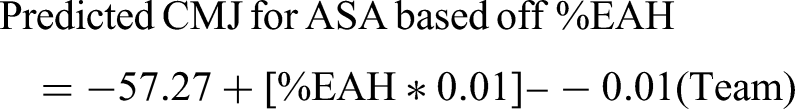
Indeed, differences in maturation status (e.g., pre-, circa-, post-PHV) have been shown to result in different magnitudes of change over the course of a playing season. 40 While the influx of circulating levels of hormones, primarily testosterone,63,64 due to the onset of puberty do not directly have an effect on physical performance, changes which occur as a result of this alteration in the hormonal milieu (e.g., increased fat-free muscle mass and increased muscle cross-sectional area) have been identified as strong predictors of strength and power related development in adolescent soccer players 23 It is therefore surprising that the PSA did not display greater improvements in speed and power related performance, due to this interaction of training and maturation. Therefore, future research should quantify the change in muscle morphological or motor recruitment characteristics which underpin strength and power development and compare this change to that in performance measures.
This study has a few limitations worthy of discussion. First, while the current research holds high levels of ecological validity because of data being collected in an applied setting, it was not possible to control testing conditions and readiness as would be expected from laboratory-based studies. Second, the participants were youth soccer players, thereby limiting the transference of results to other populations. Third, the weekly training loads elicited by each soccer academy were also noticeably different in the current research. This highlights a significantly higher level of service provision is offered to PSA players. Future studies should therefore aim to counterbalance groups’ pitch-based training loads, and service provisions to fully elucidate the impact of combined growth and maturation processes and pitch-based activity. Indeed, given the potential that pitch-based activity could attenuate or blunt training effects, future research should aim to control for this variable in the statistical model. Lastly, the small sample size in the current study limits the transference of results, future research should aim to evaluate longitudinal changes in physical performance with a greater participant number.
Conclusion
In summary, the current study provides evidence of the longitudinal improvement in physical performance characteristics in youth soccer players after controlling for maturation. Comparative changes between PSA and ASA indicate the efficacy of professional soccer academy training practices augmented by growth and maturation. However, it should be noted that the primary aim of strength and conditioning programmes for individuals of similar chronological age as the PSA at the study commencement is to develop movement proficiency and technical exercise competency as opposed to performance improvements. Although the neuromuscular adaptations associated with improvements in movement competency and proficiency would also contribute to improved performance, the extent at which this is likely to occur is reduced compared to improvements in physical capabilities or a combination of the two. This may have contributed to the lack of performance change observed in some tests (Table 4). However, the current research has shown specific training is likely to be required to promote gains in maximal strength-related performance above that obtained through growth and maturation processes alone. In conclusion, the current study provides evidence to suggest that physical performance related change in adolescent soccer players varies depending on the physical metric evaluated, and may be dependent upon change in maturity status, or a combination of change in maturity and exposure to strength and power-based training. The current research indicates maturation is likely a main attributor for physical development in adolescent males, and likely significantly contributes towards the inter- and intra-individual variation associated with physical development through this period. However, applied practitioners and coaches working with youth males are advised to implement a progressive and holistic specific strength and conditioning programme for the enhancement of physical qualities associated with movement competency, strength, movement velocity, and power throughout the players’ academy career.
Footnotes
Acknowledgements
The authors would like to greatly recognise the support of Celtic Football Club during the data collection process and thank the staff, players, and parents of players for their participation and contributions towards this study.
Ethical considerations
All procedures were conducted in accordance with the declaration of Helsinki and were approved by the University of the West of Scotland institutional Ethics Board prior to study initiation (submission number: 10522).
Consent to participate
Gatekeeper approval was obtained from the soccer academy the PSA players were associated with as testing procedures formed habitual procedures already in place at the club, with the right to withdraw from testing verbally communicated to the players by the lead researcher. Written consent was obtained from the ASA players and parents/guardians if the players were less than 18 years old.
Consent for publication
Not applicable.
Funding
The authors received no financial support for the research, authorship, and/or publication of this article.
Declaration of conflicting interests
The authors declared no potential conflicts of interest with respect to the research, authorship, and/or publication of this article.