
Abstract
The purpose of this study was to investigate the time-course of decrements in physical performance following a pre-match warm-up in soccer players. Knowledge of this information could be used to inform re-warm-ups and pre-pitch entry practices of soccer substitutes. Data were collected over five sessions with 12 male youth professionals (15–17 yrs). Across the five sessions each player performed countermovement jumps (CMJ) and drop jumps (30 and 40 cm), pre-warm-up, immediately post-warm-up, and following 10-, 20-, 30-, 40-, and 50-min of inactivity. Physical performance was assessed by jump height and calculation of reactive strength index (RSI). Hierarchical generalised linear models (HGLMs) were fitted within a Bayesian framework to identify plausible time to achieve 10 to 50% decrements of the initial pre to post warm-up improvement. Mean improvements of 5.4 cm (95%CrI: 4.8 to 6.0), 0.24 ms−1 (95%CrI: 0.19 to 0.29), and 0.32 ms−1 (0.27 to 0.36) were obtained for the CMJ, and RSI measured from the 30 and 45 cm box, respectively. Decrements for all assessments were non-linear with the steepest rates of decline measured in the initial periods following warm-up. High probabilities were calculated (p ≥ 0.979) that up to 50% of the initial warm-up improvement for the CMJ would be lost between 20 and 30 min. The results of this study provide a guide for future research and practitioners managing the pre-pitch entry of soccer substitutes. It is suggested that practitioners consider and assess the effectiveness of exposing players to a re-warm-up between 20- and 30-min prior to pitch entry to maintain performance capabilities.
Introduction
The inclusion of a pre-match warm-up is widely accepted in sport and supported by research demonstrating performance improvements via metabolic, neural, and psychology-related effects. 1 It has been reported that soccer players generally perform 30-min pre-match warm-up routines comprising a range of low- to high-intensity activities. 2 Effectiveness of various routines have been researched by measuring performance in activities such as sprints and vertical jumps in either laboratory conditions3,4 or during matches with the use of time motion analyses. 5 Additionally, similar research designs have established the importance of the content of a warm-up, with Little & Williams 3 demonstrating greater improvements in acceleration and maximum sprint velocity with the inclusion of dynamic stretches.
Soccer warm-ups are generally completed by all players including starters and substitutes, however, substitutes are generally exposed to lengthy periods of inactivity prior to their pitch entry.6,7 These periods of inactivity are punctuated by brief and sporadic bouts of activity referred to as rewarm-ups.8,9 In a study conducted with English Championship players, it was identified that substitutes performed an average of 3 (±1) re-warm-ups per match, with successive bouts of activity decreasing in duration and increasing in intensity. 9 Increases in intensity were characterised by increases in relative total distance, moderate-speed running (>4 to ≤5.5 m.s−1) and high-speed running (>5 to ≤7 m.s−1). 9 Previous research 5 has shown that inactivity related decrements in physical performance can be reduced in soccer players through completion of rewarm-ups. Using a seven minute re-warm-up consisting primarily of low to moderate intensity jogging during the half-time break, Edlholm et al. 5 showed that players engaging in this activity maintained their in-game sprint performance, whereas those participating in a passive half-time break experienced significant (2.6%) reductions in velocity. Several mechanisms have been suggested to contribute to the benefits of re-warm-ups including maintenance of muscle temperature, generation of post-activation potentiation, stimulation of aerobic and anaerobic metabolism and psychological preparation. 1
Previous research has also demonstrated that more effective management of the pre-pitch entry of soccer substitutes can enhance subsequent physical performance. 10 Modifications including continuing education regarding the benefits of rewarm-ups and switching from player- to staff-led activities increased physical outputs of English Championship substitutes. 10 Specifically, following pitch entry substitutes covered ∼10% more total distance and ∼25% distance at high-speed for the first fifteen-minute period. 10 In a recent review profiling the pre-entry practices and responses of soccer substitutes, 8 it was suggested that observations detailing progressive increases in substitutes running performance as playing time increased and their reporting of negative emotions indicates a need for further development and research. Knowledge of the time-course of physical decrements following a pre-match warm-up may provide practitioners with important information to structure re-warm-ups and identify, for example, whether substitutes need to warm-up every 30-min, or more frequently to maintain their state of readiness and perform to the best of their capabilities. Therefore, the purpose of this study was to investigate the time-course of warm-up decrements following a soccer specific pre-match warm-up using assessment methods commonly employed in applied research. To identify points at which decrements were likely to be substantive, a Bayesian approach was used to model the time-course data. Bayesian approaches are generally more flexible than frequentist approaches that tend to focus on dichotomous outcomes (e.g. significant vs. non-significant), and can easily compare results to readily interpretable thresholds using subjective probabilities.
Methods
Design
A repeated measures design was employed with male soccer players collecting data from each participant over one-week to build time series models. The primary purpose was to quantify and model post warm-up decrements in explosive jumping activities over a 50-min period and translate the results into applicable findings. Each participant performed five experimental sessions separated by 24 h during the mid-season break. Each session required the players to complete a series of jumping activities that provided data at 3 time points, including 1) prior to warm-up; 2) immediately after warm-up; and 3) either 10-, 20-, 30-, 40- or 50-min post warm-up dependent on the specific session allocated. The order of sessions for each participant were randomised to minimise the likelihood of systematic order effects. Jumping activities included performance of a countermovement jump (CMJ) and drop jumps from a 30 and 45 cm box. Warm-up decrements were expressed as a percentage of the initial warm-up improvement to inform the practical applications of the results.
Participants
The sample comprised 12 male full-time professional players (age: 15–17 yrs, mass 62.5 ± 3.1 kg) attached to an U18 English Premier League Academy. The participants played a range of positions and were involved in regular training and competitive matches. All participants were informed of the study requirements and provided written consent to participate. Ethical approval for this study was provided by the School of Health Sciences Research Review Group, Robert Gordon University, UK.
Methodology
Prior to testing, participants were familiarised with the testing battery on three occasions to minimise the likelihood of learning effects. All testing was performed on an indoor artificial 4G pitch providing greater control over environmental factors such as ambient temperature. During the allocated inactivity periods the participants remained seated and watched a soccer game projected onto a large screen to simulate the general scenario experienced by substitutes. Performance was assessed through calculation of jump height and reactive strength index (RSI). The order of jumps was standardised for all testing sessions with drop jumps performed first according to ascending height, followed by the CMJ. A single jump was performed for each condition. RSI was calculated during performance of drop jumps and was used to provide an assessment of the participants' ability to change rapidly from an eccentric action to a concentric action. 11 RSI was measured by dividing jump height (m) by ground contact time (s) of the initial landing from the 30 and 45 cm box (denoted RSI30 and RSI45, respectively). Participants were instructed to jump as high as possible whilst minimising ground contact time. The CMJ was performed with the use of arm swing and participants self-selected their countermovement depth. Jump height and contact time were measured with the Opto-jump system (Microgate SARL, Italy).
The warm-up performed during each session was standardised and based on the recommendations of Cervantes and Snyder. 12 The routine comprised a progressive general cardiovascular warm-up, followed by a period of dynamic exercises and concluded with a sport-specific activity. In brief, participants began by jogging up the inside of a 15 m ‘channel’ and returning on the outside. Warm-up intensity was progressively increased by including faster paced jogging as well as the inclusion of dynamic exercises such as squats, lunges and arm rotations.13,14 This was followed by a short period of dynamic stretching of major muscle groups such as the quadriceps, hamstrings, gluteal and calf muscles. Finally, the skill specific component of the warm-up comprised paired passing where participants passed to each other over 15 m marked by cones. The time to complete the warm-up was 12.5 min.
Statistical analysis
The purposes of the statistical analysis were to: 1) quantify improvements in physical performance following warm-up; 2) model the time-series nature of the data following warm-up (e.g. from 0 to 50 min) and the subsequent decrements in physical performance; and 3) express the decrements as a percentage of the initial improvement due to warm-up; and 4) use variability in the data to quantify probabilities (e.g. probability that 50 min after warm-up at least 20% of the initial pre-warmup improvement is lost). All analyses comprised univariate analyses with the same models and processes used for three separate response variables including CMJ, RSI30 and RSI45.
All analyses were conducted within a Bayesian framework placing greater emphasis on describing the most likely results and their practical consequences in contrast to an over-reliance on dichotomous interpretations of results (e.g. with null hypothesis significance testing).
15
Estimates of the mean improvement following warm-up were estimated by conducting mixed effects regression models with the pre-warmup and immediately post-warm-up data. The following linear model was used:
To model jump performance data immediately following warm-up (time 0) and across the 50 min in absolute scale (e.g. cm and ms−1), hierarchical generalised linear models (HGLMs) were also fitted within a Bayesian framework. HGLMs accounted for structure in the data and were fitted to smooth the time series data identifying the underlying shape.
17
Two HGLMs were considered, each comprising a series of smooth functions (simple basis functions) applied to the whole group. The first HGLM considered was
To express post-warm-up decrements in a more practically relevant context, decrements were expressed as a percentage of the initial warm-up induced improvement. Uncertainty in model estimates were then used to calculate the probabilities that the group mean decrement would exceed given percentages (0 to 50% of warm-up induced improvement) across the measured time intervals. Using the posterior distributions of HGLM parameters (e.g. 5 chains each comprising 10,000 sets of posterior estimates), posterior predictions were made generating 50,000 new data sets comprising jump values of 12 individuals from 0 to 50 min. For each data set, means were calculated at each time point creating 50,000 group time series profiles. Decrements were then calculated in each data set by subtracting the value at a given time point from the immediate post-warmup value (e.g. time 0). The median posterior values for group improvements in CMJ, RSI30 and RSI45 were used to calculate percentage decrements. Probabilities were then calculated as the proportion of decrements that equalled or exceeded the percentage value selected (e.g. the probability that after 20 min of inactivity a 50% or greater decrement was obtained).
Results
ICCs and CVs measured for each outcome pre- and post-warm-up are presented in Table 1. Median estimates for All ICC values were greater than 0.8, and all CV values less than 12%, with results demonstrating greater reliability for outcomes measured post-warm-up. From pre-warm-up to immediately post-warm-up, average improvements were obtained of 5.4 cm (95%CrI: 4.8 to 6.0) for the CMJ, 0.24 ms−1 (95%CrI: 0.19 to 0.29) for RSI30, and 0.32 ms−1 (0.27 to 0.36) for RSI45.
Reliability statistics of pre- and post-warm-up measures (Median values with credible intervals provided for reliability statistics).
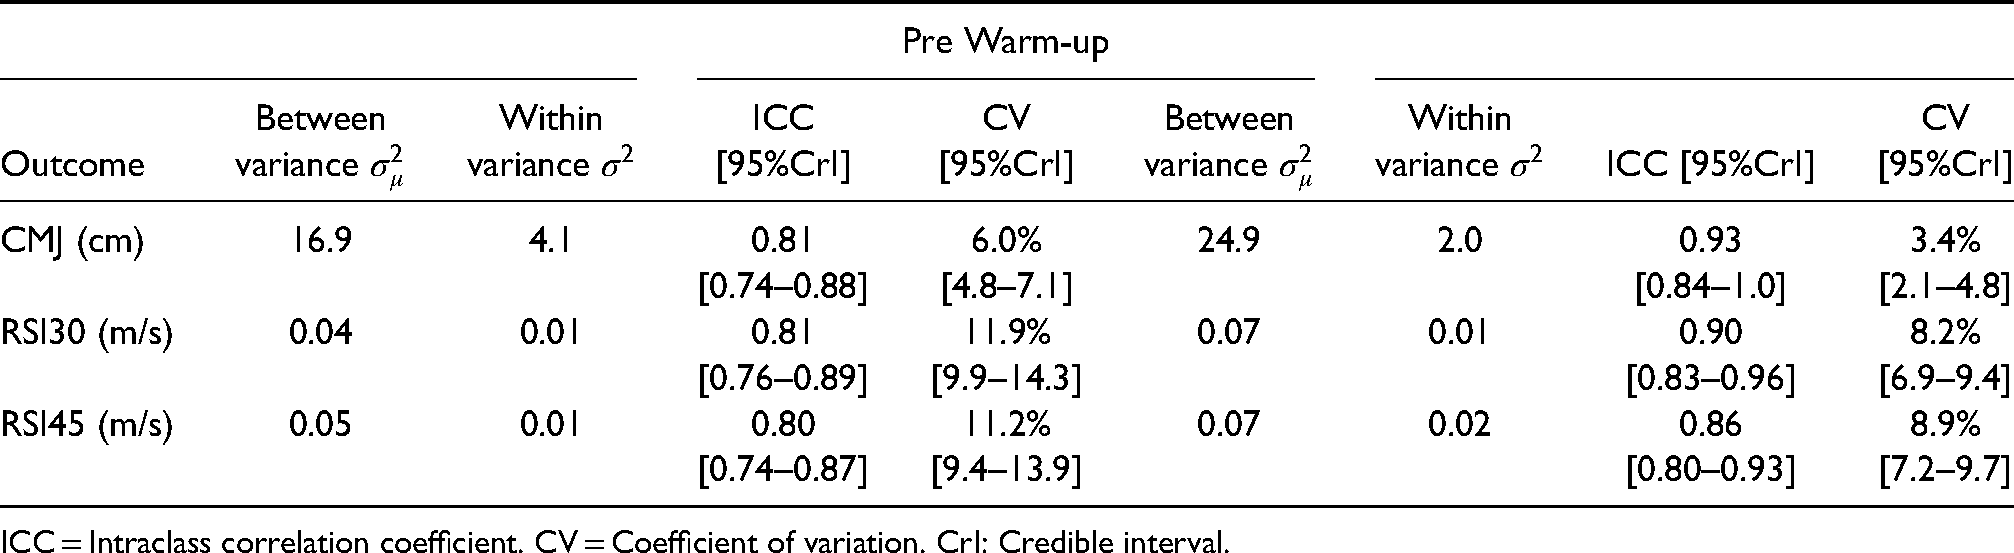
ICC = Intraclass correlation coefficient. CV = Coefficient of variation. CrI: Credible interval.
Decrements expressed in absolute units showed similar non-linear patterns across all three jumping tasks with a relatively steep initial phase followed by a decreased rate of decline (Figure1A-Figure1C). Across the fifty minutes absolute decrements of 4.1 cm (95%CrI: 3.1 to 5.0), 0.16 ms−1 (95%CrI: 0.06 to 0.26) and 0.22 ms−1 (0.10 to 0.31) were estimated for the CMJ, RSI30 and RSI45, respectively. Estimates of the standard deviations describing the spread of player offsets were equal to 0.50 cm (95%CrI: 3.4 to 7.9), 0.24 ms−1 (95%CrI: 0.16 to 0.41) and 0.28 ms−1 (0.18 to 0.46) for the CMJ, RSI30 and RSI45, respectively. Probabilities relating to decrements expressed as a percentage of the initial improvement due to warm-up are presented in Table 2. The values show that for CMJ the probabilities were close to one that up to 50% of the initial warm-up improvement would be lost between twenty and thirty minutes. For RSI30 and RSI45, probabilities were close to 1 that up 20% of the initial warm-up improvement would be lost between twenty and thirty minutes. Additionally, closer to 40 to 50 min was required to obtain high probabilities that up to 50% of the initial warm-up improvement would be lost for RSI30 and RSI45.
Probabilities that relative warm-up decrement equals or exceeds percentage thresholds for the countermovement jump and reactive strength index tests.
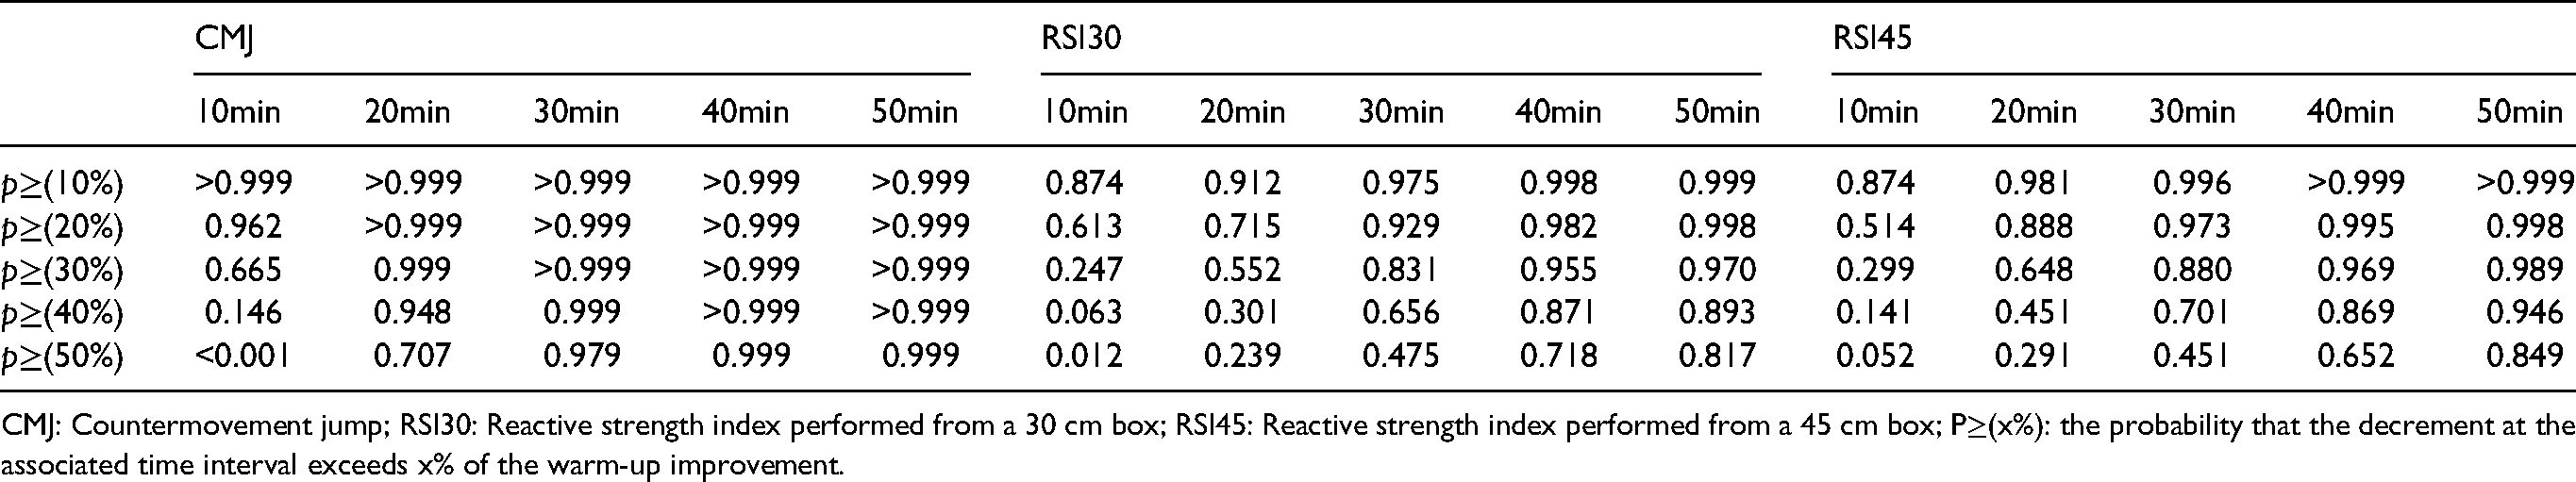
CMJ: Countermovement jump; RSI30: Reactive strength index performed from a 30 cm box; RSI45: Reactive strength index performed from a 45 cm box; P≥(x%): the probability that the decrement at the associated time interval exceeds x% of the warm-up improvement.
Discussion
The purpose of this study was to investigate the time-course of decrements due to inactivity following a soccer-specific warm-up. The results demonstrate a positive effect of warm-up on all outcome measures (∼15–30% improvement) in agreement with previous research.21–23 Results attained in the present study demonstrate that the beneficial effects of warm-up declined throughout the period of inactivity, with the time-course of decrements potentially influenced by the performance task. These results indicate that performance enhancements gained following an appropriate warm-up strategy are transient and we suggest that consideration should be given to the timing and content of suitable re-warm-up strategies, to ensure that performance benefits are maintained. This information may be of relevance for substitutes that are required to enter competition after prolonged inactivity following an initial warm-up, but still provide immediate benefit to the team. 6 The main proposed mechanism behind the performance decline following periods of inactivity is the observed reduction in muscle temperature. 24 Mohr et al. 24 reported a positive correlation (r = 0.60) between muscle temperature reduction and reduction in sprint performance following a period of inactivity during half time in a soccer match. This could be explained by the reduction in muscle temperature causing a reduced rate of neural transmission or reduced muscle contraction speed/time to peak tension. However, this mechanism can be counteracted by performing a re-warm-up.5,24
To provide greater context to the time course of warm-up effects, performance decrements were expressed as a percentage of the pre-post warm-up improvement. As warm-up improvements are deemed important for sporting performance, the results are more readily interpretable using this scaling method. Across the full fifty minutes of inactivity, it was estimated across the different performance tests that approximately 60 to 70% of the initial pre-post warm-up improvement would be lost The magnitude of warm-up induced performance improvement and subsequent declines varied between different outcome measures. The RSI45 measure showed the greatest improvement in response to warm-up (28.9%) and was also the slowest to decline (Figure 1B). Whereas CMJ height showed the smallest improvement in response to warm-up (16.3%) and demonstrated the most rapid initial decline (Figure 1C). These differences were reflected in the overall time-course pattern with reactive strength measurements demonstrating more linear declines, whereas the CMJ demonstrated a strongly non-linear pattern with a sharp initial decrease and then plateau (Figures 1A-1C). Collectively, these results suggest that different physiological inputs to the performance tasks may influence the magnitude of warm-up induced improvements and the rate at which decrements are experienced, with some outcomes more robust to the effects of inactivity than others. Further research is required to confirm these findings and if appropriate identify underlying physiological mechanisms.
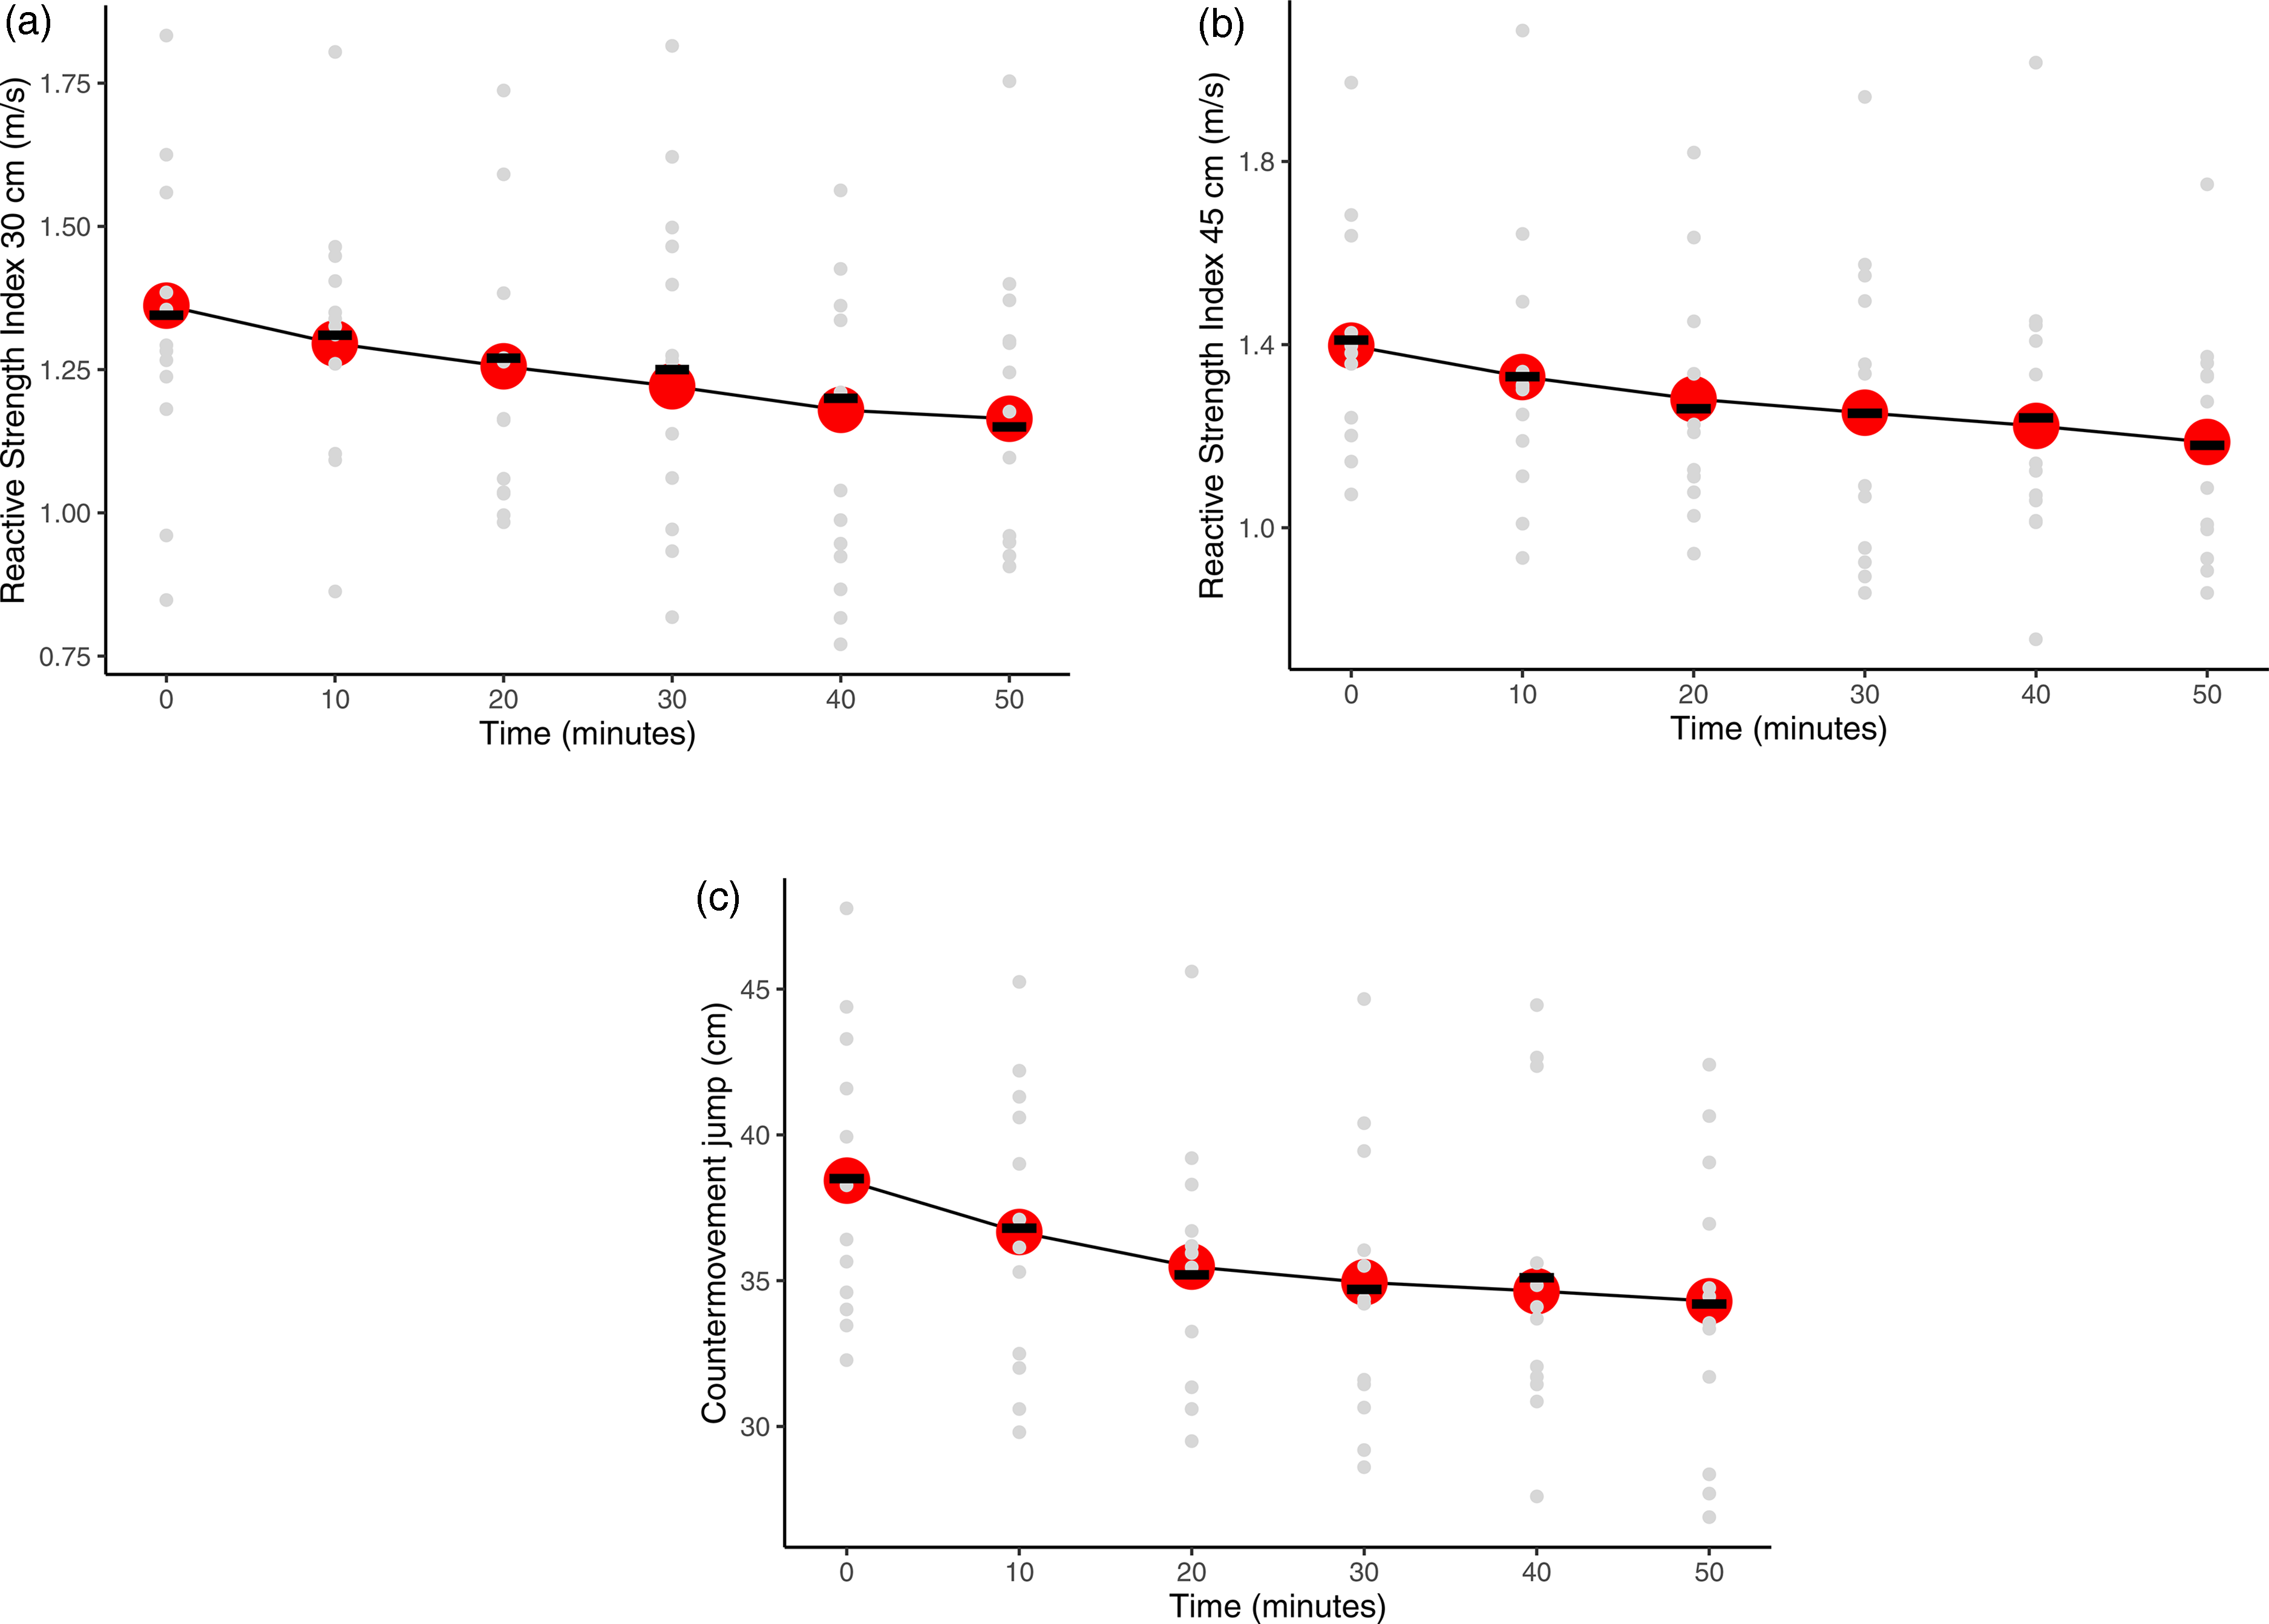
A-1C: time-series plots illustrate smoothed data obtained from Bayesian hierarchical generalised linear models presented in absolute units from reactive strength index tests (top) and countermovement jump (bottom). Grey circles represent the raw data. Red Circles represent the model averages (E(Y) of the model) and error bars represent ± unit standard error. Black horizontal line represents the mean of the raw data.
The analyses were focused on describing the overall group profile to better generalise findings beyond the particular sample. Based on the group data, probabilities close to one were obtained that up to 50% of the pre-post warm-up improvement would be lost between 20 and 30 min of inactivity in the CMJ. For RSI measurements, a relatively high degree of confidence was obtained that between 20 and 30% of the pre-post warm-up improvement would be lost between 20 and 30 min of inactivity. Based on these findings and previous research outlining typical practices and constraints in soccer, 10 we suggest that as a guide, players should perform a re-warm-up after 20 to 30 min of inactivity. Care should be taken with the content of this re-warm-up to avoid inducing fatigue. Research has indicated that short-duration, low or high-intensity re-warm-up is sufficient to maintain performance during the half-time period in soccer.24–26 However, brief completion of activities such as explosive jump type movements that can induce post-activation potentiation effects may be most suitable. For example, it has been reported that the inclusion of drop jumps within a dynamic warm-up resulted in the greatest improvements in sprint performance when compared to a cardiovascular and dynamic stretch-based warm-up. 23 Therefore, practitioners should consider various acute programme variables when considering the content of re-warm-up activities to both improve performance, whilst minimising the effect of fatigue.
The current study has limitations that must be considered when interpreting the results and recommendations. Firstly, the data were modelled from a relatively small and homogenous sample resulting in parameter estimates that may not be representative of the broader elite soccer population. As such, generalisations of these time course decrements and subsequent practical considerations should be considered with caution. Additionally, the relevance of augmented jumping ability to soccer performance is theoretical and a causal link cannot be made based on current evidence, however, jumping ability is a commonly used performance test to monitor fatigue/readiness. 27 A larger testing battery including multiple performance measures including skill-specific components would strengthen the evidence reported here. However, completion of physical tests within a battery may themselves act as a re-warm-up therefore limiting the validity of tests conducted later in any sequence of activities. The solution to this problem is to examine outcome variables in isolation, greatly increasing the number of testing sessions required by each participant or the total number of participants required. In the present study sessions were completed at 24-h intervals. Given the extensive training load the participants were accustomed to, the requirements for the study were unlikely to induce substantive neuromuscular fatigue. In addition, the order of sessions were randomised to mitigate any fatigue or boredom induced by the repetitive nature of the experiment. However, with greatly increased numbers of sessions, multiple factors are likely to exert influence on the data obtained. As such, the findings of this study act as an initial stage in unravelling the complexity of this multifaceted phenomenon. Further research, with different performance-based outcomes and related physiological measurements are required to better understand the transitory nature of warm-up induced performance enhancements and the underpinning physiological mechanisms that may create outcome specific differences. Increased understanding of these mechanisms will support practitioners in selecting the content and organisation of re-warm-up activity.
Practical applications
The results from this study provided consistent evidence that performance measures assessed were enhanced following warm-up, but that these enhancements were transitory and declined throughout the period of inactivity. Collectively, the results suggest that for the sample investigated, inactivity periods greater than 20 to 30 min were likely to substantially reduce the performance benefits derived from a warm-up. Assuming the results were to generalise to wider elite soccer populations, this would have implications for substitutes who are frequently exposed to long periods of inactivity and re-warm-ups could be suggested after 20 to 30 min based on the analyses presented here and the typical constraints placed on substitutes and their use in soccer. However, the study represents only a starting point to accumulate evidence for recommendations improving pitch-entry of substitutes. Future well-designed, controlled trials are required to test the performance related implications of different re-warmup timings.
Footnotes
Declaration of conflicting interests
The author(s) declared no potential conflicts of interest with respect to the research, authorship, and/or publication of this article.
Funding
The author(s) received no financial support for the research, authorship, and/or publication of this article.