
Abstract
There is ongoing debate about the existence of racial discrimination in the National Basketball Association (NBA). This study uses the largest and richest dataset of its kind to re-examine racial disparities in playing time among nearly 1800 rookies drafted into the league over the course of four decades. In line with recent studies, our statistical analyses fail to unearth evidence of anti-Black discrimination on the part of NBA coaches making playing time determinations. We identify structural traits of the NBA as a labour market that are likely contributing to this meritocratic distribution of playing time and suggest fruitful areas for future research on this topic.
Introduction
The National Basketball Association (NBA) is one of the most racially inclusive professional sports leagues, with more than 80% of its players identifying as people of color. 1 Leading sports economists have for some time declared that racial discrimination is either absent or progressively diminishing in the association.2–4 Nevertheless, rigorous quantitative studies continue to produce evidence of pay,5,6 exit, 7 and other forms of racial disparities in the league.
Through this study, we analyze racial disparities across a dimension that has received relatively limited attention within the existing literature: coaches’ allocation of playing time among rookies. As Staw & Hoang noted decades ago: few rookies enter the association with the requisite skillset to have an immediate impact on the court, and as such, they normally require an investment of playing time to bring them up to that next level of elite competition. 8 It is at this juncture that racial biases can creep in, as collegiate and NBA-level player performance are imperfectly correlated, 9 and playing time allocation decisions are made under much uncertainty. Under these types of conditions, comparable research on hiring decisions in mainstream labour markets routinely finds evidence of both racial and ethnic discrimination. 10
Through statistical analyses of a rich longitudinal dataset containing nearly 1800 NBA draft picks that entered the league from 1980 to 2021, we explore racial disparities in the number of games and minutes played by rookies. We fail to detect any sizable raw or net racial disparities. These findings prove robust to re-estimation using alternative modeling techniques and specifications of our dependent variables, along with various other sensitivity analyses. We theorize that these largely null effects are likely attributable to unique features of professional sports as labour markets, including extreme levels of transparency and public scrutiny, close alignment of player and managerial incentives, and – perhaps more specific to the NBA – an evolving legacy of Black athletic excellence. At the same time, we discuss omitted variables that could be biasing our estimates, such as measures of physical conditioning and endurance, as well as a propensity to play through injuries.
Racial discrimination in the NBA
For decades the NBA has served as a subject of analysis for social scientists of various stripes interested in how bias plays out through managerial decision-making.11–13 Though empirical studies in the 1980s frequently produced evidence of racial discrimination,14–16 studies in the early 2000s began to generate contradictory findings.3,4,17 Indeed, the most recent review of this NBA literature produced by Berri concludes that discrimination appears to be diminishing over time across all notable indicators. 9 This progress contrasts other professions (e.g., medicine, law) or labour market segments where racial disparities and discrimination have proven remarkably stubborn.
One area where empirical studies have recently failed to produce evidence of discrimination against Black players is in playing time. Here, two studies provide the best evidence in that they directly model these disparities, as opposed to presenting average differences. Leeds, Leeds, & Motomura's examination of players that entered the league during 1995–2005 led them to conclude, to their surprise, that Black players in their dataset received greater amounts of playing time than non-Black counterparts. 18 Earlier work by McCormick & Tollison, analyzing data from the 1980–1988 seasons, also found that after adjusting for available controls, Black players received 1.47 more minutes per game of playing time than comparable white counterparts. 19 This disparity registered as statistically significant, but its practical significance remains largely debatable given its small size.
A host of other studies have published descriptive statistics on this topic which provide a secondary tier of evidence. In Zhang's sample of games played during the 1990–2015 seasons, white players recorded roughly 3 fewer minutes per game than Black counterparts. 20 Nearly two decades earlier, Kanazawa & Funk's analysis of local, non-cable NBA basketball games aired during the 1996–1997 seasons unearthed virtually no difference in the proportion of time played by white players relative to their roster share, prompting them to conclude that they saw no evidence of racial disparities in playing time allocation. 21 Bodvarsson & Brastow's work also showed that white players during the 1989–1991 NBA seasons registered almost 6 fewer minutes per game than Black counterparts. 22 Meanwhile, earlier data from the 1984–1985 season also showed a 3 min per game disadvantage for white players. 23
Several studies have also examined whether the player-coach race mismatch in the NBA has explanatory power when it comes to predicting playing time allocation.24,25 However, this work has shown that same race bias on the part of coaches may account for only a trivial amount of the variation in playing time (34–55 seconds per game), and the most recent and methodologically sophisticated work on this topic demonstrates only null effects for this interaction effect. 26 Comparable research by Agha et al. focusing on the WNBA and using multiple measures of skin color has similarly failed to unearth evidence that either player or coach race, or the interaction of these variables, shapes playing time determinations. 27
A primary drawback of these studies is that they have focused on the general NBA player base, which includes considerable heterogeneity in skill and performance that has not been adequately controlled for. Meanwhile, in other cases, we have observed the use of relatively small samples likely lacking the power to detect statistically significant effects. 18 These are limitations that we overcome through this study to produce what we believe to be the most robust results published thus far.
Theorizing playing time allocation
We theorize that decisions about playing time allocation within the NBA and other comparable professional sports are informed by a range of factors. First, and perhaps most importantly, coaches face short-term pressures to win each game, an outcome that is primarily a function of putting the best available players on the court. In the case of rookies, coaches have had little opportunity to observe their abilities at the NBA level. As such, they must base their decisions on an array of imperfect proxies like performance at the collegiate level, physical attributes (e.g., height, weight), or pedigree (e.g., NCAA division). These tangible factors serve as one primary input into the decision.
Second, there is ample research suggesting that NBA coaches face countervailing long-term pressures to develop prospects,8,27 particularly those selected using valuable lottery picks. Often, these picks are acquired by franchises at a considerable expense, either by giving up skilled veterans who have already demonstrated their abilities at NBA level, through accepting “bad” contracts signed by other franchises, or via exchange for multiple draft picks. The sunk costs associated with these early picks means that coaches often invest more playing time into developing these players – at times over multiple seasons – than would be justified based solely on their performance. 28
Third, there are contextual factors that are specific to a team within a given season that shape playing time determinations. For example, teams that are contending for a playoff spot will face greater pressures to field their best players to qualify for the playoffs. On the other hand, for those who are not serious playoff contenders, a fact that is typically apparent early in the season, short-term success will matter less. Instead, they will typically opt to invest playing time into developing and building their team around younger players. In fact, some will even engage in tanking tactics to maximize the odds that they will obtain a better pick in the subsequent year's draft. 29
It is unclear how race would factor into playing time determinations. On the one hand, scholars like Ajilore have theorized that statistical discrimination could prompt Black advantages in playing time within the NBA given that for decades the top performers (e.g., Kobe Bryant, Lebron James) have been predominantly Black. 30 This could prompt race-based expectations that lead coaches to grant Black players more playing time. However, others suggest that it would be difficult for statistical discrimination to play out in the NBA given that information about player productivity is readily available. 22 The case of rookies is unique in this regard in that there is often an adjustment period during which rookies may initially struggle during their transition into the NBA. Beyond debates about statistical discrimination, scholars have also highlighted the existence of negative racial stereotypes which are said to hamper Black players careers. 7 There is also some evidence that white players have commercial value that is unrelated to their on-the-court performance, as there is some historical evidence that their mere presence on a roster is correlated with increased TV viewership and game attendance.14,21
Data & methods
Through this study we leverage the largest dataset used thus far in the literature to examine this topic, containing all draft picks made by NBA teams during the 1980–2021 seasons. The base for this dataset are a series of annual tables published by Basketball-Reference.net containing all draft picks from this period, alongside a series of other details, such as the NBA team that drafted them, the pick they were selected with, and NBA career statistics. For each of these draft picks we amass an array of demographic information (e.g., height, weight, place of birth), and other traits from various publicly available sources, including Basketball-Reference.com, DraftExpress.net, LandofBasketball.com, NBA.com, RealGM.net, TheDraftReview.net, and Wikipedia.org. Collegiate-level information, including both position and on-the-court performance, were obtained from Sports-Reference.com. NBA rookie season statistics were obtained from annual tables published by Basketball-Reference containing all rookies who played during each season.
As no self-reported racial data is published for NBA players, the first author manually coded publicly available pictures of every draft pick in our dataset using images from various websites. All players were coded as “Black”, “white” and “other” based on their skin tone and general appearance. The third category included a relatively small group of mixed-race players (e.g., Klay Thompson) that cannot be realiably classified without pre-existing knowledge of their familial history. Coding was performed entirely by the first author and subsequently validated using several strategies discussed in detail elsewhere, 31 including a statistical comparison with the manual coding of a random 20% sub-sample of our dataset done independently by the second author, as well as comparisons with racial coding done for four other published peer-reviewed studies. All these exercises resulted in high rates of inter-coding reliability.
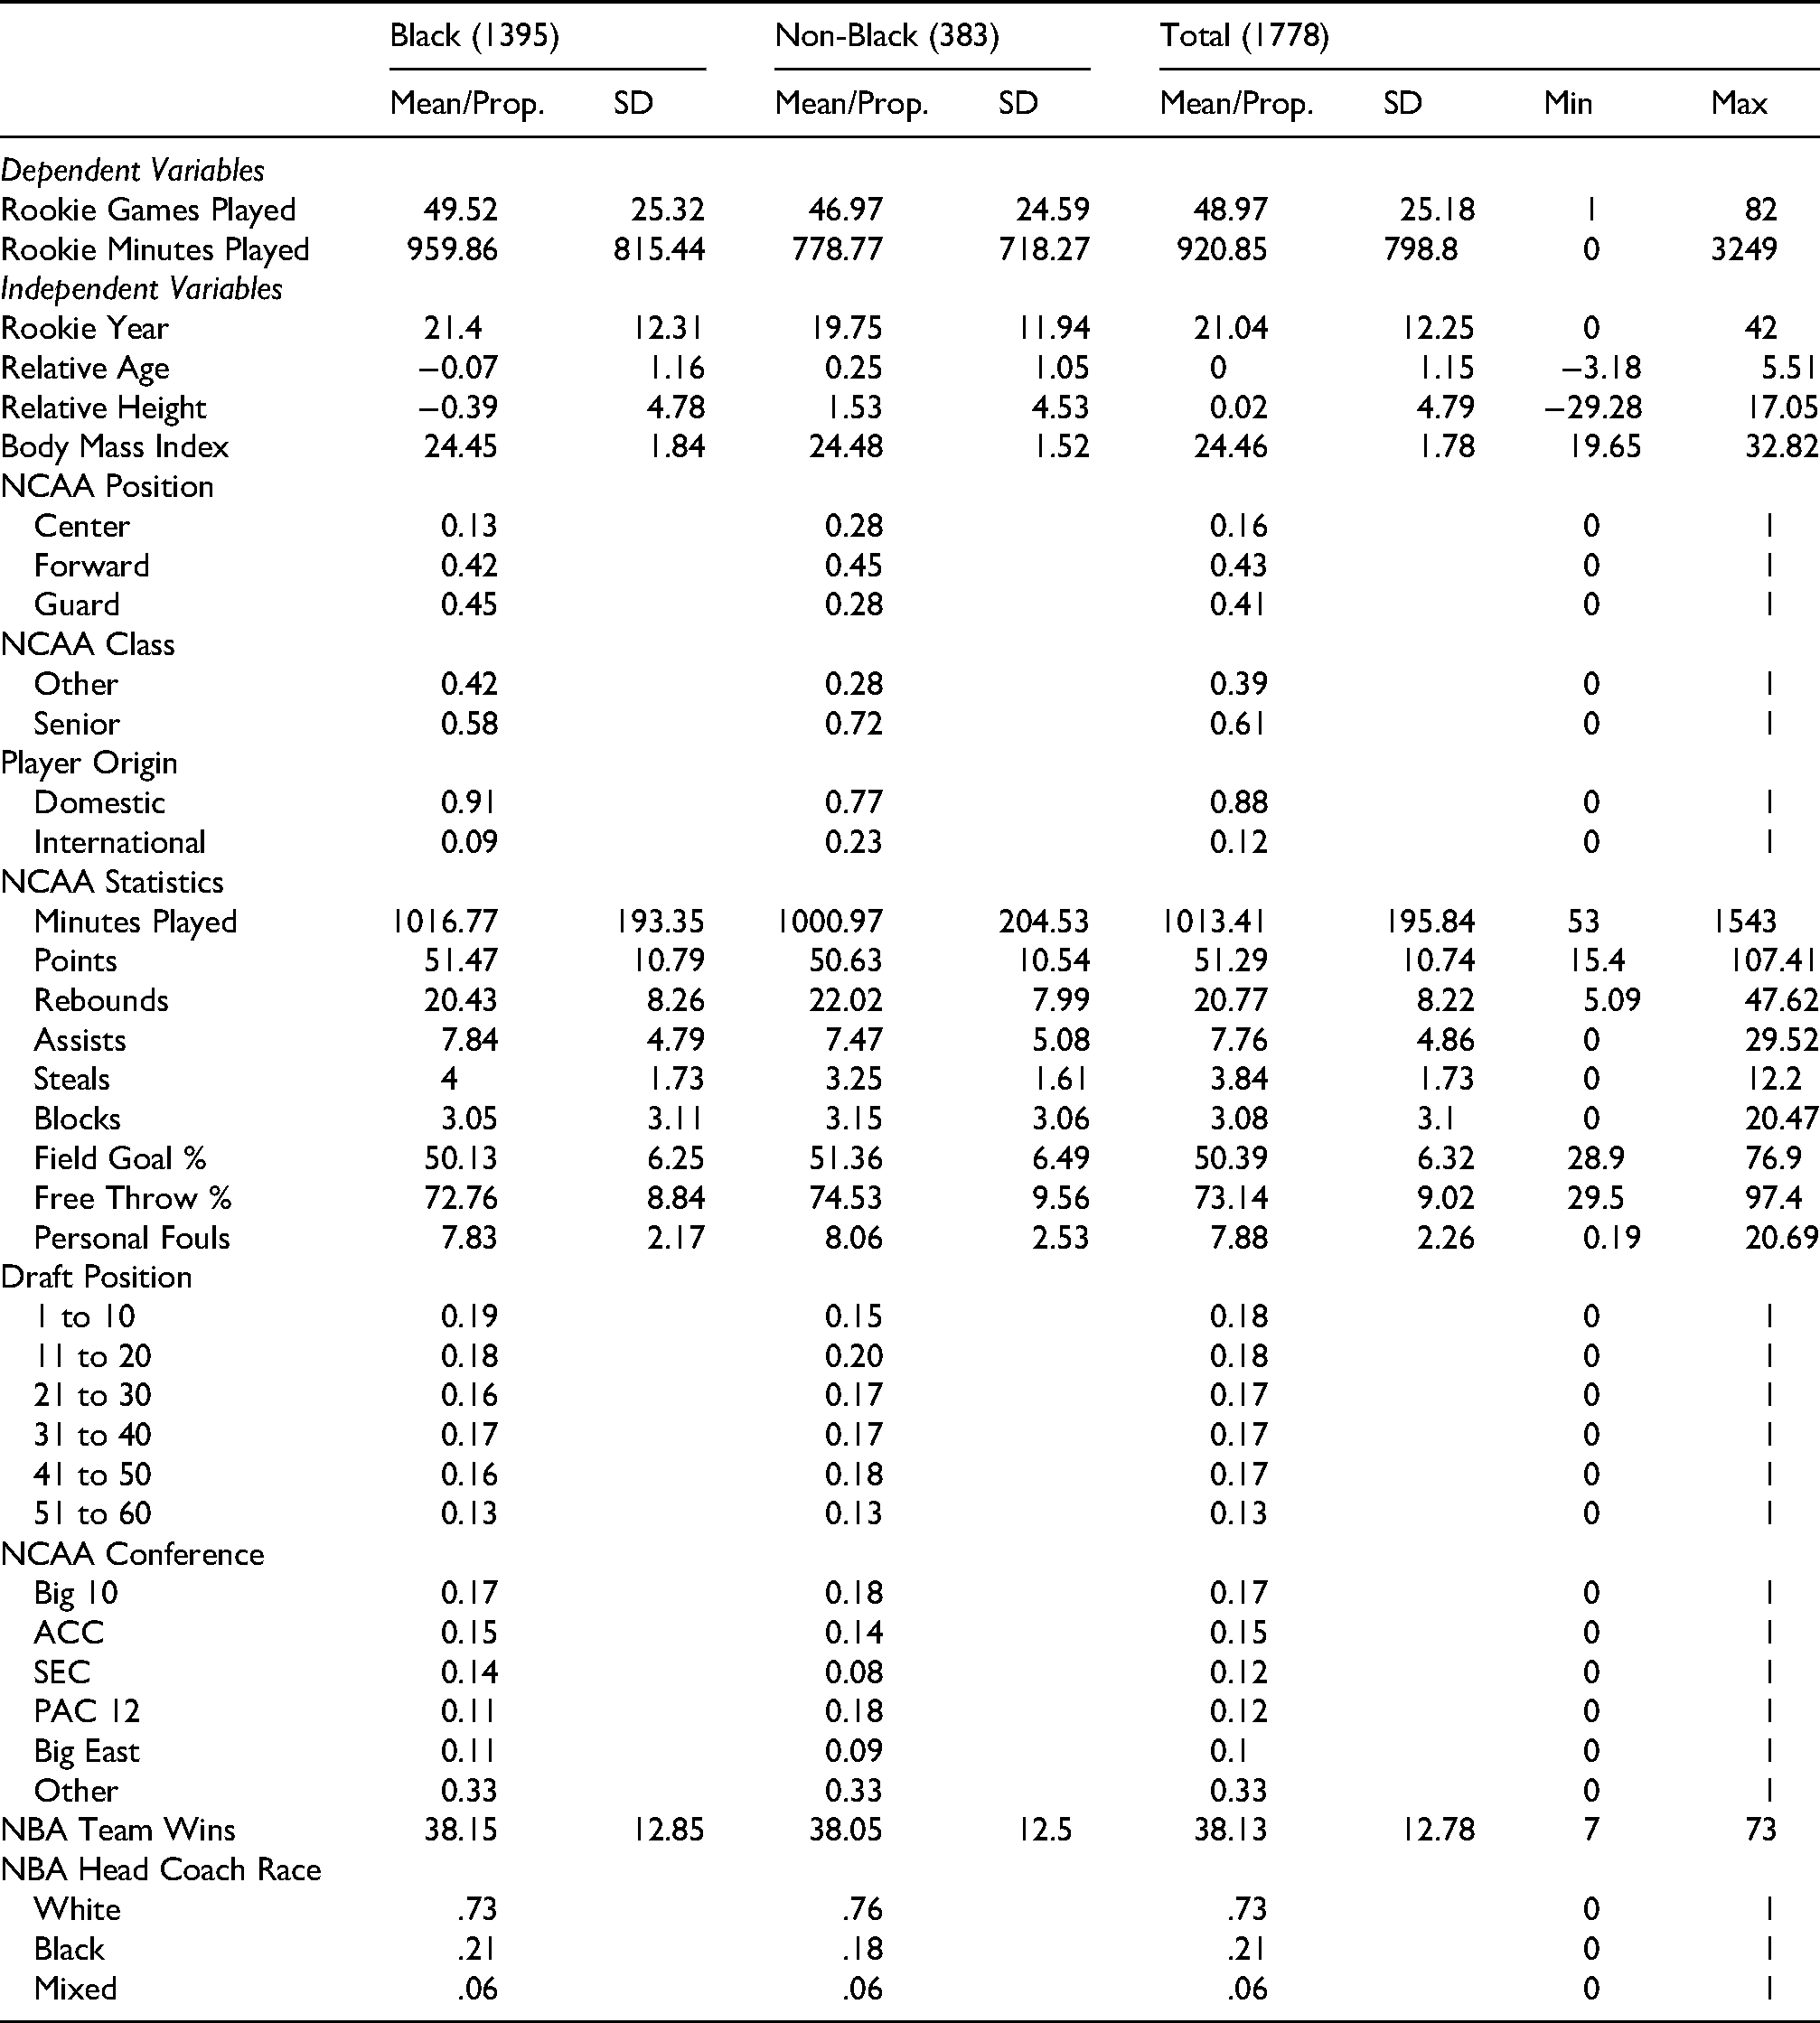
We apply two primary restrictions to arrive at a more comparable analytical sample. First, and as done in Berri et al., 9 we restricted our sample to draftees that played Division I NCAA basketball, excluding those entering the NBA through other pathways (e.g., foreign club). This constitutes the modal pathway taken by draft picks into the NBA during this period, but does prompt us to exclude those players who entered the league after going undrafted, as well as those originating from international leagues. Second, and as done by Staw & Hoang, 8 we focus on the first 60 draft picks in any year to ensure greater comparability in our sample. This is the rough equivalent of the two rounds that make up the modern draft, and renders picks from the 1980s, when the draft had additional rounds, more comparable. Descriptive statistics for our analytic sample are not reviewed in detail here due to space constraints, but can be found in Appendix 1.
We explore racial disparities in playing time using box plots, bivariate statistical tests, and various forms of regression modeling. We start by fitting ordinary least squares (OLS) regression models of games and raw minutes played by draft picks in their rookie season, beginning with a zero-order model containing only our race variable: a Black (reference category) and non-Black dichotomy. Experimentation with Tobit models did not produce evidence suggesting that OLS was a biased estimator. Nor did experimentation with different specifications of our dependent variables (e.g., log, sqrt of minutes played) produce contrasting results to those presented here. We then sequentially add thematic blocks into subsequent iterations of these OLS models as seen in Tables 1, 3, and 5. This allows us to observe fluctuations in the estimated relationship between player race and playing time as we adjust for controls. To assess the robustness of findings beyond the conditional mean, we re-estimate our final OLS models using quantile regression at various points (10th to 90th percentile) of the conditional distribution of the outcome variable. This approach allows us to examine whether observed racial disparities vary across the conditional distribution of playing time, net of covariates included in the model.
Ordinary least squares regression of games played during rookie season.
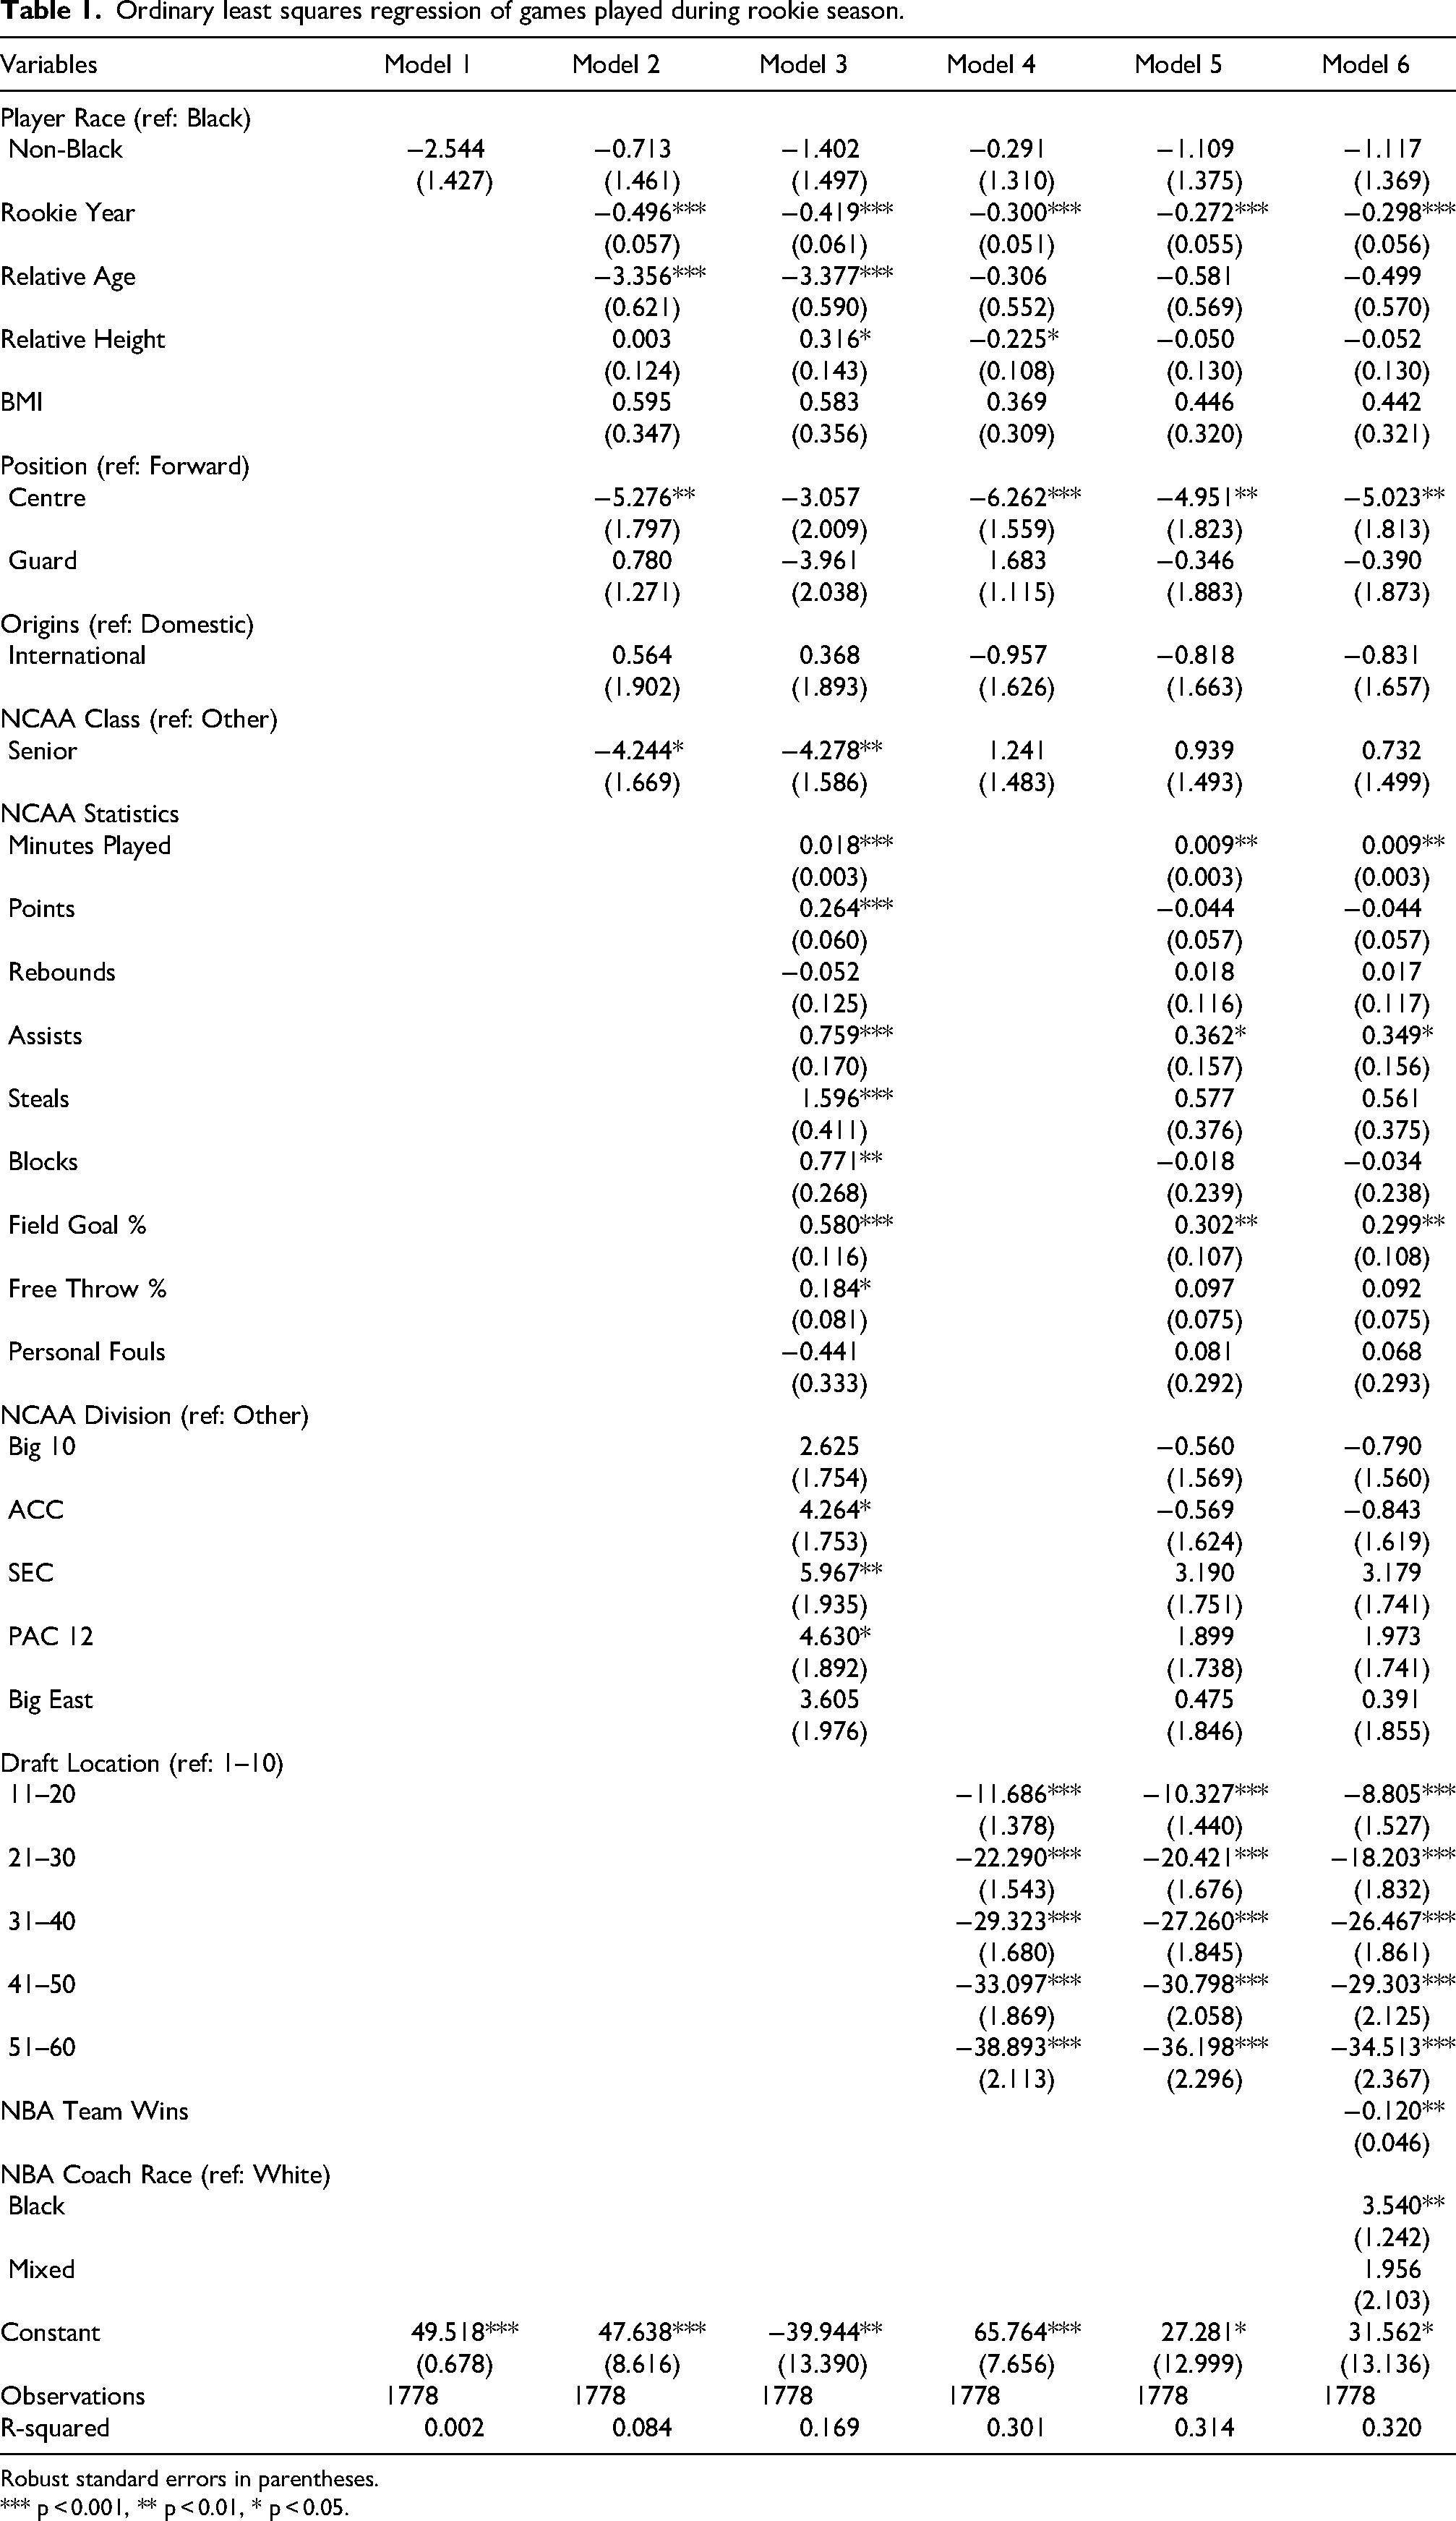
Robust standard errors in parentheses.
*** p < 0.001, ** p < 0.01, * p < 0.05.
Findings
We begin by visualizing the relationship between our focal predictor and dependent variables. First, through Figure 1 we display the distribution of games played by player racial groupings. We see that both measures of central tendency – the mean (dashed line) and median (solid line) – are slightly higher for the Black group. The difference in means (2.54) is found to be statistically significant via a two-sided t-test (p < .05), but the difference in medians (5) is found to be insignificant via a Mann-Whitney test. Through Figure 2 we display the distribution of minutes played by player race. Again, the difference in means (181.09) and medians (190) with respect to minutes played registered as statistically significant (p < .001) using the same two tests mentioned above. This serves as preliminary evidence that non-Black players receive less playing time during the rookie seasons in the NBA. This preliminary inspection of the distribution of our variables also evidences the fact that both are skewed and that differences may vary markedly depending on where we focus within the distribution.
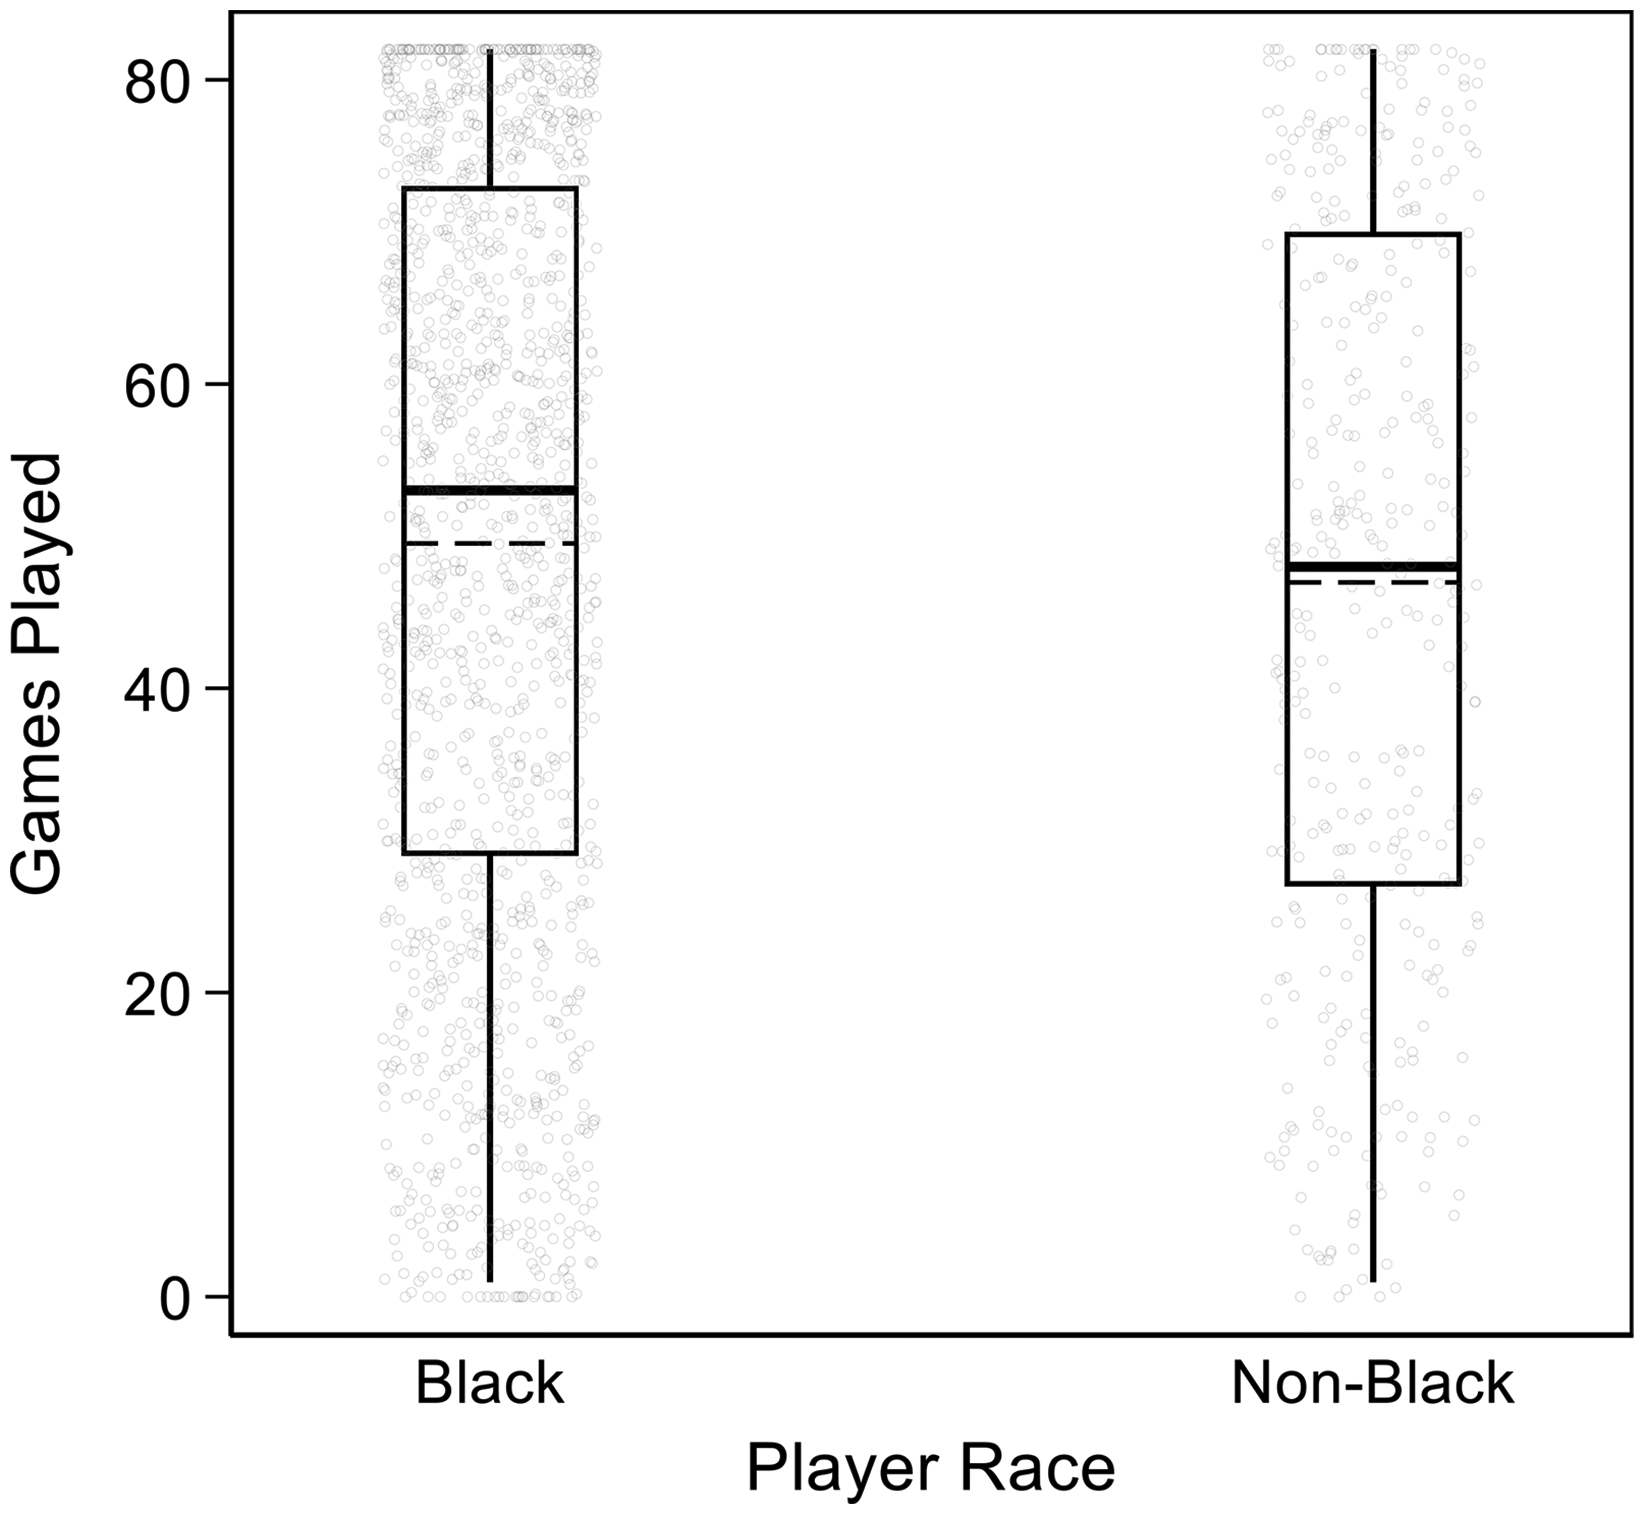
Games played by player race.
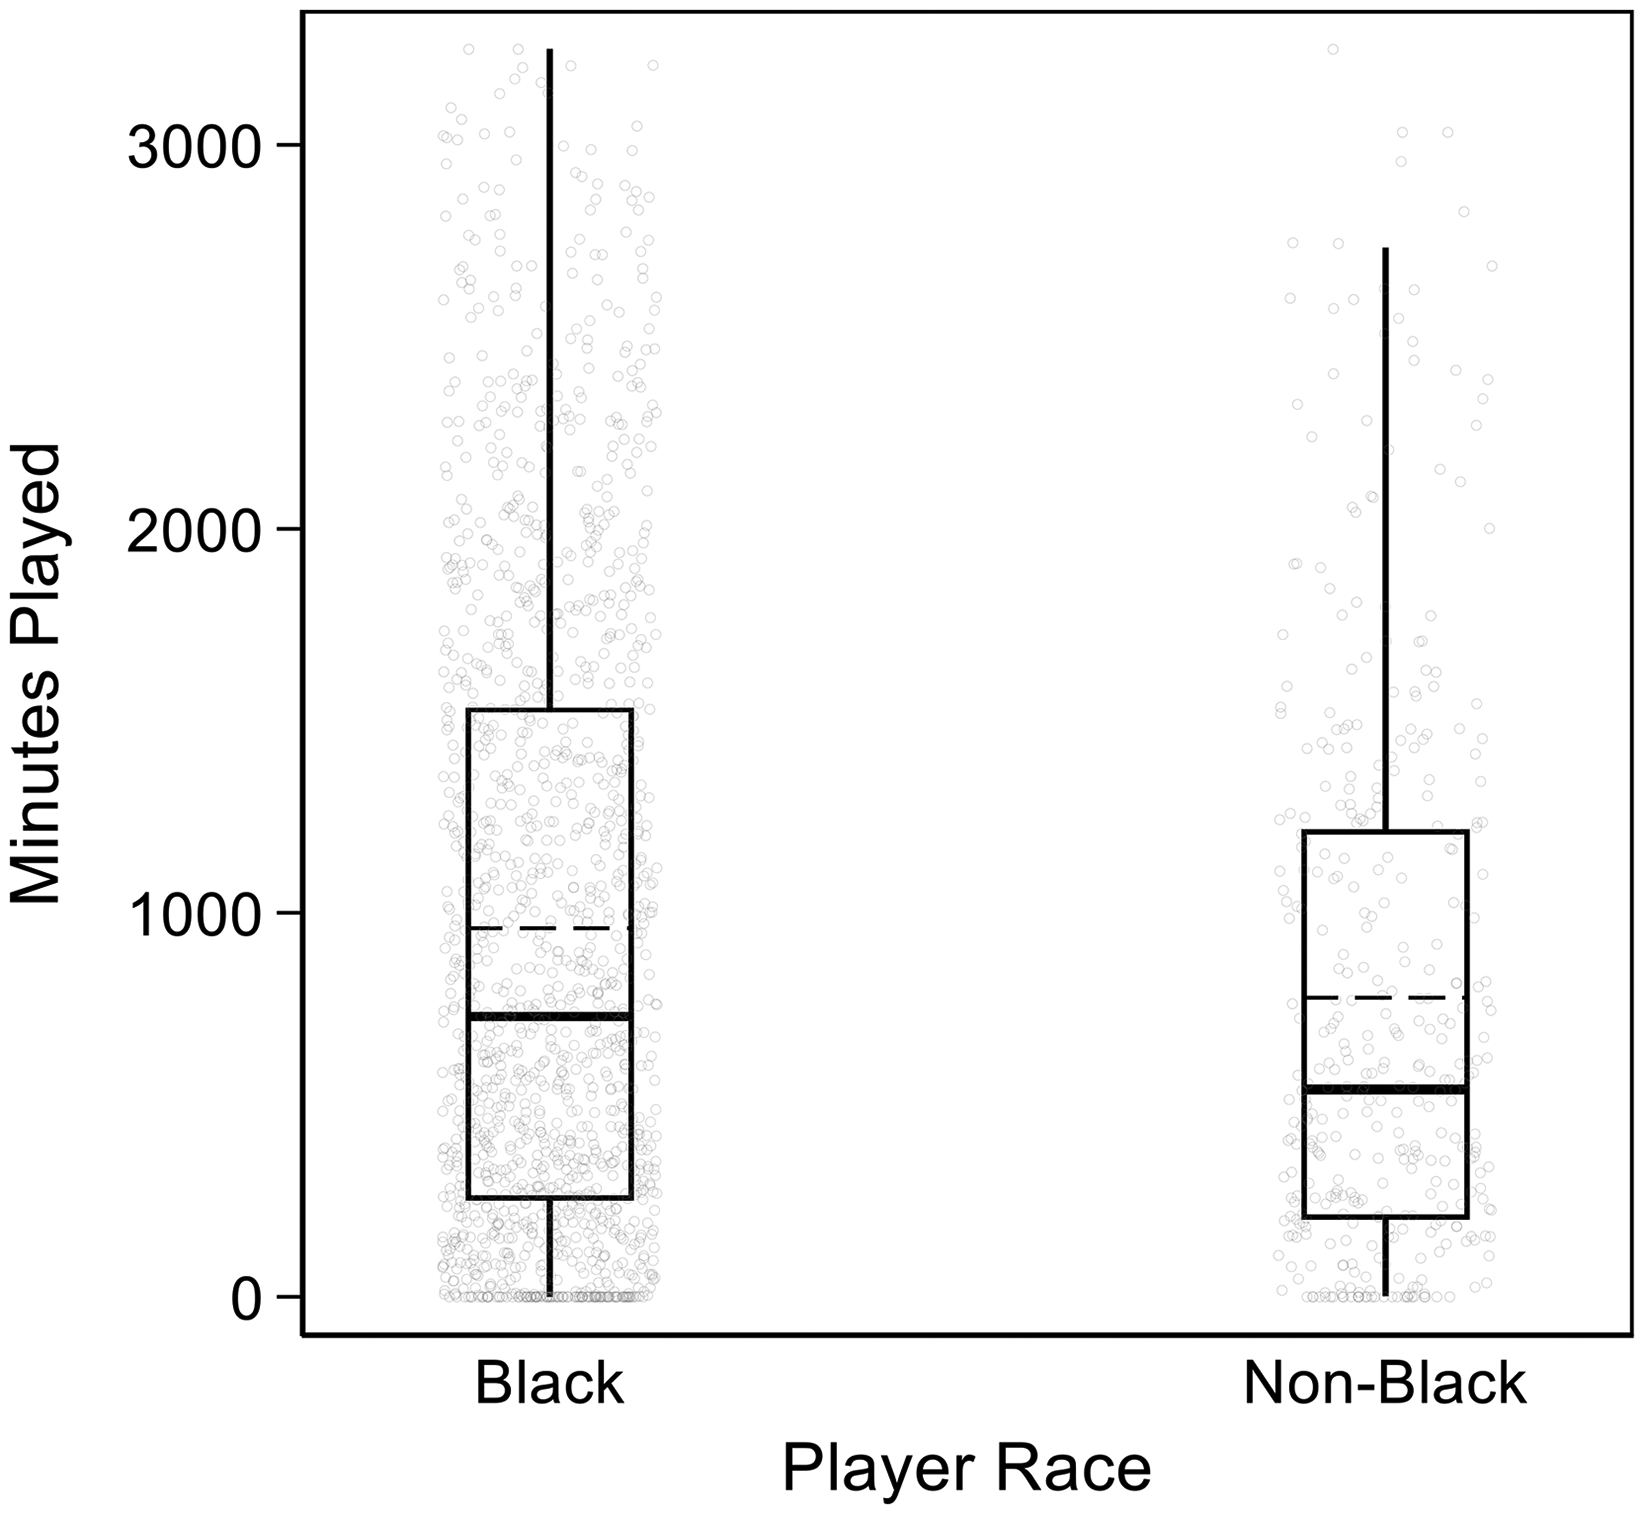
Minutes played by player race.
Games played
Through our first OLS regression model (Model 1, Table 1) we see that non-Black players participated in, on average, 2.54 fewer games during their rookie season than Black counterparts. This difference did not prove statistically significant. In the models that follow (Models 2 to 6), the estimated gap is further reduced, eventually stabilizing at just over one game. In an additional model not presented, we examine whether racial disparities in games played arise depending on the correspondence between the coach and player race by introducing an interaction between these variables. We plot this interaction in Figure 3, where we see that the estimates for players in each racial category do not differ markedly based on head coach race. Moreover, 95% confidence intervals overlap substantially. A multiple comparisons test with a Bonferroni adjustment also finds that there are no statistically significant differences here.
Games played by player and head coach race.
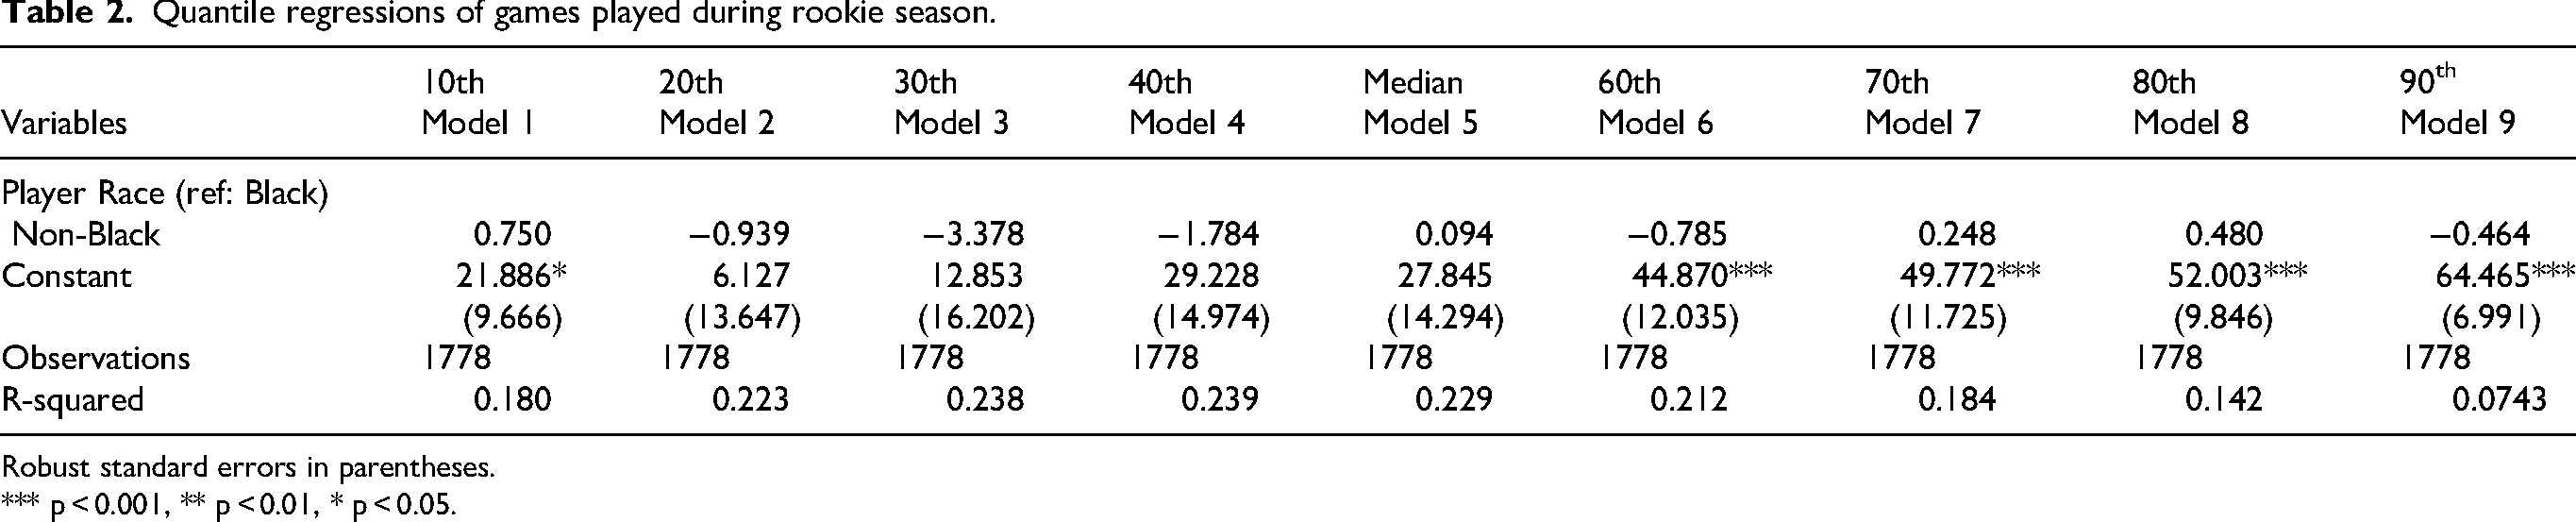
Through Table 2 we refit our final OLS model as a quantile regression, focusing on various points across the conditional distribution of games played. Through this exercise we see that there are no statistically significant racial disparities regardless of where we look, conditional on covariates. Moreover, there are no obvious trends across the Non-Black coefficients, as their size and sign vary sporadically. We thus conclude that the null findings observed earlier are not an artefact of evaluating racial differences solely at the conditional mean via OLS.
Quantile regressions of games played during rookie season.
Robust standard errors in parentheses.
*** p < 0.001, ** p < 0.01, * p < 0.05.
Minutes played
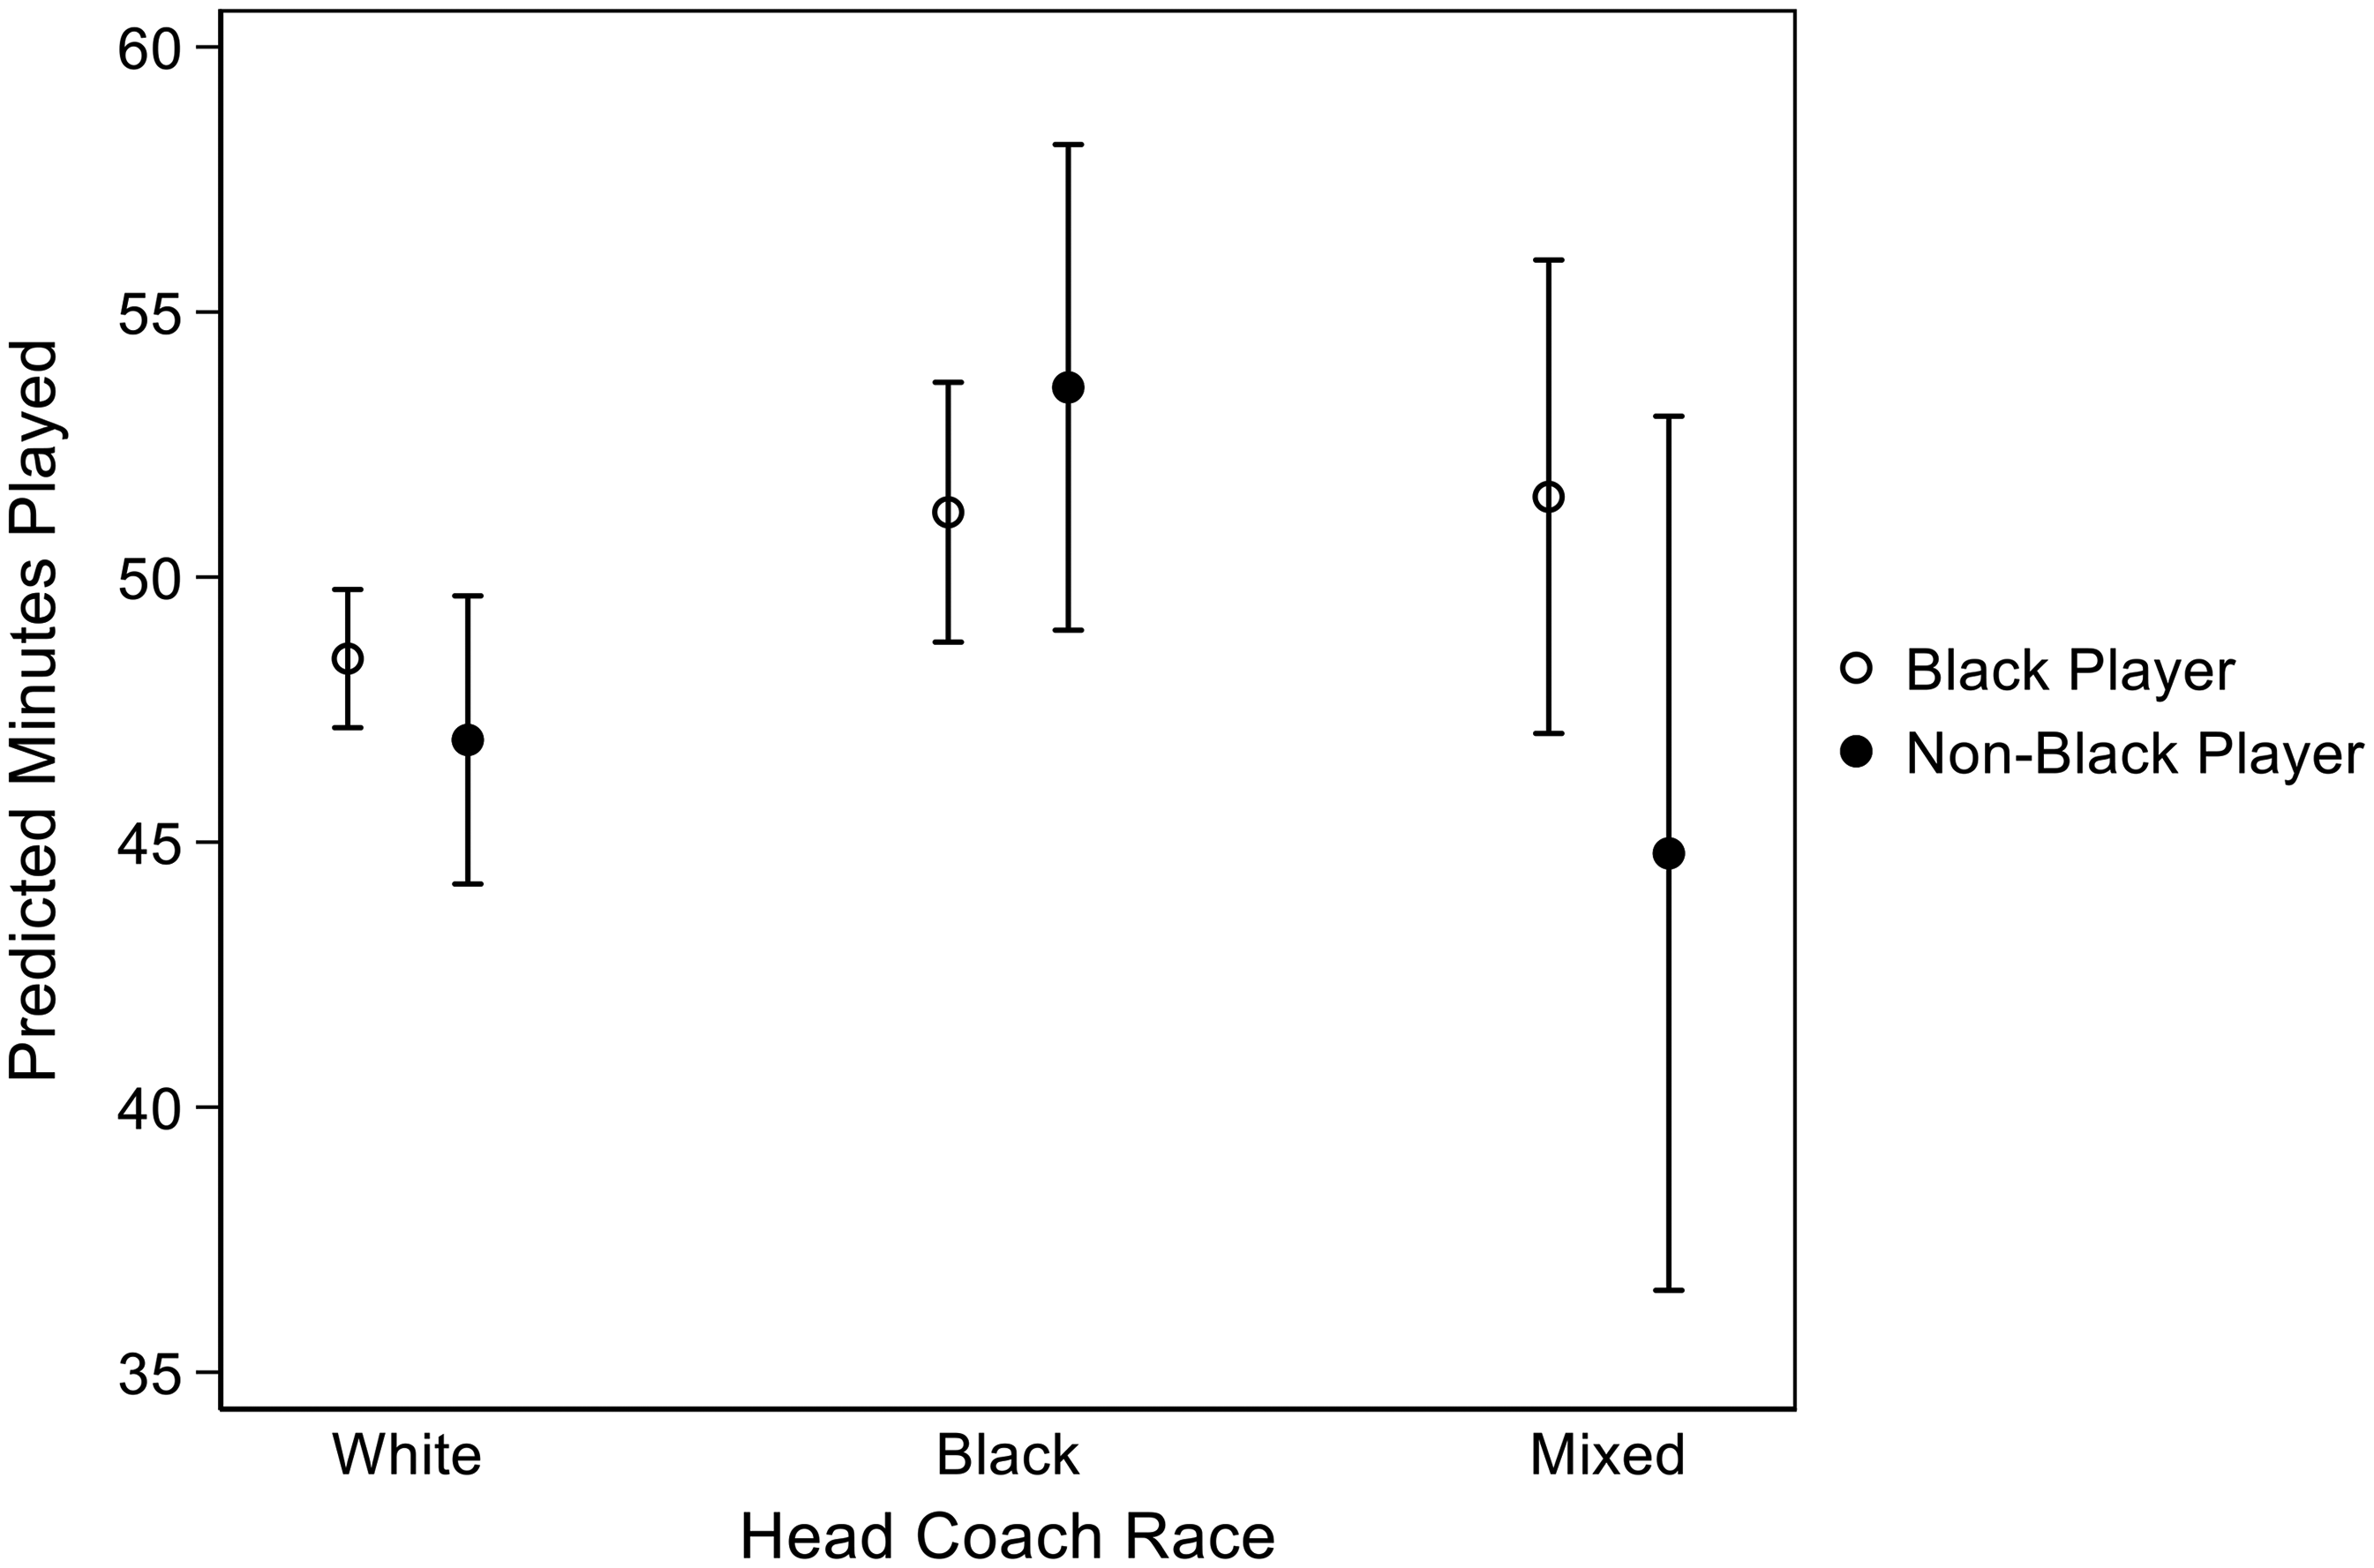
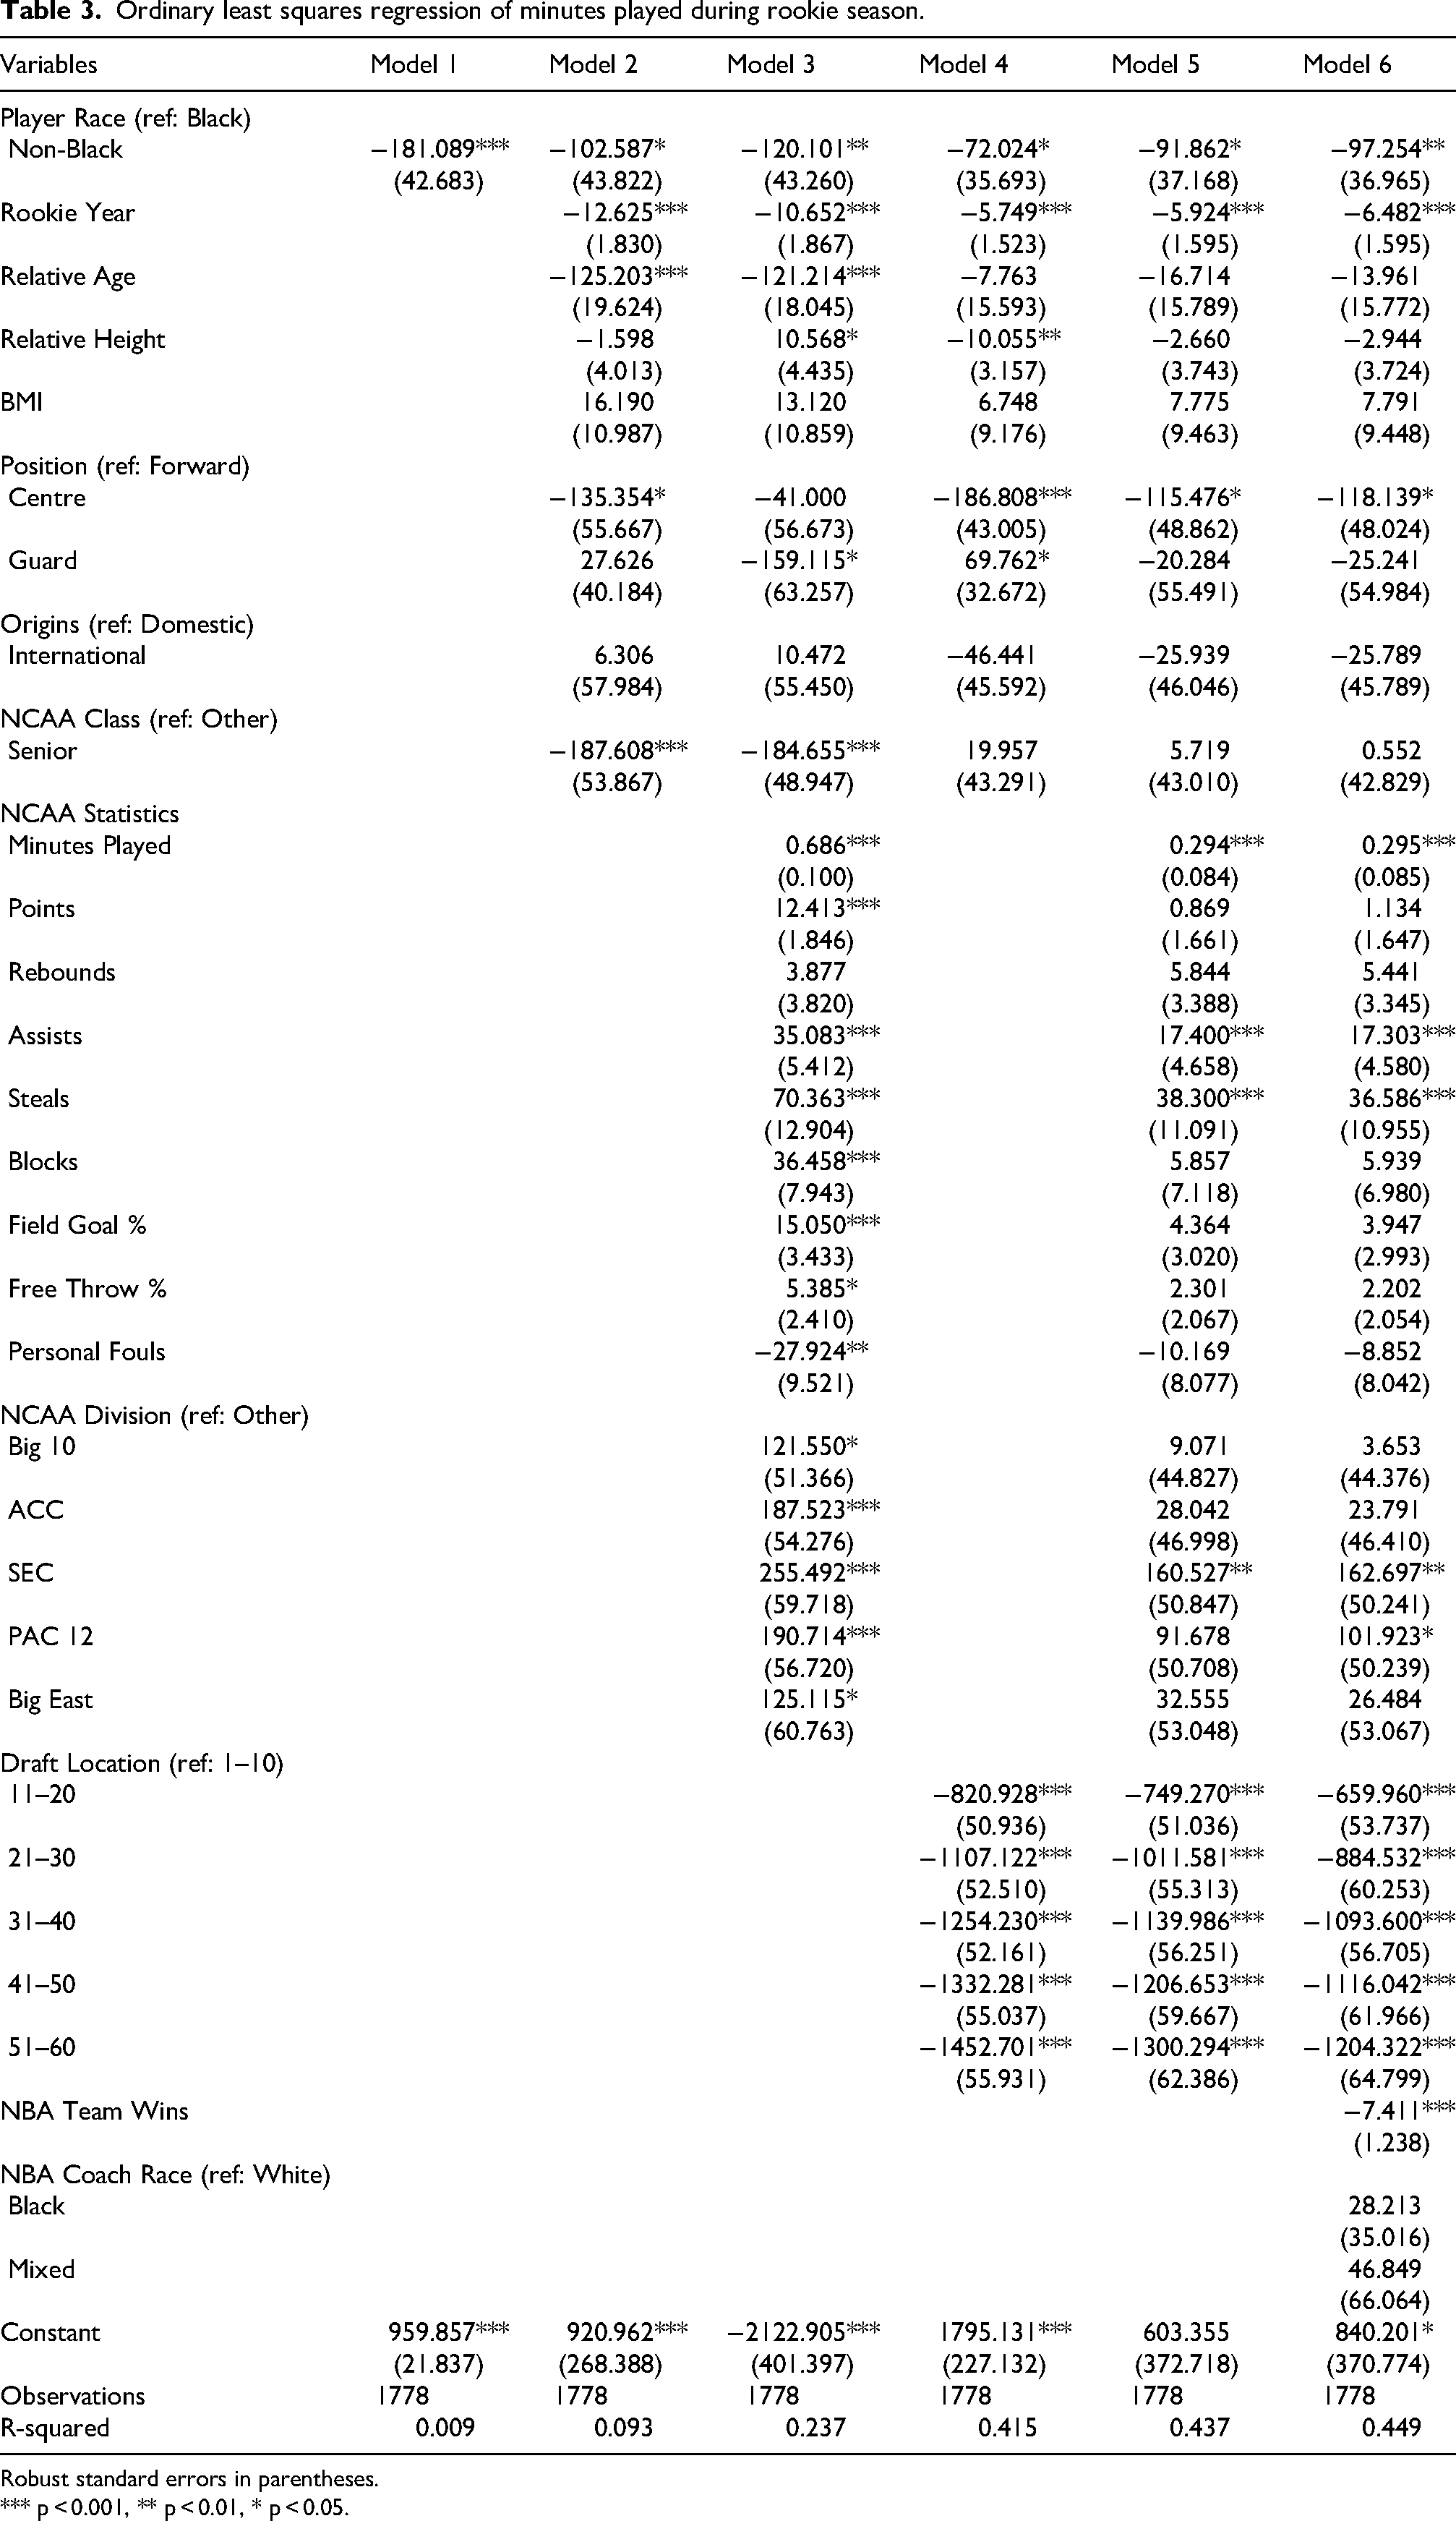
Through our first OLS regression model (Model 1, Table 3) we see that non-Black players registered an estimated 181.09 fewer total minutes in their rookie season than their Black counterparts (p < .001). In the models that follow (Models 2 to 6), this gap is eventually reduced to 97.25 min but remains statistically significant (p < .01). Once again, we estimate and plot the interaction effect between player and head coach race via Figure 4. Although the confidence intervals for the estimates of Black and non-Black Players under white head coaches do not overlap, significance testing with a Bonferroni adjustment does not reveal that such difference is statistically significant. As such, we find no conclusive evidence that differences in minutes played are associated with player-coach race match.
Ordinary least squares regression of minutes played during rookie season.
Robust standard errors in parentheses.
*** p < 0.001, ** p < 0.01, * p < 0.05.
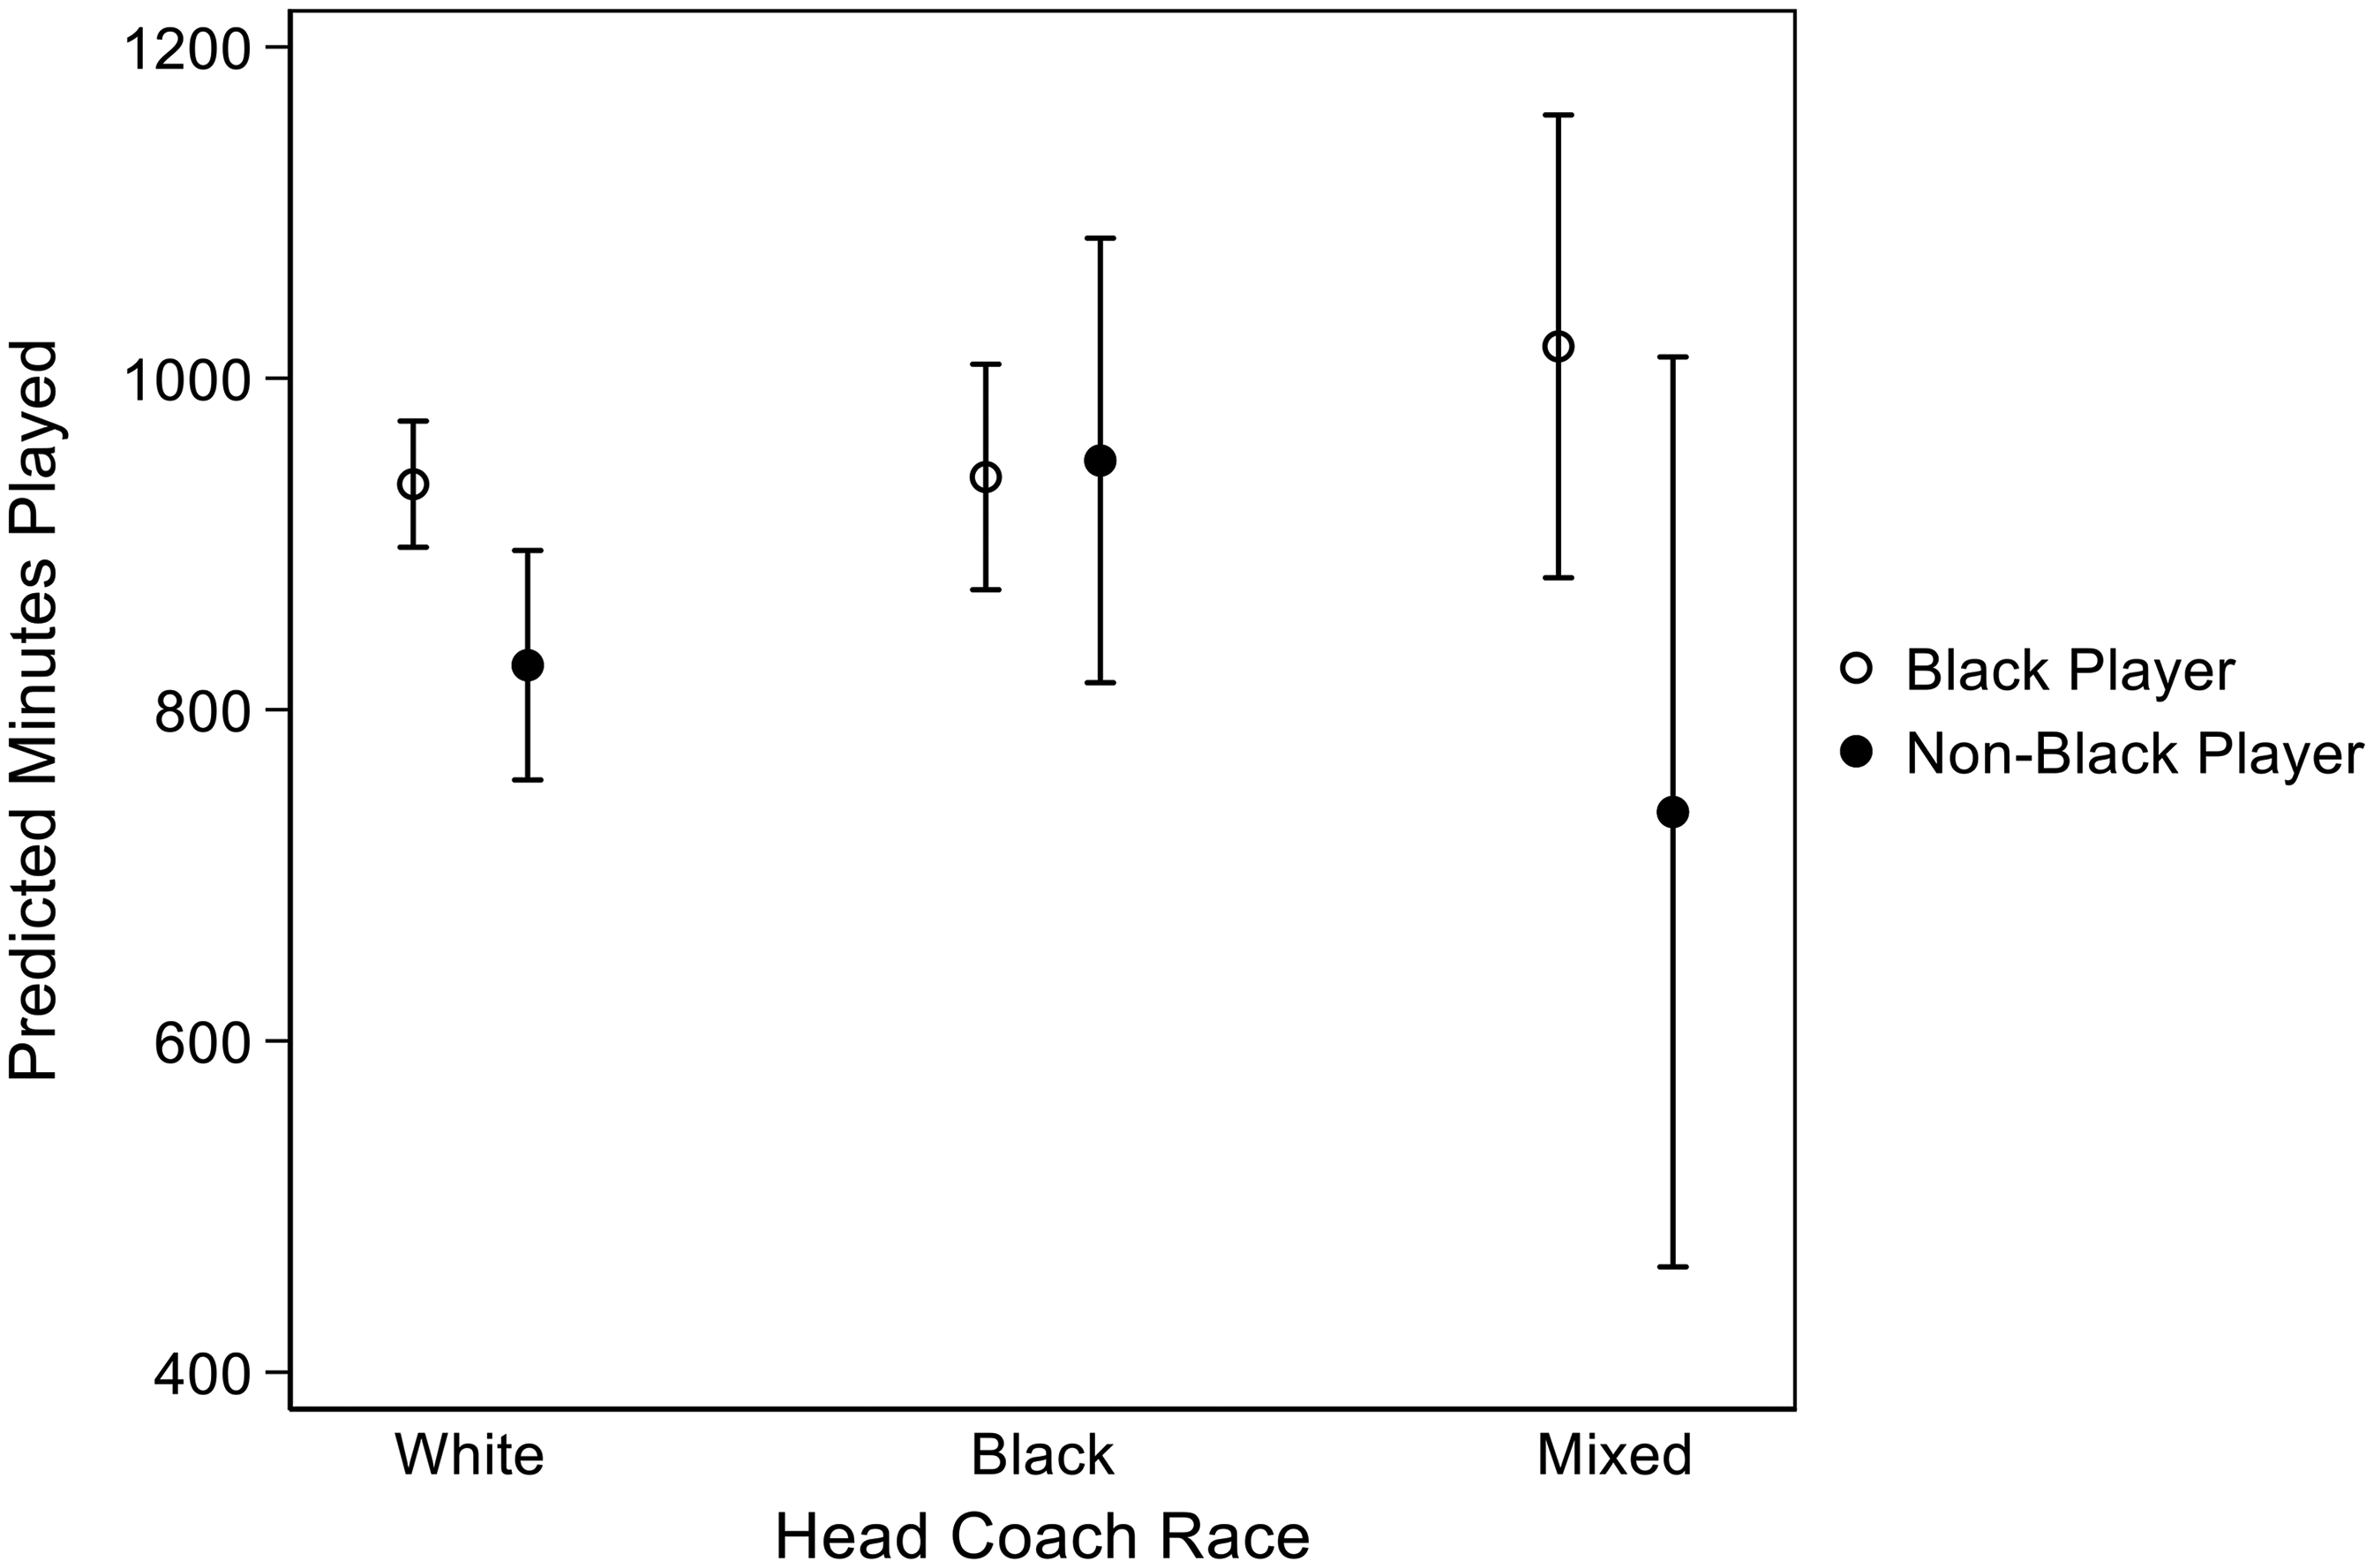
Minutes played by player and head coach race interaction.
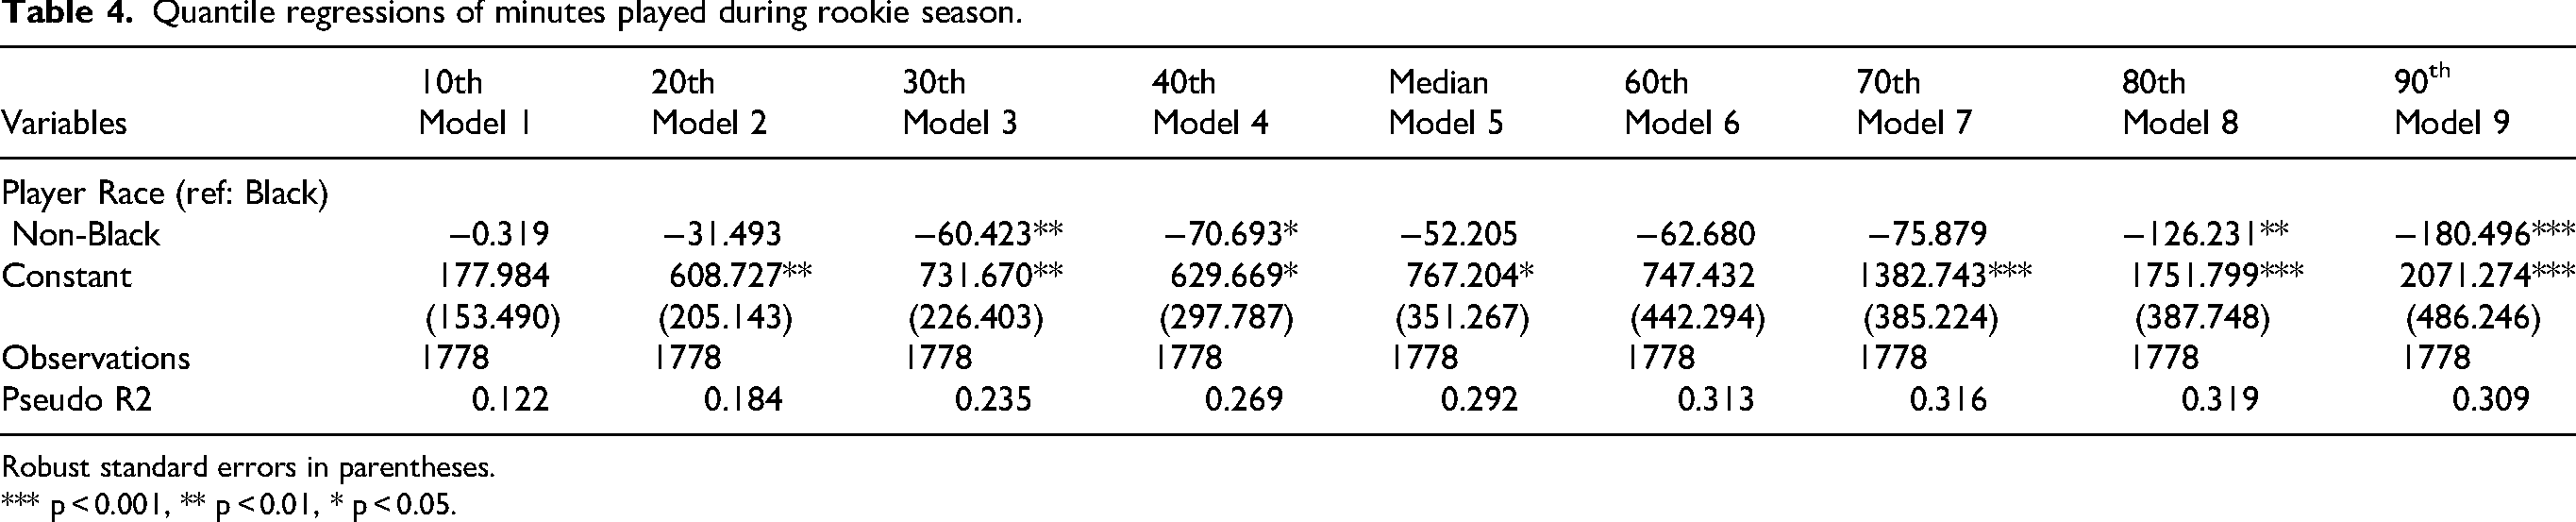
Once again, we refit our final OLS model from Table 3 using quantile regression, and focusing on various points across the conditional distribution of minutes played, with estimates being presented in Table 4. Far from uniform, we see a cluster of modestly sized race coefficients below the median – at the 30th and 40th percentile – which prove significant at varying levels (p < .05 to p < .01) and indicate that non-Black rookies play roughly 60–70 fewer minutes than their Black counterparts. Then, we also see larger and statistically significant race coefficients at the top end of the distribution – at the 80th and 90th percentile – which suggest that non-Black rookies play in 126–180 fewer minutes. As such, being non-Black appears to have a depressing effect on playing time in general, but this impact is greater for those players with unusually high or slightly lower than average playing time. At no point do we see evidence that non-Black players receive more minutes. Once again, this evidences the robustness of our original estimates from the OLS models.
Quantile regressions of minutes played during rookie season.
Robust standard errors in parentheses.
*** p < 0.001, ** p < 0.01, * p < 0.05.
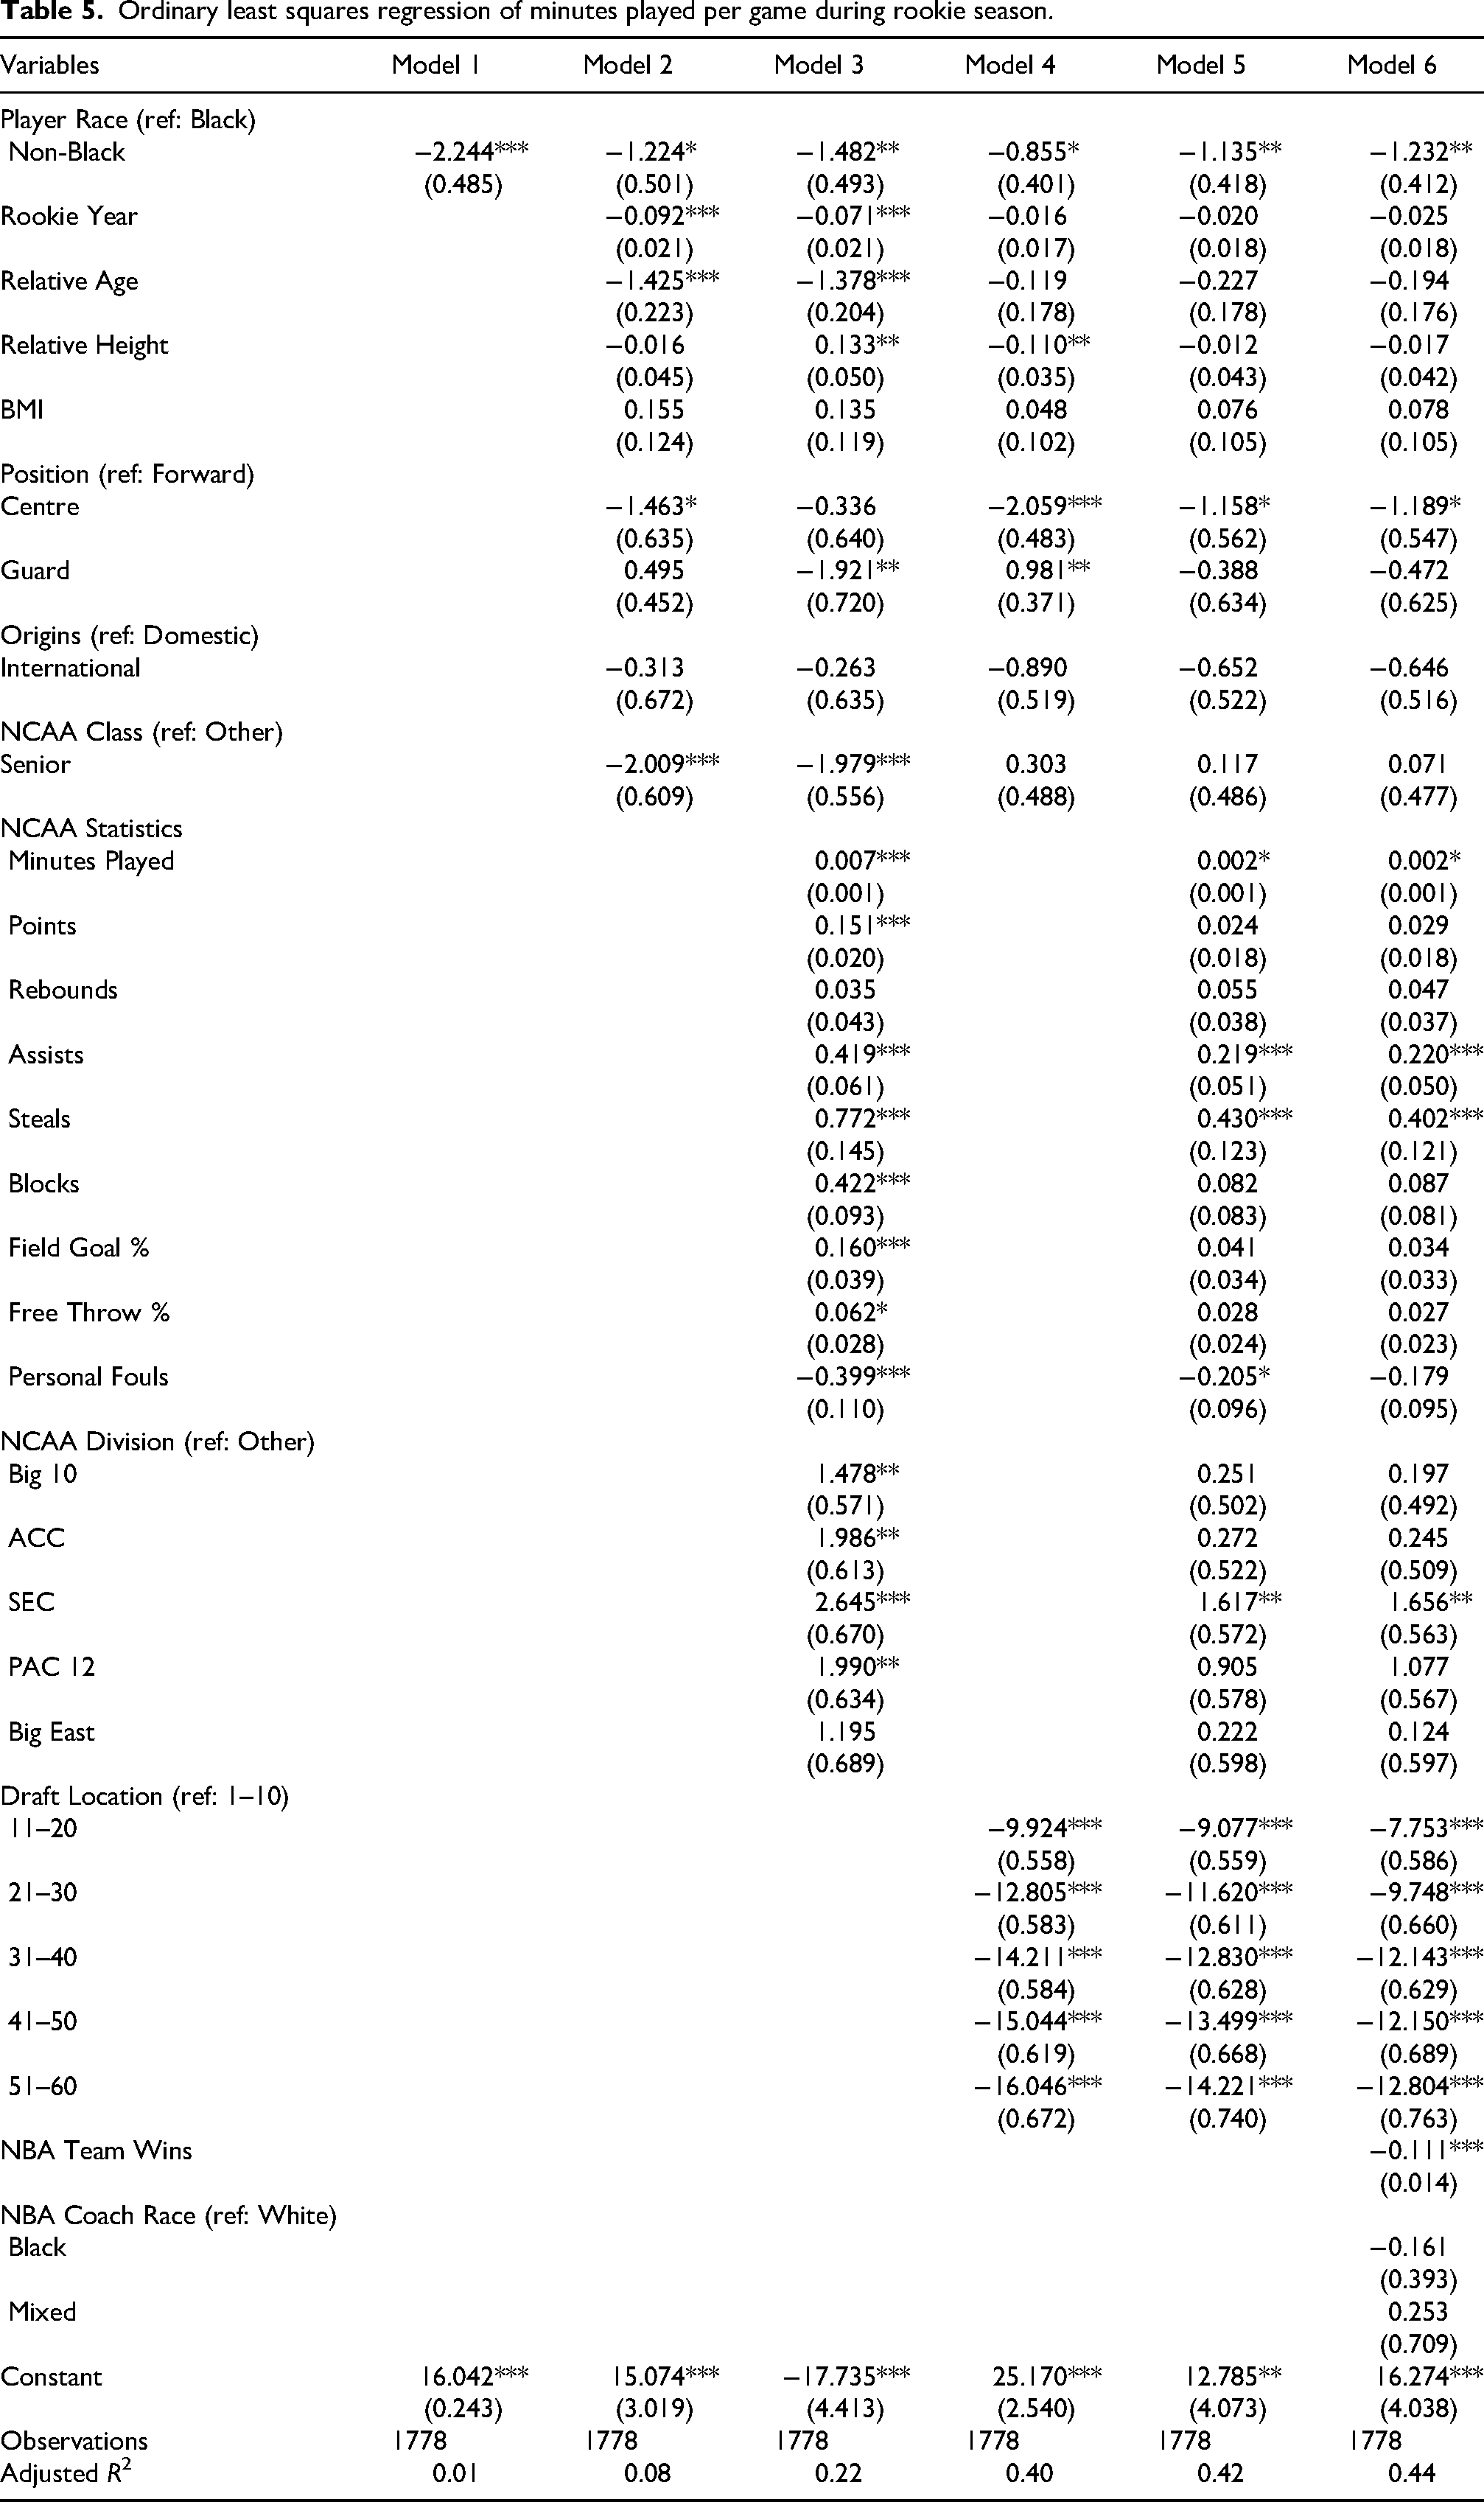
As there are minor racial differences in the number of games played by rookies, we refit the OLS models in Table 3 using minutes per game as the dependent variable. Through Table 5, we see in Model 1 that Non-Black players averaged roughly 2.2 fewer minutes than their Black counterparts (p < .001). This coefficient shrinks further and fluctuates at around 1 min per game through subsequent models, despite the introduction of available controls. Our final estimate through Model 6 indicates a net non-Black penalty of roughly 1.2 min per game (p < .01), a figure comparable to that estimated through McCormick & Tollison's 19 models published two decades ago. These additional models further evidence the robustness of this admittedly small racial difference in minutes played.
Ordinary least squares regression of minutes played per game during rookie season.
Discussion
The findings presented through this manuscript provide a fresh look at racial disparities in the NBA. We produce results that are consistent with existing studies18,19 and which prove highly robust. However, unlike recent work by Zhang, 20 we fail to detect any evidence of same race bias among coaches. Below, we briefly explore several plausible explanations for these observed trends.
Though we repeatedly frame playing time as beneficial, viewing it through the lens of skills development, it can also potentially be viewed negatively as a form of subtle racism. 32 Coaches may take a more cautious approach when managing non-Black players’ playing time and health, pulling them out of games when they experience minor injuries (e.g., rolled ankle), while on the other hand pressuring Black counterparts to remain on the court and play through these injuries. Unfortunately, we are unable to control for this dynamic as we do not have access to information on the occurrence of these types of minor injuries during a game. At the same time, it is important to note that there may be some self-selection at play. Black rookies, potentially perceiving fewer career options outside of basketball, may be more prone to concealing minor injuries from coaching staff, playing through pain, and engaging in other risky behaviors. In the same vein, a lack of perceived alternative career options may drive Black players to develop greater physical conditioning, endurance, and mental toughness. In turn, a coach's decision to play them longer during a game may be a function of disparities in these forms of human capital. Future qualitative research could shed light on players’ views pertaining to playing through injuries, although access to athletes and other elites always proves exceedingly difficult.
While many questions remain, there is room for cautious optimism about the structural features of the NBA as a labour market – along with other professional sports – that are driving relative racial parity in playing time allocation. First, and as we have noted elsewhere, 30 the NBA is characterized by extreme levels of transparency and public scrutiny. The decision to not play a promising prospect, in the absence of injury, will be readily detectable by fans and commentators and translate into criticism of the coaching staff. In the most extreme scenarios, rookies may also publicly advocate for themselves and express displeasure with their limited playing time through interactions with the media. At the same time, when the head office of a given franchise can consistently identify and develop “diamonds in the rough”, this leads to the branding of such staff as talent identification geniuses. Comparable levels of transparency, scrutiny, and recognition for talent identification are not present in generic labor markets. External observers will seldom be emotionally invested enough to scrutinize which junior employees within a company are getting the necessary opportunities for skills development, nor will such form of decision-making ever be discussed in the mainstream news media.
A second factor, which likely wards against blatant forms of bias in the NBA, is the growing quantification of player skill and on-the-court performance. Today, a coach's “gut feelings” are quickly proven wrong by independently published advanced analytics. Moreover, discussions of advanced analytics have seeped into contemporary basketball discourse and been popularized by figures such as former NBA player and podcast host J.J. Riddick – appointed as the Los Angeles Lakers’ head coach shortly after the submission of this manuscript. The popularization of advanced analytics further equips basketball fans to call out inefficient playing time allocation by NBA coaches. Again, there is no equivalent to this dynamic within generic labour markets, a fact that allows subjective evaluations of performance to drive managerial decisions.
Third, the NBA has a longstanding legacy of Black athletic excellence. As numerous commentators have noted, there is a strong argument that Black players are, on average, simply better than their white counterparts. As former NBA point guard Patrick Beverly has argued on his popular podcast, a hypothetical competition between teams composed of the league's top Black and white players would result in a “belt to ass” outcome for the latter. A strong argument can also be made that Black players are overrepresented at the upper tail of the ability distribution. Subjective debates about the Greatest Player of All Time (aka “The Goat”) typically only feature Black players like Michael Jordan, Lebron James, with white standouts like Larry Bird or John Stockton typically slotting in as a next tier of “greats.” Again, this situation contrasts other mainstream labor markets or professions where Black talent has not yet achieved the same level of dominance.
As always, various limitations to our study are also worth noting. Perhaps most importantly, we examine playing time allocation at a single point in a player's career. Disparities in playing time could narrow or widen as coaching staff observe and evaluate players. A second important limitation of our study is that we only see the results of coaches’ decisions. We are unable to understand why particular players were played in certain scenarios. Perhaps white players are perceived to be more suitable bench players than their Black counterparts, 7 and this may prompt them to be drafted for different reasons and allocated lesser time. This non-random allocation of players into team and roles could explain some of the patterns we see. Third, we focus on players traveling the popular NCAA to NBA pathway via the draft, and ignore other structurally small pathways, in order to use key controls for pre-NBA performance. The tradeoff here is that we exclude players traveling atypical pathways into the association. Future work would do well to examine racial disparities in playing time across the broader population of NBA players.
Footnotes
Ethical considerations
Ethics review was not required for this research as it relies entirely on publicly available information.
Consent to participate
Not applicable.
Consent for publication
Not applicable.
Declaration of conflicting interest
The authors declared no potential conflicts of interest with respect to the research, authorship, and/or publication of this article.
Funding statement
The authors received no financial support for the research, authorship, and/or publication of this article.
Data availability
The dataset generated/analyzed through this study is available from the corresponding author upon reasonable request. These data are also freely available from the sources listed within the methodology section.
Appendix 1. Sample descriptive statistics.
| Black (1395) | Non-Black (383) | Total (1778) | ||||||
|---|---|---|---|---|---|---|---|---|
| Mean/Prop. | SD | Mean/Prop. | SD | Mean/Prop. | SD | Min | Max | |
| Dependent Variables | ||||||||
| Rookie Games Played | 49.52 | 25.32 | 46.97 | 24.59 | 48.97 | 25.18 | 1 | 82 |
| Rookie Minutes Played | 959.86 | 815.44 | 778.77 | 718.27 | 920.85 | 798.8 | 0 | 3249 |
| Independent Variables | ||||||||
| Rookie Year | 21.4 | 12.31 | 19.75 | 11.94 | 21.04 | 12.25 | 0 | 42 |
| Relative Age | −0.07 | 1.16 | 0.25 | 1.05 | 0 | 1.15 | −3.18 | 5.51 |
| Relative Height | −0.39 | 4.78 | 1.53 | 4.53 | 0.02 | 4.79 | −29.28 | 17.05 |
| Body Mass Index | 24.45 | 1.84 | 24.48 | 1.52 | 24.46 | 1.78 | 19.65 | 32.82 |
| NCAA Position | ||||||||
| Center | 0.13 | 0.28 | 0.16 | 0 | 1 | |||
| Forward | 0.42 | 0.45 | 0.43 | 0 | 1 | |||
| Guard | 0.45 | 0.28 | 0.41 | 0 | 1 | |||
| NCAA Class | ||||||||
| Other | 0.42 | 0.28 | 0.39 | 0 | 1 | |||
| Senior | 0.58 | 0.72 | 0.61 | 0 | 1 | |||
| Player Origin | ||||||||
| Domestic | 0.91 | 0.77 | 0.88 | 0 | 1 | |||
| International | 0.09 | 0.23 | 0.12 | 0 | 1 | |||
| NCAA Statistics | ||||||||
| Minutes Played | 1016.77 | 193.35 | 1000.97 | 204.53 | 1013.41 | 195.84 | 53 | 1543 |
| Points | 51.47 | 10.79 | 50.63 | 10.54 | 51.29 | 10.74 | 15.4 | 107.41 |
| Rebounds | 20.43 | 8.26 | 22.02 | 7.99 | 20.77 | 8.22 | 5.09 | 47.62 |
| Assists | 7.84 | 4.79 | 7.47 | 5.08 | 7.76 | 4.86 | 0 | 29.52 |
| Steals | 4 | 1.73 | 3.25 | 1.61 | 3.84 | 1.73 | 0 | 12.2 |
| Blocks | 3.05 | 3.11 | 3.15 | 3.06 | 3.08 | 3.1 | 0 | 20.47 |
| Field Goal % | 50.13 | 6.25 | 51.36 | 6.49 | 50.39 | 6.32 | 28.9 | 76.9 |
| Free Throw % | 72.76 | 8.84 | 74.53 | 9.56 | 73.14 | 9.02 | 29.5 | 97.4 |
| Personal Fouls | 7.83 | 2.17 | 8.06 | 2.53 | 7.88 | 2.26 | 0.19 | 20.69 |
| Draft Position | ||||||||
| 1 to 10 | 0.19 | 0.15 | 0.18 | 0 | 1 | |||
| 11 to 20 | 0.18 | 0.20 | 0.18 | 0 | 1 | |||
| 21 to 30 | 0.16 | 0.17 | 0.17 | 0 | 1 | |||
| 31 to 40 | 0.17 | 0.17 | 0.17 | 0 | 1 | |||
| 41 to 50 | 0.16 | 0.18 | 0.17 | 0 | 1 | |||
| 51 to 60 | 0.13 | 0.13 | 0.13 | 0 | 1 | |||
| NCAA Conference | ||||||||
| Big 10 | 0.17 | 0.18 | 0.17 | 0 | 1 | |||
| ACC | 0.15 | 0.14 | 0.15 | 0 | 1 | |||
| SEC | 0.14 | 0.08 | 0.12 | 0 | 1 | |||
| PAC 12 | 0.11 | 0.18 | 0.12 | 0 | 1 | |||
| Big East | 0.11 | 0.09 | 0.1 | 0 | 1 | |||
| Other | 0.33 | 0.33 | 0.33 | 0 | 1 | |||
| NBA Team Wins | 38.15 | 12.85 | 38.05 | 12.5 | 38.13 | 12.78 | 7 | 73 |
| NBA Head Coach Race | ||||||||
| White | .73 | .76 | .73 | 0 | 1 | |||
| Black | .21 | .18 | .21 | 0 | 1 | |||
| Mixed | .06 | .06 | .06 | 0 | 1 | |||