
Abstract
Two 19th-century historical violet dyes from the Historische Farbstoffsammlung, Technical University of Dresden, have been analysed by liquid chromatography–mass spectrometry (LC-MS). The data are presented as charts with retention time and two scales: electron spray mass spectrometry counts (m/z) and milli-absorption units (UV). These dyes are complex mixtures as anticipated from the synthetic methods involving partial alkylation of rosaniline or synthesis using mixtures of N-methylaniline and N,N-dimethylaniline. The charts typically show chromophores separated by CH2 units which have separated well. Hofmann’s violet is presumably made by Hofmann’s method of synthesis, but the analyses do not verify with certainty who the inventors are because of the complexity of the dye mixtures.

Introduction
Mauveine was the first aniline dye from which many others followed.1–4 Benzene and toluene and other aromatics were by-products from coal-tar distillation which produced illuminating gas. 5 Benzene was difficult to distil free from toluene so after nitration and reduction aniline contained small amounts of toluidine. 6 Caro’s mauve in the Deutsche museum is mainly pseudomauveine suggesting that pure aniline was available from 1860. 7 However, Perkins-Museum-stored mauveine is rich in two homologues: mauveine A and mauveine B, suggesting it was made from aniline enriched with toluidine, which gives a better yield. 6 In line with these studies, other aniline dyes, such as reds, blues, greens and violets, might be expected to be mixtures.8,9 Our work on triphenylrosaniline showed it to be a complex mixture of homologues which separated beautifully by liquid chromatography–mass spectrometry (LC-MS). 10 There are a number of different historic violet dyes made by different investigators which should have different isomers and homologues because of their method of synthesis. 11 The Hofmann violets, patented in 1863, were made by alkylating rosaniline (also known as fuchsin or aniline red)12–16 with methyl and ethyl iodides or bromides in methylated spirit in a sealed iron boiler at up to 150°C (Figure 1). 17

Drawing illustrating the complex mixtures of aniline red, also known as fuchsin or rosaniline, the violets and the simpler structure of crystal violet. The rosaniline was made by oxidative condensation of p-toluidine, which provides the middle carbon, with two units selected from aniline and o-toluidine.
Perkin’s Britannia violet, 2 patented in 1864, was made by alkylating rosaniline in alcohol with aqHBr, prepared by treating turpentine with bromine, and heating in a closed vessel for 8 h at 150°C.18,19 Perkin was not able to purchase a source of aqHBr so it was made in house. Lauth 20 discovered violet de Paris and its method of synthesis, but did not commercialise it apparently because of restrictions in France over the use of rosaniline. The synthesis was commercialised in 1866 by A Poirrier and C Chappat who alkylated aniline hydrochloride with methanol to give a mixture of N-methylaniline and N,N-dimethylaniline which was then oxidised with Sn(II) and Hg(II) salts into a violet dye heating by heating at 175°C–300°C (Figure 2). 21 The acid is the catalyst and appears on both sides of the equation in Figure 2. The question arose as to whether violet de Paris was the same as rosaniline violet. Lauth considered that they were the same noting that pure aniline was used. Wanklyn patented a violet dye in 1864 by alkylating rosaniline with an oil, made from treating manna sugar with HI and phosphorous, at 120°C. 22 This is reported to be a mistake, and he used glycerol instead of manna sugar which liberates 2-iodopropane as the alkylating agent.23–27 2-Iodopropane is an oil, with a boiling point of 89°C, which would distil from the reaction mixture as reported. The reaction mixture was an alcohol with a large excess of HI (1:30), which boils as an azeotrope (57% HI:43% H2O) at 127°C. Alky iodides from reducing manna sugar would have much higher boiling points (>170°C). Crystal violet was patented by Caro in 1883 and was prepared by treating N,N-dimethylaniline with phosgene and AlCl3. 28 He named it Crystal Violet because of its crystallinity and brilliant shades.

Bardy’s alkylation of aniline hydrochloride with methanol. 21
Discussion
LC-MS data for the analysis of two historic violet dyes (

UV at 550 nm, EIC of M+ ions for compounds.

UV at 550 nm, EIC of M+ ions for compounds.
Compound peak areas for Figure 3 relative to the total peak area.

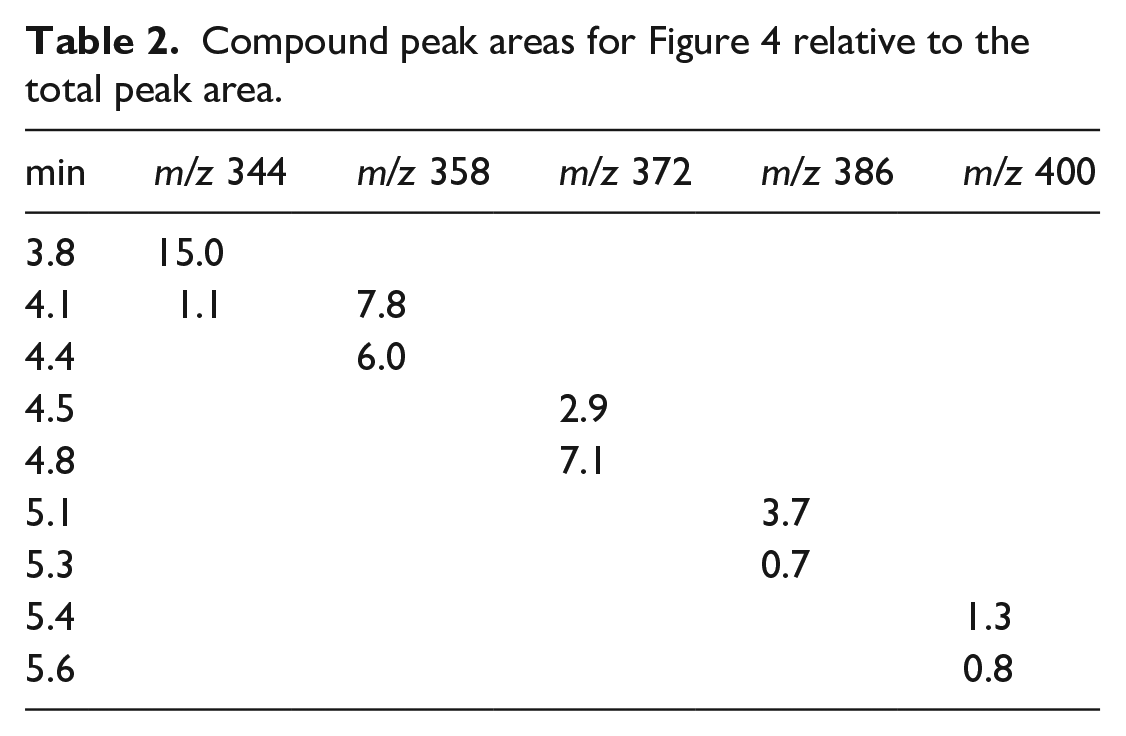
Compound peak areas for Figure 4 relative to the total peak area.
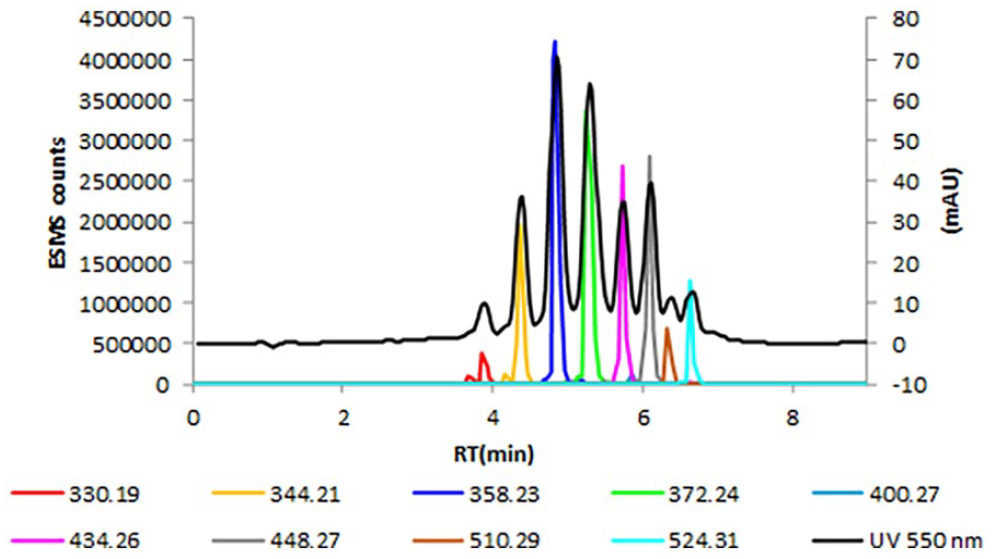
UV at 550 nm, EIC of M+ ions for compounds.
Compound peak areas for Figure 5 relative to the total peak area.

Figure 5 shows LC-MS data for the second historic violet dye

Possible structures of the higher molecular weight dyes appearing in Figure 5.
The early dye chemists developed some interesting chemistry for which the mechanisms may not have been fully explained to date. Turpentine contains α-Pinene. WH Perkin used its reaction with bromine commercially to liberate aqHBr as he was not able to buy aqHBr.
2
The by-product is cymene so the driving force of aromaticity along with the molecular strain of pinene facilitates the reaction. A mechanism for this reaction is proposed here in Figure 7. The alkene will brominate forming a bromonium ion

Proposed α-Pinene to cymene conversion with aqueous bromine generating HBr.
Figure 8 proposes a mechanism for the reaction of glycerol with HI and phosphorous to form 2-iodopropane
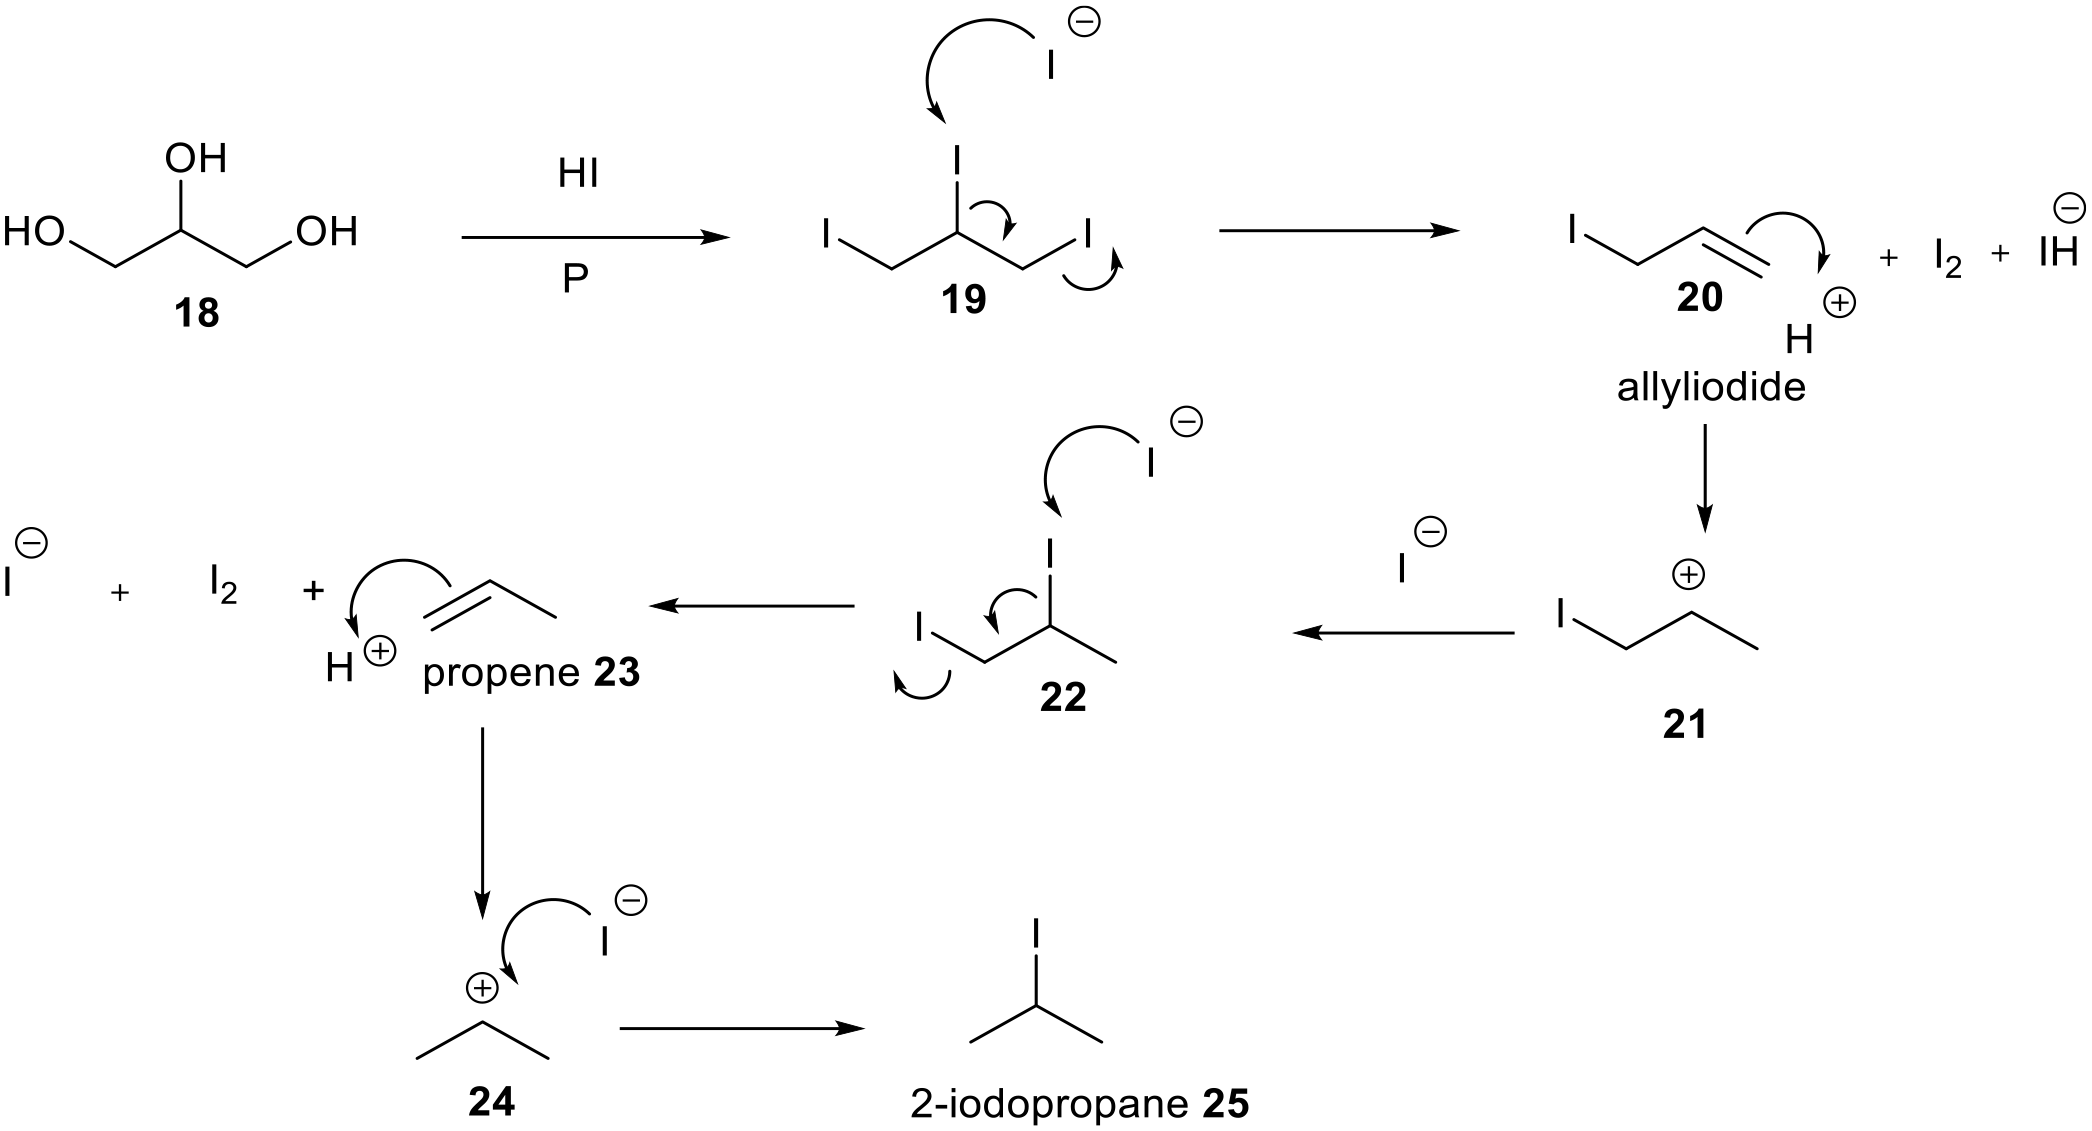
Proposed sealed reaction of glycerol with HI and phosphorous. The phosphorous mops up the iodine.
Conclusion
Two historical violet dyes from the Technical University of Dresden have been analysed by LC-MS. Both are complex mixtures of chromophores which separated effectively into individual components. The first mixture
Experimental
For analytical separation, an Agilent 1290 Infinity high-performance liquid chromatography (HPLC) system consisting of a quaternary HPLC pump, cooled auto sampler compartment, column compartment, and diode array UV-visible detector was used. A Gold C-18 column (2.1 mm × 150 mm, Thermo Scientific, UK) was used for separation with a water/methanol gradient (both 0.1% v/v formic acid) from 40% to 100% MeOH in 7 min. The flow rate was 0.5 mL min−1, column temperature 40°C and sample volume 5 µL. The mass spectrometer (ESMS) used was a MAXIS II Ultra-High Resolution Time-Of-Flight (UHR TOF) LC-MS System (Bruker UK Ltd, England) with electro spray ionisation (ESI) source connected to the UV-visible detector by a short length of polyether ether ketone (PEEK) tubing. The ESMS was operated in positive ion mode with a capillary voltage of 4.5 kV using sodium formate clusters for calibration and methyl stearate as lock mass. Mass spectra were recorded automatically.
Sample preparation
Samples of two dyes were provided in small plastic bags. These were cut open with scissors, and a grain or two of dye was removed with a spatula and placed in a small sample vial (2 cm × 4 cm). The spatula was cleaned each time to avoid cross-contamination. The grains were dissolved in MeOH and sent for analysis in a sealed sample vial.
Supplemental Material
sj-docx-1-chl-10.1177_17475198231196759 – Supplemental material for Violet dyes of the 1860s: Hofmann, Britannia, violet de Paris, Wanklyn’s, and Crystal violet (1883)
Supplemental material, sj-docx-1-chl-10.1177_17475198231196759 for Violet dyes of the 1860s: Hofmann, Britannia, violet de Paris, Wanklyn’s, and Crystal violet (1883) by M John Plater, Andrea Raab and Horst Hartmann in Journal of Chemical Research
Footnotes
Acknowledgements
The authors thank the UK EPSRC National Mass Spectrometry Service Centre for mass spectrometric data and the UK National Crystallography Centre (University of Southampton) for the X-ray data collections. M.J.P. performed all synthesis and obtained the characterisation data and W.T.A.H. solved the crystallographic data sets. Data sets were obtained free of charge from the National Crystallography Centre, Southampton University.
Declaration of conflicting interests
The author(s) declared no potential conflicts of interest with respect to the research, authorship, and/or publication of this article.
Funding
The author(s) received no financial support for the research, authorship, and/or publication of this article.
Supplemental Material
The proton and carbon NMR data for all compounds in the experimental section is reported in the Supplemental Material (Figure SI).
References
Supplementary Material
Please find the following supplemental material available below.
For Open Access articles published under a Creative Commons License, all supplemental material carries the same license as the article it is associated with.
For non-Open Access articles published, all supplemental material carries a non-exclusive license, and permission requests for re-use of supplemental material or any part of supplemental material shall be sent directly to the copyright owner as specified in the copyright notice associated with the article.