
Abstract
By means of liquid chromatography–mass spectrometry and other analytical methods, a variety of different samples of the phenazine dye Chrysaniline hosted in the Historical Dyestuff Collection of the Technical University Dresden and registered mostly under the trade name Phosphine have been analysed. It was found that all the dyes analysed are mixtures of compounds with different numbers of methyl groups at their phenazine core. They result, hence, from the oxidation of technical aniline that contained several amounts of isomeric toluidines and traces of dimethylanilines.
Analysis of certain samples of phenazine dyes from the Historical Dyestuff Collection of the Technical University Dresden by liquid chromatography–mass spectrometry
Introduction
Aniline, as the parent compound of aromatic amines, was one of the first raw materials that was isolated from tar in rather low yield, but initially in sufficient amounts in the first third of the 19th century. Owing to its high reactivity, it found rapid interest as a starting material for the preparation of a large variety of products, especially for the preparation of organic dyes. 1 For their synthesis, oxidation reactions using different oxidation reagents have been mainly used. 2
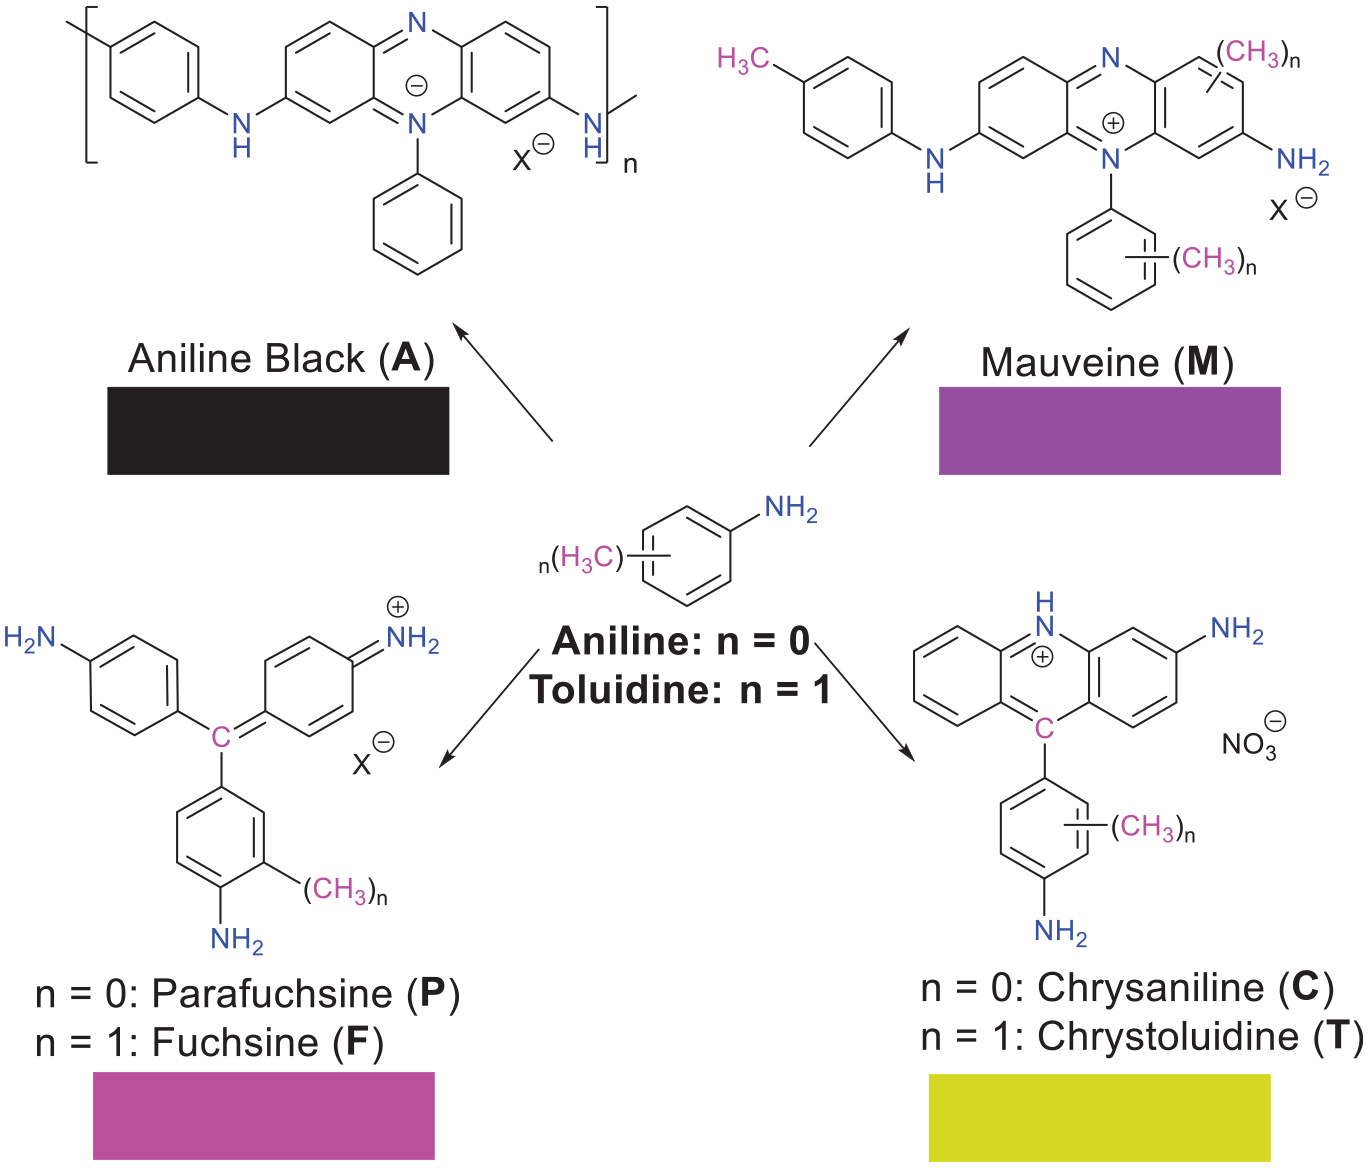
Depending on the reaction conditions applied and the quality of the starting materials used, different products were formed. For example, by oxidation of aniline (

Different organic dyes synthesised by oxidation of aniline/toluidine mixtures.
As far as the aniline oxidation is performed with starting materials that contain different amounts of ortho- and para-toluidine and other oxidising reagents, such as potassium dichromate, are used, some other products such as Mauveine, Parafuchsine and Chrysaniline were obtained.5,6 Their colouristic properties are demonstrated in Figure 1, in which pieces of wool were dyed with samples of these dyes (Figure 1).

Pieces of wool dyed with the obtained dye samples.
However, the dyes used practically contain mostly different amounts of methyl-substituted derivatives, such as Fuchsine or Chrystoluidine. Therefore, subsequent to the synthesis of these dyes, more or less extended purification procedures were necessary for obtaining pure products. However, this time and cost-intensive procedure has lost its importance since improved synthetic methods for these dyes have been elaborated (Scheme 2). Thus, Fuchsine (
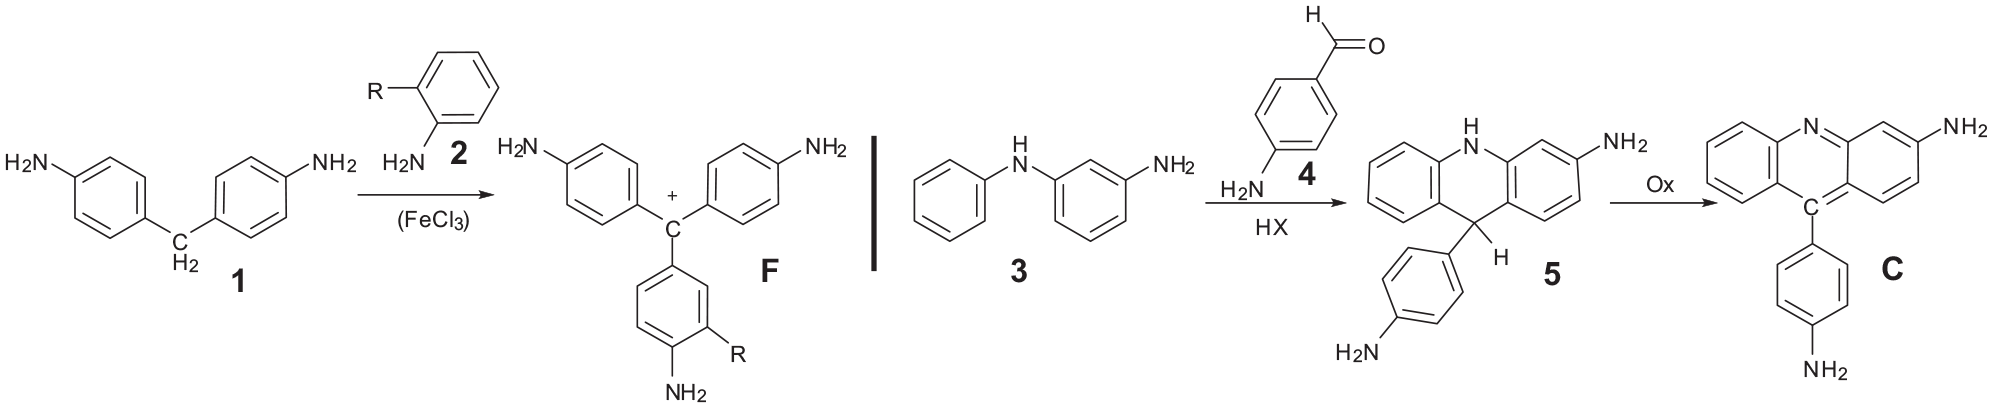
Alternative synthetic routes to Fuchsine dyes (
The classical synthetic procedure for preparation of these Fuchsine dyes was designed as ‘Fuchsine smelt’ (Fuchsinschmelze) and has been performed using arsenic acid as oxidation agent.
12
Thereby, Chrysaniline (
For Mauveine (

Structures and names of the Mauveine dyes.
Also for Fuchsine, several studies concerning the presence of different compounds in the solid products are reported (refer to Scheme 4). For example, in certain products of different producers, mainly Rosaniline (

Structures and names of the Fuchsine dyes.
In contrast to Mauveine and Fuchsine, for Chrysaniline, nearly no analytical studies on the composition of the solid products are known at present. Therefore, no detailed information on the preparative procedures for this dye is available. However, it can be assumed that during the synthesis of Chrysaniline by starting with certain aniline/toluidine mixtures, similar reactions proceed to those during the synthesis of Fuchsine with the only difference, that instead of para-toluidine the isomeric ortho-toluidine plays an important role. 24 Their behaviour during the Chrysaniline formation will be discussed subsequently more in detail.
In the Historical Dyestuff Collection of TU Dresden, besides several samples of Mauveine and Fuchsine, 25 nearly one dozen different samples of Chrysaniline are also hosted; hence, their compositions have been studied in more detail now. These dyes, most of which are designed as Phosphine and were sold under different trade names, originated from different producers and came on the market in 1882. Owing to their ‘Schönheit und Echtheit sowie ihrer eminenten Verwendbarkeit zu Combinationsfarben’, these dyes were intensively praised and commercially used at this time,26–28 but they lost their importance later on. In the course of our analytical studies documented herein, certain information on the applied synthetic routes can be derived.
Results and discussion
All samples used for the liquid chromatography–mass spectrometry (LC-MS) measurements were dissolved in formic acid containing a mixture of water and methanol (60/40 v/v containing formic acid (0.1% v/v)). Clear solutions with red, orange or yellow colour were obtained. In Figure 2, the colours of all the Chrysaniline dyes (1–11) dissolved in methanol with an arbitrary concentration are shown. Sample 12 shows a solution of Fuchsine.

Solutions of the Chrysaniline samples (1–11) and Fuchsine (12) in H2O/MeOH solution.
In Figure 3, the thin layer chromatograms (TLCs) of the dyes studied are depicted. As can be seen, the purities of the samples are rather different. This indicates the presence of certain isomeric and homologous compounds in the samples studied, which has to be further confirmed by LC-MS measurements.

TLCs of Chrysaniline Samples 1–11 and Fuchsine (Sample 12).
In Figure 4, the LC chromatograms of Samples 1, 2, 4 and 5 are shown as examples. The chromatograms of the other dyes are given in the Supporting Information. The figures show the total ion currents (TIC), representing the sum of the intensities of protonated compounds over the whole measured mass range, as black lines.

LC chromatograms of Chrysaniline Samples 1, 2, 4 and 5. The black lines represent the TIC. Coloured lines show the intensities of the protonated molecular ions of the most abundant compounds in the samples (extracted ion current, EIC).
All the TIC chromatograms show numerous signals indicating the presence of different compounds in each sample. For each signal, the corresponding high-resolution mass spectrum exhibits the molecular weight and the elemental composition of the compound measured. 29 As an example, the mass spectrum of the peak at about 4 min in the chromatogram of Sample 1 with a mass of 286.1344 is shown in Figure 5.

High-resolution mass spectrum of the chromatographic peak at about 4 min with a mass of 286.1344 in the chromatogram of the Chrysaniline Sample 1.
The exact measured mass of the protonated molecular ion of m/z 286.1316 confirms the elemental composition C19H16N3+ for this compound (the deviation from the theoretical exact mass 286.1344 fits the experimental error) and documents, therefore, the presence of Chrysaniline. This statement can be evaluated by fragmentation of the protonated molecular ion using an MS/MS experiment. In this experiment, the protonated molecular ion of the compound is separated by the first mass analyser, a quadrupole, then fragmented in a collision chamber in which the exact mass of the resulting ions is measured using a time-of-flight (TOF) analyser. As an example of this procedure, the MS/MS spectrum of the corresponding Chrysaniline is shown in Figure 6.

MS/MS spectra of the protonated molecular ion of supposed Chrysaniline at m/z 286.
Most of the signals in the MS/MS spectra are assigned using their exact masses based on known fragmentation rules. 29 Thereby, a fragmentation mechanism for the compound in question may be assumed. The mechanism is given in Figure 7 and confirms the structure of Chrysaniline.

Fragmentation mechanism of Chrysaniline, obtained from MS/MS measurements.
In this way, the most intense signals in all the chromatograms are assigned to the appropriate compounds. The corresponding data are collected in the Supporting Information. An overview of the identified compounds is given in Table 1. Note, that the proposed structures for Chrysaniline (
Compounds detected as their protonated molecular ions in the chromatograms of the analysed dye samples, assigned by their exact masses.


The letters in the rings indicate the used starting compounds (
The same situation is valid also for the position of the amino group in fragment
Therefore, efforts to separate the dye components in the samples by means of preparative column chromatography have been performed. However, owing to the very small differences in the polarity of the isomeric or homologous Chrysaniline compounds, no complete separation of the components in the samples was possible, as was evident from nuclear magnetic resonance (NMR) measurements (see the 1H NMR spectrum of the analysed Sample 1 in the Supporting Information SI 10).
Figure 4 contains additionally the ion chromatograms of the protonated molecular ions of the most abundant compounds in the samples. The assignment of these ions to particular compounds refers to Table 1. The intensities of the signals in the ion chromatograms offer an estimation of the amounts of the compounds in the appropriate samples. However, the composition of the samples may be determined more in detail using the peak areas of these signals. Therefore, in all cases, the peak area in the ion chromatograms was calculated for every compound and the values obtained were normalised to the signal with the highest peak area. The results are given in Table 2. Note, that only the signal intensities of the same compound can be compared between the different samples. Due to the varying ionisation efficiencies of different compounds, the intensities of the ions depend on the particular substance. In addition, in Table 2, the maximal numbers of isomers of each compound detected in the samples are given in brackets. These numbers refer to the numbers of signals in the LC chromatograms with the same mass. They confirm the presence of isomers in the detected compounds. For example, the four signals detected in the ion chromatograms for the Samples 2 and 4, and depicted in Figure 3, indicate the presence of four different isomers in these probes. However, it is not clear if all the isomers in these samples could be detected precisely because the resolution of the chromatographic device and its sensitivity is restricted.
Relative intensities of the protonated molecular ions of the compounds (refer to Table 1) detected in the dye Samples 1–11.
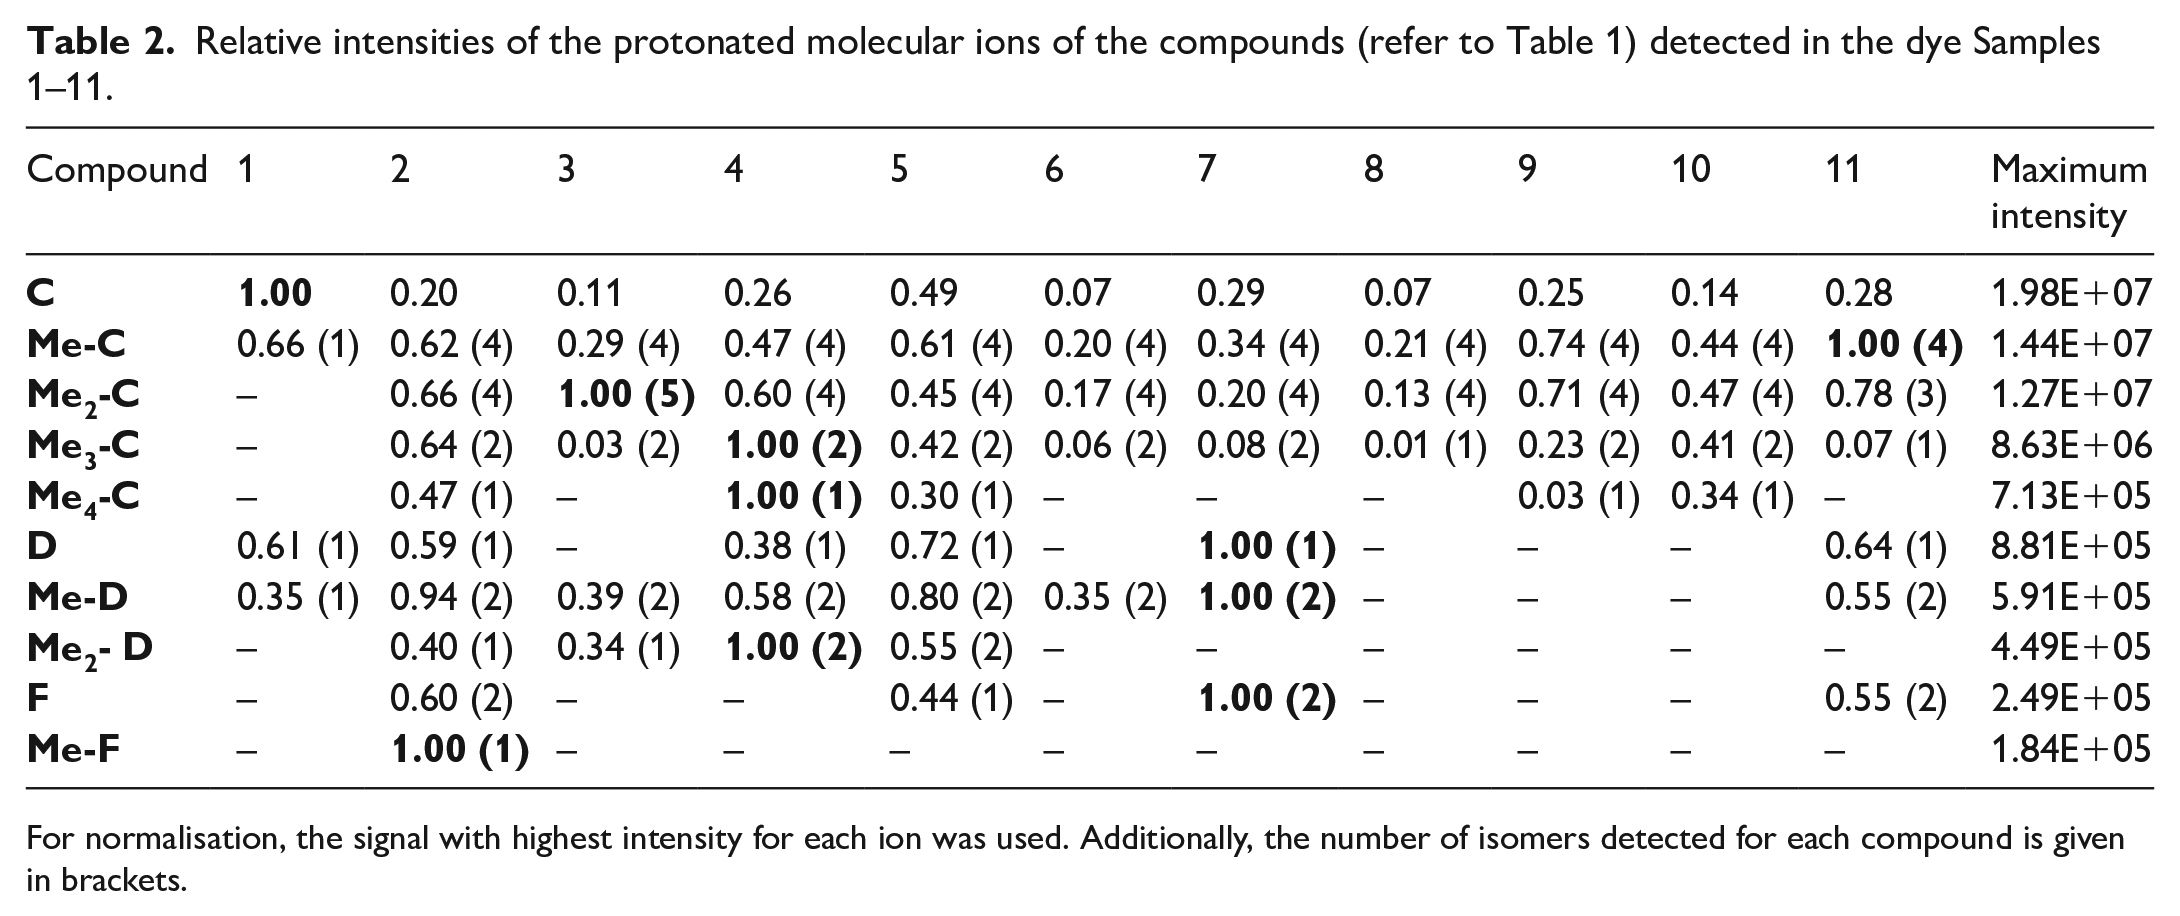
For normalisation, the signal with highest intensity for each ion was used. Additionally, the number of isomers detected for each compound is given in brackets.
From these data, valuable information on the practised routes for the preparation of the Chrysaniline dyes can be derived. Thus, in the chromatograms of all samples, besides the molecular ion peak at 286.1344 for the protonated Chrysaniline (
Conclusion
From the analytical measurements previously documented, two different mechanistic routes for the formation of Chrysaniline by means of oxidation of an aniline/toluidine mixture can be derived as alternatives for the formation of Mauveine (route a, Scheme 5). Thus, in the first route (route c in Scheme 5), ortho-toluidine was activated by the applied oxidation reagent at its ortho-linked methyl group with initial formation of a reactive radical cation
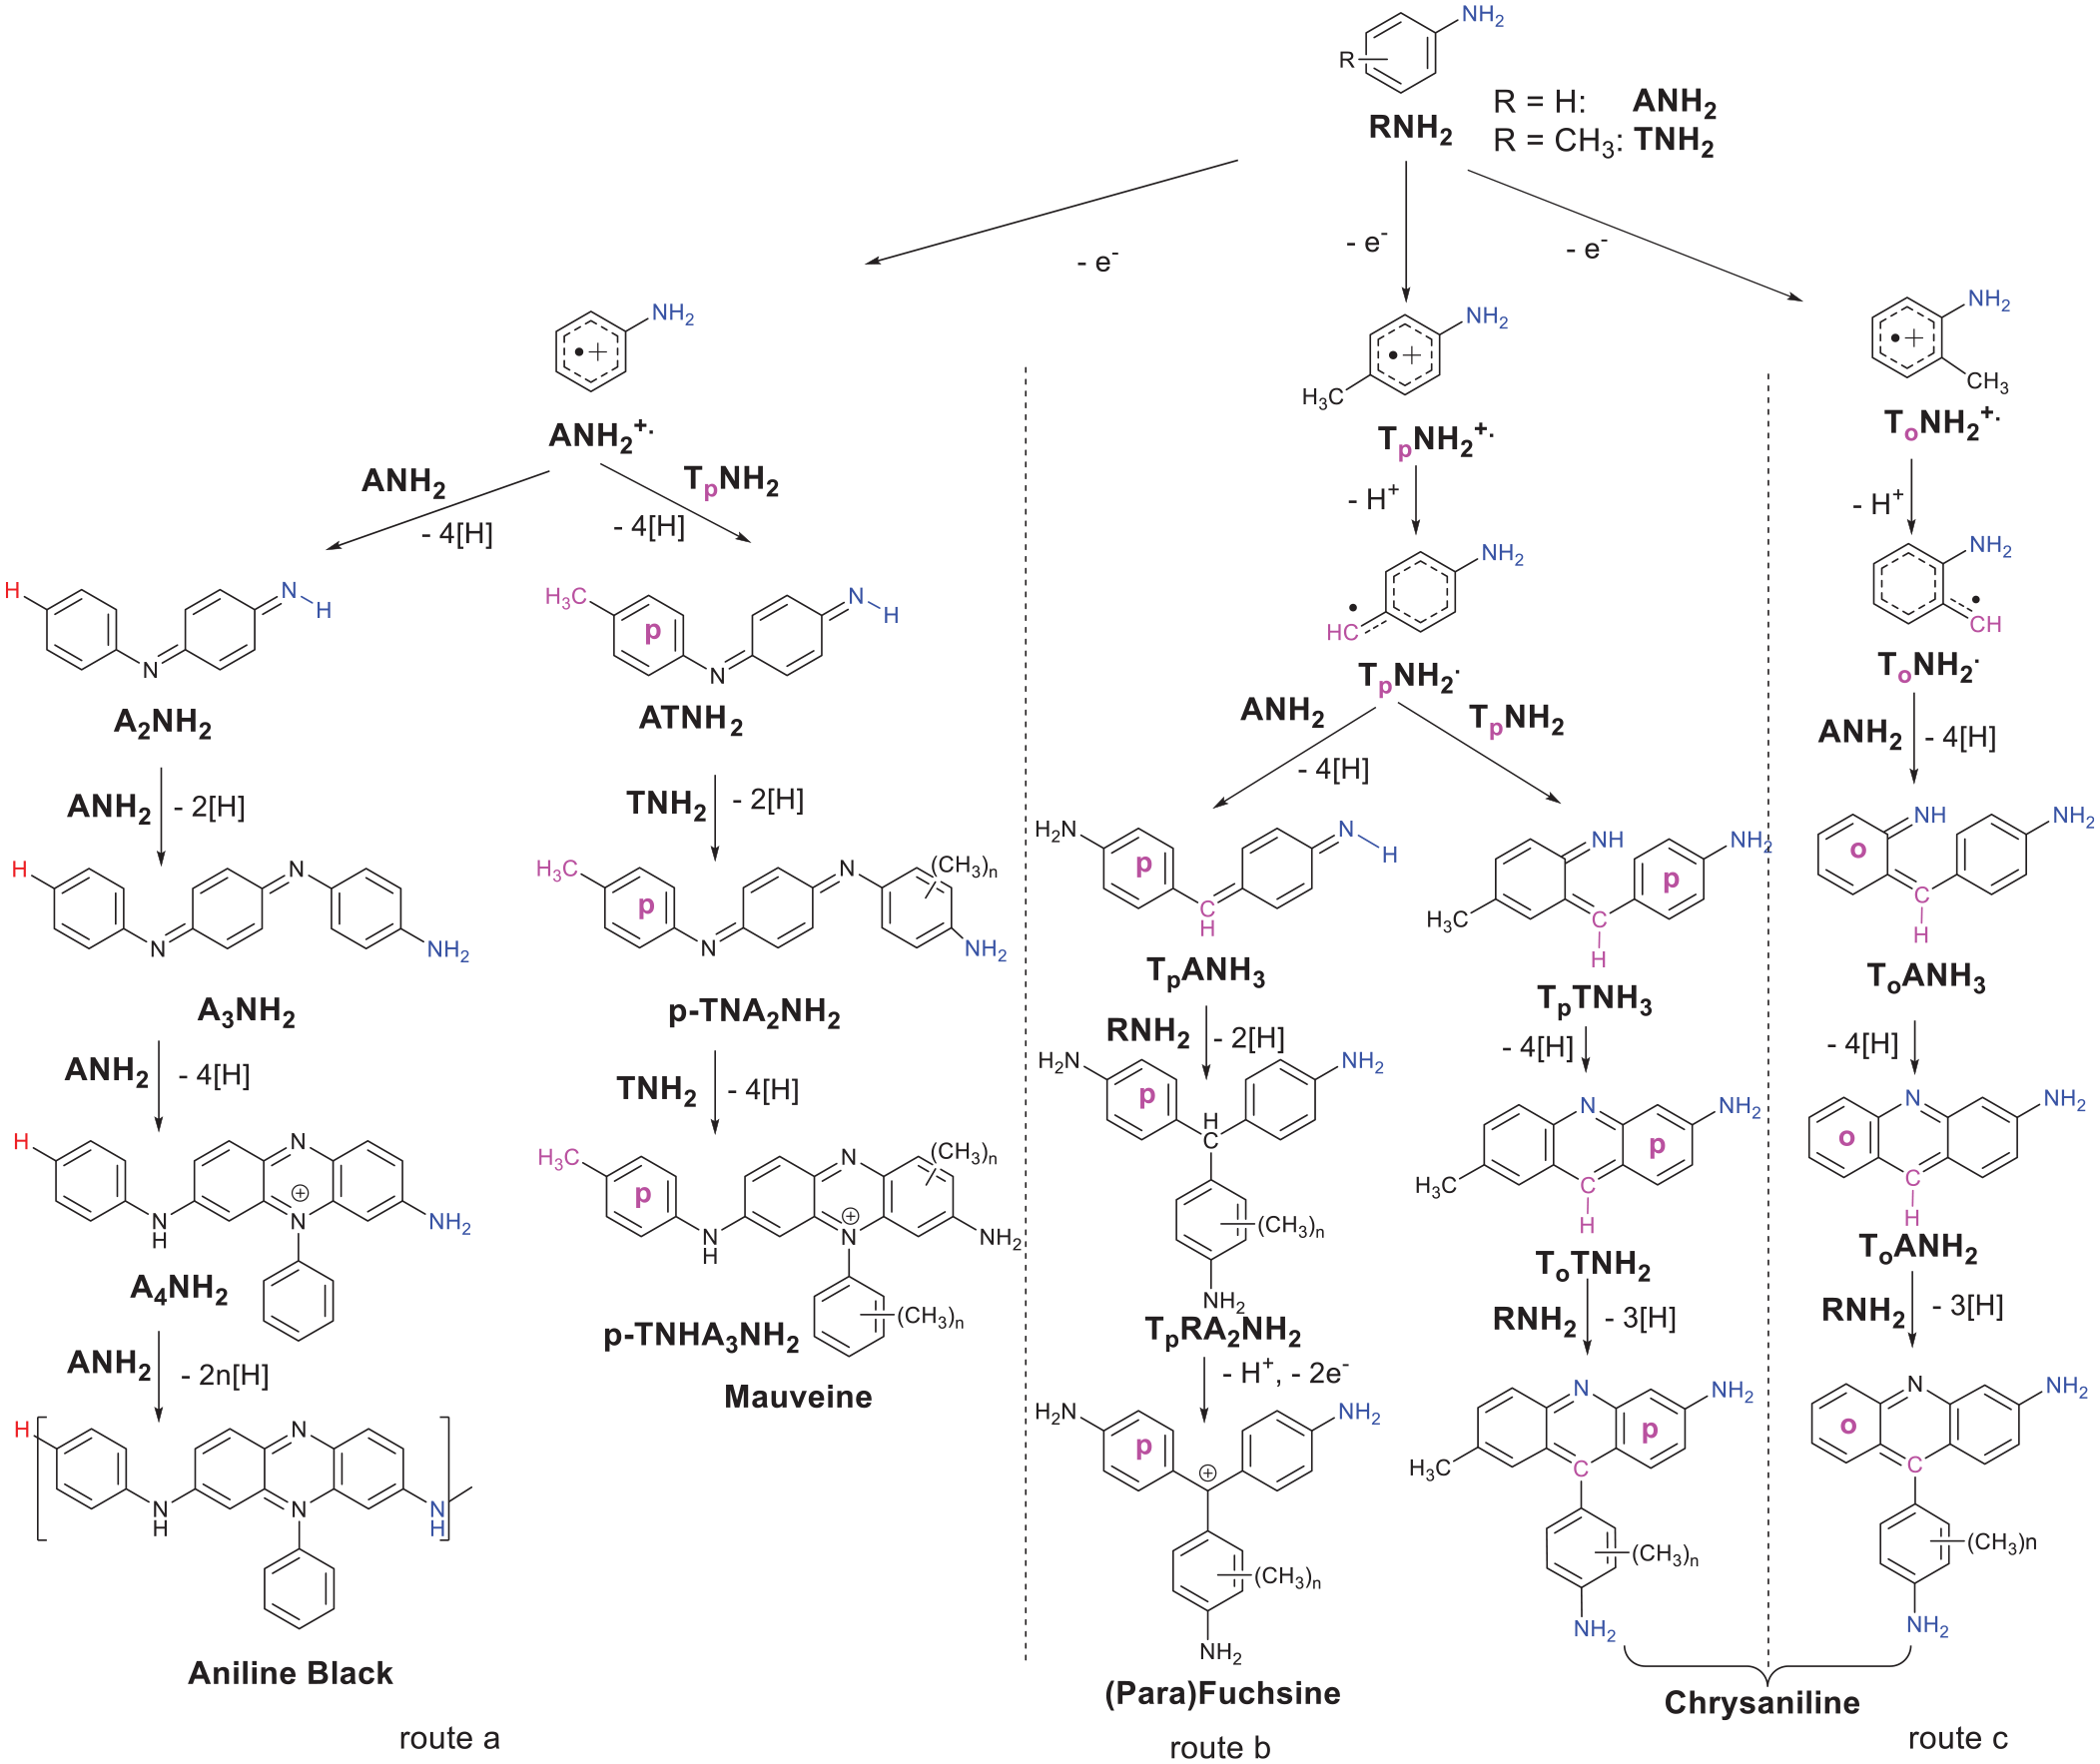
Possible mechanistic routes to Aniline Black, Mauveine, Fuchsine and Chrysaniline.
Alternatively, in a second route b, para-toluidine was activated on its para-linked methyl group with initial formation of the radical cation
Although in the course of both alternative routes, methyl groups were introduced into the Chrysaniline core; in the route b, a methyl group of para-toluidine was introduced at the 7-position of the 3-amino-acridine moiety, whereas via route c, methyl groups were introduced only on the arylamine moiety linked at Position 9 of the acridine core.
Unfortunately, from the LC-MS measurements, no decision on both these alternatives can be derived. Nevertheless, these measurements indicate unambiguously the use of an aniline/toluidine mixture and the application of the Fuchsine smelt as a synthetic route for the preparation of Chrysaniline dyes analysed and ruled out the use of 2-aminodiphenylamine (
Experimental
Samples
For the experiments, the samples hosted in the Historical Dyestuff Collection of the Technical University Dresden were used. Information about these samples is collected in Table 3.
Information and the internal notation on the dyes used for the experiments.
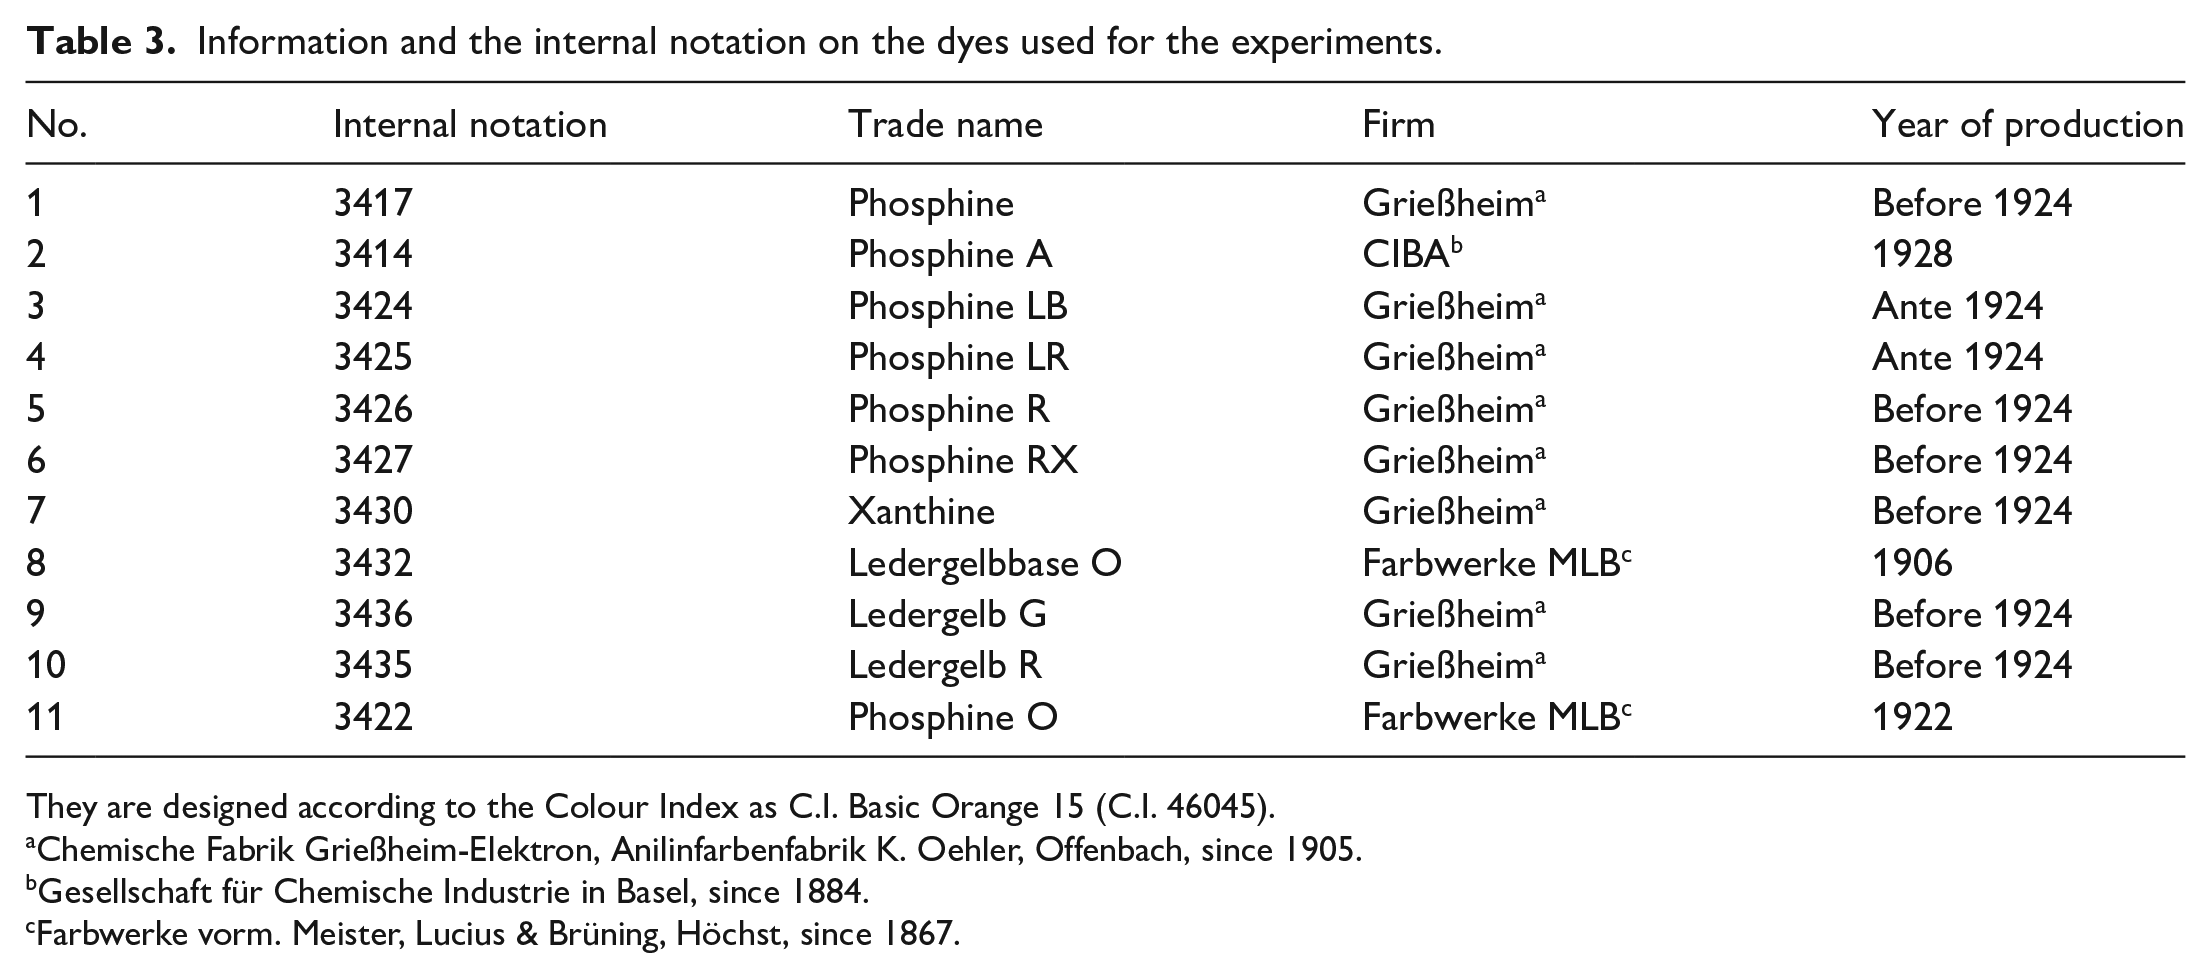
They are designed according to the Colour Index as C.I. Basic Orange 15 (C.I. 46045).
Chemische Fabrik Grießheim-Elektron, Anilinfarbenfabrik K. Oehler, Offenbach, since 1905.
Gesellschaft für Chemische Industrie in Basel, since 1884.
Farbwerke vorm. Meister, Lucius & Brüning, Höchst, since 1867.
Dyed textile strip
The dyed textile strips depicted in Figure 1 were prepared by dipping the uncoloured textile strips into an aqueous solution of the corresponding dye with a concentration of ca. 10%.
TLC
A methanolic solution of the dye samples was deposited on a strip of alumina covered with silica and eluted with a mixture of methanol/ethyl acetate (2:1).
Column chromatography
To obtain a pure sample of Chrysaniline dye for 1H NMR measurement, a crude probe of Sample 1 (2 g) was dissolved in water (50 mL) and the precipitate obtained after addition of aqueous NaOH (5 mL, 10%) was isolated by filtration and dried in air. The dried sample was deposited on a column filled with silica and eluted with acetone. After evaporation of the solvent, the residue was examined by 1H NMR spectra (Figure SI 10).
Sample preparation for LC-MS measurements
The samples of the dyes were provided as powders. A 3.5 mg of each sample was dissolved in 10 mL of a mixture of water/methanol (60/40 v/v) containing formic acid (0.1% v/v). Water was purchased from Fisher Chemical, and methanol and formic acid were acquired from VWR Chemicals (both HiPerSolv CHROMANORM LC-MS). The resulting solution was diluted by a factor of 10 using the same water/methanol mixture and subsequently filtered with a 0.2 µm membrane syringe filter (Nalgene™; Sartorius Stedim Biotech). The filtered solution was directly injected into the high-performance liquid chromatography (HPLC) system without any further preparation.
LC-MS measurements
Chromatographic separations were done using an Agilent 1260 Infinity HPLC system. As the column, an Agilent Poroshell 120 EC-C18 column with a length of 50 mm, a diameter of 4.6 mm and a particle diameter of 2.7 µm equipped with a corresponding precolumn cartridge was used. In all experiments, a gradient of water/methanol containing formic acid (0.1 vol%) from 40% to 100% methanol in 7 min was applied. The flow rate was 0.5 mL/min, and the column temperature was 40 °C. A sample volume of 2.0 µL was injected.
For detection, an Agilent 6538 UHD Accurate-Mass Q-TOF mass spectrometer with an electronspray ionisation (ESI) source was used. All samples were measured in positive ion mode with a capillary voltage of 4.5 kV, a fragmentor voltage of 80 V and a skimmer voltage of 45 V. As gas temperature, 325 °C was selected. The nitrogen gas flow was 8 L min−1 and the nebuliser worked with a pressure of 50 psig. Spectra were measured in the mass range of m/z 60–m/z 1000. In MS/MS experiments, the protonated molecular ion of the components was fragmented with an energy of 35 eV. For analysis of the substance with a protonated molecular ion at m/z 288, a fragmentation energy of 25 eV was enough to observe sufficient fragmentation. Prior to all measurements, the MS system was mass calibrated with a standard provided by Agilent.
Supplemental Material
sj-doc-1-chl-10.1177_17475198221109187 – Supplemental material for Analysis of certain samples of phenazine dyes from the Historical Dyestuff Collection of the Technical University Dresden by liquid chromatography–mass spectrometry
Supplemental material, sj-doc-1-chl-10.1177_17475198221109187 for Analysis of certain samples of phenazine dyes from the Historical Dyestuff Collection of the Technical University Dresden by liquid chromatography–mass spectrometry by Oliver Reinke, Susanne Machill and Horst Hartmann in Journal of Chemical Research
Footnotes
Acknowledgements
The authors thank Reinhard Buchholz for his experimental support and Dr Thomas Prestel, Fakultät für Physik der TU Dresden, for the measurement of reflection spectra of the dyed strips and Frank Drescher for the support of LC-MS measurements.
Declaration of conflicting interests
The author(s) declared no potential conflicts of interest with respect to the research, authorship and/or publication of this article.
Funding
The author(s) disclosed receipt of the following financial support for the research, authorship, and/or publication of this article: Moreover, a financial support of the ‘Gesellschaft der Freunde und Förderer der Technischen Universität Dresden’ is gratefully acknowledged.
Supplemental material
Supplemental material for this article is available online.
References
Supplementary Material
Please find the following supplemental material available below.
For Open Access articles published under a Creative Commons License, all supplemental material carries the same license as the article it is associated with.
For non-Open Access articles published, all supplemental material carries a non-exclusive license, and permission requests for re-use of supplemental material or any part of supplemental material shall be sent directly to the copyright owner as specified in the copyright notice associated with the article.