Two novel rhodamine-based polystyrene solid-phase fluorescent sensors PS-AC-I and PS-AC-II with different coordination atoms (O or S) are synthesized and shown to be able to detect Hg(II) ions. They are characterized by Fourier-transform infrared spectroscopy and by scanning electron microscopy analysis. Their fluorescent properties, including response time, pH effects, fluorescence titrations, metal ion competition and recycling, are investigated and compared. Sensor PS-AC-II displayed higher selectivity and sensitivity to Hg(II), with a lower detection limit of 0.032 µM, which was 15 times better than PS-AC-I. A detection mechanism involving the Hg(II) chelation-induced ring-opening of the rhodamine spirolactam is proposed with the aid of theoretical calculations.
Recently, more and more chemical fluorescent sensors have been developed for metal ion detection due to their high sensitivity, short detection times, and simple operation.1–4 Unfortunately, many of them cannot be reused on a regular basis. Hence, the design of reusable solid-phase fluorescence sensors has become a popular research topic. In general, these solid-phase sensors consist of a small-molecule fluorescent probe and carriers. Rhodamine is such a probe possessing excellent photophysical properties5–7 and exhibits chelation-enhanced fluorescence (CHEF),8–12 whereas polystyrene microspheres as carriers have been widely used in enzyme immobilization, chromatographic separation, and biological sensing because of their large surface area, stable material properties, and surface reaction abilities.13–15 Chloroacetylated polystyrene microspheres, which are prepared from polystyrene microspheres by Friedel-Crafts acylation, exhibit regular shapes and high chemical resistance, and possess a large number of chloroacetyl groups on the surface to further conduct chemical modifications.16,17 These unique properties make these microspheres ideal scaffolds for heavy metal ion sensors.
In this paper, two novel rhodamine-based polystyrene sensors, PS-AC-I and PS-AC-II, with different coordination atoms (O or S) are designed, prepared, and characterized (Figure 1). Their fluorescent properties, including response time, pH effects, fluorescence titrations, metal ion competition and recycling, are investigated and compared. The detection mechanism is discussed in detail with the aid of theoretical calculations.
Design strategy for rhodamine-based polystyrene fluorescent sensors.
Results and discussion
Synthesis and characterization
Compound I was synthesized by the condensation of rhodamine B with ethylenediamine under refluxing conditions, which then afforded IIvia substitution with Lawesson’s reagent in toluene (Scheme 1). The structures were confirmed by 1H NMR and mass spectrometry. In the 1H NMR spectra, as a result of the deshielding effect of the N-atom, the CH2 of the N-ethyl side chain appeared as quartet at 3.13–3.51 ppm. The CH3 of the N-ethyl side chain appeared as a triplet at 1.08 ppm, with a coupling constant of around 7.0 Hz. All the aromatic protons resonated in the range of 6–8 ppm. The [M + H]+ peak for I and II appeared at m/z 485.29 and m/z 501.49, respectively, which is in good agreement with the calculated values (485.29 for I and 501.27 for II).
Preparation of sensors PS-AC-I and PS-AC-II.
The preparation of sensors PS-AC-I and PS-AC-II was carried out using a 1:1 molar ratio of chloroacetylated polystyrene microspheres PS-AC to I or II in tetrahydrofuran using sodium bicarbonate (NaHCO3) as an acid binding agent. The most satisfactory result was obtained when the reaction was performed in hot tetrahydrofuran for 24 h. The crude products were washed with methanol and water several times, and then dried under vacuum at 30 °C for 24 h to give PS-AC-I and PS-AC-II. By comparison of their FTIR spectra (Figure 2), the C-Cl stretching vibration of PS-AC18,19 at 994 cm−1 was replaced by C-N stretching vibrations at 1013 cm−1 and 1015 cm−1, respectively, indicating that some chloroacetyl groups on the surface of microspheres were substituted. The corresponding C=O stretching vibrations and aromatic C=C skeletal vibrations were observed around 1695 cm−1, 1608 cm−1, and 1502 cm−1, respectively, along with significant enhancement in intensity. Moreover, the color of the microspheres changed from white to orange, further confirming that I and II were successfully immobilized on the surface of PS-AC.
FTIR spectra of PS-AC, PS-AC-I and PS-AC-II.
Scanning electron micrography (SEM)
In order to illustrate that I and II had been successfully immobilized on the surface of PS-AC, a comparison of the SEMs of PS-AC and PS-AC-I was undertaken. SEM allows imaging directly on the sample surface. As shown in Figure 3, the SEM for PS-AC-I was quite different from PS-AC. From the two images (×150) in Figure 3(a) and (b), all the microspheres demonstrated good sphericity and monodispersity, with no significant changes in morphology. However, from the two images (×1000) in Figure 3(c) and 3(d), the diameter of PS-AC-I increased compared with that of PS-AC, and the surface had many recesses. The obvious changes in surface morphology indicated that the immobilization process was successful.
SEM images of PS-AC (a, c) and PS-AC-I (b, d).
Response time and pH dependence
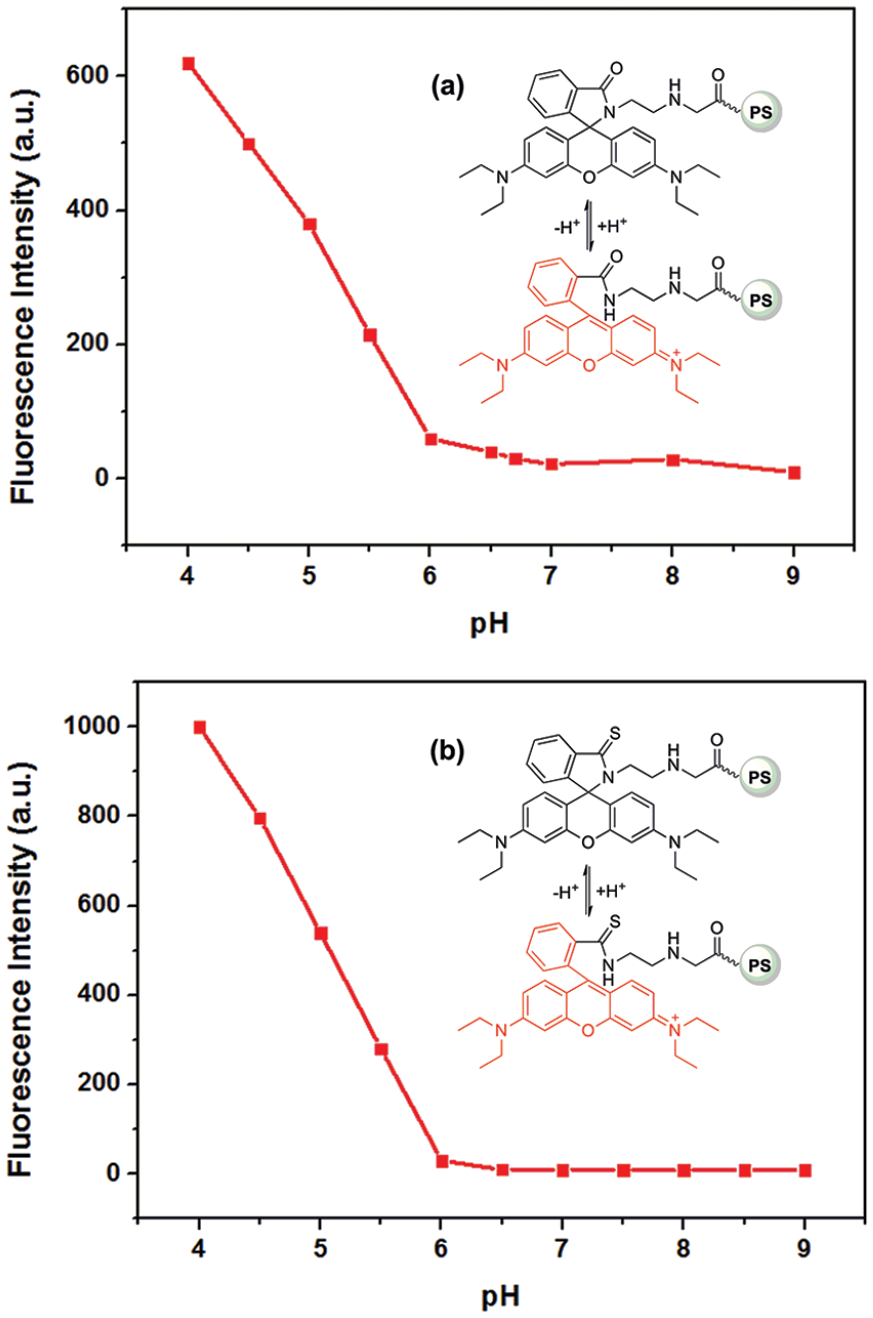
Fluorescence analysis indicated that the recognition between PS-AC-I and Hg(II) was complete in 60 min, whereas PS-AC-II responded more quickly to Hg(II) and its fluorescence intensity was stable 10 min after adding Hg(II). Thus, both sensors had potential utility in Hg(II) real-time monitoring. Moreover, the detection of metal ions is easily interfered by protons, so it is necessary to explore the fluorescence intensity of these sensors at different pHs. As shown in Figure 4, free sensors PS-AC-I and PS-AC-II produced negligible fluorescence with changes at pH values of 6.0–9.0. However, obvious fluorescence enhancement was detected when the pH was less than 6, which might be because of protonation causing the spirocycle to open. For further spectral analysis, the pH should be adjusted to 7.4.
Fluorescence responses of PS-AC-I (a) and PS-AC-II (b) at different pH values.
Fluorescence titration of Hg(II)
To explore the sensing properties, fluorescence titrations of PS-AC-I and PS-AC-II with Hg(II) were conducted in acetonitrile. Upon incremental addition of Hg(II), enhanced fluorescence emission was observed at 580 nm (Figure 5). For PS-AC-I, Hg(II) expressed a linear concentration range from 0 to 8 µM with a correlation coefficient of 0.9958. The detection limit was determined to be 0.483 µM based on 3s/k, where s is the standard deviation and k is the slope of the calibration plot.20,21 Compared with PS-AC-I, PS-AC-II had a much higher fluorescence response to Hg(II), which showed a linear concentration range from 0.05 to 0.35 µM with a correlation coefficient of 0.9835 and a lower detection limit of 0.032 µM. Moreover, the microsphere surface of PS-AC-II showed a color change from orange to rosy red after the addition of Hg(II) (Figure 5(b)), which illustrated that PS-AC-II could perform a fluorescence “off-on” response, allowing visual recognition of Hg(II) detection.
Fluorescence titration spectra of PS-AC-I (a) and PS-AC-II (b) in acetonitrile upon the incremental addition of Hg(II).
Selectivity to various metal ions
To evaluate the selectivity of PS-AC-I and PS-AC-II, common metal ions including alkali, alkaline earth, and transition-metal ions were used in competitive experiments (Figure 6). Almost no fluorescence intensity enhancement was detected after adding Ag+, Ca2+, Cd2+, Co2+, K+, Mg2+, Na+, Ni2+, Pb2+, Zn2+, Fe3+, Al3+, Cr3+, and Co3+ ions except for PS-AC-I which showed a weak response to Cu2+ (black bars). However, when Hg(II) was added, significant variation was observed (red bars). Sensor PS-AC-II had a much higher fluorescence response than PS-AC-I, along with a significant color change from orange to rosy red (Figure 5(b)), whereas with other metal ions it remained yellow. The above results indicate that PS-AC-I and PS-AC-II are highly selective to Hg(II) compared with other common metal ions.
Fluorescence responses of PS-AC-I (a) and PS-AC-II (b) to various metal ions.
Detection mechanism for Hg(II)
According to the theory of hard-soft acids and bases, hard-to-hard or soft-to-soft bonds form faster, leads to the formation of more stable compounds.22–24 In PS-AC-I and PS-AC-II, the O, S and N atoms acted as suppliers of electrons in the coordination process with metal ions. Hg(II) is a soft acid, whereas the donor S is a typical soft base, so S has high selectivity for Hg(II). According to the fluorescence properties, Hg(II) can coordinate with the N and S atoms on the rhodamine ring, and then quickly form stable coordination bonds. However, the donor O is a hard base, which leads to a longer response time for Hg(II). As shown in Figure 7, before the addition of Hg(II), rhodamine forms a closed lactam spirocycle. Hg(II) ions can chelate via the O, S, and N atoms, leading to spirolactam ring-opening along with a significant fluorescence enhancement at 580 nm. Theoretical calculations also indicated that chelation with Hg(II) made the total energy of PS-AC-I and PS-AC-II decrease, from 11.07 kJ/mol and 5.11 kJ/mol to −202.86 kJ/mol and −213.83 kJ/mol, respectively. The exothermic reaction and lower energy (−213.83 kJ/mol) meant relatively better stability, which made PS-AC-II give a higher fluorescence response to Hg(II). Moreover, PS-AC-II with an ethylenediamine chain could serve as a hypothetical aza-crown ether, and the better electron-donating ability of the S-atom led to this sensor having a stronger chelating ability to Hg(II) than PS-AC-I.
Detection mechanisms of PS-AC-I and PS-AC-II with Hg(II).
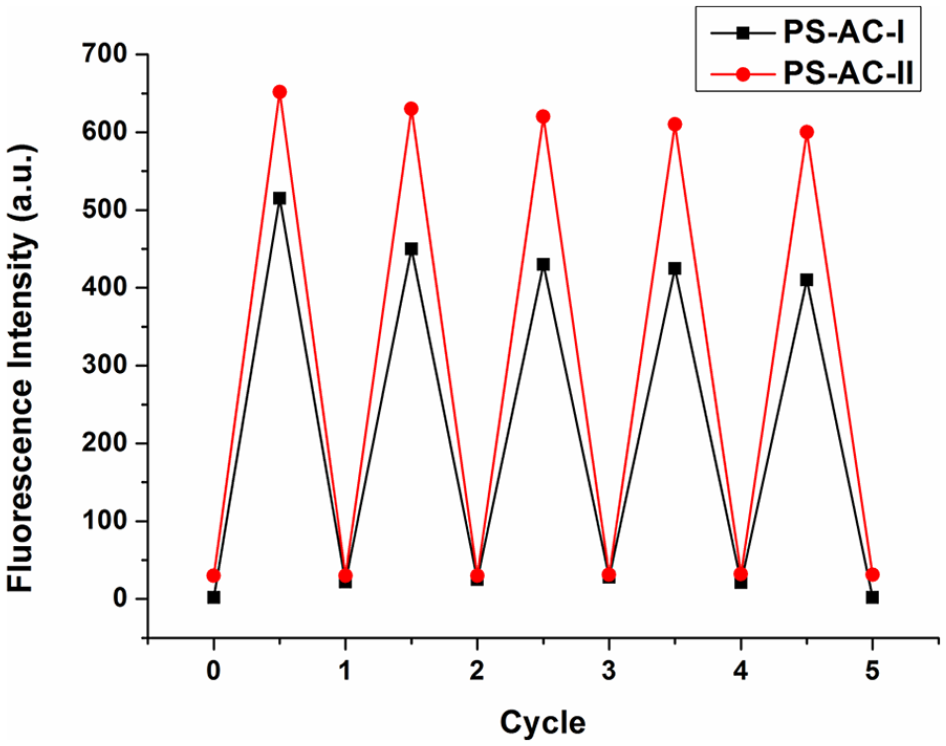
To verify the ability to regenerate the solid fluorescent sensors, sodium sulfide (Na2S) titrations were preformed. The addition of Na2S, which had stronger chelating ability to Hg(II), caused the disappearance of fluorescence and reformed the free sensors. The most interesting observation was that the sensing behavior was revived by adding Hg(II) again. As shown in Figure 8, sensors PS-AC-I and PS-AC-II could be reused more than five times in acetonitrile. The slight decrease in their fluorescence intensity might be due to the loss of some the rhodamine derivative on the surface of the polystyrene microspheres. In addition, the surface color of PS-AC-II constantly changed in the process of reuse, indicating that the rhodamine derivatives immobilized on microspheres presented an “off-on” state. This reversibility was attributed to the Hg(II) chelation-induced ring-opening of the rhodamine spirolactam. Cost savings, environmental friendliness by recycling, and high selectivity for Hg(II) should make sensors PS-AC-I and PS-AC-II useful in the detection of real samples.
Fluorescence intensity changes for PS-AC-I and PS-AC-II after alternate treatment with Hg(II) and Na2S solution.
Conclusion
Two rhodamine-based fluorescent probes were immobilized on chloroacetylated polystyrene microspheres PS-AC by chemical bonding to form solid-phase fluorescence sensors PS-AC-I and PS-AC-II. Their structures were identified by FTIR and SEM analysis. Both sensors exhibited good metal ion selectivity, instantaneous responses to Hg(II), and environmental friendliness through recycling. Compared with PS-AC-I, PS-AC-II had a much higher and more rapid fluorescence response to Hg(II), which was attributed to the thiophilicity of Hg(II). A sensing mechanism involving the Hg(II) chelation-induced ring-opening of the rhodamine spirolactam was proposed with the aid of theoretical calculation. The present work indicated that PS-AC-I and PS-AC-II could be used as potential solid-phase fluorescent sensors for further monitoring Hg(II) in real samples.
Experimental
All reagents used were of analytical grade. Melting points were measured on an X-4 microscope electrothermal apparatus (Taike China) and are uncorrected. Nuclear magnetic resonance spectra (NMR) were recorded on a Bruker AV-400 spectrometer with CDCl3 as the solvent and tetramethylsilane (TMS) as the internal standard. Infrared (IR) spectra were recorded as KBr disks using a Thermo Nicolet 380 FT-IR spectrophotometer. Mass spectra were obtained using a Thermo TSQ Quantum Access MAX mass spectrometer. Scanning electron micrographs were obtained using a JEOL JSM 5900 LV scanning electron microscope. Fluorescence emission spectra were recorded on a Shimadzu RF-5301PC spectrofluorometer using cuvettes (1 cm path length) at r.t. The slit widths were set to 5 nm. Chloroacetylated polystyrene microspheres (PS-AC, 200–300 μm) were purchased from Nanjing WANQING Chemical Glassware Instrument Co., Ltd.
Synthesis of compound I
Compound I was synthesized according to the reported method.25,26 Rhodamine B (1.2 g, 2.5 mmol) was dissolved in ethanol (50 mL) and ethylenediamine (3.4 mL) was added dropwise with vigorous stirring. The reaction mixture was refluxed for 24 h. The solvent was removed under reduced pressure, then water (100 mL) was added. The mixture was extracted with CH2Cl2 (3×100 mL) and the combined organic layer was dried over Na2SO4 and evaporated. The residue was dissolved in hydrochloric acid (1 mol/L, 100 mL), then sodium hydroxide solution (1 mol/L) was added until a pink solid formed. Pure compound I (0.97 g) was obtained following filtration, washing with water and then drying.
Compound II was synthesized according to the reported method.27 Compound I (0.48 g, 1 mmol) and Lawesson’s reagent were dissolved in toluene (40 mL) and the reaction mixture was refluxed for 12 h. The solvent was removed under reduced pressure, and the residue was purified via flash column chromatography on silica gel (CH2Cl2/CH3OH, 35: 1 v/v) to afford II (0.085 g).
Chloroacetylated polystyrene microspheres PS-AC (170 mg, 1 mmol) were swollen in dry tetrahydrofuran (30 mL) overnight, then compound I (484 mg, 1 mmol) or II (501 mg, 1 mmol) and sodium bicarbonate (84 mg, 1 mmol) were added. The reaction mixture was refluxed for 24 h and then filtered. The microspheres were washed with water and methanol several times and then dried under vacuum at 30 °C for 24 h to give PS-AC-I and PS-AC-II.
Response times and pH dependence of PS-AC-I and PS-AC-II
Sensor PS-AC-I (0.01 g) or PS-AC-II (0.012 g) was swollen in acetonitrile (200 μL), then Hg(II) (10 μM, 200 μL) was added. The fluorescence intensity was determined with an excitation wavelength of 500 nm every 1 min.
Sensor PS-AC-I (0.01 g) or PS-AC-II (0.012 g) was swollen in acetonitrile (200 μL), then NaH2PO4-Na2HPO4 phosphate buffer was added. The fluorescence intensity was determined with an excitation wavelength of 500 nm after 60 min and 10 min, respectively.
Fluorescence titrations with Hg(II)
Sensor PS-AC-I (0.01 g) was swollen in acetonitrile (200 μL), then Hg(II) (0–16 μM) was added. The fluorescence intensity was determined with an excitation wavelength of 500 nm after 60 min.
Sensor PS-AC-II (0.012 g) was swollen in acetonitrile (200 μL), then Hg(II) (0.05–0.65 μM) was added. The fluorescence intensity was determined with an excitation wavelength of 500 nm after 10 min.
Selectivity to various metal ions
Sensor PS-AC-I (0.01 g) or PS-AC-II (0.012 g) was swollen in acetonitrile (200 μL), then 1.0 mL of Hg(II) (10 μM for PS-AC-I and 5 μM for PS-AC-II) was added. The fluorescence intensity was determined with an excitation wavelength of 500 nm after adding Ag+, Ca2+, Cd2+, Co2+, Cu2+, K+, Mg2+, Na+, Ni2+, Pb2+, Zn2+, Fe3+, Al3+, Cr3+, or Co3+.
Theoretical calculations
The 3D structures of PS-AC-I and PS-AC-II with Hg were created using ChemBio3D and converted to a mol2 file. Theoretical calculations were performed using the SYBYL X 2.0 software.28 Geometry optimization was carried out using the standard Tripos force-field with a distance-dependent dielectric function and an energy gradient of 0.001 kcal·mol−1·Å−1. The lowest energy conformer was selected and minimized using the Powell method until a root-mean-square (rms) deviation of 0.001 kcal·mol−1·Å−1 was achieved.
Recycling test
Sensor PS-AC-I (0.01 g) or PS-AC-II (0.012 g) was swollen in acetonitrile (200 μL), then 220 μL of Hg(II) (10 μM for PS-AC-I and 5 μM for PS-AC-II) was added. The fluorescence intensity was determined with an excitation wavelength of 500 nm, then Na2S (0.1 mM) was added. The fluorescence intensity was tested again, then the microspheres were filtered, washed with water and acetonitrile several times, and dried under vacuum at 30 °C for 24 h to recover the free sensors. More than four replicates of each test were carried out.
Footnotes
Declaration of conflicting interests
The author(s) declared no potential conflicts of interest with respect to the research, authorship, and/or publication of this article.
Funding
The author(s) disclosed receipt of the following financial support for the research, authorship, and/or publication of this article: This work was supported by the Natural Science Foundation of Jiangsu Province (BK20161542), the Natural Science Foundation of the Higher Education Institutions of Jiangsu Province (17KJB150006), and the Jiangsu Overseas Visiting Scholar Program for University Prominent Young & Middle-aged Teachers and Presidents (2017).
ORCID iD
Yi Li
References
1.
RasheedTBilalMNabeelF, et al. Sci Total Environ2018; 615: 476.
2.
RasheedTLiCBilalM, et al. Sci Total Environ2018; 640: 174.