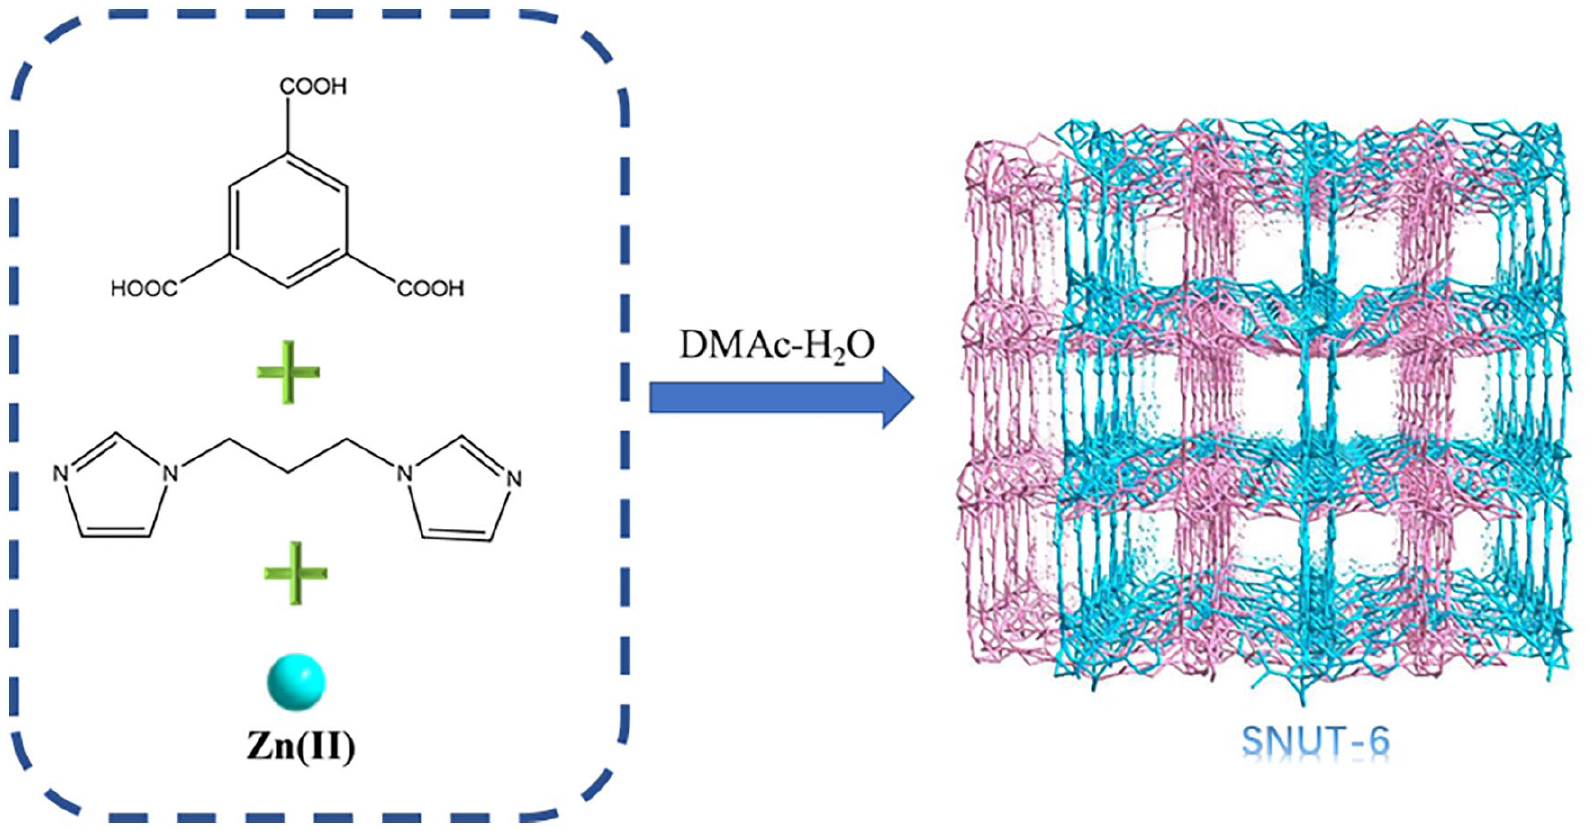
A new zinc(II) metal organic framework has been obtained from the solvothermal assembly of 1,3,5-benzene tricarboxylate and 1,3-bis(imidazole)propane with zinc nitrate in DMAc–H2O (DMAc is N,N-dimethylacetamide), namely {[Zn2 (μ2-OH)(1,3-BIP)(BTC)]·DMAc·2H2O}n (SNUT-6). The product is characterized by single-crystal and powder X-ray diffraction, infrared spectroscopy, thermogravimetric analysis, and elemental analysis. The single-crystal X-ray diffraction reveals that SNUT-6 exhibits a 3D→3D two-fold interpenetrating framework. Furthermore, SNUT-6 demonstrates a highly efficient turn-off fluorescent detection ability for aniline in methanol and shows high sensitivity with a Ksv value of 4.771 × 10⁴ M−1. It also shows excellent photocatalytic degradation performance for a three-dye molecular model: rhodamine b, methyl orange, and methyl blue.
Metal-organic frameworks (MOFs) are a relatively new type of crystalline material with unique architectures and potential applications in areas, such as heterogeneous catalysis,1,2 recognition,3 gas storage,4 and separation.5 As a result, designing and synthesizing MOFs to meet specific needs is of great scientific and practical importance.6–11 However, the structures of MOFs are influenced by various factors, such as temperature,12 solvent system,13 metal ions,14,15 ligands,16 the pH value,17 and even the ratio of the metal and ligand.18 Therefore, it is challenging to adjust reaction conditions to obtain MOFs with specific structures in crystal engineering.
The identification of aromatic compounds (ACs), such as nitrobenzene (NB), anilines (ANs), 4-nitrotoluene, 2,4-dinitrotoluene, trinitrotoluene, and 2,4,6-trinitrophenol is of great importance due to its practical implications in counter-terrorism and for environmental concerns,19 for example, overexposure to ANs, a type of amines that are widely used in industry, can lead to serious health issues. Amines are also present in spoiled food products, such as meat, fish, cheese, and wine.20,21 As a result, there are various methods for detecting amines,22–24 including instrumental techniques and dye-based systems. Among these methods, dye-based systems are particularly attractive due to their simplicity. Hence, it is crucial to develop efficient, practical, and reliable sensors that can simultaneously detect these substances for the safety and well-being of individuals. Recently, by exploiting the mixed-ligand synthetic strategy, various types of metal coordination polymers (MCPs) with fascinating structures and interesting properties have been constructed, especially in terms of acid–base system.25–29 Intriguingly, such acid and base ligands can compensate for charge balance, coordination deficiencies, repulsive vacuum, and weak interactions simultaneously.
Considering all the above-mentioned points and our previous work,24,25 we chose the flexible ligand 1,3-bis(imidazole)propane (1,3-BIP) as an N-donor ligand, and rigid 1,3,5-benzene tricarboxylate (H3BTC) as an auxiliary linker to construct a zinc(II) MOF: {[Zn2(μ2-OH) (1,3-BIP)(BTC)]·DMAc·2H2O}nSNUT-6 (Scheme 1). SNUT-6 displays excellent fluorescence performance for sensing of AN, which demonstrates its significant potential as a highly selective responsive fluorescence sensor. In addition, SNUT-6 has demonstrated strong performance for the photocatalytic degradation of organic dyes.
Synthesis of SNUT-6.
Results and discussion
Crystal structure of {[Zn2(μ2-OH)(1,3-BIP)(BTC)]·DMAc·2H2O}n (SNUT-6)
Single-crystal X-ray diffraction studies revealed that SNUT-6 belongs to the monoclinic P2(1)/c space group. The asymmetric unit of SNUT-6 contains two coordinated Zn(II) ions, one 1,3-BIP ligand, one BTC3- anion, one μ2-coordinated OH anion, one DMAc (N, N-dimethylacetamide) molecule, and two free water molecules. As shown in Figure 1, the two crystallographically independent Zn(II) ions have the same coordination geometries, with each Zn(II) ion exhibiting distorted tetrahedral geometry with two oxygen atoms from two BTC3- anions, one nitrogen atom from one 1,3-BIP ligand and one oxygen atom from the μ2-coordinated OH anion. In the BTC3- ligand, one carboxyl group adopts a bidentate chelating mode to coordinate the Zn(II) ion, and two carboxylic oxygen atoms (O1 and O3) from two different carboxyl groups adopt a monodentate mode to coordinate to two different Zn(II) ions. Therefore, the BTC3- ligands with a μ3-coordination mode bridges three adjacent Zn(II) ions to form a two-dimensional (2D) sheet structure with honeycomb caves (Figure 1(b)). The above-mentioned 2D layer is extended by the 1,3-BIP ligand to form a three-dimensional (3D) framework (Figure 1(c)). In addition, a two-fold interpenetrating 3D architecture (Figure 1(d)) is formed via mutual interpenetration of two independent equivalent frameworks. From a topological perspective, the BTC ligands can be simplified as topologically equivalent three-connected nodes, and two Zn(II) atoms as a six-connected node (Figure 1(e)). In this way, a binodal (3,6)-connected net is formed with a Schläfli symbol of (3·10·11)( 3·103·112)(3·112). Calculations using PLATON software reveal a total potential solvent-accessible volume equaling 563.1 Å3 per unit cell (2681.3 Å3), which accounts for 21.1% of the cell volume.
(a) The coordination environment of SNUT-6. (b) The 2D layer constructed from BTC and Zn(II) ions. (c) A view of the 3D framework in SNUT-6. (d) The 3D→3D parallel interspersed structure. (e) A view of the 3D packing diagram of SNUT-6.
Powder X-ray diffraction, infrared, and thermogravimetric analysis
Synthetic SNUT-6 was confirmed by powder X-ray diffraction (PXRD) measurements. As illustrated in Figure 2, SNUT-6 has good phase purity, as the experimental major peaks are consistent with the simulated values. In addition, to investigate the stability of SNUT-6 in real-life applications, the PXRD patterns were recorded after it had been subjected to different pH environments. The results indicated that the peak positions of SNUT-6 hardly change from pH = 2 to pH = 12, demonstrating its excellent acid–base stability.
PXRD patterns of SNUT-6 at different pH levels.
The infrared (IR) spectra of SNUT-6, 1,3-BIP and H3BTC were also recorded to confirm the structure. As shown in Figure S1 (see the Supplemental Information), the Fourier transform infrared (FT-IR) spectrum of SNUT-6 exhibited a broad band due to the groups at 3200 cm−1. The characteristic peaks of SNUT-6 at 2940 and 1550 cm−1 were assigned to ν (C–H) and ν (C–C).30,31 The peaks at 1611 and 1608 cm−1 are due to the asymmetric and symmetric stretching vibrations of the carboxyl group of H3BTC.32,33 In addition, the spectra showed characteristic absorption bands around 1600 and 1380 cm−1 for the symmetric and asymmetric carboxylic acid groups, respectively, coordinated to different zinc atoms, which is consistent with the results of the X-ray diffraction analysis.34
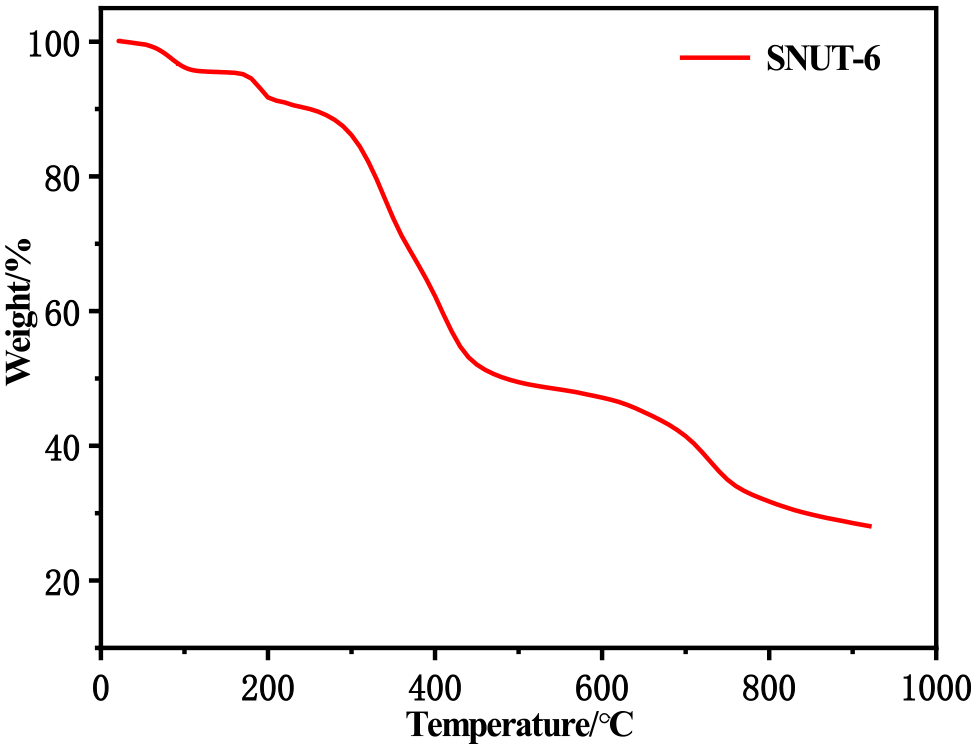
To investigate the thermal stabilities of SNUT-6, a sample of the zinc(II) MOF was analyzed by thermogravimetric analysis (TGA) from 30 to 1000°C at a heating rate of 10°C/min. Based on the TGA curve depicted in Figure 3, from room temperature to 230°C, the TGA curve of SNUT-6 displays a steady continuous weight loss of 5.47% (Calcd: 5.50%), corresponding to two lattice water molecules. Next, a sharp weight loss of 15.21% (Calcd: 15.89%) occurs from 230 to 340°C, which can be attributed to one DMAc molecule and one μ2-coordinated OH anion. As the SNUT-6 further absorbs heat at 340°C, it loses weight steeply due to decomposition of the analytes of the co-ligand, accompanied by loss of the 1,3-BIP and BTC ligands. After decomposition, the final residue is 18.26%, which can be attributed to ZnO and the residue of the co-ligand (Calcd. 14.57%).
Thermogravimetric curve for SNUT-6.
Photoluminescence properties
The photoluminescent properties of MOFs with d10 metal centers have attracted extensive attention for their potential applications in photochemistry, chemical sensors, and electroluminescent displays. Therefore, the photoluminescence spectra of SNUT-6 were examined at room temperature. As shown in Figure 4, the free 1,3-BIP ligand exhibits photoluminescence with a broad emission maximum at 462 nm (λex = 330 nm). It can be assumed that this peak arises from the π*→π transition of the ligand. Meanwhile, the emission of the tricarboxylate belongs to the π*→n transition, which is very weak compared with the π*→π transition of the 1,3-BIP ligand, hence the tricarboxylate ligand hardly contributes to the fluorescence emission of the synthesized samples. After excitation at 330 nm, SNUT-6 emission peaks were observed at 452 nm. Compared with the free 1,3-BIP ligand, the luminescence peaks of SNUT-6 were blue-shifted. It is well-known that the luminescent properties of MOFs are closely related to their structures. The size of the metal, the structure of the secondary building unit (SBU), and the orientation of the connections all affect the emission characteristics of the material. Compared with the co-ligands, the increased emission intensity can be reasonably attributed to the increased rigidity of the co-ligands when binding to Zn(II) ions, thereby effectively reducing the energy loss.
Solid-state emission spectra of SNUT-6 and 1,3-BIP.
Limit of AN detection
AN, an important organic material and chemical intermediate, is highly toxic, causing liver damage and acute or chronic poisoning. It is listed as one of the preferred controlled pollutants in liquid phase. Monitoring and removing AN from water is pressing but quite challenging. We thus sought to explore the possible fluorescence-sensing ability of SNUT-6 toward AN in aqueous solution. The sensing abilities of SNUT-6 toward some other ACs with similar structures but different functional groups, including TEA, 2-MP, PY, DIPH, DABCO, PPR, o-NT, p-NT, m-NT, and NB, were also explored. As shown in Figure 5, the fluorescence of SNUT-6 was significantly reduced upon the addition of AN (10 μL, 100 mM), and the decrease in efficiency reached 5.3%. Fluorescence quenching may be caused by two possible reasons: (1) the electron transfer from the excited state of sensor to the AN and (2) the resonance energy transfer from the sensor to the AN.35–37 The addition of other analytes had almost no effect on the fluorescence intensity of SNUT-6 (Figure 6). Subsequently, the fluorescence responses of SNUT-6 as a function of AN concentration were quantitatively studied. The fluorescence intensity of SNUT-6 gradually decreases as the concentration of AN increases. As shown in Figure 7, the calibration curve of SNUT-6 for AN shows good linearity over a concentration range of 0.06–0.46 mM, with a slope value (S) of 4771. The limit of detection (LOD) of SNUT-6 toward AN was calculated to be 4.31 × 10⁻¹ mM (corresponding to 4.0 × 10⁻² ppb) on the basis of 3σ/S (where σ is the standard deviation of the blank solution). Such an obvious quenching effect toward AN implies that SNUT-6 could be used as a very efficient easily distinguished “turn-off” sensor for detecting AN by spectrofluorometry.
Relative luminescence response of SNUT-6 toward various aromatic analytes.
Fluorescence quenching of SNUT-6 in presence of aniline. Inset: S–V plot for the quenching of SNUT-6 with aniline.
UV–vis DRS (diffuse reflection spectrum) and Kubelka–Munk-transformed DRS of SNUT-6.
Photocatalytic degradation of {[Zn2(μ2-OH)(1,3-BIP)(BTC)]·DMAc·2H2O}n (SNUT-6)
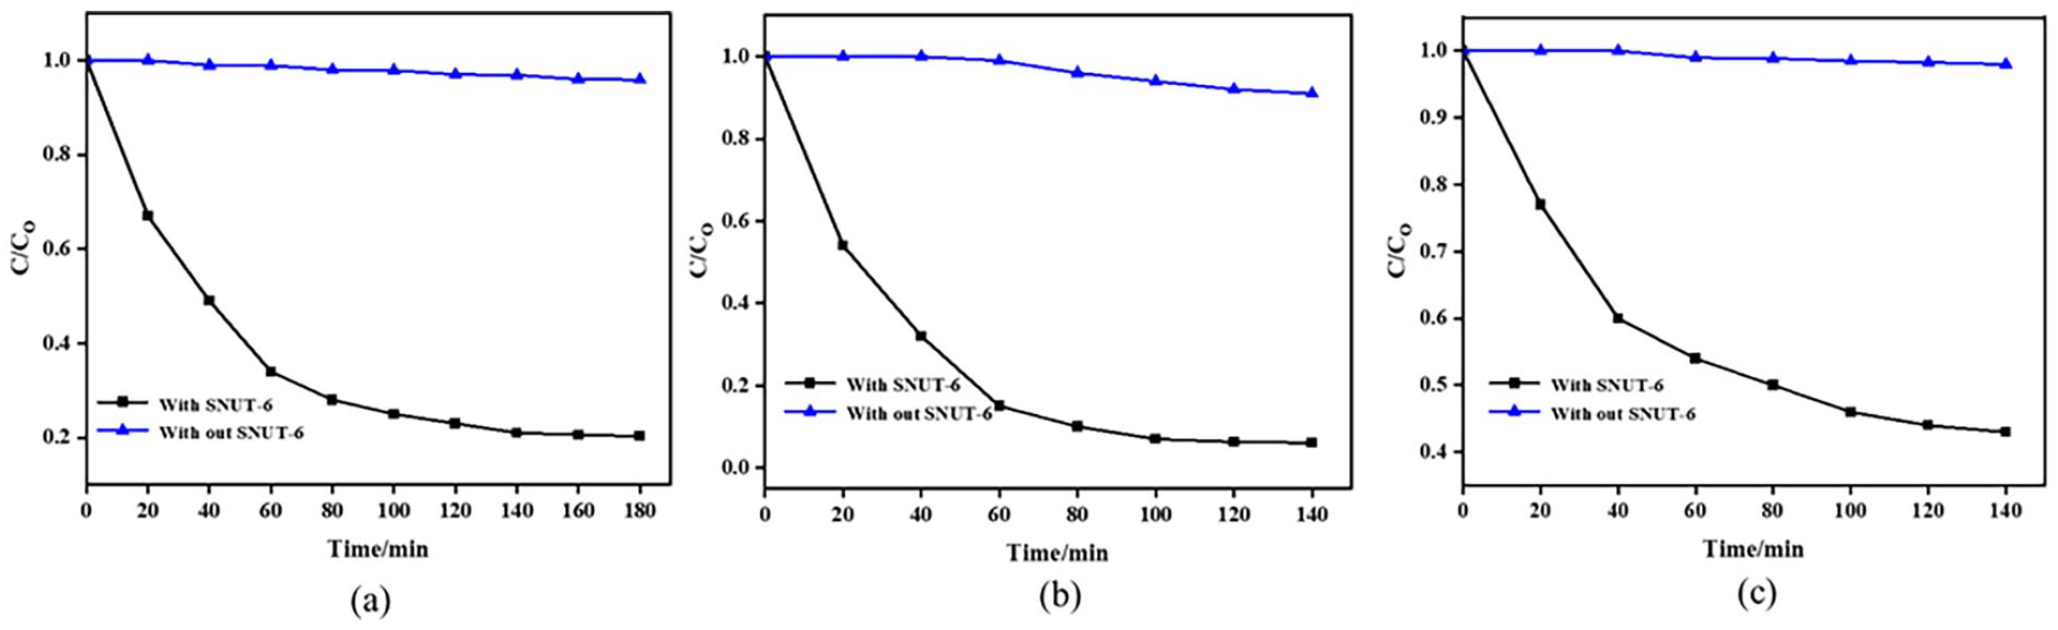
UV–vis diffuse reflectance spectra (DRSs) were collected to determine the light absorption response of the sample. As shown in Figure 7, SNUT-6 exhibits broad absorption bands in the range of 200–400 nm, suggesting that these absorption bands can facilitate the photocatalytic degradation process in the ultraviolet wavelength range. Therefore, a 150 W mercury lamp was chosen as the light source, and the band gap energy (Eg) of SNUT-6 was determined according to the corresponding Kubelka–Munk diagram (Figure 8). The Eg value of SNUT-6 is 2.67 eV, indicating that SNUT-6 can be used as a photocatalyst in the ultraviolet region. Therefore, the photocatalytic performance of the synthesized SNUT-6 was evaluated by decomposing rhodamine B (RhB), methyl orange (MO), and methyl blue (MB) in aqueous solution. As shown in Figure 8, RhB, MB, and MO organic dyes decompose very little without SNUT-6. However, experiments revealed that the intensity of the RhB, MB, and MO bands decreased with increasing irradiation time in the presence of SNUT-6. Also in the presence of SNUT-6, the concentrations of RhB, MB, and MO(C) varied with the reaction time (t) (Figure 9), indicating that the degradation rate of the dye was close to 79.7%, 93.9%, and 57%, respectively, after periods of 180, 140, and 140 min. Compared with the reported reference,38 the photocatalytic degradation of rhodamine by molecular SNUT-6 was slightly weaker. In addition, compared with RhB and MO, SNUT-6 exhibited a higher degradation rate with MB. Hence, SNUT-6 can be used as a photocatalyst for the degradation of RhB, MB, and MO.
Absorption spectra of (a) RhB, (b) MB, and (c) MO solutions during photocatalytic degradation by SNUT-6.
The plots of concentration ratios (C/C0) against irradiation time (min) of (a) RhB, (b) MB, and (c) MO with or without SNUT-6.
The practical applications of photocatalysts largely depend on their recyclability. In this regard, SNUT-6 showed high recyclability, as shown in Figure 10, and the degradation performance of RhB, MB, and MO did not decrease significantly after five consecutive cycles. PXRD also confirmed the stability of SNUT-6 (Supplemental Figure S2), and there was no significant difference before and after the cycling tests.
Recycling runs examining the photocatalytic degradation of RhB, MB, and MO with SNUT-6.
Conclusion
In summary, a new Zn(II)-MOF has been solvothermally synthesized and structurally characterized. Single-crystal X-ray structural analysis revealed that SNUT-6 shows a 3D→3D structure interspersed with each other, then they form a 3D two-fold interpreted framework. Fluorescence-sensing test results show that SNUT-6 can be used as an efficient “turn-off” sensor for detecting AN by spectrofluorometry. Investigations of the photocatalytic properties show that SNUT-6 can be used as a photocatalyst for the degradation of RhB, MO and MB. Further experiments exploring its electrocatalytic performance and the variation in physicochemical properties are under way in our laboratory.
Experimental
Materials and physical measurements
Unless specified otherwise, all starting materials and reagents were obtained from commercial supplies and were used without further purification. Elemental analyses for C, H, and N atoms were performed on a Vario EL III elemental analyzer. The IR spectra (4000–400 cm−1) were recorded as KBr pellets on an Avatar 360 E.S.P. IR spectrometer. Crystal data were obtained on a Bruker P4 X-diffractometer. UV–vis spectra were obtained using an F-4500 analytical instrument. Investigations of the thermal stability of polycrystalline samples were carried out on an SDT Q600 thermal analyzer under an N2 atmosphere at a heating rate of 10ºC·min−1 in the range of 30–800ºC. The fluorescence properties of solids were studied using a steady-state/transient fluorescence spectrometer (FLS 1000-stm). The photocatalytic degradation performance was studied using a photochemical reactor with a long arc mercury lamp (CEL-LAM 500). Chemicals and solvents were of analytical grade and were purchased from Jinan Henghua Sci. & Tec. Co. Ltd.
Synthesis of {[Zn2(μ2-OH)(1,3-BIP)(BTC)]·DMAc·2H2O}n (SNUT-6)
A mixture of Zn(NO3)2·6H2O (0.15 mmol, 44.6 mg), NaOH (0.1 mmol, 4 mg), 1,3-BIP (0.1 mmol, 17.6 mg), H3BTC (0.06 mmol, 12.6 mg), DMAc (4 mL), and H2O (4 mL) was sealed in a 20 mL vial, which was heated at 110ºC for 3 days, and then cooled to room temperature over 24 h. Colorless block crystals of SNUT-6 were collected. Yield: 85% based on zinc. Elemental analysis Calcd. for C22H29N5O10Zn2 (Mr = 654.24): C, 40.35; H, 4.43; N, 10.70. Found: C, 40.23; H, 4.42; N, 10.81. IR(KBr): 3431 (bs), 3122 (m), 2934 (m), 2362 (w), 1620 (s), 1562 (m), 1404 (w), 1344 (s), 1102 (m), and 763(m) cm−1.
Crystal structure determination
Single-crystal X-ray diffraction measurements of SNUT-6 were performed on a Bruker APEX II CCD diffractometer at ambient temperature with MoKα radiation (λ = 0.71073 Å). All the structures were solved by direct methods using the program SHELXS-97,39 and were refined by full-matrix least-squares techniques against F2 using the SHELXTL-9740 crystallographic software package. All non-hydrogen atoms were easily found from the difference Fourier map and were refined anisotropically, whereas the hydrogen atoms of coordination polymers were located by geometrical considerations and were added to the structure factor calculations. The details of the crystallographic parameters, data collection, and refinements for SNUT-6 are listed in Table 1, and the selected bond lengths and bond angles with their estimated standard deviations are provided in Table 2.
Selected bond lengths (Å) and bond angles (°) of SNUT-6.
Zn(1)–O(5)
1.986(3)
Zn(1)–N(1)
1.979(4)
Zn(1)–O(1)
1.933(3)
Zn(1)–O(4)#1
2.044(3)
O(2)–Zn(1)–O(5)
114.29(13)
N(1)–Zn(1)–O(5)#1
106.15(15)
O(2)–Zn(1)–N(1)
115.34(14)
O(1)–Zn(1)–O(5)#1
100.17(12)
O(1)–Zn(1)–N(1)
111.05(15)
O(1)–Zn(1)–N(1)
111.05(15)
Symmetry transformations used to generate equivalent atoms: #1 x+ 1, y, z for SNUT-6.
Fluorescence-sensing experiments
All sensing experiments were conducted in the liquid phase at ambient temperature. In quantified detection experiments, dispersion solutions of SNUT-6 were prepared by grinding SNUT-6 (3 mg) in air and dispersing in methanol (MeOH; 3 mL), followed by sonication for 30 min.
Next, an AC-MeOH (0.5 mL) solution was added to the above suspension to detect the AC: AN, triethylamine (TEA), 2-methylpyrrolidine (2-MP), pyridine (PY), diphenylamine (DIPH), 1,4-diazabi-cyclo[2.2.2]octane (DABCO), piperidine (PPR), o-nitrotoluene (o-NT), p-nitrotoluene (p-NT), m-nitrotoluene (m-NT), and NB.
Photocatalytic degradation reaction
The photocatalytic performance of SNUT-6 samples was evaluated by the degradation of the dye molecular model (Rho B, MB, and MO), at 10 mg L−1 by light irradiation using a 150 W mercury lamp as the light source. The experimental process was as follows: first SNUT-6 was ground into a powder and placed in a 200-mL beaker. Next, 100 mL of the dye molecular model solution (10 mg L−1) was added to the beaker, mixed thoroughly, and stirred with a magnetic stirrer for 2 h under dark conditions to allow the system to reach an adsorption and desorption equilibrium. Hydrogen peroxide (5 mL) was added, and the mixed solution was irradiated under a Xe lamp while stirring to allow adequate degradation of the dye molecular model. During degradation, 3 mL of the mixed solution was aspirated every 20 min with a syringe equipped with a filter head to measure the absorbance of the solution that had filtered out SNUT-6, and the absorbance change of the dye molecular model was recorded. The degradation rate (D) of the dye molecular model was calculated as D = (A0-At)/A0 × 100%, where A0 is the absorbance of the dye molecular model and At is the absorbance of the dye molecular model at reaction time t.
Footnotes
Declaration of conflicting interests
The author(s) declared no potential conflicts of interest with respect to the research, authorship, and/or publication of this article.
Funding
The author(s) disclosed receipt of the following financial support for the research, authorship, and/or publication of this article: The science and Technology Department of Shaanxi Province (No. 2021JQ-750), the Innovation Team of Shaanxi Universities (No. 2022-94), the National Natural Science Foundation of Youth (Project No. 21603133), the project of the Education Department of Shaanxi Province (21JK0565), and the Research Project of Shaanxi University of Science and Technology (SLGKYXM2304) are acknowledged for funding.
ORCID iD
Jiu-Fu Lu
Supplemental Material
Crystallographic data for the structural analysis have been deposited with the Cambridge Crystallographic Data Center, CCDC 1569489 for SNUT-6. Copies of the data can be obtained free of charge on application to the Director, CCDC, 12 Union Road, Cambridge, CB2 1EZ, UK (Fax: +44–1223–336033; e-mail: deposit@ccdc.cam.ac.ukor ).
References
1.
GaoYHHuangPPXuHT, et al. J Mol Struct2023; 1281: 135106.
2.
GaoJHWangJXHuangPP, et al. J Mol Struct2023; 1290: 135935.
3.
GengJLiYYLinHY, et al. Dalton Trans2022; 51: 11390.
4.
LuJFLiuZH.J Coord Chem2016; 69: 2553.
5.
ZhangJXueY YZhangP, et al. Cryst Growth Des2022; 22: 469.
6.
LinHYZhaoJTianY, et al. Transit Met Chem2016; 41: 807.
7.
ZhaoJLWuCRedshawC, et al. Inorg Chim Acta2021; 517: 120193.
8.
ZhangMYZhangHXZhangYY, et al. Chin J Struct Chem2020; 39: 1723–1728.
9.
ZhangDMXuCGLiuYZ, et al. J. Solid State Chem2020; 290: 21549.
10.
YinXYChenXDSunWW, et al. Energy Storage Mater2020; 25: 846.
11.
ChenHYXiaoDRFanLL, et al. CrystEngComm2011; 13: 7098.