
Abstract
In Kenya, policies to increase access to quality education have largely focused on reducing rural/urban, gender, and income inequality. Yet, many children do not attend or fully participate in school because they have physical and mental disabilities. The goal of this paper is to examine school enrollment, attendance, and primary school completion patterns for children with disabilities in Kenya. The study used the 2007 Kenya National Survey for Persons with Disabilities. The aim of the survey, the first of its kind in Kenya, was to estimate the number of people with disabilities, their regional distribution, and their demographic and socio-economic characteristics. The study finds that children with disabilities face significant obstacles to schooling. Schools are unable to offer services to children with disabilities, hence making it difficult for them to attend school. These children are significantly less likely to enroll in school, attend school, and complete primary school.
Introduction
The World Health Organization (WHO) estimates there are approximately 200 million children living with disabilities worldwide; a disproportionate number of these children live in low-income countries (Durkin et al., 2008). The higher prevalence of disabilities in these countries has been attributed to poor nutrition, limited access to healthcare, armed conflict, and higher exposure to disease and injury due to hard living conditions (DFID, 2000; Durkin et al., 2008; Yeo and Moore, 2003). Disability makes households more vulnerable to poverty because of unequal access to education, employment, healthcare, and food (DFID, 2000; Hoogeveen, 2005; UNESCO, 2010). Filmer (2008) notes, “disability is associated with long-run poverty, in the sense that children with disabilities are less likely to acquire the human capital that will allow them to earn higher incomes” (p.159).
Whether or not a child enrolls and attends school depends on the direct and indirect costs of schooling to the household (Chernichovsky, 1985; Colclough and Lewin, 1993; Lloyd and Blanc, 1996). Disability is likely to increase the costs of schooling. UNESCO (2010) found that many schools, especially in rural and slum areas, are physically inaccessible to some children with disabilities. The inability to walk the distance to school and/or the cost of obtaining transport for children with disabilities may limit access to school. The costs of the equipment, such as wheelchairs, may also be prohibitive. Not all the costs are monetary; UNESCO (2010) found that, “Beyond the immediate health-related effects, physical and mental impairment carries a stigma that is often a basis for exclusion from society and school” (p.181). The stigma is likely to discourage parents from sending their children to school (Kristensen et al., 2006; UNESCO, 2010).
In Kenya, policies to increase access to quality education have largely focused on reducing rural/urban, gender, and income inequality. Yet, it is likely many children do not attend or fully participate in school because they have physical and mental disabilities. Education is especially important for children with disabilities because “it may mean the difference between a socially fulfilling, intellectually stimulating, and economically productive life and a future with few of these qualities” (Aron and Loprest, 2012: 98). Despite the critical need to educate children with disabilities, we know little about the situation of children with disabilities, especially in low-income countries (Durkin et al., 2008; Filmer, 2008; Lamichhane, 2015). Limited policy attention towards children with disabilities in developing countries is holding back progress towards universal education (UNESCO, 2010; WHO and World Bank, 2011).
The goal of this paper is to examine school enrollment, attendance, and primary school completion patterns for children with disabilities in Kenya. How does disability affect school participation? How does disability affect educational attainment? The paper first highlights how children with disabilities have been served in Kenya in the past and then examines their school enrollment, attendance, and completion using data from the 2007 Kenya National Survey for Persons with Disabilities (KNSPWD). This is the first, and only, survey of people with disabilities in Kenya.
Education of children with disabilities in Kenya: A brief history
Early efforts to provide education for children with disabilities in Kenya were spearheaded by the civil society and religious groups. The Salvation Army, the Catholic Church, and the Aga Khan Community set up the first schools for the students with disabilities (UNESCO, 1974). The Kenya Education Commission of 1964, the first post-independence education commission, proposed reforms to the education system that would make it more responsive to the needs of the country. The report recommended inclusive education and establishment of more special schools for children with disabilities (Republic of Kenya, 1964).
In 1964, the government established the Committee of the Care and Rehabilitation of the Disabled to develop guidelines for special needs education. The committee’s report, Ngala Report, recommended a public awareness campaign on the causes and consequences of disability; inclusive education for children with physical, visual, and hearing impairment; provision of school transport for physically impaired children; increased funding to all special schools; an affirmative action policy to ensure employers hire people with disabilities; establishment of vocational and rehabilitations centers; appoint an inspector of special schools (UNESCO, 1988).
The Sessional Paper No. 5 of 1968 proposed a survey of the people with disabilities to ensure the recommendations of the Ngala Report could be implemented effectively. The sessional paper was the first government document to propose a survey of the disabled. However, the government did not conduct the survey. In 1976, the National Education Commission on Education Objectives and Policies Report recommended that children with disabilities be included in regular schools and not segregated into special schools (Republic of Kenya, 1976). The report, known as the Gachathi Report, also proposed the development of a policy framework for special needs education and public awareness campaigns to reduce stigma associated with disabilities. As with the Ngala Report recommendations, the government of Kenya did not implement the recommendations of the Gachathi Report.
In 1984, the government of Kenya established Educational Assessment and Resource Centers (EARCs) at the district level in an attempt to bring services closer to children with disabilities. However, EARCs were unable to provide adequate services due to limited funding and shortage of special education teachers (Republic of Kenya, 2003; UNESCO, 1988). Consequently, the Kenya Institute of Special Education (KISE) was established in 1986 to train special education teachers. KISE was also established to conduct research and serve as a resource for special education teachers. The shortage of special education teachers continues due to the limited funding provided to KISE by the government (Republic of Kenya, 2003).
In 1999, the Commission of Inquiry into the Education System of Kenya Report (Koech Report) recommended a reevaluation of the Education Act because the Act did not provide equal opportunities for all children (Republic of Kenya, 1999). The commission noted there was still no legal framework on special education despite the recommendations proposed by the 1976 Gachathi Report. The disability survey recommended by the 1964 Ngala Report had not been undertaken either. The Koech Report noted that previous education commissions had recommended many policies, but few, if any, had been implemented.
In 2003, the Task Force on Special Needs Education released its report, referred to as the Kochung Report. Similar to previous education commission reports, the Kochung Report observed that there was no policy or legal framework on special needs education, there was a lack of data on children with disabilities, and there was a lack of special education teachers and facilities (Ministry of Education, Science and Technology, 2003). The Kochung report concluded children with disabilities had made limited progress towards universal education as a result of the government failure to implement previous recommendations.
In 2003, the newly elected government fulfilled one of its major election pledges when it launched the Free Primary Education (FPE) program. Under the new FPE policy, the government abolished primary school fees for all children. The government also provided additional funds for schools providing services to children with disabilities (Republic of Kenya, 2005b). Despite the FPE policy, the Sessional Paper No. 1 of 2005 noted that less than 10% of children with disabilities had access to school. The paper acknowledged that more funding was required; in 2004/2005 the Government spent only 0.2% of the total education budget on special education. For the first time, the government committed to develop a national policy that would define all areas of special needs and provide additional support to schools offering services to children with disabilities.
The Kenya Education Sector Support Programme (KESSP) 2005–2010 acknowledged that the government had ignored children with disabilities. The KESSP noted the following constraints: no clear guideline on inclusive education, no reliable data on children with special needs, lack of special education teachers, high cost of materials, and low enrollment due to taboos related to disability (Republic of Kenya, 2005a). It is important to note that these constraints were not new. They had been mentioned in all previous government education reports, but none of the policy recommendations had been implemented. The lack of implementation rendered other government programs ineffective. For example, the Sessional Paper No. 5 of 1968 was the first government document to recommend a survey of people with disabilities but none had been conducted. The 2008 Education Sector Report found that the KISE was unable to effectively function because there was no accurate data on children with disabilities (Republic of Kenya, 2008). Therefore, it is not surprising that the Kochung Report found that children with disabilities made limited progress towards universal education.
In 2007, the first ever survey of persons with disabilities, KNSPWD, was conducted. The KNSPWD aimed to estimate the number of people with disabilities, their distribution, and their demographic and socio-economic characteristics. The survey also sought to “determine the types and causes of the disabilities; the problems faced and coping mechanisms, and the nature of services and rehabilitation programmes available” (National Coordinating Agency and Development and Kenya National Bureau of Statistics, 2008: xi). This survey was conducted about four decades after a survey was first recommended in 1968. The survey was an important milestone in the outlook of people with disabilities; accurate data would make it possible for other policies to be implemented and services provided.
There were two other important milestones in 2010. First, Kenyans approved a new constitution in 2010. The new constitution guarantees children with disabilities the right to free and compulsory education. For children with disabilities who have been marginalized, the constitution requires the government to take measures to ensure they receive education. The government is now required to enact affirmative action policies that ensure children with disabilities, who have been marginalized, have equal access to education with children without disabilities. The constitution requires the government to provide better access to education and also establish infrastructure for education children with disabilities. With the new constitution, the government is now legally obligated to provide quality education to all children. The government must now provide services to previously marginalized children or face legal action.
Second, the government launched the National Special Needs Education policy framework in 2010 to “provide a comprehensive framework of the principles and strategies to be followed in order to create equal access to quality and relevant education and training for these learners” (Republic of Kenya, 2009, p.15). The policy framework sought to address the challenges facing the education of children with disabilities in Kenya. The objectives included: early identification, assessment, intervention, and placement; increase public awareness; provide facilities; develop capacity; promote inclusion; support research and disseminate information. It is important to remember that a policy framework had been recommended as far back as the 1976 Gachathi Report.
There is reason to be cautiously optimistic about the education of children with disabilities because the current legislative and policy environment guarantees disabled children quality education. The government is now obligated to provide quality education to all its citizens, including those with disabilities. Besides the new constitution, the government, for the first time, collected data on people with disabilities in 2007. The KNSPWD was used in the next section to examine the education participation of children with disabilities.
Data and analysis
This study used data from the 2007 KNSPWD. The KNSPWD was conducted by the National Coordinating Agency for Population and Development, with technical and financial support from the Kenya National Bureau of Statistics; Ministry of Gender, Sports, Culture and Social Services; Ministry of Health; Ministry of Education, Science and Technology; United Disabled Persons of Kenya; Kenya Programmes of Disabled Persons; Association for the Physically Disabled of Kenya; Africa Mental Health Foundation; International Development Project; World Bank; and the UK’s Department for International Development.
The survey was designed to provide a nationally representative sample. The data were collected from 14,569 households in 69 districts. Mount Elgon district was excluded due to security concerns. Questionnaires were administered between July and November 2007 to individuals with disabilities, households, and heads of institutions serving people with disabilities. Focus-group discussions were also conducted in groups comprising people with disabilities, service providers, and teachers.
This survey data is particularly appropriate for this analysis because it was conducted to generate quality data on the condition of people with disabilities. The aim of the survey, the first of its kind in Kenya, was to estimate the number of people with disabilities, their regional distribution, and their demographic and socio-economic characteristics. The survey also sought to determine the types of the disabilities; the problems faced by the people with disabilities, the coping strategies, and the services provided by the government and civil society groups. The disability prevalence in the KNSPWD was computed using six domains: hearing, visual, mental, physical, self-care, and other disabilities.
This study examined school participation for children with disabilities in Kenya. How does disability affect school participation? How does disability affect educational attainment? The models include independent variables based on previous research on the factors that determine school enrollment and attendance. The research highlights the individual (age and gender), and household characteristics (size, structure, education of the head of household, place of residence—rural/urban and district) that influence school enrollment and attendance. Individual characteristics include age and gender of the child.
Descriptive statistics
Any disability statistics are dependent upon the definition of disability and the intended purpose for collecting the disability data. Mont (2007) found that different instruments used to measure disability produce very different results even in the same country. In the case of Kenya, the 2009 Population and Housing Census reported there were 1.3 million (3.5%) people with disabilities (Kenya National Bureau of Statistics, 2010). The 2011 WHO World Disability Report, based on 2002–2004 World Health Survey data, puts the figure of Kenyans with disabilities at about 5.8 million (15.2%).
The KNSPWD household questionnaire used a number of questions to determine which people have communication, mental, and physical disabilities. The following questions were included: Does (NAME) have difficulty hearing even when having hearing aids? Does (NAME) have difficulty in speaking? Does (NAME) have difficulty seeing even when wearing spectacles/glasses? Does (NAME) have (intellectual, emotional, or psychological disturbances, difficulty remembering things, being understood)? Does (NAME) have/had delays in walking, talking, feeding, or social interactions or is hyper active, aggressive, or has mannerism? Does (NAME) have difficulty in (walking, climbing stairs, using hands, sitting upright, standing)? Does (NAME) have difficulty in eating, bathing/washing self, toileting, etc.? Does (NAME) have other type of disability not falling among previous categories mentioned?
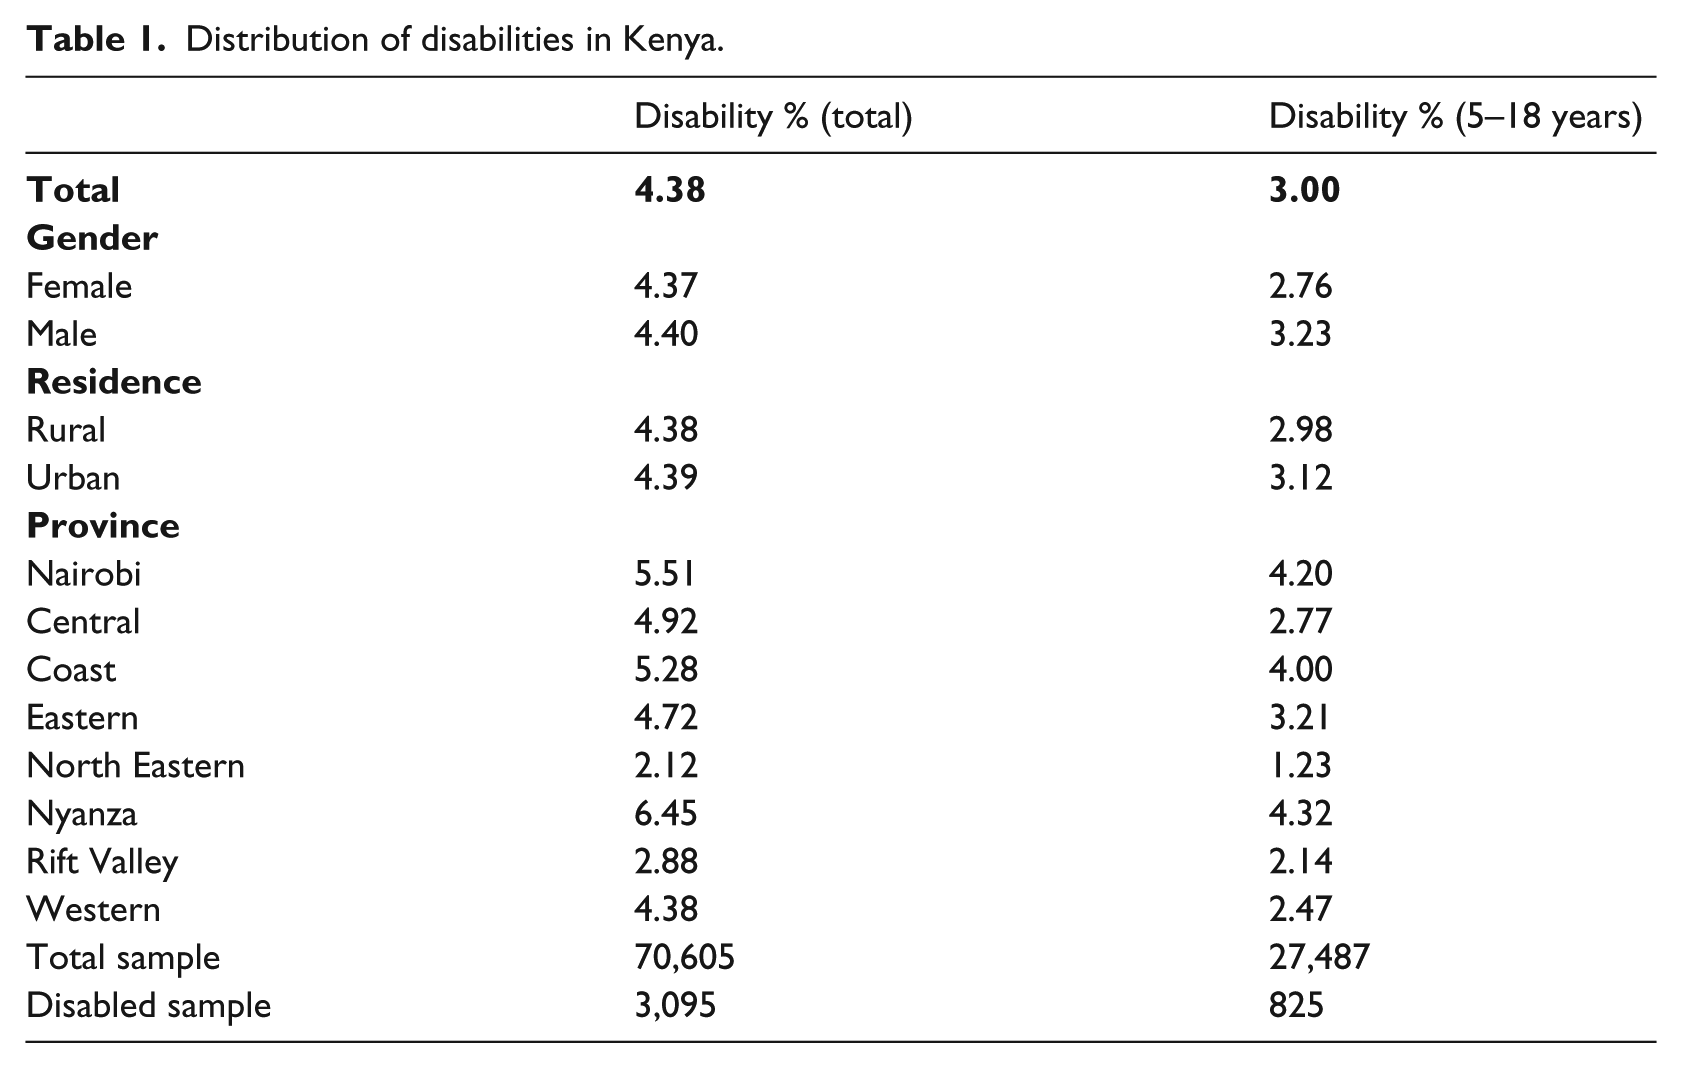
Table 1 presents the sample distribution by gender, place of residence, and province. From the sample of 70,605 individuals, 4.38% (3,095) reported they had a disability. There were differences in the distribution of people reporting disabilities between provinces. Nyanza province reported the highest prevalence (6.45%) while North Eastern province reported the lowest (2.12%). About 38.9% of the sample were children of school-going age (5–18 years); 3% of these children reported they had a disability.
Distribution of disabilities in Kenya.
The KNSPWD included a questionnaire only for people with disabilities; the respondents were either the person with the disability or a proxy/parent/guardian. Previous research established that disability disproportionately affects populations in low-income countries such as Kenya. People in these low-incomes countries tend to have poorer diet, limited access to healthcare, and higher exposure to disease, conflict, and injury due to hard living conditions and accidents (DFID, 2000; Durkin et al., 2008; Yeo and Moore, 2003).
Table 2 presents the causes of disability in Kenya. Some form of injury—accident, burnt, pollution, and fighting/domestic violence—accounted for approximately 15% of the disabilities. About 25% identified a health-related cause for their disability: stroke, lack of immunization, disease, and wrong medication. Health-related factors are also likely to be at play for the 12.28% who state they were born with the disability because a UNESCO (2010) study linked prenatal health deficiencies to disabilities in children. The UNESCO (2010) study reported that “Maternal iodine deficiency leads to 18 million babies being born with mental impairments and deficiency in vitamin A leaves about 350,000 children in developing countries blind” (p.181). From Table 2 one may argue that some identified disabilities may have been avoided if the people had access to quality healthcare and other basic services.
Causes of disabilities.
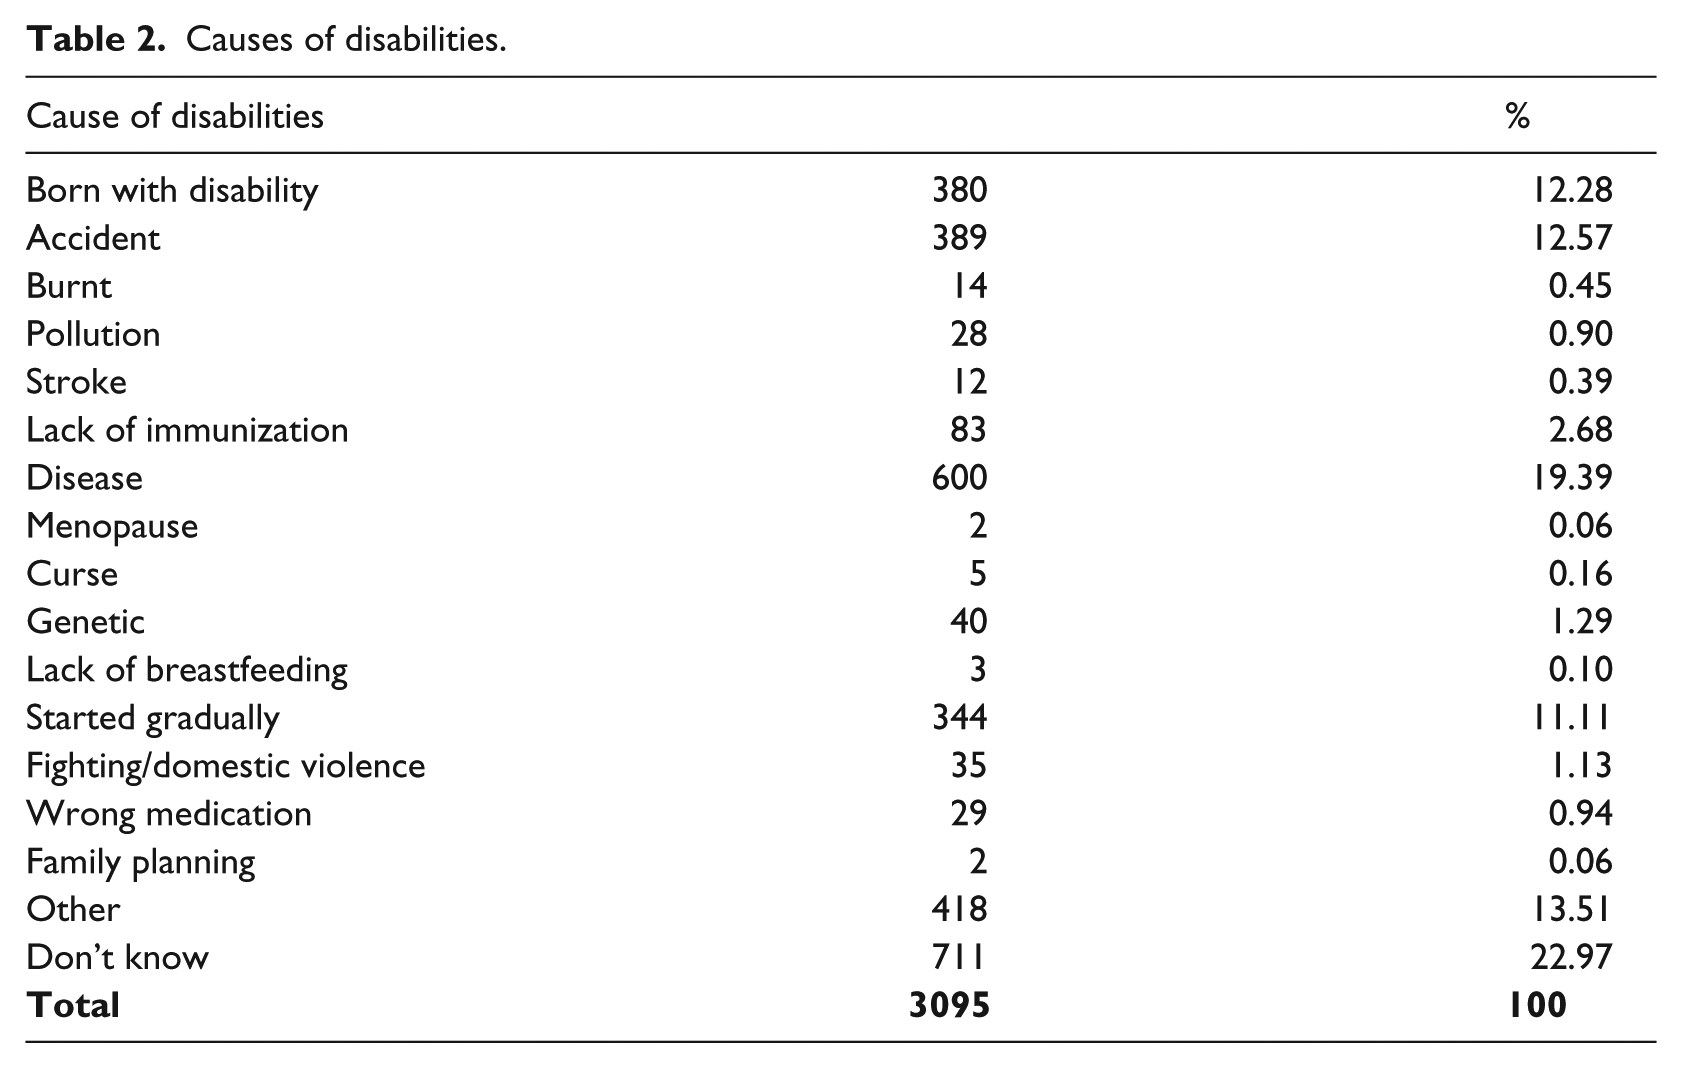
Table 3 presents the school enrollment status of the 27,487 school-age children (5–18 years) in the sample. This table indicates there are enrollment differences between those who reported disabilities (825 children) and those who did not. The differences are evident by gender, place of residence, and province. Approximately 17% of girls without disabilities reported they had never enrolled in school compared to about 35% of girls with disabilities; the deficit in enrollment between girls with disabilities and those without was –17.86. For boys, the deficit in enrollment was smaller at –8.73. In rural areas the enrollment gap between those with disabilities and those without was very large; the enrollment deficit in rural areas was –21.58.
Percent enrollment of school-age children (5–18 years).
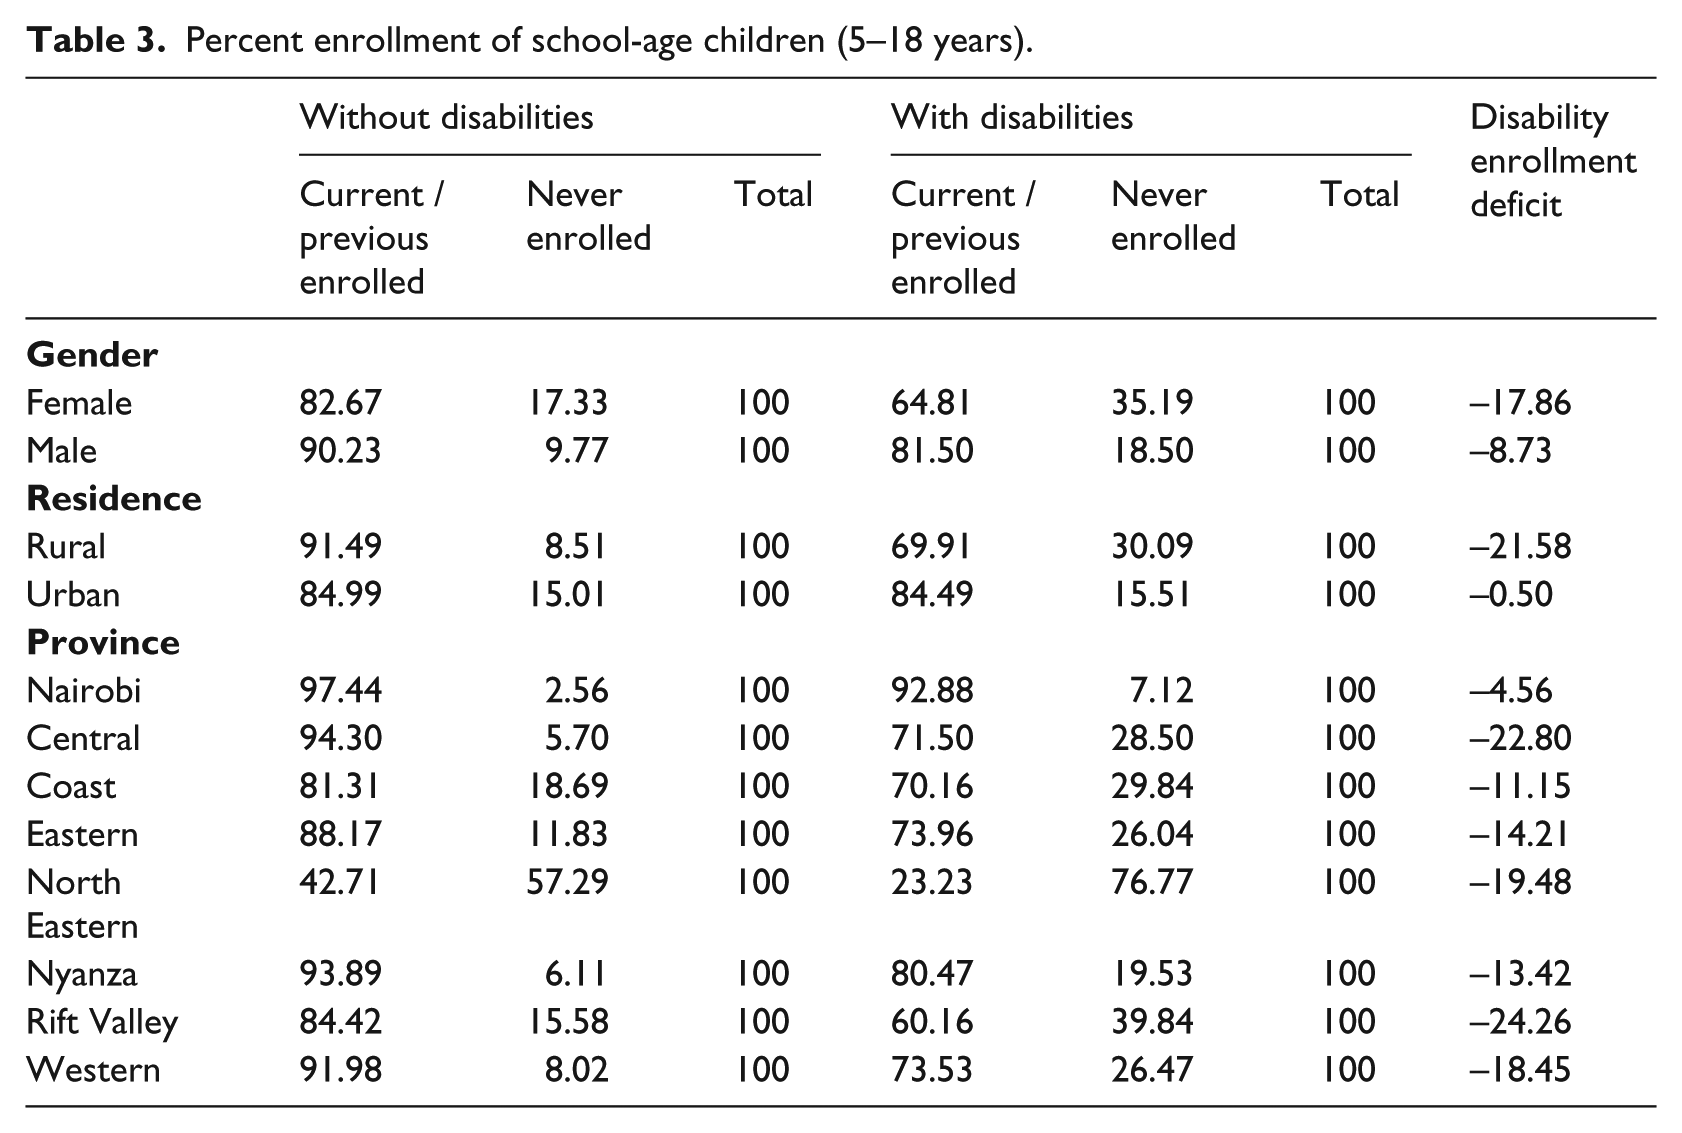
Rift Valley and Central provinces also had large deficits of –24.26 and –22.80, respectively. North Eastern province reported the highest proportion of children who reported they had never enrolled in school. Approximately 23% of North Eastern children with disabilities reported they had enrolled in school and about 43% of children without disabilities had enrolled in school. Despite having a smaller deficit than Rift Valley and Central provinces, North Eastern province had significantly lower levels of school enrollment. Nairobi province reported the lowest proportion of children who reported they had never enrolled in school.
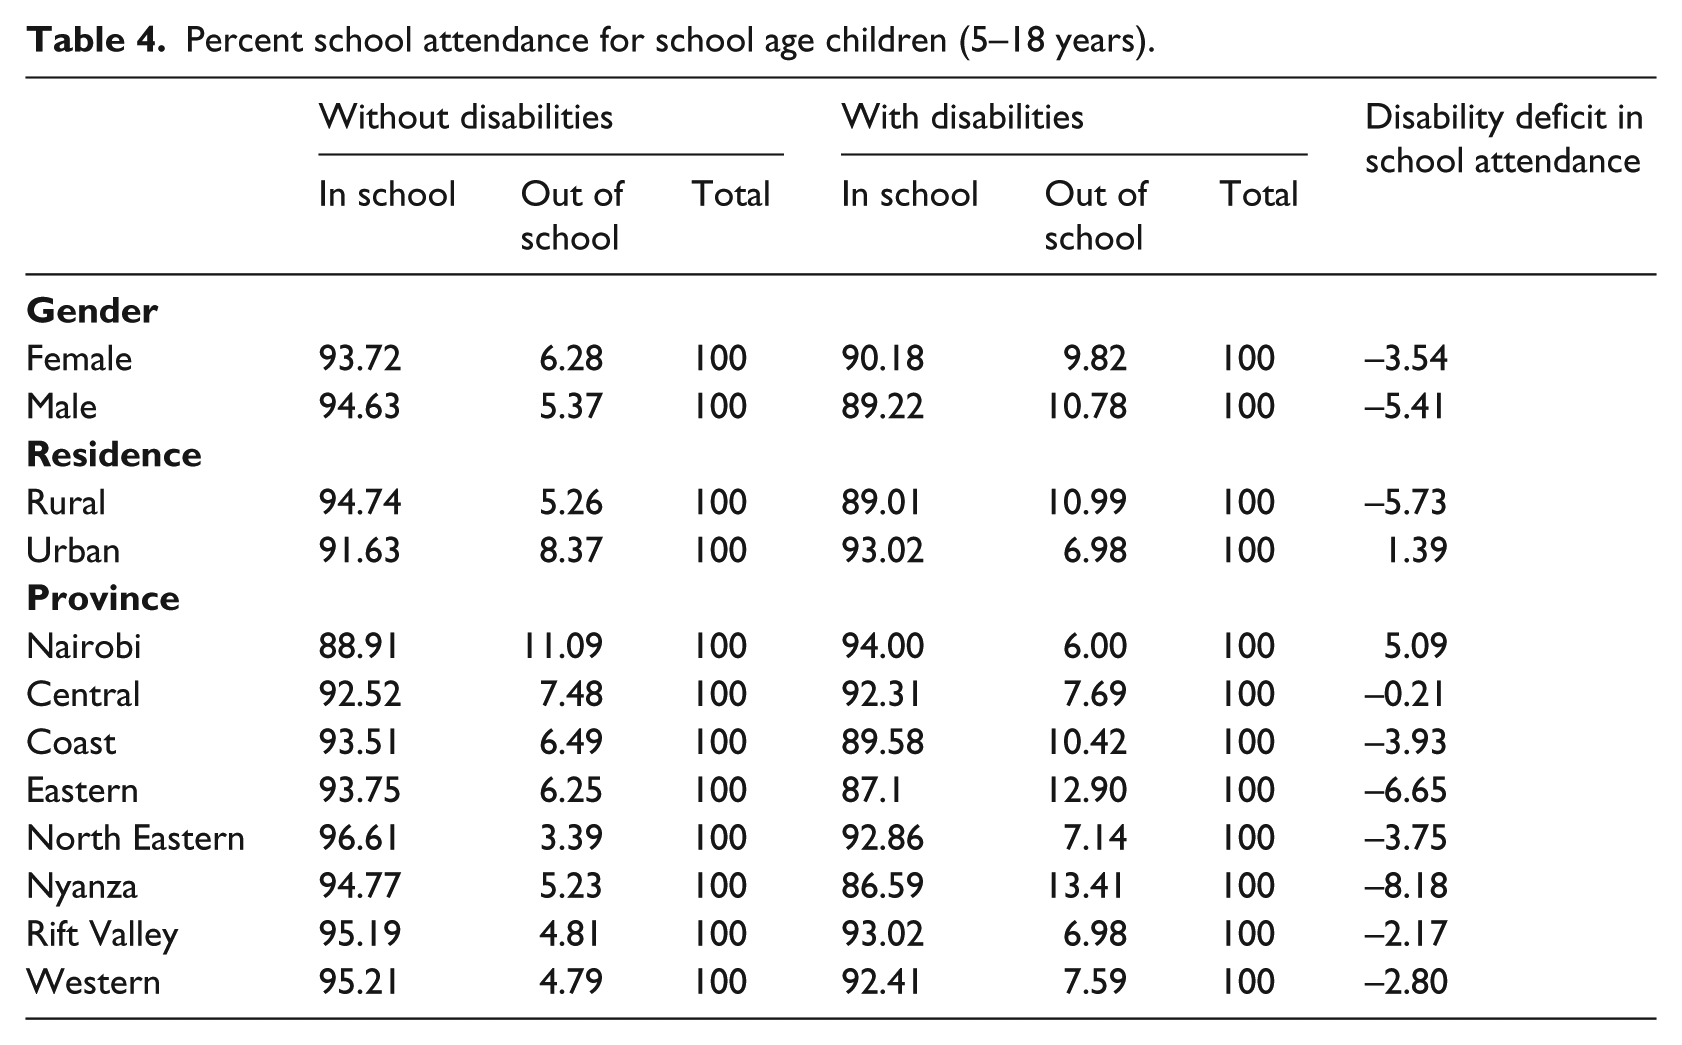
In Table 4 we examine the school attendance status of children (5–18 years). It is important to remember, from Table 3, that approximately 35% of girls and 18% of boys with disabilities had reported that they had not enrolled in school. The school attendance deficit for girls was –4; about 6% of girls without disabilities reported they were out of school compared to about 10% of girls with disabilities. For boys, the school attendance deficit was –5. There were also differences in rural areas in favor of children without disabilities; however, the differences were in favor of children with disabilities in urban areas. The school attendance deficits were much smaller than the enrollment deficit; this suggests that some children with disabilities are entirely kept out of school. However, those who do enroll in school are likely to attend school.
Percent school attendance for school age children (5–18 years).
So far, we have seen that access to school for children with disabilities lag behind those for children without disabilities. For those who attended school, did they receive educational services and supportive devices in schools? According to the questionnaire, educational services included remedial therapist, special school, early childhood stimulation, regular schooling, inclusive education set up, etc. Assistive and supportive services and devices included sign-language interpreter, orthopedic appliances, ambulatory aids, hearing/visual aids, assistant, social services, Braille materials, etc. The KNSPWD individual questionnaire asked respondents to report on the services and devices, if any, they needed and received.
The availability of services and devices help people with disabilities overcome the social and institutional barriers; without these services and/or devices the impairments make it difficult for them to function in society. Table 5 presents the services and devices required and received by people with disabilities by age group. The age groups are early childhood (0–4 years), school age (5–18 years), and adulthood (19+ years). For early childhood, between 29% and 36% required educational services or assistive and supportive devices and services, while only 5% received any services for their disability. For school-age children, 53% reported they required educational services, but about 24% received any educational services. Regards assistive and supportive devices and services, about 45% required services, while only 10% received any services. Among the adults, 60% reported they required assistive and support devices and services; however, only about 27% received any services or devices.
Availability of educational and support services for the disabled in Kenya.
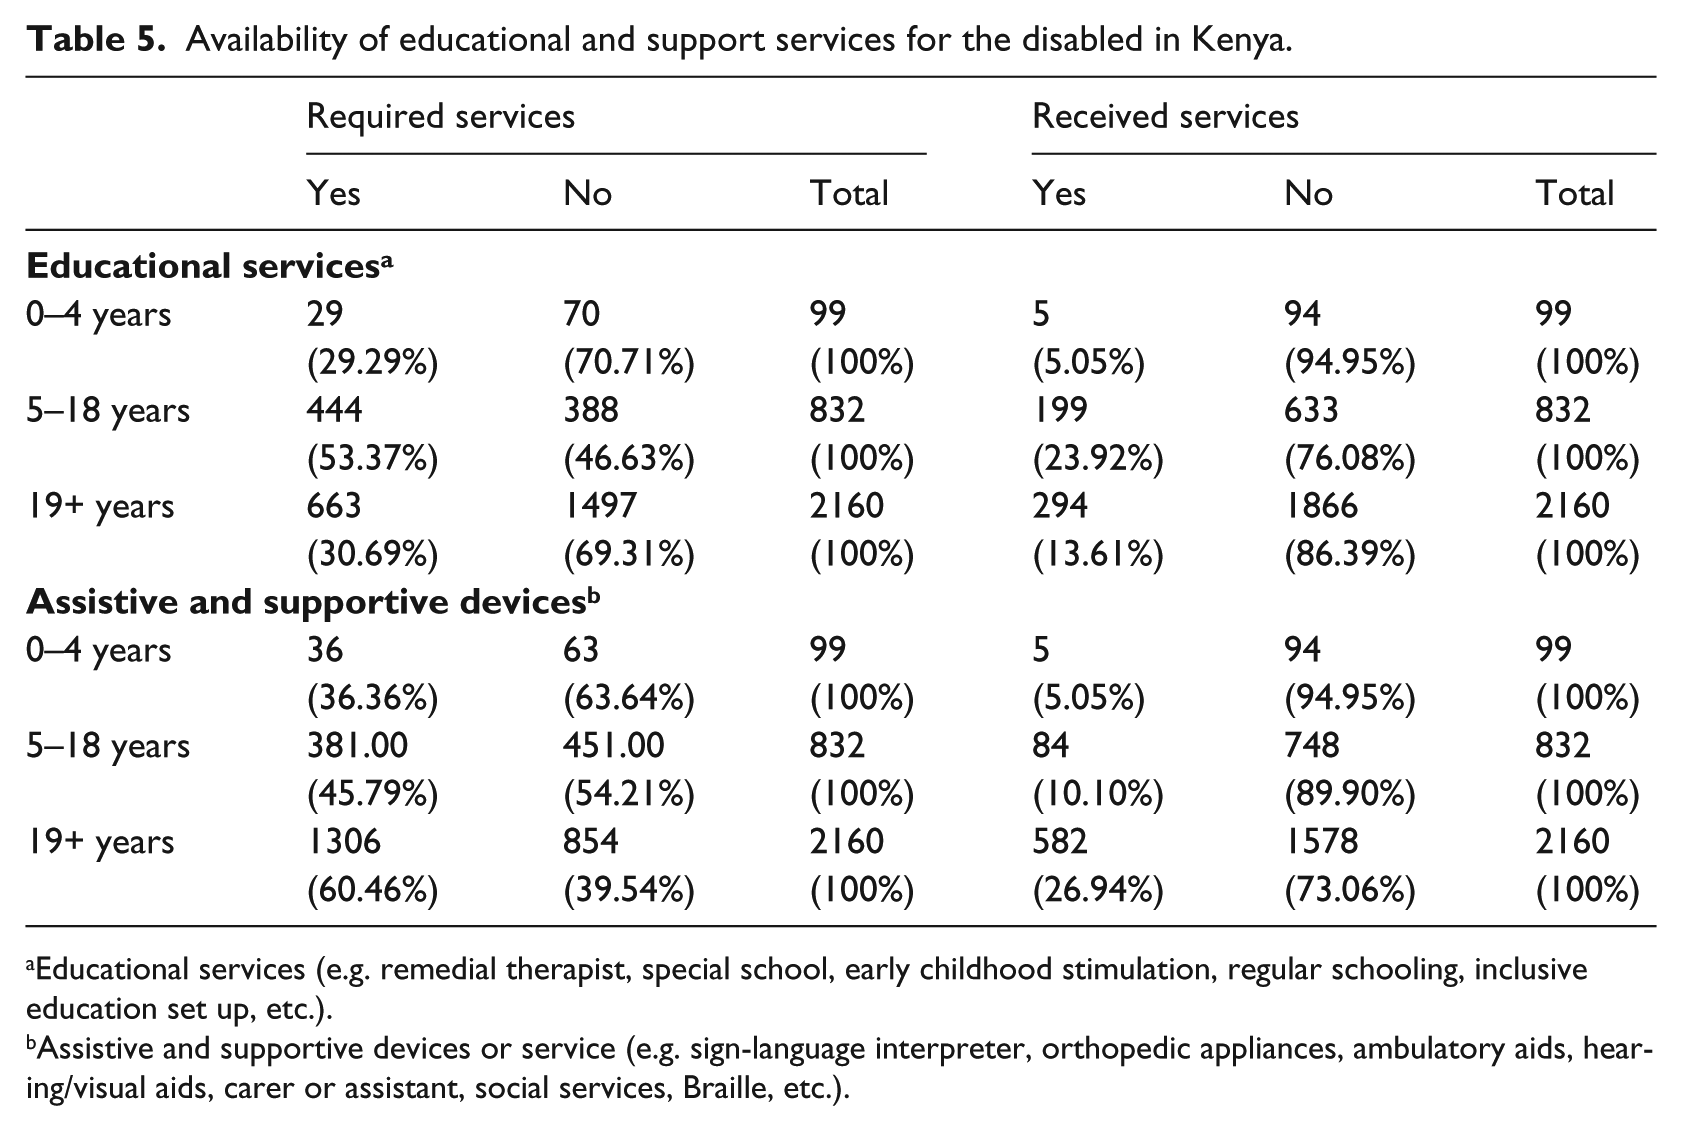
Educational services (e.g. remedial therapist, special school, early childhood stimulation, regular schooling, inclusive education set up, etc.).
Assistive and supportive devices or service (e.g. sign-language interpreter, orthopedic appliances, ambulatory aids, hearing/visual aids, carer or assistant, social services, Braille, etc.).
The data from Table 5 indicates that the majority of the disabled do not receive services and devices they required to function effectively in society. This is not entirely surprising because in the literature review we saw evidence of the lack of government commitment to the disabled; non-implementation of policy recommendations; limited funding to EARCs and KISE, lack of special education teachers despite the establishment of KISE, and limited facilities in schools (Ministry of Education, Science and Technology, 2003; Republic of Kenya, 2005a; UNESCO, 1988).
A greater proportion of school-age children with disabilities, especially in rural areas, do not attend school. As indicated in the literature review, the Government of Kenya established EARCs and KISE in the 1980s to provide services children with disabilities, schools, and special education teachers. However, UNESCO, government reports, and the KNSPWD survey data indicate that the disabled in Kenya have been ignored and will continue to lag behind those without impairments. The descriptive data showed that less than 25% of school-age children with disabilities received educational services and only about 10% received any support or assistive devices.
Multivariate analysis
The aim of this study was to examine school enrollment, attendance, and primary school completion for children with disabilities in Kenya. This section used logistic regression to estimate the probability of school enrollment, attendance, and completion for children with disabilities controlling for various household characteristics. The models included the following independent variables: children’s gender, children’s age, number of children, disability status, education of the head of household, province (Rift Valley, Coast, Central, Eastern, Nairobi, Nyanza, North Eastern, Western), rural/urban residence, and survival status of the mother and father. These independent variables are based on previous research on the determinants of education in sub-Saharan Africa.
The results of the logistic regression analysis are presented in Tables 6–8. The tables present the odds ratio, where 1 represents no effect of the independent variable, a ratio greater than 1 indicates that the independent variable increases the odds of school enrollment, attendance, and completion, and a ratio less than 1 indicates that it diminishes the odds of school enrollment, attendance, or completion. For example, the odds ratio for female in Model 1 (Table 6), 0.251, indicates that girls/women have a lower probability of enrolling in school compared to boys.
Odds ratios of school enrollment (5+ years).
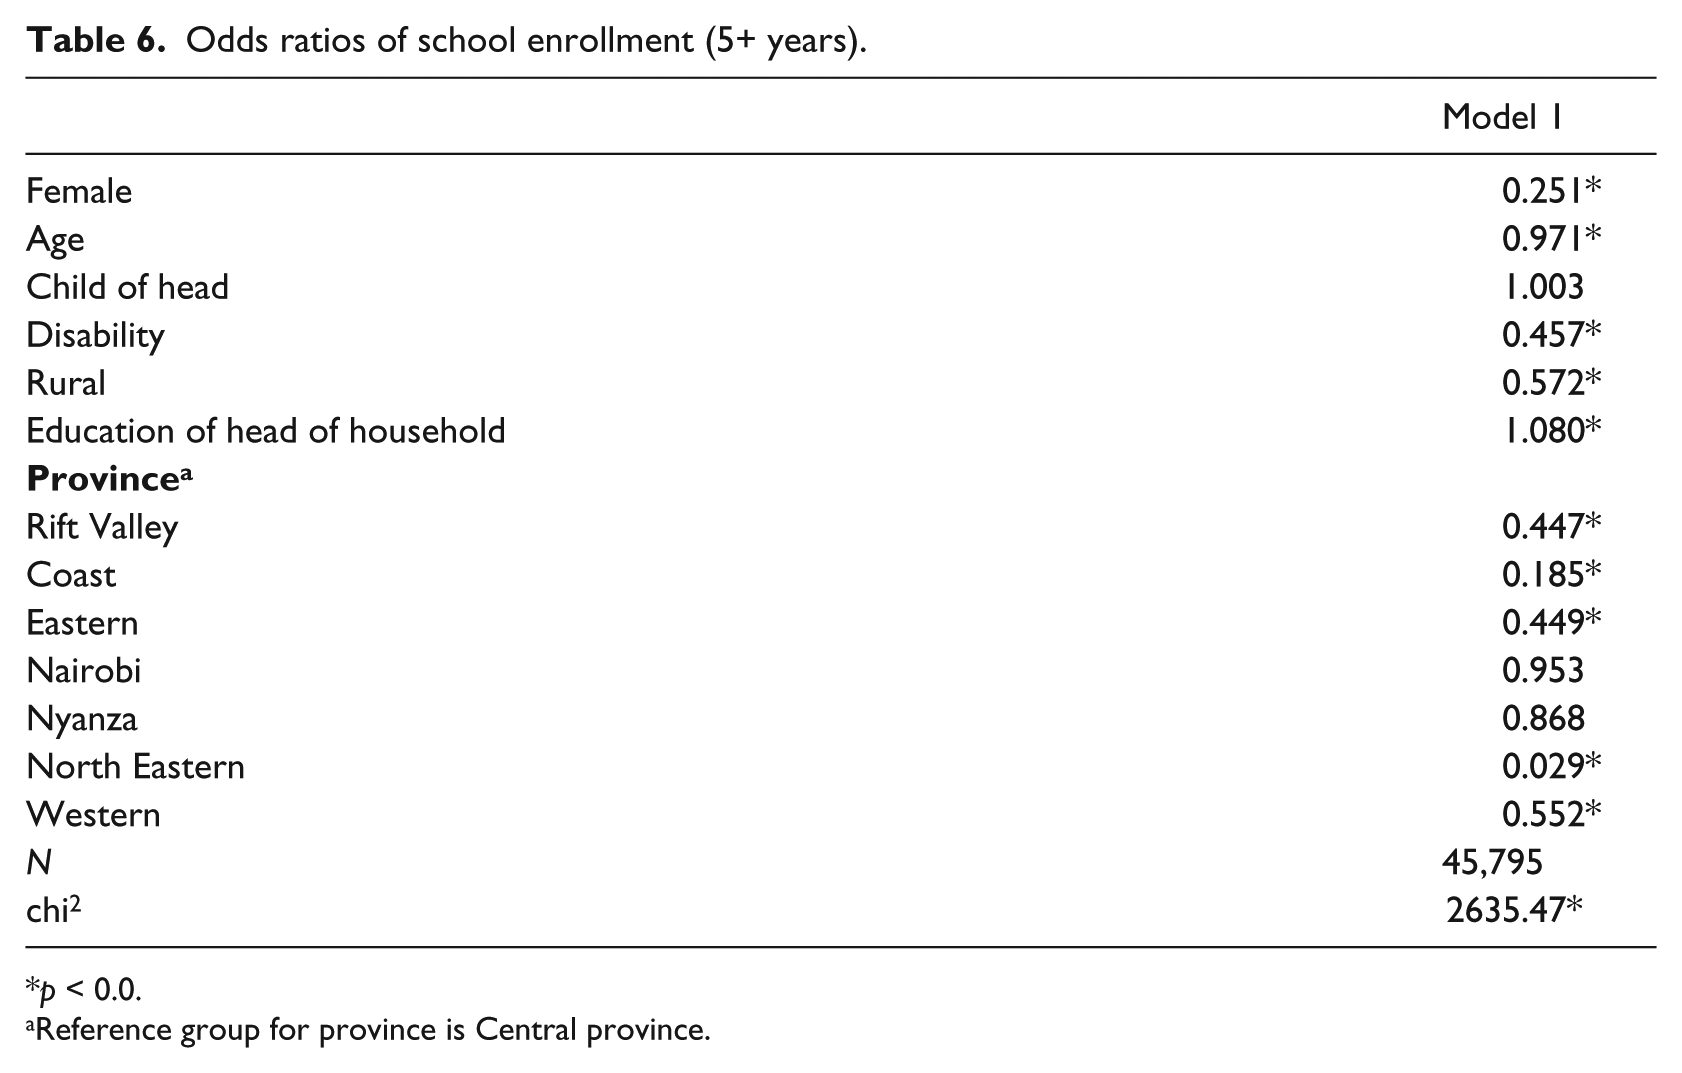
p < 0.0.
Reference group for province is Central province.
Odds ratios of school attendance (5–18 years).
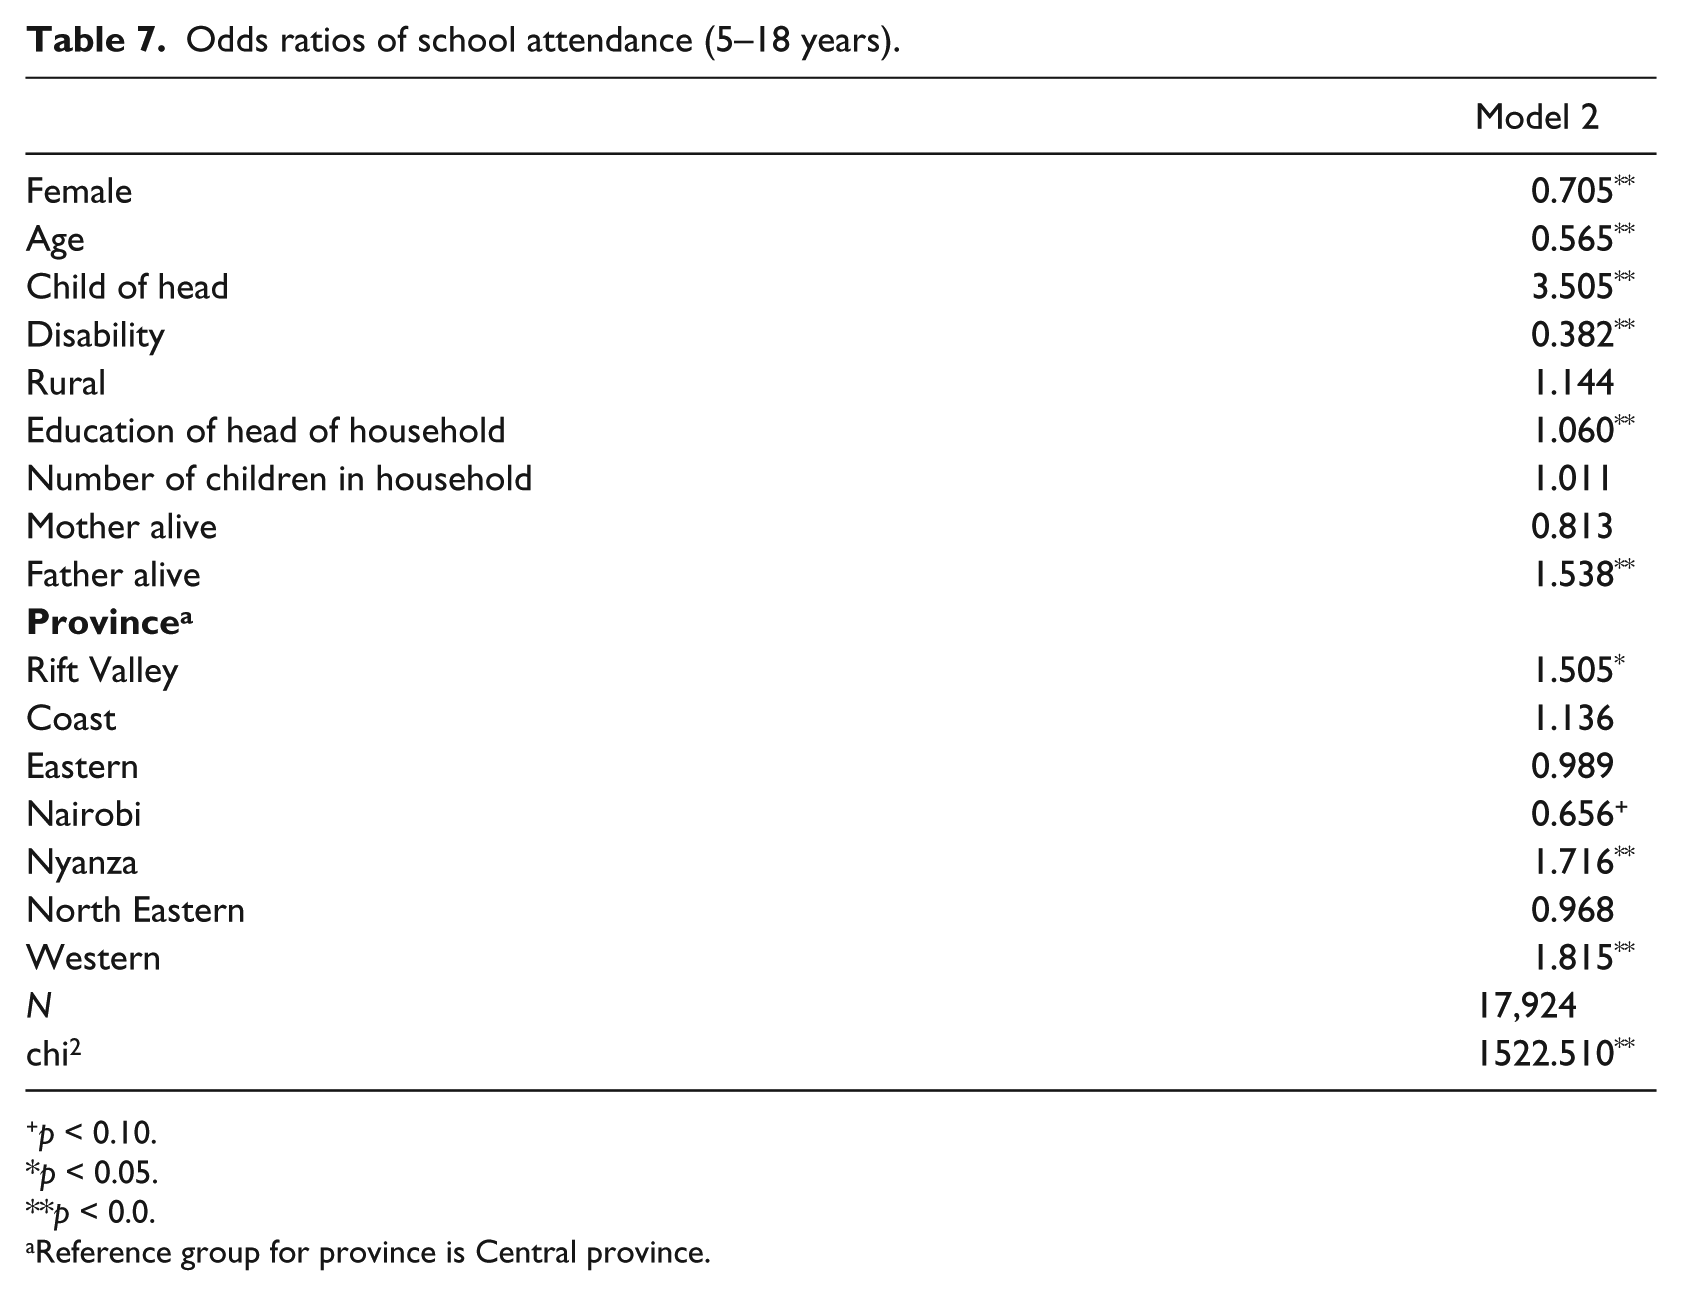
p < 0.10.
p < 0.05.
p < 0.0.
Reference group for province is Central province.
Table 6 presents the results for the first logistic regression model, Model 1, which shows the probability of school enrollment for individuals (5+ years). The respondents were asked: Has (NAME) ever gone to school? The results show that girls/women, compared to boys/men, have a lower probability of enrolling in school although the difference is not statistically significant. Older people have a lower probability of ever enrolling in school. Individuals who reported disabilities have a lower probability of ever enrolling in school; they were about 55% less likely to ever enroll in school compared to those who reported no disabilities. The place of residence compares the probability of enrolling school between rural and urban residents. Rural residents have a lower probability of ever enrolling in school. The household socio-economic status is measured by education level of the head of household. The results show that households of higher socio-economic status have a higher probability of enrolling in school. Individuals in North Eastern province have the lowest probability of school enrollment. The results in Table 6 indicate that the disadvantage associated with disabilities is larger than the rural disadvantage, but smaller than the female disadvantage. Therefore, girls/women, individuals with disabilities, and rural residents have unequal access to schooling.
This study also examined the probability of school attendance; the results of the logistic regression analysis are presented in Table 7. The dependent variable was created from the question: Is (NAME) currently in school /college? The sample was restricted to children of school-going age, 5–18 years. Being female is negatively associated with school attendance. As children get older they have a lower probability of school attendance because it is likely that alternatives to school increase. About 79% of children (5–18 years) reported they were children of the head of household; Table 7 indicates that these children are about 3.5 times more likely to attend school compared to non-biological children of the head of household. Children with disabilities have a lower probability of attending school; these children are about 60% less likely to attend school compared to those without disabilities. The more educated the head of household, the greater the probability of school attendance for children. In terms of school attendance, the disadvantage associated with disability is larger than the female or rural residence disadvantage. From Table 7 we find that children with disabilities face the greatest disadvantage when it comes to attending school.
Another objective of the study was to estimate the probability of completing Standard (Grade) 5 and Standard (Grade) 8 for children with disabilities in Kenya. Successful completion of Standard 5 is taken as the threshold for acquisition of literacy and numeracy (UNESCO, 2005). Primary school is Standard 1–8 in Kenya. Parents/guardians were asked the following questions: What is the highest level of school (NAME) has attended? What is the highest grade (NAME) completed at that level? A dichotomous outcome variable (1 = completed Standard 5/8, 0 = Standard 5/8 incomplete) was generated from their responses. If children enroll in school at the required age of 6 and progress successfully they should complete Standard 5 by age 11 and Standard 8 by age 14. Therefore, the results presented in Table 8 include children aged 11–18 years for Model 3 (completed Standard 5) and 14–18 years for Model 4 (completed Standard 8).
Odds ratios of completing Standard 4 and Standard 8.
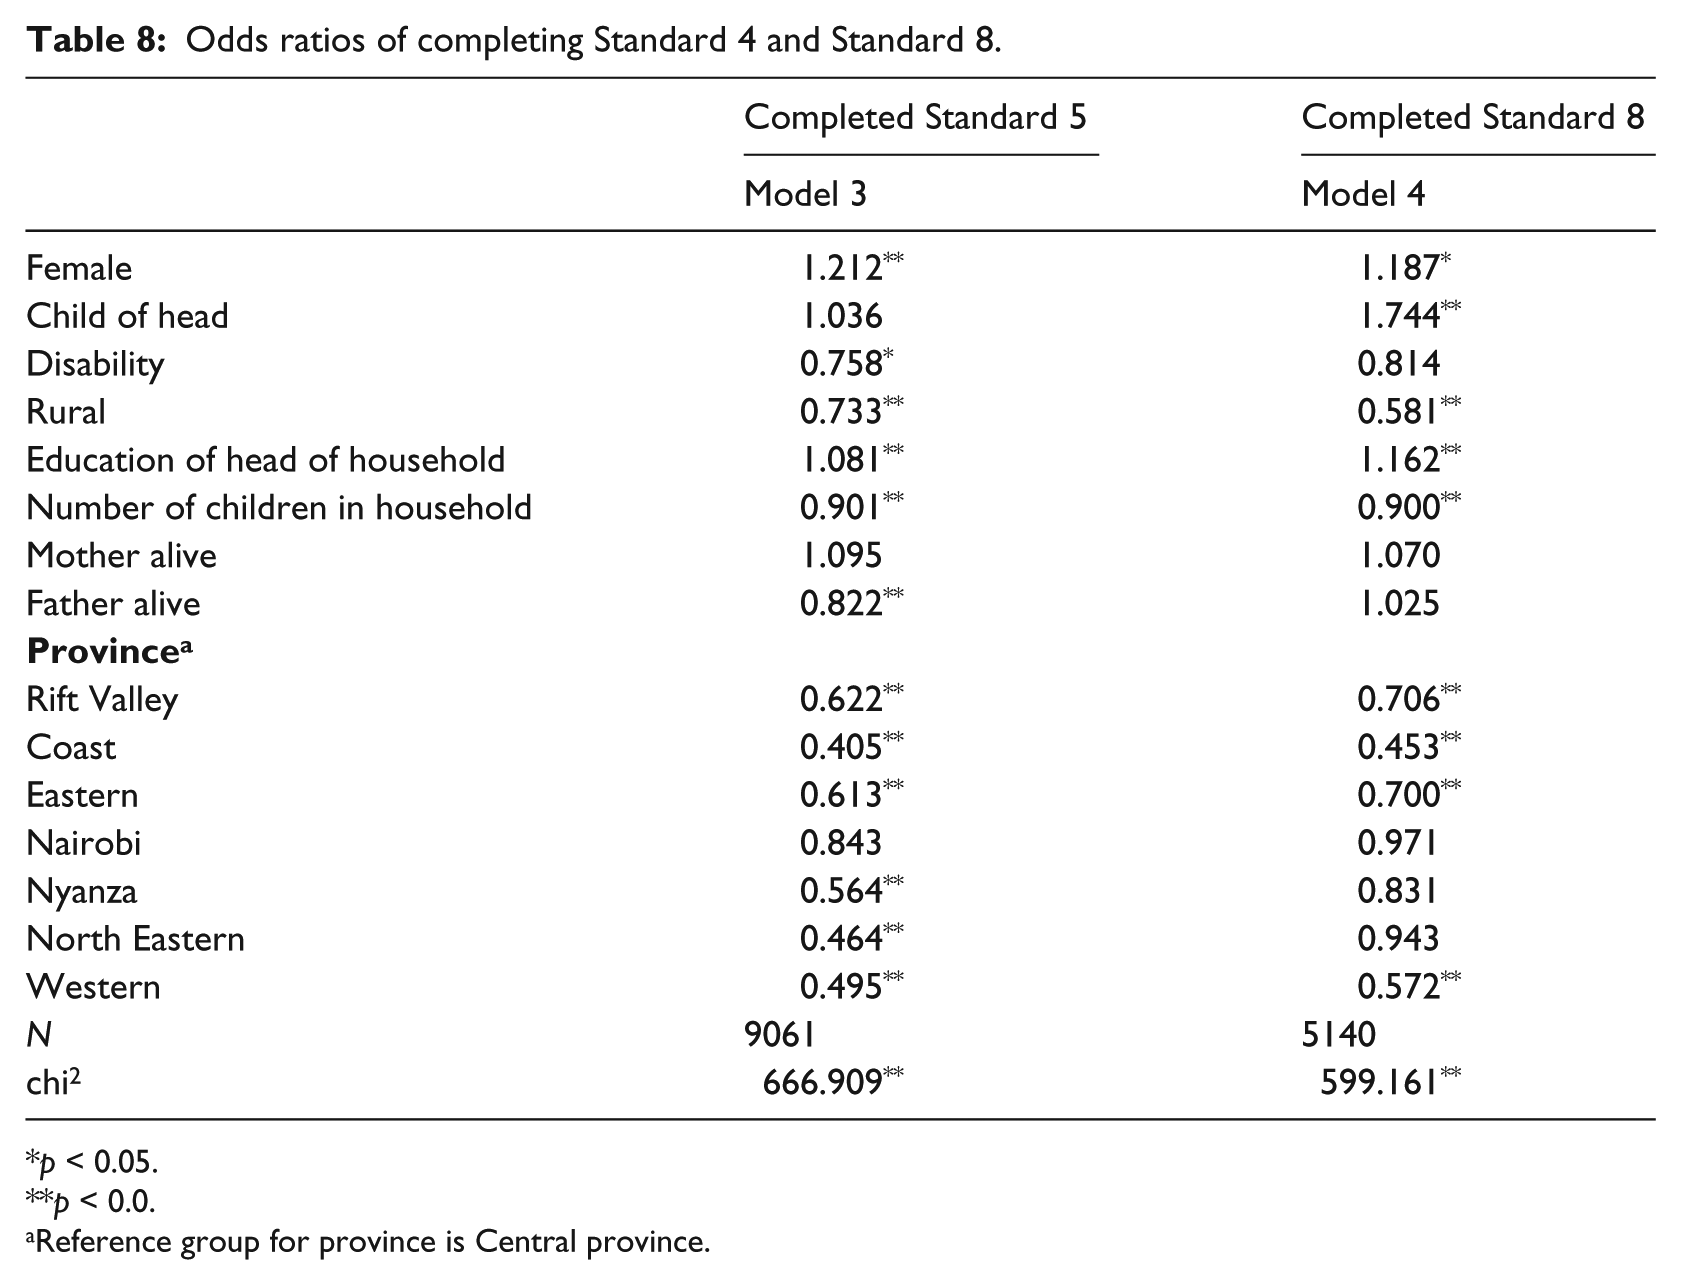
p < 0.05.
p < 0.0.
Reference group for province is Central province.
As we examine the results of the logistic regression analysis in Table 8, it is important to remember, from Models 1 and 2, that children who reported disabilities are 55% less likely to enroll in school; when they do enroll in school they are 60% less likely to attend school. From Model 3 in Table 8 we see that children with disabilities are about 25% less likely to complete Standard 5 compared to a child with no reported disabilities. For children aged 14–18 years in Model 4, children with disabilities are less likely to complete Standard 8; however, the results are not statistically significant. This may indicate that those children with disabilities who do continue to attend school are able to complete the primary school cycle. This is despite the limited availability of devices and services we saw in Table 5. Another interesting finding from Table 7 was that girls have a lower probability of school attendance; however, in Table 8 we find that girls have a higher probability of completing Standard 5 and Standard 8. This may indicate that girls who continue to participate in school are more likely to complete school compared to boys.
The multivariate analysis indicates that individuals who reported disabilities had a significant disadvantage in school enrollment, attendance, and completion. In school enrollment we found that individuals with disabilities (5+ years) were about 55% less likely to enroll in school. Further, children with disabilities of school-going age (5–18 years) were 60% less likely to attend school. Given the lower probability of school enrollment and attendance, it is not surprising that these children also have a lower probability of completing Standard 5. The study found that these 10–18-year-old children with disabilities are 25% less likely to complete Standard 5.
Discussion
This paper shows that since independence the government has neglected people with disabilities. Section 82(3) of the first post-independence constitution in 1963 prohibited discrimination by race, tribe, origin or residence, political views, creed, color, or sex. However, it made no specific reference to discrimination against people with disabilities. The Education Act 1968 (revised in 1970) prohibited exclusion from school based on sex, race or color, or on any other reasonable grounds. Although “other reasonable grounds” could have included children with disabilities, the Kenya National Commission on Human Rights argued that these children had limited legal recourse if they were excluded from school (Kenya National Commission on Human Rights, 2007).
From 1963, Government reports made numerous policy recommendations; however, none of the recommendations were implemented as required. The reports include: The Ngala Report (1964), the Ominde Report (1964), the Gachathi Report (1976), the Kamunge Report (1988), the Koech Report (1999), and the Kochung Report (2003). KESSP 2005–2010 acknowledged that the government had ignored children with disabilities. The KESSP highlighted the following challenges facing the education of children with disabilities: no clear guideline on inclusive education, no reliable data on children with special needs, lack of special education teachers, high cost of materials, and low enrollment due to taboos related to disability (Republic of Kenya, 2005a).
In 2010, the legislative and policy context in Kenya changed. First, Kenyans approved a new constitution. The new constitution guarantees every child the right to free and compulsory education; it also grants the government the authority to put in place affirmative action policies to address disparities. The government is legally liable to provide education to its citizens. Second, the government presented the draft National Special Needs Education Policy Framework. The framework was developed to plan and implement education for children with special needs and ensure access to quality and relevant education for children with special needs. Third, for the first time, since the 1964 Ngala Report recommended a survey, the government collected data on people with disabilities. The KNSPWD was conducted in 2007. Data from this survey was used in this paper.
The KNSPWD sought to “determine the types and causes of the disabilities; the problems faced and coping mechanisms, and the nature of services and rehabilitation programmes available” (National Coordinating Agency and Development and Kenya National Bureau of Statistics, 2008: xi). This survey is a major milestone. The government previously found it difficult to implement policies due to lack of data. For example, the government did not implement the provisions of the Persons with Disabilities Act (2003) because of the lack of data on persons with disabilities (National Coordinating Agency and Development and Kenya National Bureau of Statistics, 2008). The 2008 Education Sector Report found that the KISE was unable to effectively function because there was no accurate data on children with disabilities (Republic of Kenya, 2008).
What have we learnt from KNSPWD? Before we discuss the findings of the study, it is important to acknowledge some limitations of the KNSPWD data. First, the data may be unreliable because disability was self-reported. Given the stigma associated with disability (Kristensen et al., 2006), it is likely that some households may be ashamed of their disabled children and may not have reported them. Second, the survey did not report the poverty levels; hence, the education level of the head of household was used as a proxy for poverty. Despite the data limitations, we can learn important things that may inform policy.
Poor countries, such as Kenya, have been found to have a higher proportion of disability due to poor nutrition, higher exposure to disease and injury due to poor living and working conditions, and limited access to healthcare (DFID, 2000). The 2011 WHO World Disability Report, based on 2002–2004 World Health Survey data, puts the figure of living with Kenyans disabilities at about 5.8 million (15.2%). However, the KNSPWD data estimate suggests that 4.38% of Kenyans are living with disability; about 3% of school-age children live with disability. This is similar to other studies that also found that household surveys do not generally identify large numbers of people with disability (Filmer, 2008).
Health- and injury-related issues are the main causes of disability. This suggests that disability prevalence can be reduced with an increased access to healthcare services and other social services. Kenya continues to struggle to provide adequate healthcare to all its citizens. Increased focus on primary healthcare may reduce the prevalence of disability. Immunization campaigns in Kenya haven been successful; more children now get the required immunizations.
One of the most important findings of this study is the lack of educational and assistive services. Less than one in four children with disability had access to any services. This is not entirely surprising given the lack of policy attention by the government. An increase in the provision of services will likely increase access to school for school-age children. From the data we saw that children with disabilities were unlikely to attend school; it is likely the lack of these services and devices contribute to this non-attendance. Further, the analysis that showed that those children with disabilities who enrolled and attended school were more likely to complete primary school. This will require increased funding to train special education educators, provide assistive orthopedic devices, hearing and visual aids, etc.
Given the disability disadvantage in schooling, the government must now implement the 2010 Special Needs Education Policy Framework. The framework puts in place multi-agency interdisciplinary strategies with the primary responsibility on the Ministry of Education. Agency responsibilities include the following: Kenya Institute of Curriculum Development (KICD) and KISE will develop new curriculum for children with disabilities; Kenya National Examinations Council (KNEC) will create a special needs department to develop assessments; the government will increase funding to schools, EARCs, KISE, KICD, and other institutions; school administrators will receive training; and Kenyan Sign Language will be developed as an official language. History shows that policy implementation has been a problem in Kenya; many of the strategies in this framework had been proposed before but were never implemented. Legislators, government officials, and the civil society can play a very important role in providing an enabling policy environment, ensuring that implementation is completed within this framework; and also ensuring that there is constant monitoring of this implementation process.
Footnotes
Declaration of Conflicting Interests
The author declared no potential conflicts of interest with respect to the research, authorship, and/or publication of this article.
Funding
The author(s) received no financial support for the research, authorship, and/or publication of this article.