
Abstract
Gerontological research reveals considerable interindividual variability in aging phenotypes, which has motivated research efforts to identify “aging biomarkers.” Aging biomarkers are used to calculate biological age, which are better predictors of disease risk and residual lifespan when compared to chronological age alone. Emerging evidence using the epigenetic clock as an aging biomarker supports highly reliable individualized predictions about future health. This study aimed to determine whether an epigenetic aging biomarker was associated with chronic pain in older adults (60–83 years old). A subset of participants (n = 29) in the Neuromodulatory Examination of Pain and Mobility Across the Lifespan study underwent a blood draw, demographic, psychological, cognitive, and pain assessments. We estimated Horvath’s epigenetic clock and calculated the difference between epigenetic age and chronological age that has been previously reported to predict overall mortality risk. Older individuals without chronic pain (n = 9) had significantly “younger” epigenetic age compared to those with chronic pain (n = 20, p < 0.05). Older epigenetic age was associated with greater pain during daily activities (r = 0.494, p = 0.010) and anatomical pain sites (r = 0.741, p < 0.001) but not pain frequency/duration. An older epigenetic age was also associated with higher vibratory detection thresholds (r = 0.490, p = 0.021), heat pain thresholds (r = −0.478, p = 0.028), and pressure pain thresholds at the trapezius (r = −0.571, p = 0.006) but not thermal detection, pressure pain at the quadriceps or pain inhibition (p’s > 0.05). Epigenetic aging was associated with greater emotional stability (r = −0.461, p = 0.027), conscientiousness (r = −0.549, p = 0.007), and lower extraversion (r = 0.414, p = 0.049) but not depression or affect (p’s > 0.05). Epigenetic aging was also associated with lower episodic (r = −0.698, p = 0.001) and working memory (r = −0.760, p < 0.001). Our findings suggest that chronic pain is associated with accelerated epigenetic aging in healthy, community-dwelling older individuals, and future studies with larger samples are needed to confirm our findings. An aging biomarker such as the epigenetic clock may help identify people with chronic pain at greater risk of functional decline and poorer health outcomes.
Introduction
Chronic pain is reported by a significant proportion of older adults often impacting physical and cognitive function in this growing population. Chronic pain is often associated with premature age-related phenotypes throughout the body. For example, the brains of individuals with chronic pain exhibit age-associated alterations such as cerebral cortical atrophy, 1 abnormal neurochemistry, 2 and cognitive dysfunction. 3 In addition, blood of individuals with chronic pain demonstrates premature accelerated aging characteristics including telomere shortening, 4 increased inflammatory markers and mitochondrial dysfunction,5,6 implicating the involvement of multiple body and physiological systems. Thus, it is plausible that endogenous and/or environmental chronic pain-related factors accelerate biological aging processes.
Biological aging research outline nine candidate hallmarks of aging: epigenetic alterations, genomic instability, telomere attrition, loss of proteostasis, deregulated nutrient sensing, mitochondrial dysfunction, cellular senescence, stem cell exhaustion, and altered intercellular communication. 7 Recently, independent research teams led by Horvath and Hannum8,9 developed two broadly accepted DNA methylation (DNAm) profiles for determining “epigenetic age” using 353 cytosine phosphate guanine (CpG) sites in multiple tissues and 71 CpG sites in blood samples, respectively. Epigenetic age acceleration of chronological age has been found to predict all-cause mortality. 10 Epigenetic age acceleration is also associated with various conditions, including neurological disorders such as Down syndrome, 11 Alzheimer’s disease, 12 Parkinson’s disease, 13 bipolar disorder, 14 and post-traumatic stress disorder.15,16 Similarly, emerging evidence in pain research suggests the involvement of aberrant DNA methylation in animal pain models, 17 in younger individuals with fibromyalgia 18 and in children with chronic post-surgical pain. 19 In addition, TRPA1 DNA methylation levels in whole blood cells were associated with pain symptoms in chronic pain patients. 20 However, these studies only examined candidate marker pathways and no study to date has examined epigenetic age acceleration as proposed by Horvath. 9
In the present investigation, we employed Horvath’s epigenetic biomarker 9 to investigate the association between epigenetic aging and chronic pain in community-dwelling individuals aged 60 to 83 years. Consistent with previous work, 9 we estimated an epigenetic-predicted age difference or epigenetic clock, (calculated as epigenetic-predicted age minus chronological age), processed through a validated analysis pipeline. 9 The pipeline was developed and validated by Horvath9,21 used 8000 samples from Illumina DNA methylation array datasets to train statistical models. In all models, the same set of 353 regions of DNA where a cytosine nucleotide is followed by a guanine nucleotide in the linear sequence of bases along its 5′ → 3′ direction or CpGs, were predictive of chronological age irrespective of the DNA source within the same person.9,21 Therefore, the primary hypothesis of the present study was that older adults reporting chronic pain will have accelerated epigenetic aging (i.e., older epigenome relative to chronological age) compared to older adults that did not report chronic pain during the past three months. In addition, we also tested exploratory associations between epigenetic age with clinical pain characteristics, as well as psychological, somatosensory and cognitive function consistent with a biopsychosocial and multidimensional pain experience.
Materials and methods
Participants
Community-dwelling individuals over the age of 60 who were native English speakers were recruited as part of an ongoing project at the University of Florida (UF) focused on neuroimaging age-related differences in pain modulation and associations with function (Neuromodulatory Examination of Pain and Mobility Across the Lifespan (NEPAL)). Potential participants were screened over the phone and again in person. Exclusionary criteria included: (1) Alzheimer’s, Parkinson’s or other condition directly impacting the brain; (2) serious psychiatric conditions (e.g., schizophrenia, major depression, bipolar disorder), (3) uncontrolled hypertension (blood pressure >150/95 mm Hg), heart failure, or history of acute myocardial infarction; (4) systemic rheumatic disorders (i.e., rheumatoid arthritis, systemic lupus erythematosus, fibromyalgia); (5) chronic opioid use; (6) magnetic resonance imaging contraindications; (7) excessive anxiety regarding protocol procedures; (8) hospitalization within the preceding year for psychiatric illness; (9) HIV or AIDS; and (10) cognitive impairment (Modified Mini-Mental State Examination (3MS) score ≤ 77). 22 Participants were recruited through posted fliers, newspaper ads, and word of mouth referrals. As the NEPAL study aims to recruit older individuals with and without chronic pain representative of the aging population, individuals were not specifically recruited for pain. All procedures were reviewed and approved by the University of Florida’s Institutional Review Board and all participants provided verbal and written informed consent. For the current study, data presented are from three separate laboratory visits: (1) a health assessment session (i.e., demographic, general health, pain, and psychological information), (2) a quantitative sensory testing (QST) session and (3) a cognitive function session. A blood draw was performed during a separate neuroimaging session part of the NEPAL study, but neuroimaging data is not included in the present investigation and has been recently reported elsewhere. 23
Health assessment session
Upon verbal and written informed consent, participants completed questionnaires, which included general health and demographic information including all medications taken. Similar to our previous studies in older individuals, a trained research coordinator assessed prior and current health, medical and pain history, including detailed information regarding smoking, drinking and exercise habits.
23
The following instruments were also administered during this session to assess self-reported pain and psychological function:
Clinical Pain: Participants completed a standardized pain history interview regarding the presence of pain across several body regions (i.e., head/face, neck, shoulders, arms, hands, chest, stomach, upper and lower back, leg, knees, and feet) using a validated body manikin.23–25 Participants were asked to choose the location of their worst pain and asked about its duration, frequency during the past week, intensity on average, and how hard it was to deal with their worst pain. As joint pain is the predominant pain condition in our older participants, the Western Ontario and McMaster Universities Osteoarthritis Index was also administered to assess global joint pain. Finally, all participants were queried regarding current medications taken. Psychological and Emotional Function: The 20-item Center for Epidemiologic Studies Depression Scale (CES-D) questionnaire was used to measure the frequency of depressive symptoms during the past week on a four-point Likert-type scale.
26
The Positive and Negative Affect Scale (PANAS) was also administered consisting of 20 items rated on a five-point scale.27,28 We asked the participants to report how they generally feel with high scores on positive affect reflecting enthusiasm, energy, and alertness, while higher scores on negative affect reflect distress and aversive mood states. The Ten-Item Personality Measure (TIPI) is a brief 10-item measure of the Big Five (or Five-Factor Model) personality dimensions: Extraversion (E), Agreeableness (A), Conscientiousness (C), Emotional Stability (ES) and Openness to Experience (O). Participants rate themselves on a seven-point scale ranging from 1-disagree strongly to 7-agree strongly.
29
Somatosensory function session
QST was used to assess somatosensory function, similar to the methodology previously reported by our group in older individuals.
30
All QST procedures were performed in a quiet room with an approximate temperature between 21°C and 23°C. All subjects were seated in a comfortable chair with armrests and a semi-reclining back. Standardized testing was performed at the thenar eminence and on the first metatarsal head on all participants. An overview of the testing procedures was explained to the subject and for each different modality, specific instructions were delivered immediately before beginning the test. Measurement of a particular type of threshold was first demonstrated, and at least one practice trial was conducted to ensure that subjects understood the testing procedures. Vibratory and thermal detection and pain threshold measurements were obtained with the TSA-II Neurosensory Analyzer and accompanying software (Medoc Ltd., Ramat Yishai, Israel). The method of limits was used to obtain all detection and pain thresholds.
Vibration: The handheld VSA-3000 circular probe (contact tip = 1.22 cm2) of the Medoc system was used to measure vibratory thresholds for a 100 Hz stimulus frequency. Subjects were asked to indicate as soon as they felt the vibratory sensation. Three trials, separated by ∼10 s each, began at 0 μm at a rate of 0.5 μm/s and increased until the subject indicated that the stimulus was felt or until the maximum amplitude of 130 μm was reached. The mean value across the three trials was calculated as the vibratory detection threshold for each site. Thermal Detection: A 30 × 30 mm thermode connected to the TSA-II Neurosensory Analyzer was used to deliver thermal stimuli. Each trial began at 32°C and the temperature decreased (for cool) or increased (for warm) at a rate of 1°C/s until the subject perceived the stimulus or until the stimulus reached the cutoff value (0°C for cool and 50°C for warm). Each trial was separated by ∼10 s. The average of threshold temperatures across four trials was calculated as detection threshold for each modality and test site. Thermal Pain: Subjects were instructed to indicate as soon as the sensation changed from “just being cold to being painfully cold” or from “just being hot to being painfully hot.” Each trial began at 32°C and was either decreased (for cold pain) or increased (for heat pain) at a rate of 1°C/s until pain threshold was reached or the cutoff value was reached (0°C for cold pain and 50°C for heat pain). Each trial was separated by at least 20 s. The mean across three trials at each test site was calculated as the pain detection threshold. Pressure Pain: Pressure pain thresholds were assessed on the quadriceps and trapezius muscles with the order of testing counterbalanced. For all test sites, a handheld digital pressure algometer (AlgoMed; Medoc) was applied at a constant rate of 30 kPa/s. Participants were instructed to press a button when the pressure sensation “first became painful”. Application was repeated three times on each site to create a mean pressure pain threshold for that site. The maximum application pressure was 1000 kPa based on safety considerations. For individuals reaching maximum pressure levels without reporting pain, a value of 1000 was assigned. Conditioned Pain Modulation (CPM) Procedure: A subset of participants completed a CPM paradigm as recommended by Yarnitsky and colleagues.
31
For the test stimulus, heat was applied to the thenar eminence increasing at a rate of 1°C/s and was discontinued by the subject at pain-40 (pain level of 40/100). The temperature required to produce pain-40 was recorded. The conditioning stimulus (CS) was cold-water immersion of the contralateral hand for 1 min, which was reported by most participants as mild to moderately painful. The test stimulus was presented immediately after the CS. A pain inhibition score was calculated as a first minus last temperature divided by first temperature (X 100) calculation whereby inhibition was denoted by a negative value, and pain facilitation by a positive value as recommended by expert consensus.
31
Cognitive function session
The National Institutes of Health (NIH) Toolbox cognitive domain measure was used which covered sub-domains of fluid and crystallized cognition. The NIH toolbox cognitive battery has been shown to have high test-retest reliability, as well as high convergent validity with “gold standard” measures of crystalized and fluid cognition. 32
The Dimensional Change Card Sort (set-shifting component of executive function), Flanker Inhibitory Control and Attention (ability to inhibit visual attention to irrelevant task dimensions), Picture Sequence Memory (episodic memory), List Sorting (working memory), and Pattern Comparison (processing speed).
The the Picture Vocabulary Test (language) and the Oral Reading Recognition Test (reading).
Sample collection and analyses
Human blood samples were collected into 15 ml conical tubes treated with anticoagulant ethylenediaminetetraacetic acid (EDTA). The samples were stored at −80°C until processing. To isolate DNA, the frozen blood samples were thawed at 37°C to dissolve homogeneously. 500 µl of blood was lysed in RBC lysis buffer and centrifuged at 6000 r/min for 5 min at room temperature. The supernatant was discarded and sodium EDTA solution was added to the pellet and vortex gently to remove RBC clumps. Homogenate was incubated at 50°C to 55°C with Proteinase K and sodium dodecyl sulfate solution. Following incubation, equal volume of phenol was added, mixed, and centrifuged at 10,000 r/min for 10 min. Supernatant was transferred in a fresh tube and equal volume of phenol-chloroform-isoamyl alcohol was added, mixed and centrifuged at the same revolutions per minute. Supernatant was transferred to a fresh tube and equal volume of chloroform-isoamyl alcohol was added followed by centrifugation at same revolutions per minute conditions. Supernatant was transferred in a fresh tube and 1/10th volume of 3 M sodium acetate along with 2 volumes of absolute alcohol was added. The precipitated DNA was washed with 70% ethanol by centrifugation at 10,000 r/min for 5 min. The pellet was air dried and dissolved in Tris-EDTA buffer. The dissolved DNA was qubit quantified and visualized on agarose gel for quality assessment. Sodium Bisulfite conversion and EPIC methylation array was performed by Moffitt Cancer Center, Molecular Genomics Core 3011 Holly Dr. Tampa, FL 33612.
DNA methylation age calculation
The raw data generated by illumina EPIC array (.idat files) were used to calculate DNA Methylation Age with an online calculator (https://dnamage.genetics.ucla.edu/home). The normalized beta values were obtained using ChAMP (Chip Analysis Methylation Pipeline for Illumina HumanMethylation EPIC) protocol. 33 These normalized beta values were extracted as .csv file to input dataset containing all the CpGs required for the online calculator. The updated input dataset file and sample annotation file were uploaded in the online calculator as required to get the output file with processed DNA methylation age.
Experimental design and statistical analysis
Data were entered by one experimenter and checked for accuracy by a blinded experimenter. QST data were z-transformed for each modality at each test site and then combined for analysis due to the multicollinearity within modalities and across body sites. Thus, standardized Z-scores were created for vibratory detection, thermal detection, heat, cold and pressure pain thresholds that were used for further statistical analysis. The combination of these modalities is appropriate based on the physiological properties of sensory channels. 34
We used t-test to compare groups with respect to continuous/discrete ordinal variables and χ2 analyses to assess associations with nominal variables. Assumptions underlying each statistical test were tested. One-way analysis of covariance (ANCOVA) procedures were conducted with Pain Group as a between subject factor while controlling for chronological age, sex and race. As the current study was specifically aimed at comparing the epigenetic clock between individuals with and without chronic pain, only the main effect of Pain Group in the main ANCOVA model was of interest with a p < 0.05 considered statistically significant. Partial eta squared was reported to assess the magnitude of the group differences, where small, medium and large effect sizes are represented by 0.01, 0.06 and 0.14, 35 respectively. We employed partial correlation analyses to account for the previous reported effects of chronological age, sex and race/ethnicity on epigenetic aging 36 to assess associations between epigenetic age with pain, psychological and QST variables. Correlation effect sizes of 0.1, 0.3 and 0.5 are reflective of small, medium and large effect magnitudes, respectively. 37 For the additional exploratory analyses examining associations between epigenetic age and clinical pain characteristics, psychological, QST and cognitive variables, we report both uncorrected (i.e., p = uncorrected probability) as well as corrected probability values (i.e., corrected p = corrected probability) accounting for multiple comparisons applying the Holm-Bonferroni method 38 using the calculator by Gaetano. 39 Data analyses were performed using IBM SPSS 25 software.
Results
Demographics
Of the forty-seven older adults ranging in age from 60 to 83 years of age (mean age = 70.9 ± 6.0, 74.5% female), 29 had whole blood samples and are the focus of the present investigation. Figure 1 shows the flow of recruited and enrolled participants in the NEPAL study and the participants included in the present investigation. Details on the sample size for each statistical analysis is also included in Figure 1 and data was missing completely at random and were addressed by listwise deletion. There were no significant differences between the larger sample and the included participants who underwent a blood draw with regards to several demographic variables. The majority of this sample (n = 20, 70%) reported pain on most days during the past three months (i.e., chronic pain) and at multiple body sites. There were no significant differences between the groups with regards to clinical and demographic characteristics (Table 1) except individuals reporting chronic pain had a significantly lower score on the 3MS compared to those without chronic pain (p = 0.003).
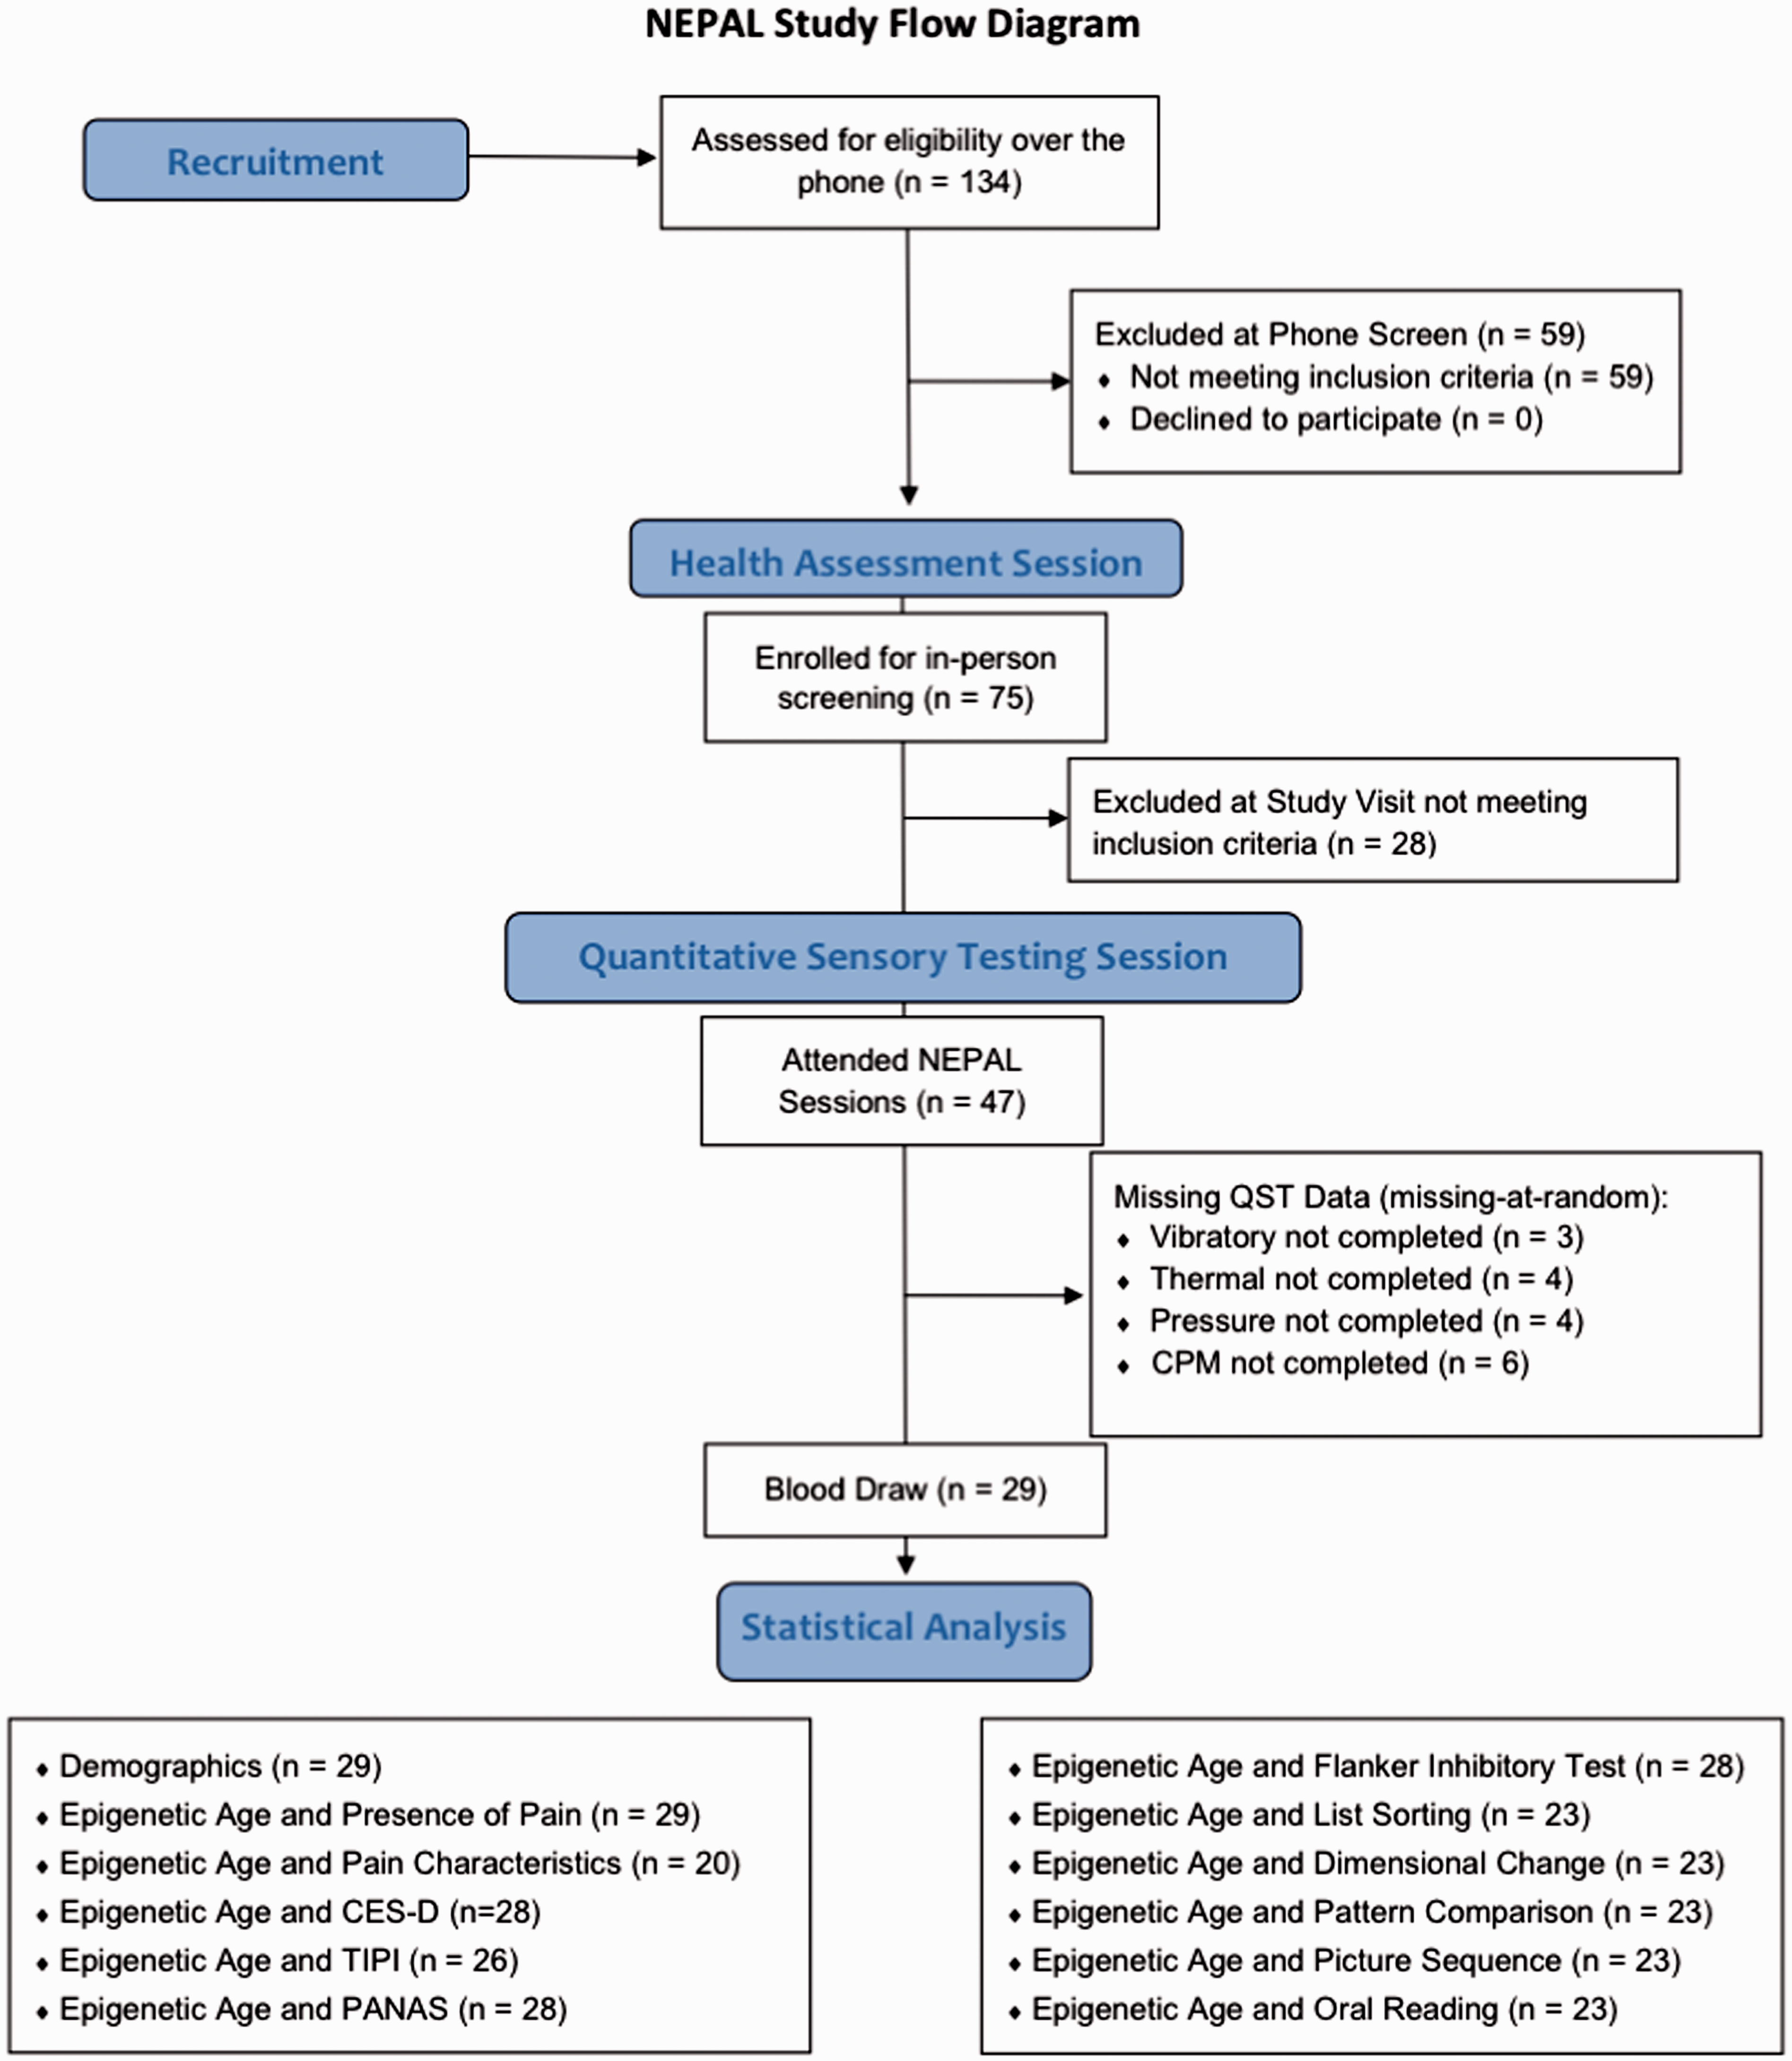
Study screening and enrollment for the NEPAL study and included participants. NEPAL: Neuromodulatory Examination of Pain and Mobility Across the Lifespan; QST: quantitative sensory testing; CES-D: Center for Epidemiologic Studies Depression Scale; TIPI: The Ten-Item Personality Measure; PANAS: Positive and Negative Affect Scale.
Differences in demographic and clinical characteristics between the groups.

CES-D: Center for Epidemiologic Studies Depression Scale; BMI: body mass index; 3MS: Modified Mini-Mental State Examination.
aχ2 was performed.Note: Bold values signifies Probability less than 0.05.
Epigenetic age difference and self-reported pain
A one-way ANCOVA was used to compare epigenetic age difference between pain groups controlling for chronological age, sex and race. Levene’s test was carried out and the assumptions met. Consistent with our proposed study hypothesis, there was a significant difference in epigenetic age difference between older adults who reported chronic pain (−0.9 ± 0.8) versus those that did not (−4.3 ± 1.3, F (1,24) = 4.7, p = 0.040, partial eta squared = 0.16, ANCOVA, see Figure 2). There was no significant sex (F (1,24) = 0.19, p = 0.664, partial eta squared = 0.008, ANCOVA) or race (F (1,24) = 2.2, p = 0.147, partial eta squared = 0.09, ANCOVA) difference in epigenetic age. Partial correlations accounting for age, sex and race suggested that older epigenetic age was also associated with greater overall global joint pain during daily activities (r = 0.494, p = 0.010, corrected p = 0.040, Figure 3(a)) and greater number of anatomical pain sites (r = 0.741, p < 0.001, corrected p < 0.001, Figure 3(b)), but not average pain intensity (r = 0.067, p = 0.805, corrected p = 1.000), frequency (r = 0.169, p = 0.532, corrected p = 1.000), or duration (r = −0.250, p = 0.350, corrected p = 1.000) of their self-reported worst pain.

Predicted epigenetic age difference (predicted methylation age—chronological age) across the groups (n = 29) adjusted for chronological age, sex, and race.
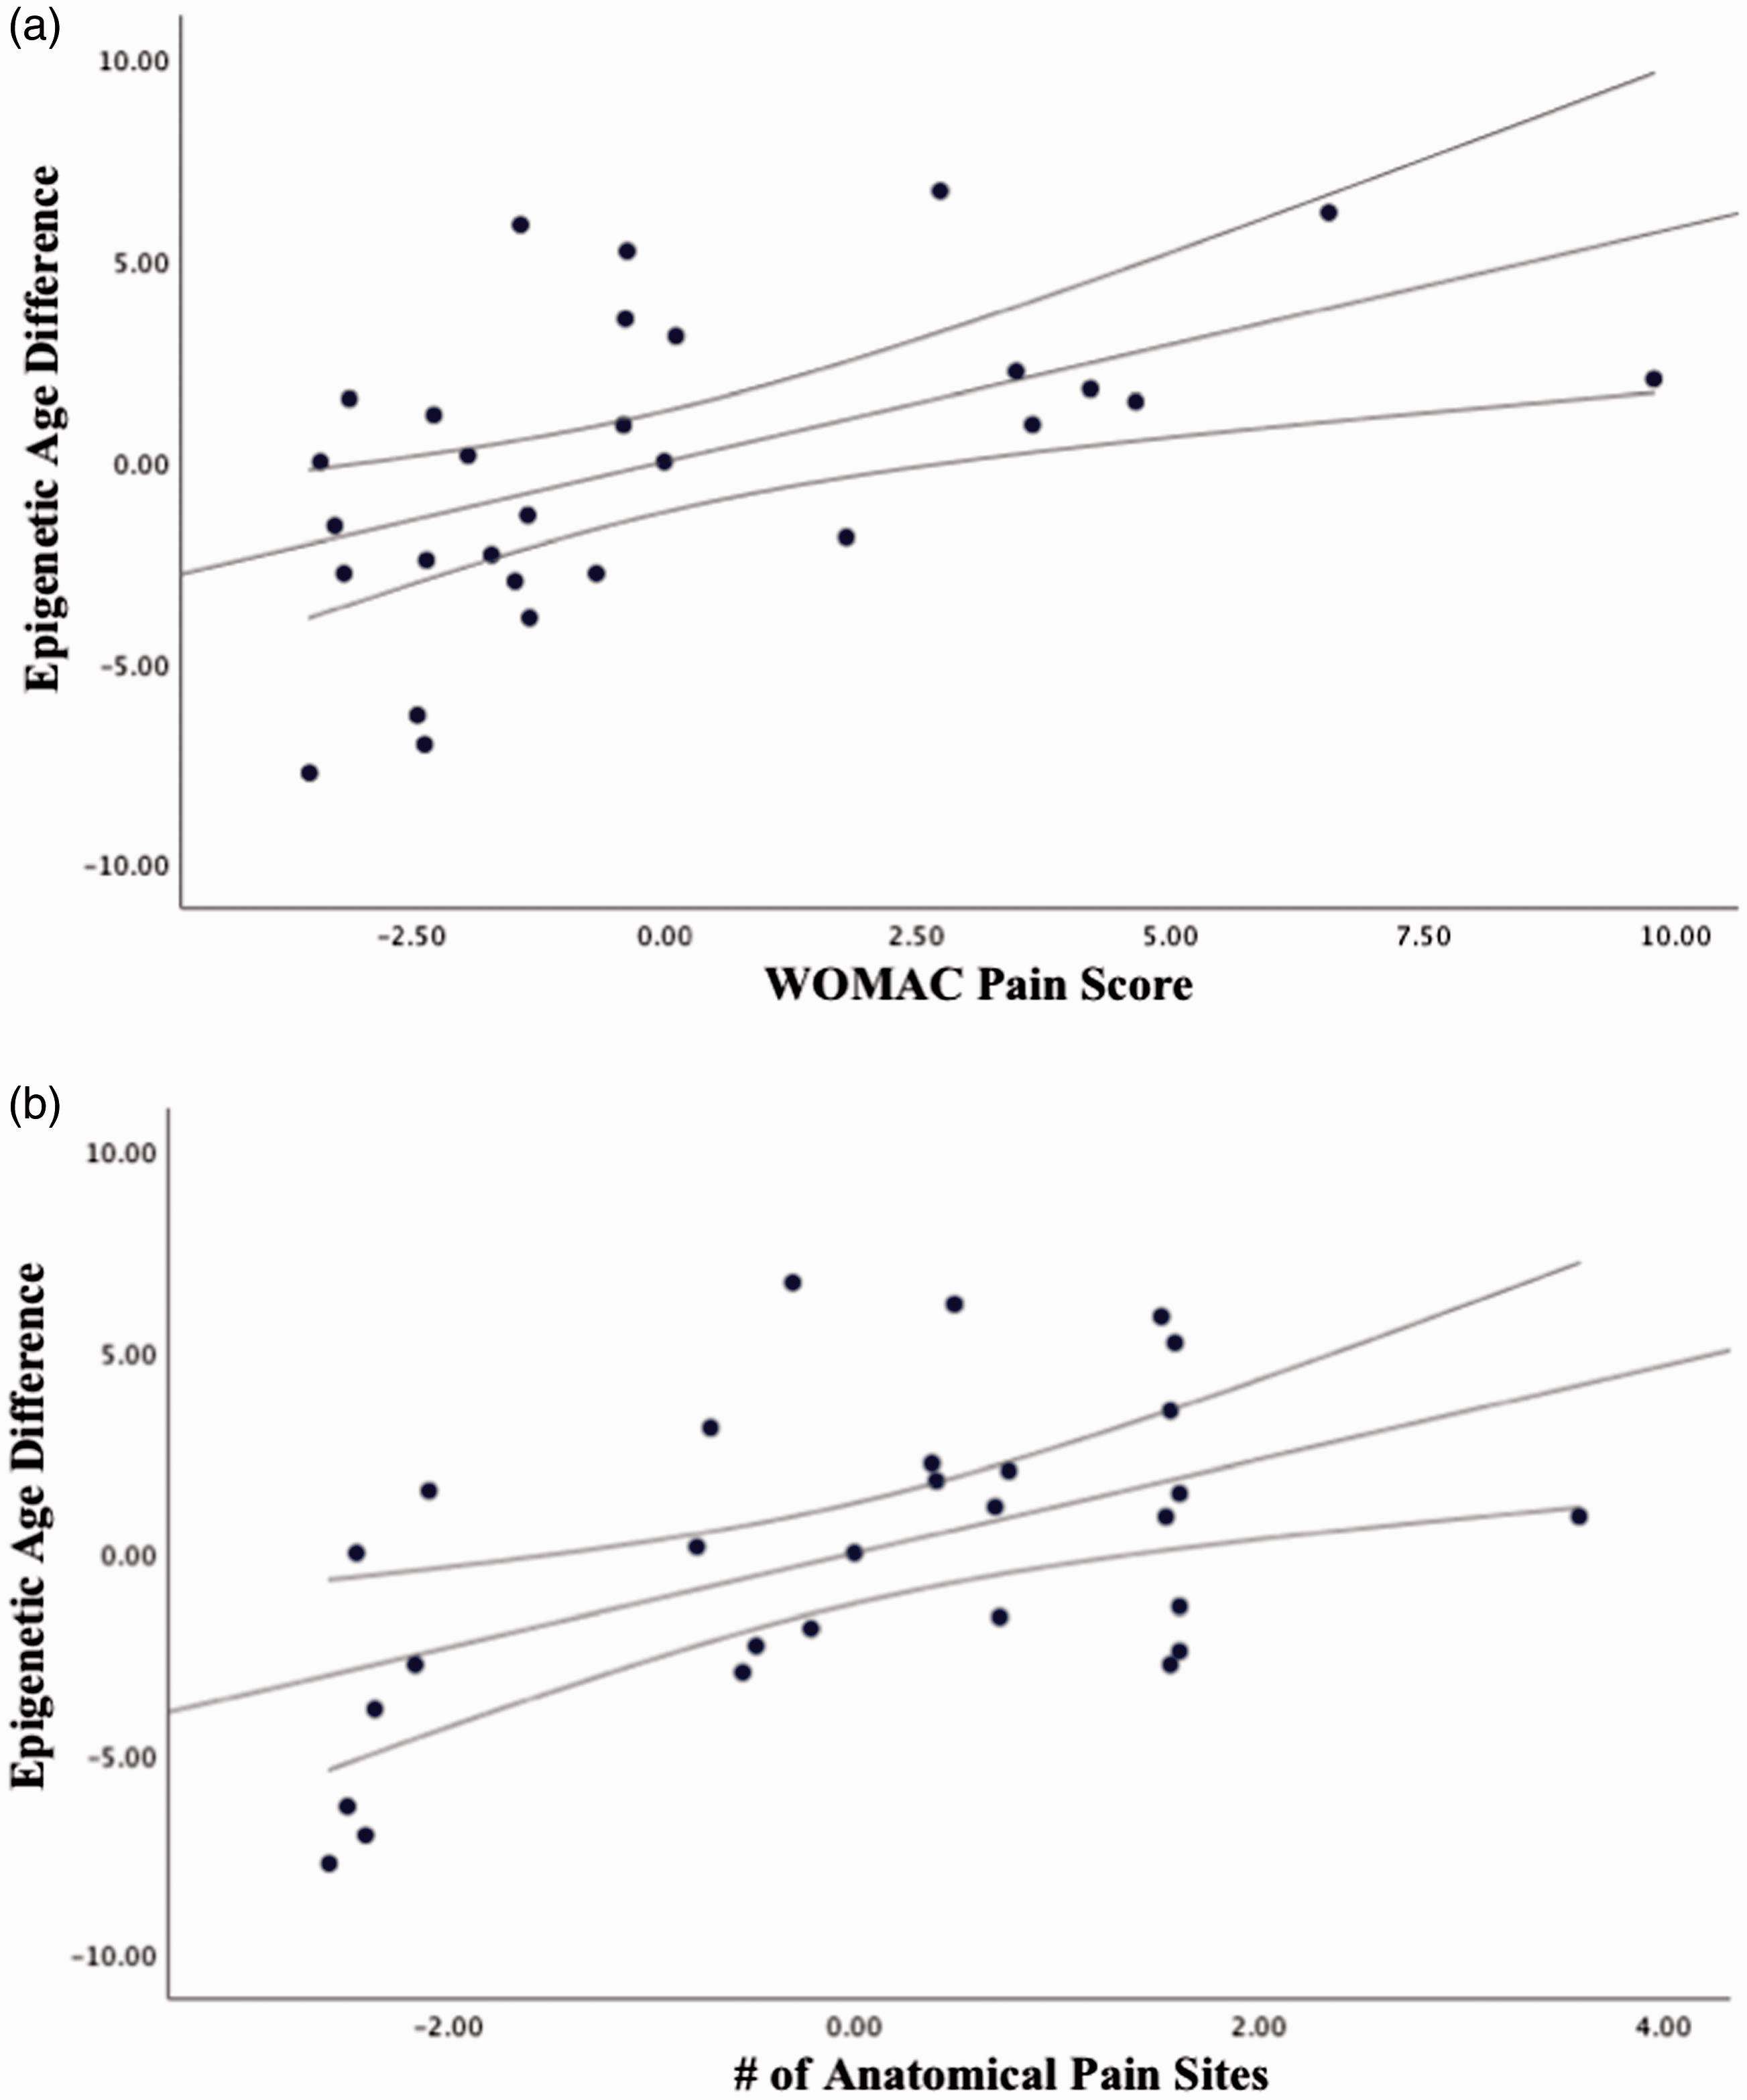
Partial correlations between pain characteristics and epigenetic age difference accounting for age, sex, and race (n = 20, only pain). WOMAC: Western Ontario and McMaster Universities Osteoarthritis.
Epigenetic age difference and psychological function
Partial correlations accounting for age, sex and race suggested that a younger epigenetic age was significantly associated with greater TIPI-Emotional Stability (r = −0.461, p = 0.027, corrected p = 0.189, Figure 4(a)), TIPI-Conscientiousness (r = −0.549, p = 0.007, corrected p = 0.056, Figure 4(b)) and lower TIPI-Extraversion (r = 0.414, p = 0.049, corrected p = 0.294, Figure 4(c)). Epigenetic age was not correlated with CES-D (r = 0.088, p = 0.677, corrected p = 1.000), PANAS-Positive Affect (r = 0.160, p = 0.446, corrected p = 1.000), PANAS-Negative Affect (r = 0.122, p = 0.561, corrected p = 1.000), TIPI-Agreeableness (r = −0.408, p = 0.053, corrected p = 0.294) or TIPI-Openness to Experiences (r = 0.205 p = 0.347, corrected p = 1.000).

Partial correlations between psychological function and epigenetic age difference accounting for age, sex, and race. TIPI: The Ten-Item Personality Measure.
Epigenetic age difference and somatosensory function
Partial correlations accounting for age, sex and race suggested that lower heat pain thresholds (r = −0.478, p = 0.028, corrected p = 0.196, Figure 5(a)), and lower pressure pain thresholds at the trapezius (r = −0.571, p = 0.006, corrected p = 0.056, Figure 5(b)) were significantly associated with greater epigenetic age (i.e., older epigenome). Although there was an association between epigenetic age and cold pain thresholds of a medium effect size (r = 0.345), this was not statistically significant (p = 0.126, corrected p = 0.630). Similarly, lower vibratory detection thresholds (r = 0.490, p = 0.021, corrected p = 0.168, Figure 5(c)) were also significantly associated with lower epigenetic age (i.e., younger epigenome). There were no associations between epigenetic age and cool detection thresholds (r = 0.091, p = 0.696, corrected p = 1.000), warm detection thresholds (r = 0.004, p = 0.985, corrected p = 1.000) or pressure pain thresholds at the quadriceps (r = −0.165, p = 0.462, corrected p = 1.000). There were no significant correlations between epigenetic age and CPM scores (r = −0.097, p = 0.651, corrected p = 1.000).

Partial correlations between pain thresholds and epigenetic age difference accounting for age, sex, and race.
Epigenetic age difference and cognitive function
Partial correlations accounting for age, sex and race suggested that older epigenetic was associated with lower fluid cognition (r = −0.711, p = 0.001, corrected p = 0.006, Figure 6). Specifically, lower Picture Sequence Memory scores (r = −0.698, p = 0.001, corrected p = 0.006) and List Sorting Working Memory scores (r = −0.760, p < 0.001, corrected p = 0.000) were significantly associated with greater epigenetic age (i.e., older epigenome). There were no significant associations between epigenetic age and Dimensional Change Card Sort (r = −0.29, p = 0.211, corrected p = 0.796), Pattern Comparison (r = −0.178, p = 0.452, corrected p = 0.904) or Flanker Inhibitory Control and Attention (r = −0.171, p = 0.484, corrected p = 0.904). The Picture Vocabulary Test was not administered to all the participants due to technical difficulties with the computer (Data Missing Completely At Random). Thus, only the Oral Reading Recognition test was used as a measure of crystallized cognition. Epigenetic age was not statistically significantly associated with Oral Reading Recognition test scores (r = −0.290, p = 0.199, corrected p = 0.796). Table 2 summarizes all study findings including the probability values before and after correcting for multiple comparisons.
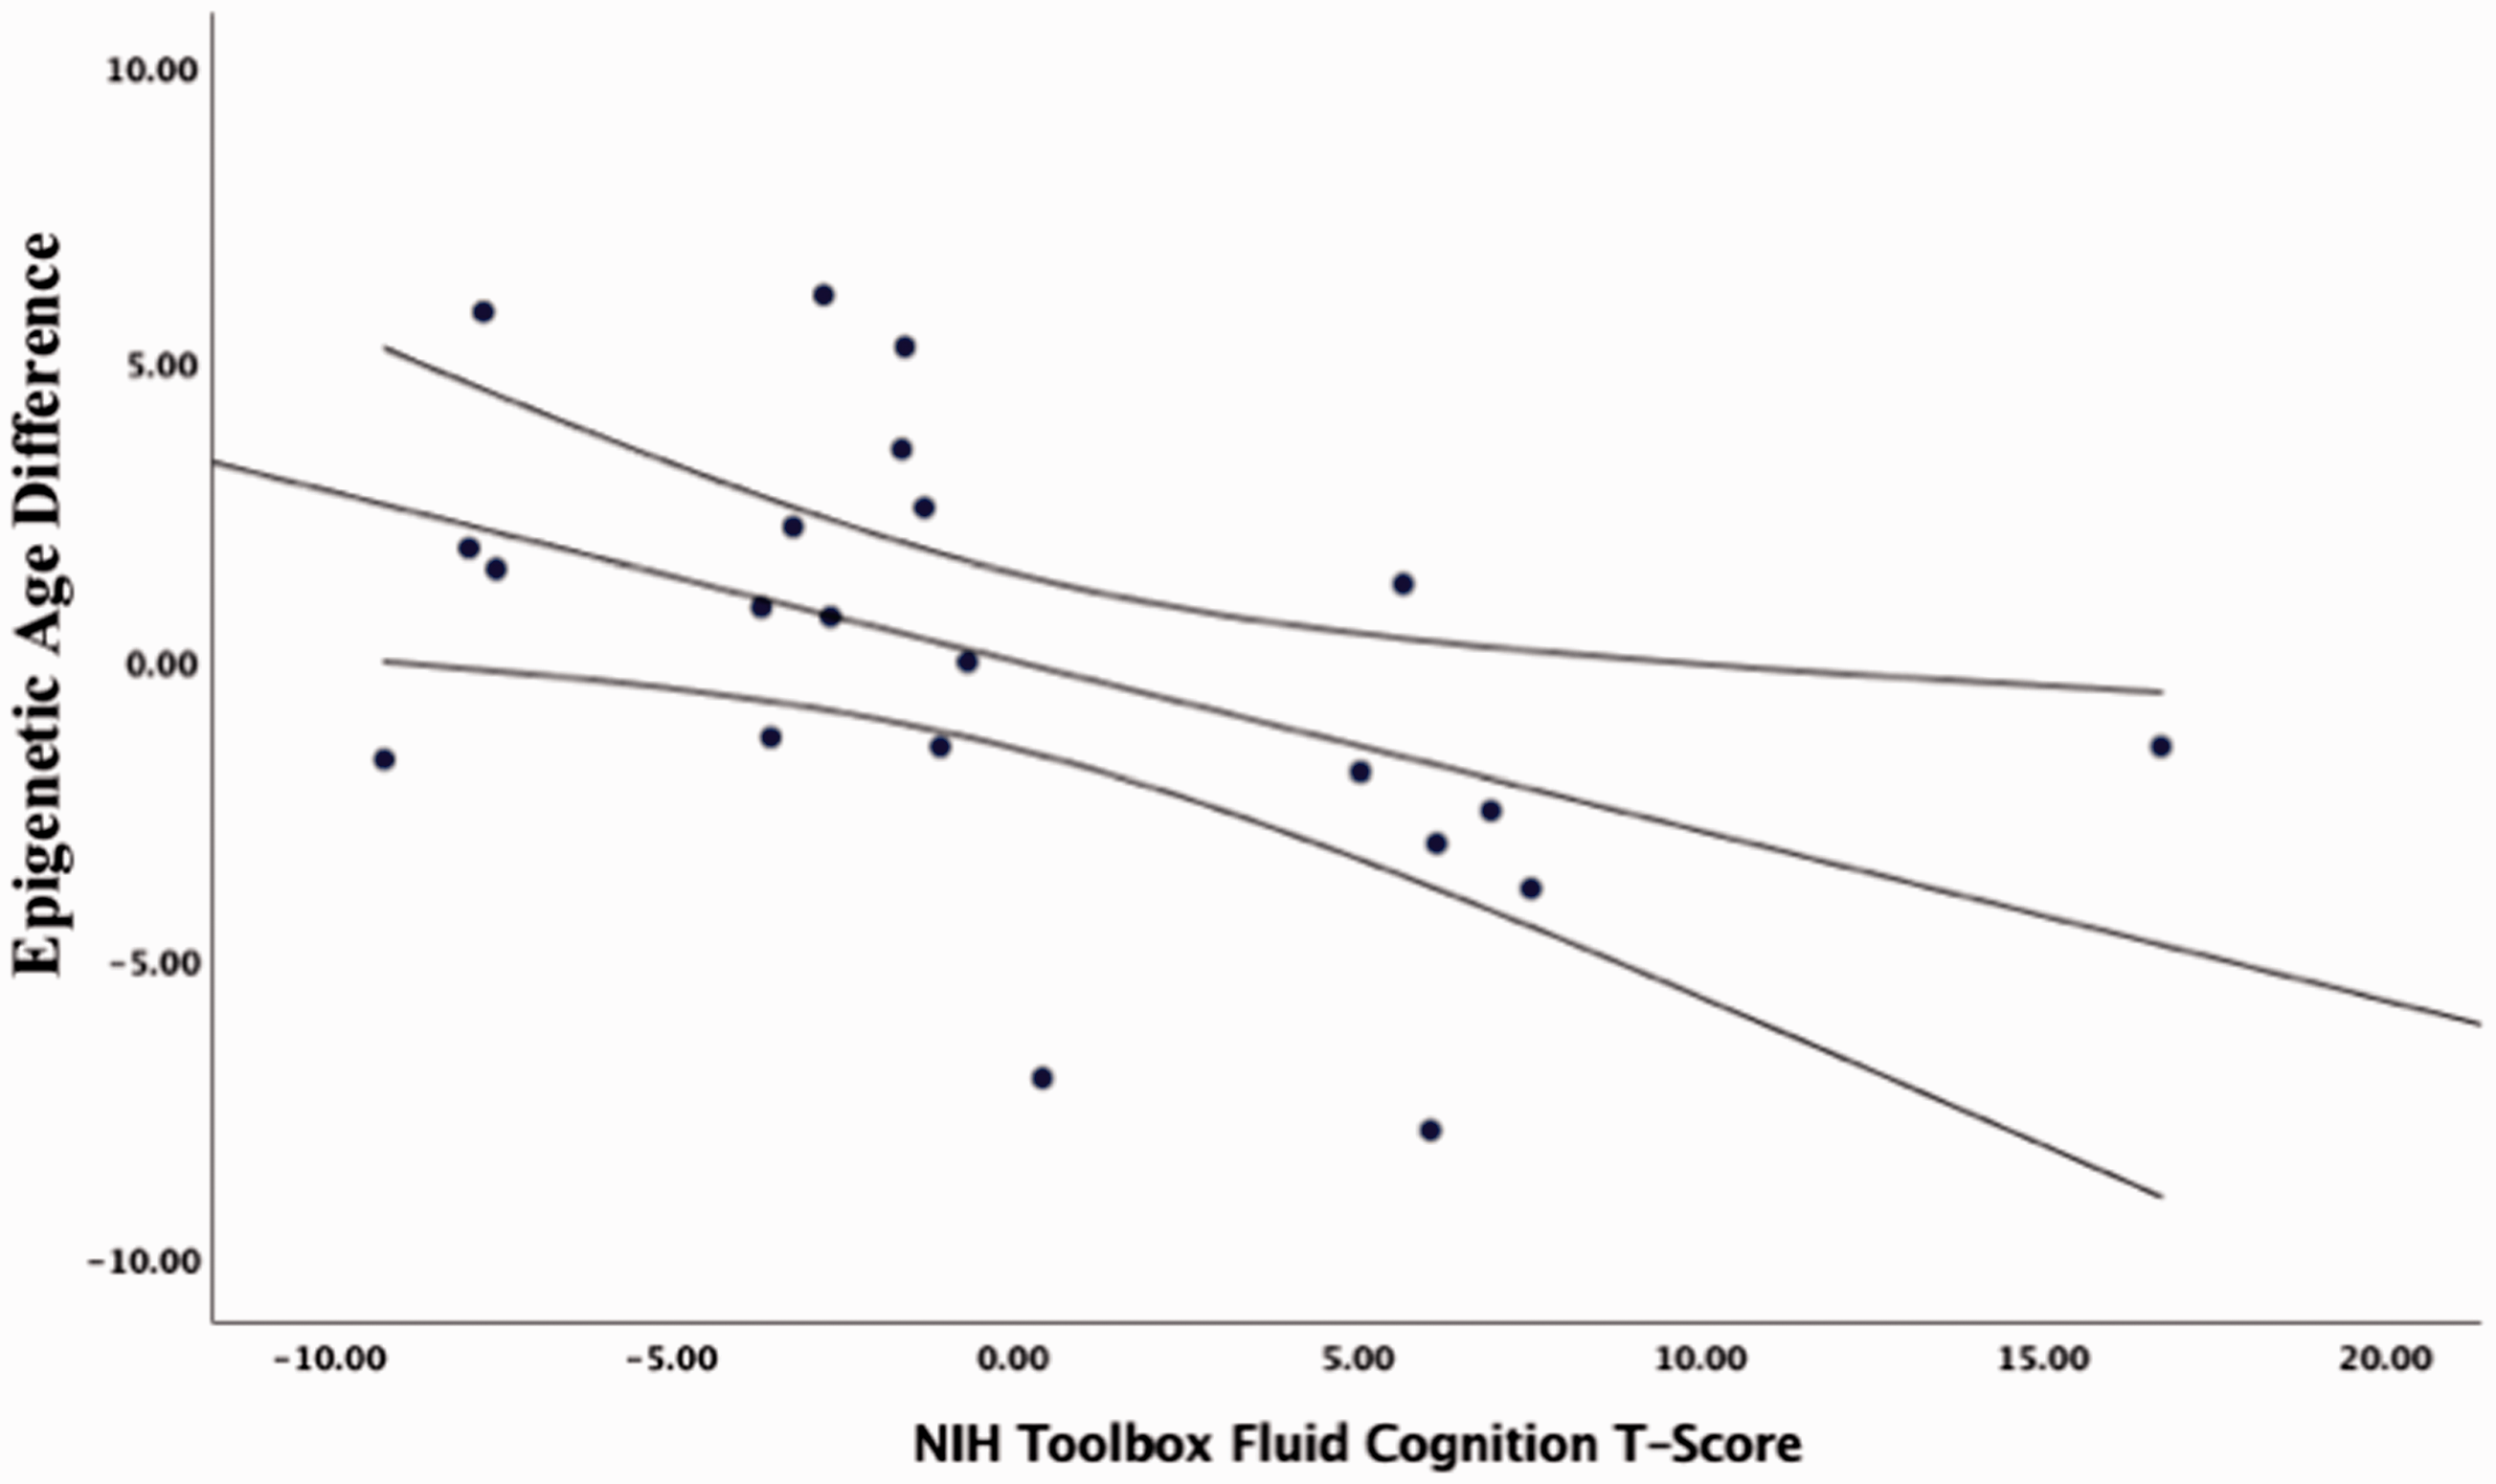
Partial correlations between fluid cognitive function and epigenetic age difference accounting for age, sex, and race.
Summary of findings including the probability values before and after correcting for multiple comparisons.

WOMAC: Western Ontario and McMaster Universities Osteoarthritis; TIPI: The Ten-Item Personality Measure; PANAS: Positive and Negative Affect Scale; CPM: conditioned pain modulationNote: Bold values signifies Probability less than 0.05.
Discussion
We conducted the first preliminary investigation of how chronic pain relates to the epigenetic clock, a biomarker of biological aging in healthy community-dwelling older adults. Several important contributions emerged from this investigation. First, older individuals
The present study sample was composed of older individuals that were healthy, highly functioning older adults with no significant age-related comorbidities. This was supported by the sample’s overall “younger” epigenome, approximately two years youngers relative to their chronological age (mean ± SD = −1.97 ± 4.9). However, individuals
Understanding the inter-individual variability of the complex pain experience requires examining multiple processes including somatosensory and psychosocial functioning. In our sample, there were no associations between epigenetic aging with depressive symptomatology, despite a previous study where accelerated epigenetic aging was associated with major depression. 44 However, this result is not surprising given that our sample reported very low, if any, depressive symptomatology. Epigenetic aging was also associated with various personality traits in our participants. This is consistent with a previous study where individuals with higher neuroticism scores (or lower emotional stability) had higher levels of brain-derived neurotrophic factor gene methylation compared with those with lower neuroticism (or higher emotional stability) scores. 45 More studies are needed to examine the mechanisms linking chronic pain, epigenetics and characteristics such as personality traits in aging.
An older epigenome was also associated with greater experimental pain sensitivity in response to thermal and mechanical stimuli. This is consistent with a recent study where epigenetic divergence in the Transient Receptor Potential Cation channel subfamily A member 1 (TRPA1) promoter correlated with experimental pressure pain thresholds in healthy individuals. 46 Overall, greater experimental pain sensitivity using QST is thought to predict future acute and chronic pain states as well as differential responses to pain treatments. 47 Future studies are needed to elucidate whether combining QST with biological aging biomarkers such as the epigenetic clock, may enhance the characterization of older individuals with chronic pain to augment therapeutic responses.
Finally, an older epigenome was associated with lower fluid cognition, but only specifically with the working and episodic memory domains. This is highly consistent with a longitudinal study where a younger epigenome was observed for individuals with maintained memory functions compared with those with average or accelerated memory decline. 48 Moreover, epigenetic age at follow-up, but not chronological age, was a significant predictor of dementia. 48 Specifically, it has been speculated that DNA methylation in neurons might be involved in memory encoding. 49 Thus, DNA methylation may be a mechanism linking age-related learning and memory decline with age-related genome-wide DNA methylation changes in the brain. 49 Given the lack of studies focused on epigenetic mechanisms underlying pain and memory associations in aging, future studies are needed to further elucidate these relationships. Mechanistic information on epigenetic mechanisms may provide targeted avenues for improved brain health and/or pain treatments.
Our study has several limitations. Our sample size was very small where only 6 out of 29 participants were men and only 1 participant was non-Caucasian. However, the NEPAL participants are well-characterized across multiple domains relevant to the study of pain and aging within a biopsychosocial context. 50 In addition, our groups were very similar regarding age-related health comorbidities, which can make it easier to compare and isolate pain-related differences distinct from aging processes. Specifically, the groups did not differ with regards to common age-related conditions such as diabetes (p = 0.246), hypertension (p = 0.549), thyroid (p = 0.864), lung (p = 0.107), kidney (p = 0.486), liver (p = 0.486) or history of cancer (p = 0.811). Therefore, the NEPAL participants were highly functioning community-dwelling older individuals, who were very healthy relative to their chronological age, with those reporting chronic pain having mainly chronic musculoskeletal pain in the joints. All participants were cognitively normal, free from overt disability and neurological disorders. Thus, it is possible that the true association between pain and epigenetic aging was underestimated when compared to the rest of the older adult population who experience multiple age-related comorbidities and other pain types simultaneously. Second, the current analysis was cross-sectional; therefore, we cannot determine whether a specific epigenetic age preceded or was subsequent to pain. From the present findings, directionality or causality cannot be inferred as it is equally possible that epigenetic aging plays a central role for the sensitivity and resilience to many symptoms and disorders associated with biological aging including chronic pain. Future studies are needed using longitudinal data to determine trajectories of epigenetic aging and how they relate to pain and future health outcomes. Third, this study measured universal epigenetic age, and did not distinguish between intrinsic (i.e., cell-based) and extrinsic (i.e., immunosenescence) epigenetic aging. Measuring these particular components would give us better insight into the mechanistic relationship between epigenetic aging and the experience of pain. Fourth, many of our study findings became non-statistically significant after correcting for multiple comparisons. However, given the high correlation among variables, we would expect the multiple comparison procedure is over-conservative. Therefore, larger studies are needed to replicate our findings and determine whether our reported associations were due to chance alone. Finally, emerging evidence suggests that the accumulation of life stress is associated with epigenetic aging,51–53 and given that chronic pain may be a stressor in certain individuals, stress may be a potential mechanism linking chronic pain with epigenetic aging. However, in the present sample we did not collect stress-related measures or biomarkers. Thus, future studies are needed to examine these relationships.
In conclusion, we present preliminary evidence that an epigenetic aging biomarker previously associated with greater risk of all-cause mortality during aging, is similarly associated with the presence and severity of the complex pain experience in older individuals. The epigenetic clock could be a valuable marker of general health, which may help identify at an earlier time those individuals at greatest risk of age-related deterioration and death. Similarly, future investigations are needed to confirm our findings in larger, representative sample of older individuals. Further identification of epigenetic alterations within an individual may provide additional mechanistic information to guide treatment targets as well as potential treatment outcomes.
Footnotes
Acknowledgments
The authors thank the volunteers for their participation and the NEPAL study team (Paige Lysne, Lorraine Hoyos, Darlin Ramirez, Brandon Apagueno and Rachna Sannegowda).
Author Contributions
All authors made a substantial contribution to the concept and design, acquisition of data, or analysis and interpretation of data; drafted the article or revised it critically for important intellectual content; approved the version to be published.
Declaration of Conflicting Interests
The author(s) declared no potential conflicts of interest with respect to the research, authorship, and/or publication of this article.
Funding
The author(s) disclosed receipt of the following financial support for the research, authorship, and/or publication of this article: This work was supported by the National Institutes of Health (NIA K01AG048259/R01AG059809 to YC-A, NIA R01AG037984, NIA R37AG036800, NIA R01AG052258, NIA R01AG049711 to TCF), the Center for Cognitive Aging & Memory, the McKnight Brain Research Foundation for Age-Related Memory Loss.