
Abstract
This article is focused on the search for potential collision of a moving object (as a mobile robot is) with the environment. Application of the proposed and presented method requires existence of the three-dimensional model of the environmental space. In this case, the models are generated automatically with the help of mobile measurement platform developed by authors and are available to other applications. Models of moving objects are loaded by the proposed application from external files. The method is based on data fusion, using data from a laser scanner, global positioning system, and inertial navigation system; however, it can also be used for data obtained by other ways. Its correctness was experimentally proved by several experimental tests. Output is in the form of calculated coordinates of the point in which a moving object would potentially collide with the environment if no avoiding action is taken. Such an object may represent an oversized load transferred by a truck, train, ship, the transport means itself or even a person.
Introduction
Requirements for safe and trouble-free transfer of shipments to the place of delivery are permanently increasing. One of fields where this trend is notably visible is transport of oversized loads since the transfer process is accompanied by higher risk of damaging either the load itself or a part of the surrounding environment. Checking for transport possibilities along a certain route may be performed by different ways, from manual measurements to modern methods based on laser technologies and/or data fusion from laser and other sensors.
Laser sensing of surrounding environments is applied in various industries for quite a long time and many research teams work over processing of data from such kinds of sensors. A big group of sensors utilized for creation of three-dimensional (3-D) environment models consists of terrestrial and 3-D scanners, for example, Liu et al. 1 and Nair et al. 2 use the 3-D scanner for design of virtual models of historical objects. Once the virtual models of environment are created, they generate surfaces for individual measured objects. How to do that is discussed, for example, in the study by Ambika Devi. 3 Laser scanner–based measurements are utilized in many industries. Zhu et al. 4 and Yuan et al. 5 measure multiple parameters of fuel tanks. In many cases, when 3-D scanners cannot be used they may be substituted with two-dimensional (2-D) scanners or some other methods based on laser beam sensing can be used. 6,7
To create a 3-D model of large-scale outdoor areas, the calculation of points cloud must also include data on a measurement position. Problems of obtaining the accurate position from the global positioning system (GPS) and inertial navigation system (INS) are solved by Gaina and Gaina, 8 Chandra and Rajabi, 9 Jiang et al., 10 Huang et al., 11 Wu et al., 12 and Gu et al. 13 To increase the accuracy of such approaches, fusion of data from multiple sensors is used. 14,15
The youngest method for creation of the 3-D model is using the Colored Image with Depth - method for computer vision (RGB-D) method. This method uses the depth map. 16
Nowadays, there are two branches of research. The first one is dedicated to autonomous mobile robots such as service robots, automated lawn mowers, vacuum cleaners, and so on. The second branch is dedicated to oversize transport loading gauge. Let us focus at these two areas of research.
The mobile robot usually senses its environment and tries to create a model of the surrounding environment in its memory. This model contains the current position of the obstacles and options of the movement to various directions. The position relative to the obstacles is sensed by the following ways.
Proximity sensors: This type of environment sensing is based on the information from ultrasonic, microwave, and infrared (reflective, triangulation, and time of flight) sensors. Usually, the sensors are used in applications sensing only several spots, therefore only very simplified models of the environment can be created. The model contains relative rough description of the environment. The task to pass through the door or to pass around an obstacle is constrained to several dimension values. The values from sensors could be processed utilizing various mathematical approaches and algorithms. One of the possible approaches is the Kalman filter shown in the study by Zou et al. 17 The Kalman filter is a perfect approach when behavior of the system is known (e.g. velocity or temperature cannot change stepwise). For example, when the robot is moving only in a building with even parallel or perpendicular wall directions, the Kalman filter’s internal model settings might be set to this situation. When this same robot is placed in a building with circular corridor of very high radius, the Kalman filter will destroy the information of smooth curvature and the map of surrounding environment will be distorted. This is the danger of Kalman filter usage.
Systems of computer vision: This type of surrounding environment sensing is based on image-processing algorithms, searching key points in images taken by the camera. This system of scanning needs more computing power. The system compares patterns at ceiling, floor, and walls. It tries to create a 3-D model and compares it with possible position stored in memory. The task to pass through the door or to move around an obstacle is done by image processing of taken images. It is up to a programmer if image information is processed up to the level that information is extracted. An example of current research on this topic can be found in the article by Jaimez et al., 18 which describes navigation taking in to account the lateral cross section. The state of art of current research in reconstruction of a 3-D shape is described in the book. 19 First, the image is taken by a camera, then image processing algorithms are applied (the image is represented as a matrix with dimension of image resolution). Then some key points are extracted using the gradient filters (multiplication of the image matrix with small matrices)—the purpose is to extract image regions with high-gradient values (sharp edges). Beginnings and ends of the edges are the key points. Then another image is taken from another position of the camera (or with the second camera). The key points in the second image could be searched from the position of key points from the first image, for example, by a spiral way. Then the key points are assigned (if the key point in the first image is corresponding to the key point in the second image). This could happen by comparing vector description of the key point surrounding environment in original image matrices. There are two possible approaches:
First, the 3-D model of surrounding environments could be created by known translation and rotation between these two viewpoints.
Second, the position of camera translation and rotation between two viewpoints could be calculated by the known 3-D model of surrounding environments.
In last years, the neural networks are more and more applied in the image processing as described in. 20 T the neural networks are used in the image processing as shown in the study by Pal et al. for categorization of objects and in machine learning of control algorithms. Some parts of image recognition could be done by neural networks, for example, preprocessing (extracting features), by comparison of two features of the same object in two different images and in the 8-point algorithm for searching the nearest representation of consistent solution. They could also be used for understanding the image, like for the door or stairway recognition. Other parts of image processing, such as 3-D reconstruction, could be done by classical methods. Collisions are detected by projecting a robot body shape in the reconstructed 3-D model.
Some intermediate step between using proximity sensors rigid to the robot’s body and systems of computer vision is utilizing the rotational laser scanner. This type of surrounding environment sensing utilizes a rotational head that measures distance around itself. This approach gives an opportunity to precisely measure the space relative to systems of computer vision. The error of the measurement increases with the distance in a hyperbolic way due to the perspective transformation. Another disadvantage of the computer vision is that it could be fooled by images that, for example, the neural network represents badly.
There are two basic approaches: Systems with a horizontal scanning plane used, for example, in automated guided vehicle (AGV) systems to know the distance in a plane where the system is moving. Systems with lateral scanning plane (roll axis of the scanning head) scanning the whole space around it visible from the scanning head. This system requires the accurate position of the scanner to create an accurate 3-D model of the space. Such system could be used if the first robot creates an accurate 3-D model, which is then utilized by another robot moving in the same space.
The next area is a transportation of an oversized cargo by road, railway, water, or air. The most important and the most variable of them are the road transport. By all types of oversized transport, the basic limitation is the weight of the cargo and the second limitation is the loading gauge. Let us focus on the loading gauge since the weight is out of the topic of this article. Some research is dedicated to legislative in logistics like that in the study by Kalašová and Masár 21 compared to other countries. The oversized transport relies on maps, where limitations are marked. The very important fact is the road design and road infrastructure equipment. For example, in Scandinavia, the road communications are designed to be able to manage also oversized cargo transport. In Slovakia, the oversized transport relies on limitation maps and knowledge of skilled persons. No automated approach is done yet in Slovakia, but our laser scanning approach offers also information solution for this type of task.
The mobile measurement platform used in practical experiments has been primarily designed to measure changes in geometrical parameters of the road and degradation of road surface over time. The secondary function of this unit is to measure surrounding area and environment around the measured road. The concept of the measurement unit is based on obtaining measured data from multiple measurement sources, their fusion and further rapid processing for intended purpose. Road surface is measured by the laser scanner LMS-400, produced by the SICK company (Germany). To measure surrounding area, we use laser scanner LD-OEM 1000 from the same producer SICK AG (Germany). Its angular range is 360°. The distance to the object is calculated from the propagation time that the light requires from emission to reception of the reflection at the sensor.
The laser scanner works as a Transmission Control Protocol/Internet Protocol (TCP/IP) server. To obtain visual information about the measured area, we use cameras installed in the front part of the measurement platform. To obtain precise position of the measurement platform, we use the compact, single enclosure GNSS+INS receiver (SPAN CPT) localization system. It consists of the classical GPS receiver providing basic position data, OMNISTAR receiver, and a set of accelerometers and gyroscopes.
To calculate a cloud of points, we use our own algorithm utilizing the equations proposed on the base of received data analysis. These equations enable to fuse data obtained by the laser scanner, GPS receiver, and INS. When we have created a cloud of point, we can generate an object surface. The method for the creation of surface, utilized in our algorithm, is designed in such a way that three points are necessary to create surface. In this way, it is possible to reach better interpretation of final objects, thanks to smaller dimensions of individual surfaces. After processing of all the points in this part of our algorithm, we get a model of object on which we can apply the texture. Gradually, we receive texture from individual images of the road surface using cameras. This texture can be applied to the final model of road surface.
Results of our research are focused mainly on applications in road and railway transport. Transport processes may not be stopped for several hours or more because of the necessity to perform required measurements using the 3-D laser scanner. Therefore, we work with 2-D scanner(s) and use data fusion from the GPS and INS when creating the final 3-D model in the form of a point cloud. Consequently, after generating the surface areas, we apply texture automatically obtained from a set of camera records. The final model is saved in the format *.obj and consists of individual cuts of the environment that are further analyzed for potential collisions of moving objects, in future transferred through the measured environment. The term “moving object” may represent a train moving along the rails or a vehicle on the road transporting an oversized load; collision parts of the environment that are searched for may be trees, parts of building, bridges, electrical lines, and so on. For practical experiments and tests of the method presented further, we use the mobile platform depicted in Figure 1. Technical parameters of the mobile platform and our method for the creation of 3-D model have been published in our previous articles. 22 Our data fusion model used in this application is described in the study by Gouri et al. 23
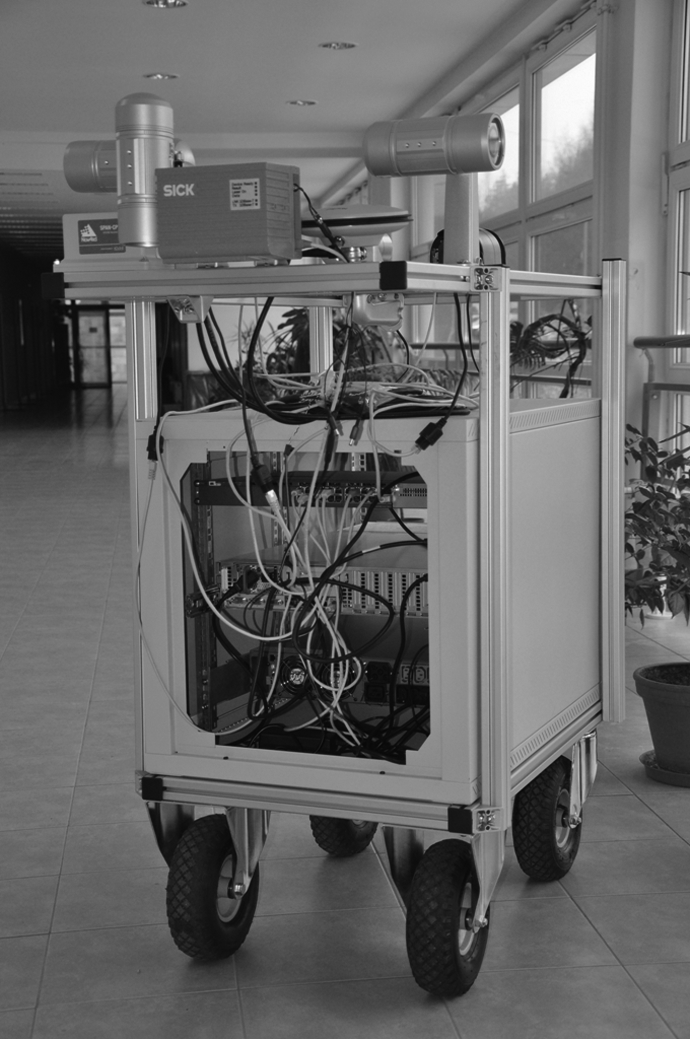
The mobile measurement platform used for experimental tests.
The method for search of collisions between an object and environment
A prerequisite for method application is availability of the 3-D virtual model. The principle of our method for collision search is based on intersection of lines formed by vertices of the object model and vertices of the environment model. The input file, containing the environment model, contains arranged individual cuts. To find a collision place, every two consecutive cuts are used to generate lines and these lines are compared (using the software implementation of the described method) with the lines formed by the points representing the moving object. The block diagram of our algorithm is in Figure 2.

Block diagram of our algorithm.
In the first stage of our method, the model of the environment is loaded. Before creating the model, it is necessary to measure the environment utilizing the mobile measurement platform; all objects in the environment have been scanned by laser range finder LD-OEM 1000 manufactured by the SICK company. The method for the creation of 3-D model using continuous measurement by the mobile measurement platform is based on the fusion of readings obtained from devices integrated in the mobile measurement platform. Laser scanners provide the information about cross-section of the surroundings—they measure distance from the center of the measurement head to the nearest obstacle in given direction and space. Utilizing two laser scanners together allows us to increase precision of the measurement in a certain range of directions. Position of the mobile measurement platform is obtained from the GPS receiver, which also includes the INS.
Image information about measured objects is taken by cameras mounted on the mobile measurement platform. The data fusion algorithm is running on the server incorporated in the mobile measurement platform. The algorithm incrementally processes all readings and converts them into one 3-D model. First, the unnecessary data are removed from the measured readings (e.g. checksum, time stamp, etc.) and transformed to more convenient numeric format (e.g. from hexadecimal to decimal). Then the cloud of points is computed using fusion of readings from laser scanners, GPS receiver, and INS. After the cloud of points is obtained, it is possible to compute surfaces of each object. In the last step, the texture taken by cameras is applied to the surfaces. The texture is prepared from the record of the measurement between two iterations of the algorithm.
In the second stage, the model of the moving object is loaded (the object is supposed to move in the given environment). Our method is designed in general; the moving object does not need to be only a mobile robot. Model of the moving object might represent a person, car, or truck. The model can be loaded by two ways. If the moving object is already scanned then the model can be directly loaded from an external file. Otherwise, the model can be defined from image data of the moving object; the characteristic points of the object’s outline are extracted from the picture with defined resolution and dimensions. The technological blueprints of the object are the most suitable for this purpose.
The model of such an object is a cut of the real-moving object. Figure 3 shows the model of a rectangular object moving through the model of a hexagonal space, while no collision occurs.

Cross-section of the space (hexagon) with the moving object (square).
Figure 4 shows another situation when collision of the moving object with its surrounding space occurs.
Demonstration of the case with collision.
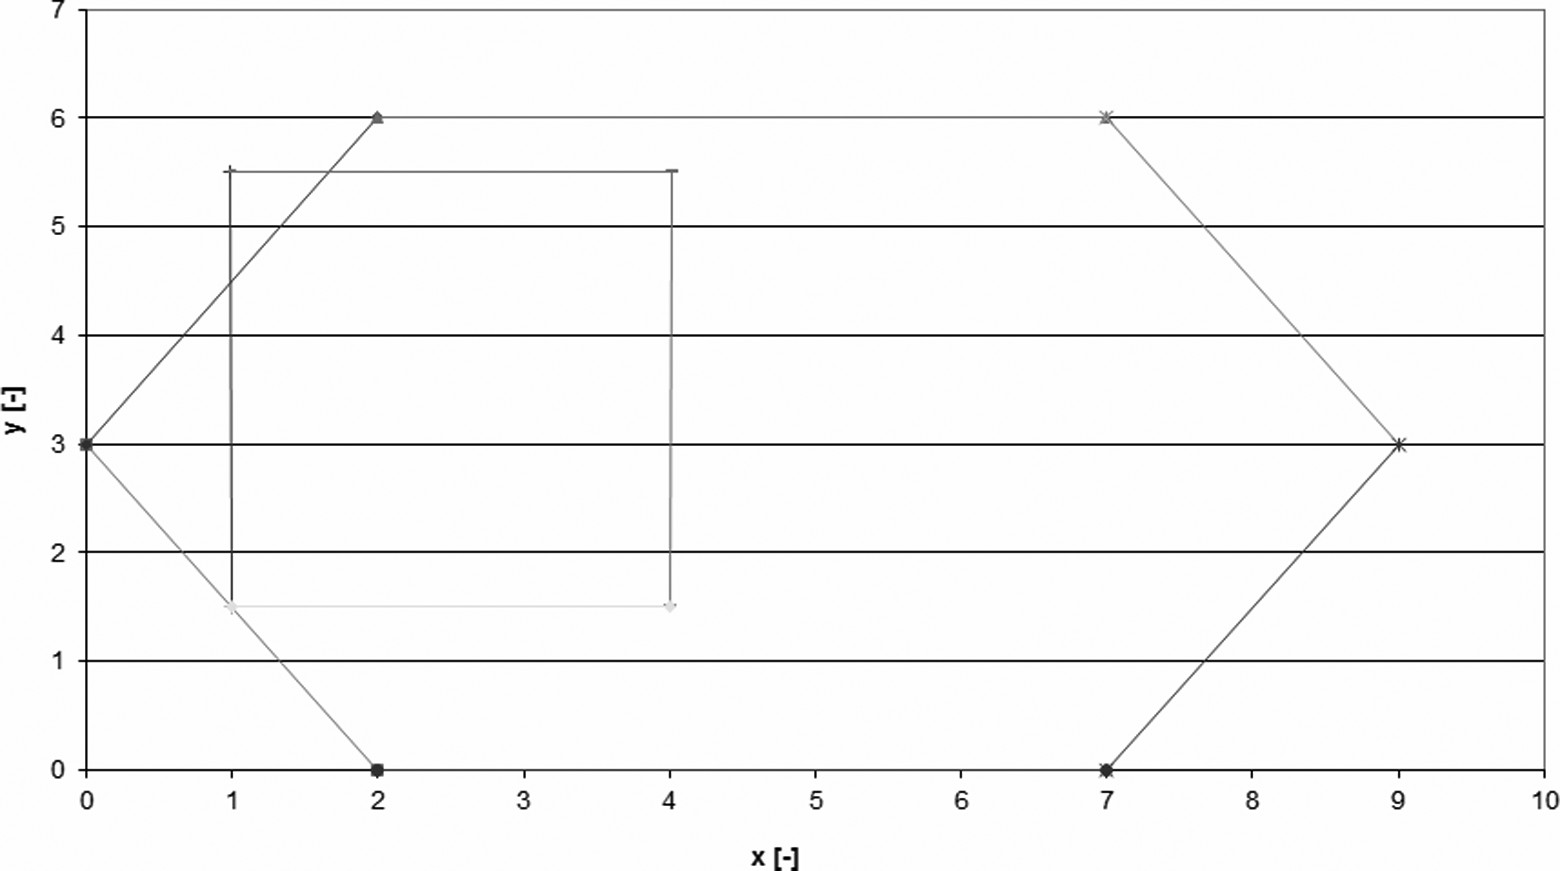
The whole problem of searching for collisions of objects can be decomposed to several partial tasks of searching for intersections of couples of lines (Figure 5).

Example of intersection of two line segments: A[0;5], B[2;1] and C[0;0], D[1.5;5].
For the sake of better understanding, an example demonstrating the real models is available in Figure 6.
Example of the models of the real object and the real environment.
Mathematical solution requires definition of coordinates of individual points first. Let us assume the following points and their coordinates
Then, we can use these points to define two relevant lines based on two segments
Derivation consists of several steps. The first one is calculation of the direction vector for the line. Let us start with the line based on the segment

The direction vector


The next step is transformation of the direction vector into the normal vector. The normal vector of the line created from the segment


The following step is applied to calculate the value of the coefficient c, which is necessary for calculation of coefficients contained in the slope-intercept form of the line. To do that, we could use the following equation

By gradual updating of equation (6) (see equation (7)), we can obtain the final form (equation (8))


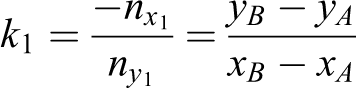
The results (the normal vector based on equations (4) and (5) and the coefficient c1 based on equation (8)) will be used then in equation (9) to obtain the coefficients k1 and q1 (interpreted as a slope of the line and its y intercept)

Thus, the slope-intercept form of the line can be expressed as

Analogically, we can obtain equations for expressing the other line based on the segment

By analogy, we can get equations (12) and (13)


and parameters (equations (14) and (15)) of the normal vector


The following step is applied to calculate the value of the coefficient c, which is necessary for calculation of coefficients contained in the slope-intercept form of the line. To do that, we could use the following equation

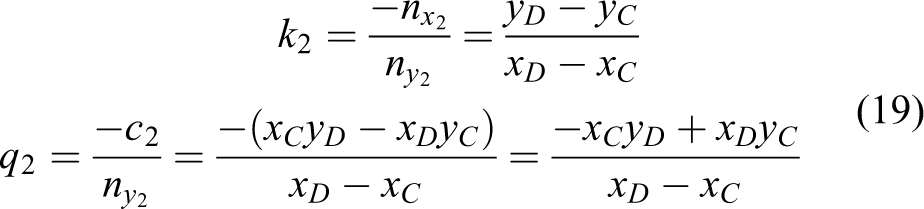
By gradual updating of equation (16) (see equation (17)), we can obtain the final equation (18) for calculation of the coefficient c2


The results (the normal vector based on equations (14) and (15) and the coefficient c2 based on equation (18)) will be used then in equation (19) to obtain the slope k2 and y intercept q2
Then the interception of the both lines (based on the segments
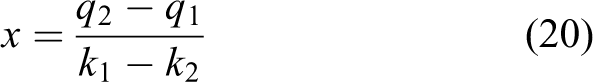

These equations may be used to derive the final equations (22) and (23)
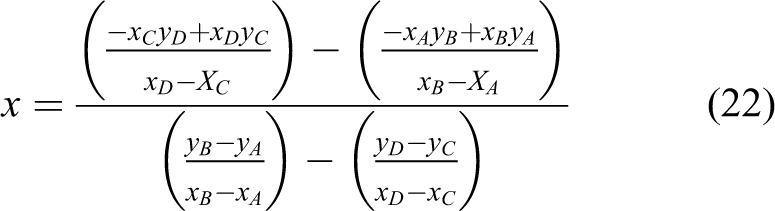

In case there is an intersection of both lines


To define an interval of y coordinates for the line

To define an interval of x coordinates for the line segment


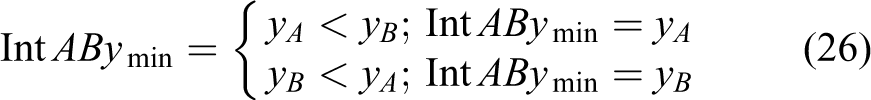
For definition of an interval of y coordinates, we can use
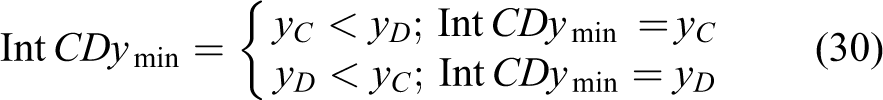
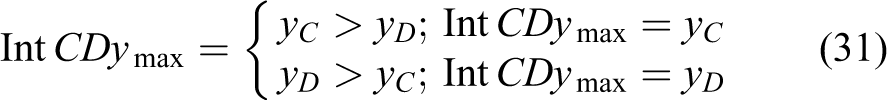
Having all necessary intervals defined, we can determine minimum and maximum values of intervals in which the point of lines intersection must be located. For values of the x-axis


To define values of the y-axis interval, we can use


After definition of minimum–maximum values of both intervals, the following condition must be fulfilled
If we can find x and y such that


If
The method presented here may successfully also be used for detection of potential collisions of robots, animals, persons, or any other measurable objects.
Practical measurement and testing
Our approach was tested with many models of objects and the environment. The present version of our method is designed to work with static environments. The results, which are presented in this article, were created using of one the 3-D models of the environment and three 3-D models of the moving objects. The output of our approach is a picture of the critical situation and positions of the collisions.
The first moving object is a personal car type Mercedes-Benz. The second moving object is the truck Mercedes Benz-Actros. The last moving object is the truck Caterpillar 797. The attached figures show the sections of the environment model, which were created by our mobile measurement platform, and model of car, truck, or Caterpillar 797. x-axis is the width of the model and the y-axis is the height of the space in one cut of the environment model.
The personal car (see Figure 7) and the truck (see Figure 8.) can pass underneath the bridge between buildings.

Simulation of the situation when a personal car can pass under the bridge.

Simulation of the situation when a truck can pass under the bridge.
A possible use in the industrial sector is mobile industrial autonomous trolleys for transporting goods and materials inside the factory.
The truck Caterpillar 797 can’t pass underneath the bridge between buildings (see Figure 9).

Simulation of a situation when a truck can’t pass under the bridge.
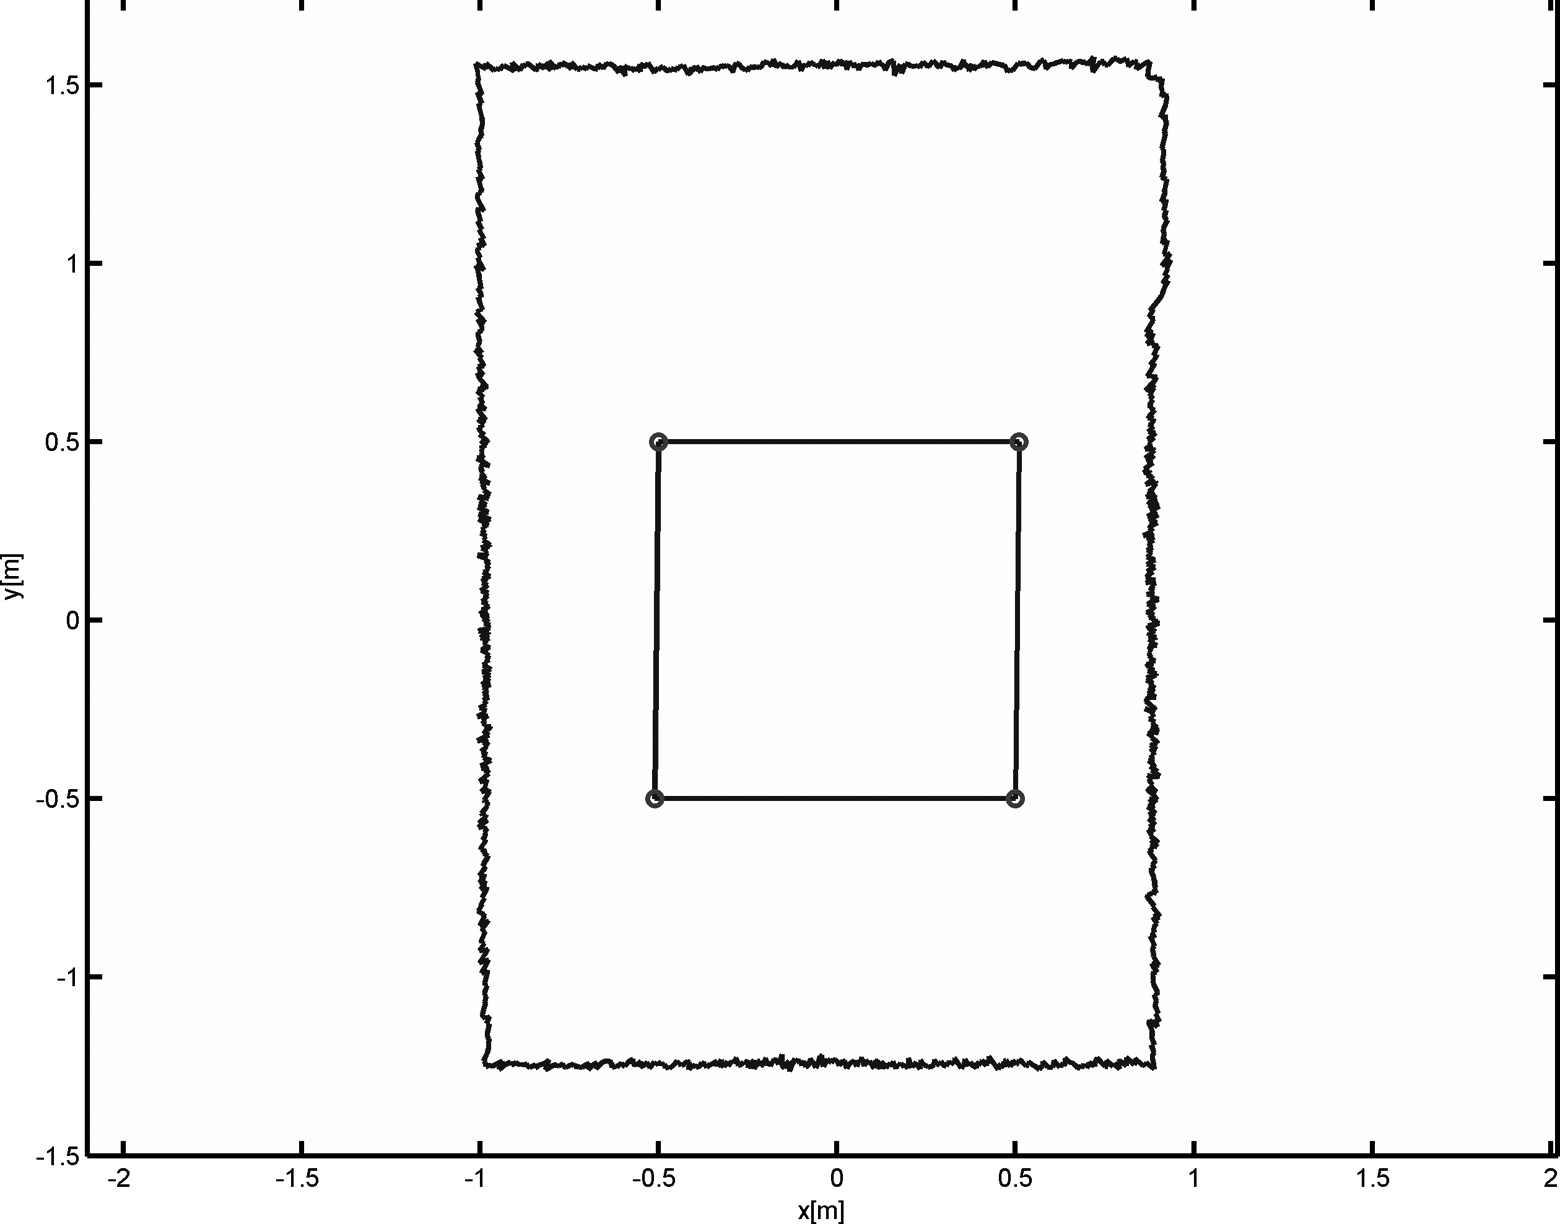
All experiments were conducted with 3-D model of environment as shown in Figure 10. Our method has been tested by four scenarios (person, car, truck, and Caterpillar 797). In each case, when the collision between the object and the environment might occur, our algorithm issued an appropriate alert.

Three-dimensional model of environment with trajectory of moving object.
Precision of the 3-D models depends on the accuracy of a laser scanner, which was used to measure an environment. In our case, the laser scanner LD-OEM 1000 (producer—SICK) was used, which has a measurement accuracy of ±0.7 cm. This measurement error is the same for the measurement of near and far objects. This laser (LD-OEM 1000) scanner covers the whole space, its angular range is 360° and measurable distance range about 250 m. Higher accuracy of the model (±0.1 cm) can be achieved using a laser scanner LMS 400 (producer—SICK). This laser scanner is used for accurate measurement of road surface, its angular range is 70° and measurable distance range is about 2.4 m.
The maximum dimensions of the model, which can be used for simulation of the passage of oversized objects, are not limited. In our case, we used models that were generated utilizing our mobile measurement platforms and maximum dimensions are based on the working range of the laser scanner LD-OEM 1000. The largest model that we used is the model of the university campus, which was created by measuring of 0.25 km2 and requires 106 MB of disc space.
The time required for processing 1 m of the measured data is approximately 1 min. During this time, the following tasks are computed: data preprocessing, processing of point clouds, and creation of object surface. This time is valid under these conditions—angular range of measurement 360°, angular resolution 0.25°, 28,800 measured points per second, and speed of mobile measurement platform—5 km/h and the data processing is running on notebook HP EliteBook. Time of collision detection is highly variable and its exact value depends on the number of measured points and the difficulty of oversized transported model.
Our method has been tested by four scenarios (person, car, truck, and Caterpillar 797). In each case, when the collision between the object and the environment might occur, our algorithm issued an appropriate alert.
The reliability of the collision detection depends only on the quality of the previously created input 3-D model. If the model is correct and contains all relevant objects in the environment, our proposed analytical method detects collisions with absolute certainty. The present version of our method is designed with static environments.
Conclusion
The method as presented earlier is one of the outputs of the research team working in the field of 3-D environment measurements and analysis focused on safe movement of modeled objects within the environment virtual models. Correctness and practical feasibility of the presented method has been tested and proved by multiple practical experiments. The method uses virtual 3-D models obtained by data fusion, getting data from the 2-D laser scanner(s), GPS, and INS, however, could be applied to any other models generated by different approaches.
Footnotes
Declaration of conflicting interests
The author(s) declared no potential conflicts of interest with respect to the research, authorship, and/or publication of this article.
Funding
The author(s) disclosed receipt of the following financial support for the research, authorship, and/or publication of this article: This article was supported by the operation program “Research and development” of the ASFEU-Agency within the frame of the project “New methods of measurement of physical dynamic parameters and interactions of motor vehicles, traffic flow and road.” ITMS 26220220089 OPVaV-2009/2.2/03-SORO cofinanced by the European regional development fund. “We support research activities in Slovakia/The project is cofinanced by EU.” The article is sponsored by VEGA MŠ SR No 1/0367/15 within the project “Research and development of a new autonomous system for checking a trajectory of a robot,” VEGA 052TUKE-4/2015 “Multifunctional design studio for teaching,” and KEGA 006STU-4/2015 University textbook “The means of automated production” by interactive multimedia format for “STU Bratislava and Košice.”