
Abstract
Unmanned aerial vehicle (UAV) mainly uses GPS (Global Positioning System) for positioning, but it is difficult to locate in areas where GPS signal is missing or being disturbed. Therefore, the relative positioning technology based on visual method is also widely used in UAV landing, but due to the influence of cross wind and the motion of the landing plane, the traditional visual landing sign and positioning method is prone to lose the positioning target at the end stage of the landing. Therefore, this article proposes a landing sign based on double-layer unique coding, which can realize continuous positioning in the horizontal direction and accurate positioning of large-scale changes in the vertical direction. Firstly, real-time image acquisition and image processing are carried out through the airborne camera. Based on the flight altitude and encoding extraction effect of the UAV, the red or blue channel component is extracted, and then the image is preprocessed, edge detection, line detection, coding grid extraction, etc. As long as any 5 × 5 small squares of the whole pattern can be extracted, the perspective-n-point algorithm is used to obtain the relative pose estimation between the UAV and the landing sign. Experiments show that the landing sign and recognition algorithm effectively improve the UAV landing reliability.
Introduction
With the development of computer technology, sensor technology, and artificial intelligence technology, automatic landing system has gradually become the main technology of helicopter landing. These systems achieve comprehensive monitoring and automatic control of the helicopter by integrating various sensors such as Global Positioning System (GPS), INS, radar, and camera. It plays an important role in medical rescue, air transportation, resource exploration, atmospheric detection, and other fields.
The final landing stage of the unmanned aerial vehicle (UAV) is a high-risk stage for accidents. For example, when a UAV lands at a target location, it is affected by crosswinds, traditional visual landing signs, and positioning methods are prone to losing the positioning target in the final stage of landing when the UAV deviates, resulting in positioning failure, thus requiring a go around. Therefore, it is necessary to accurately measure the relative position between the UAV and the landing plane. According to the implementation principle, it is mainly divided into visual and nonvisual methods.
Nonvision methods mainly rely on the cooperation of GPS and other sensors. Shao et al. 1 use GPS and multiple ultrasonic sensors to realize the relative pose measurement and autonomous landing of UAV. Niu et al. 2 use infrared beacons for accurate positioning of aerial UAV. Yao et al. 3 designed a set of UAV mast system to realize the accurate landing of UAV under the guidance of cable. Shi et al. 4 designed auxiliary beacons to adjust the attitude angle in real time to improve the positioning accuracy of UAV. Liu et al. 5 designed a six-legged landing gear to achieve dynamic adaptive landing. Nonvision methods generally obtain absolute pose. It is difficult to obtain the relative pose between the UAV and the landing plane, and it depends on the communication between them, which is vulnerable to electromagnetic interference.
Due to many advantages such as low cost, high precision and no electromagnetic interference, visual method is the mainstream direction of UAV landing positioning at present. A large number of scholars have designed different landing signs to realize the accurate positioning of UAV. Yang et al. 6 calculate the relative pose by shooting the “H” sign as shown in Figure 1(a). Tao et al. 7 proposed a multilayer nesting of concentric circles with different radius sizes as UAV landing markers, as shown in Figure 1(b). Hong et al. 8 designed a multilayer nested concentric circle descending pattern and cooperated with the ultrasonic ranging module to complete the positioning. However, when the angle of the UAV is greatly tilted, the ring detection based on Hough transform is extremely unstable and easy to cause detection failure. Sun et al. 9 use “F” Landing signs for UAV position measurement. Wang et al. 10 use a black and white grid for UAV landing signs. Hou et al. 11 use local satellite images and global deep learning features for UAV positioning, but the matching and sorting based on local features will consume a lot of time and cannot achieve real-time measurement, and when the image overlap rate decreases, the accuracy decreases accordingly. Xu et al. 12 use deep reinforcement learning algorithms to achieve autonomous landing of UAV. Nie et al. 13 combined the feature point method and the direct method, used the depth filter for depth estimation, established a sparse map, and realized the indoor positioning of UAV. Liu et al. 14 use of multilayered nested black and white triangles as UAV landing signs, as shown in Figure 1(c). Pang et al. 15 use four cameras to capture UAV, and view fusion is performed to determine the three-dimensional (3D) information of the UAV. He et al. 16 designed a sign of ArUco code for UAV landing, and an ArUco code is shown in Figure 1(d).
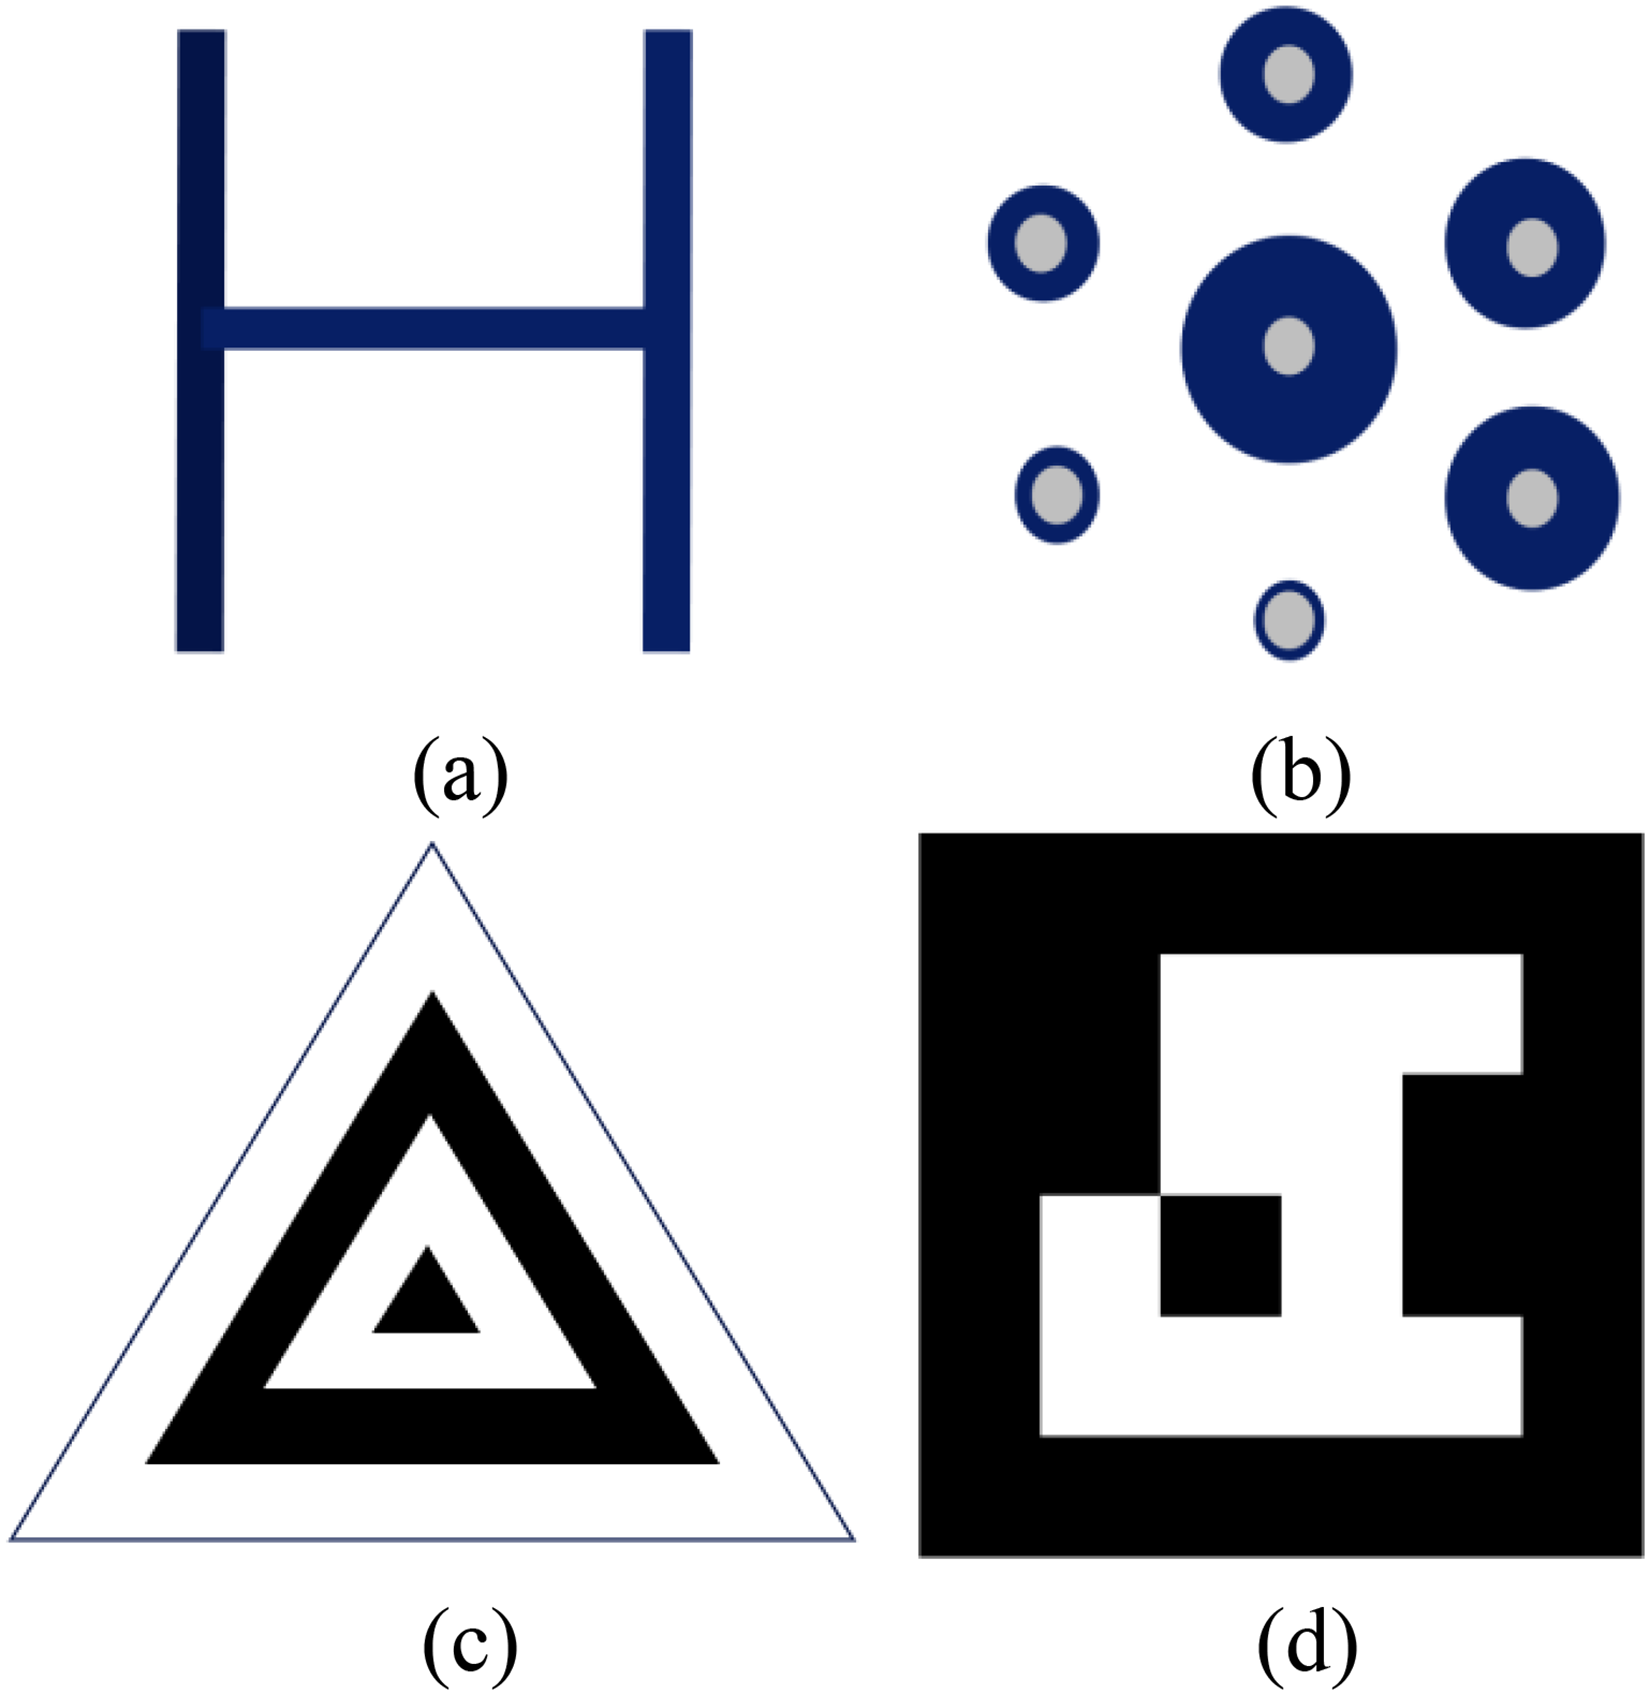
Common landing signs.
In addition, due to the jitter caused by UAV flight, the resulting image blur can affect the visual accuracy. Liu et al. 17 proposed a motion acceleration estimation model to reduce the impact of acceleration on pose estimation, and used complementary filtering to correct the gyroscope, so as to improve the measurement accuracy of UAV attitude in dynamic environment. Lin et al. 18 proposed an improved feature point matching algorithm, which effectively improved the interference ability of traditional optical flow algorithm in the face of illumination change noise, and used image segmentation algorithm to eliminate the interference of foreground motion noise and improve the positioning ability of UAV. Truong et al. 19 use neural network to preprocess the image to deal with the blur problem caused by UAV movement, but it is susceptible to noise interference and has poor real-time performance.
When the UAV is too close to shooting the whole landing sign, it is easy to cause positioning failure, and it needs to make a round flight, and continuous pose measurement cannot be achieved. Nguyen et al. 20 designed multiple patterns to provide multiple landing points, but the horizontal positioning is not continuous. Shi et al. 21 converted point cloud data into three-channel tensors through motion compensation and other means, and used extended Kalman filtering and designed perception model predictive control to achieve active vision of UAVs, greatly improving the real-time performance of UAV object detection. You et al. 22 first designed and introduced a lightweight bottleneck structure, GhostNeck, to improve real-time performance. By integrating attention mechanism and SimCC loss, significant improvement in detection accuracy was achieved. A self-collected dataset was built for verification, achieving precise detection and continuous tracking of low altitude UAV attitudes.
To solve the problems of the above methods, such as positioning failure caused by incomplete shooting of landing signs due to UAV yaw, and the inability to achieve continuous positioning, we design a landing sign based on double-layer unique coding, and proposes a fast visual pose measurement and localization method according to the sign. A landing sign based on double-layer unique encoding was designed by combining GPS coarse positioning and visual methods. When at a long distance, the overall pattern can be used as the landing sign; at close range, based on the encoding extraction effect of the red and blue channels, and image preprocessing such as block brightness mean and filtering, the stability of the method can be improved. By using any internal 5 × 5 grid as the descent flag and using the perspective-n-point (PNP) algorithm, continuous positioning and pose measurement of the UAV can be completed, greatly reducing the probability of positioning failure caused by yaw.
Overall scheme design
The flow chart of the overall scheme design of the system is shown in Figure 2. Firstly, the airborne camera is used to shoot the landing sign, and because the camera is generally fixed directly below the UAV and the lens is vertically downward, the airborne camera coordinate system can be used as the replacement of the unmanned body coordinate system. If the landing sign is not detected, re-fly to the landing area until the landing sign is detected. Then the landing sign is judged. If it is a complete landing sign, the four corner points of the landing sign are directly used to solve the PNP pose. If a landing mark is not captured entirely, it needs to use the local coding module of the landing mark to achieve UAV position measurement. At this time, the red and blue channels can be extracted at the same time to start the following vision algorithms respectively, and then the channels with better coding and extraction effects can be selected for pose measurement. The specific algorithm is as follows: firstly, the image preprocessing is carried out on the captured image, such as filtering, average brightness of blocks, etc. Canny operator was used to extract edge and detect line. The code was extracted according to the gray value of the coding region, and the position of the four intersection points of the coding region could be obtained by comparing the extracted code with the code contained in the landing sign. The PNP algorithm is used for pose calculation. The landing sign is synthesized by two layers of black and white grid coding, and the overall or local landing sign can be located. When the UAV flies over every grid in the air, the image taken will change, as shown in Figure 3.
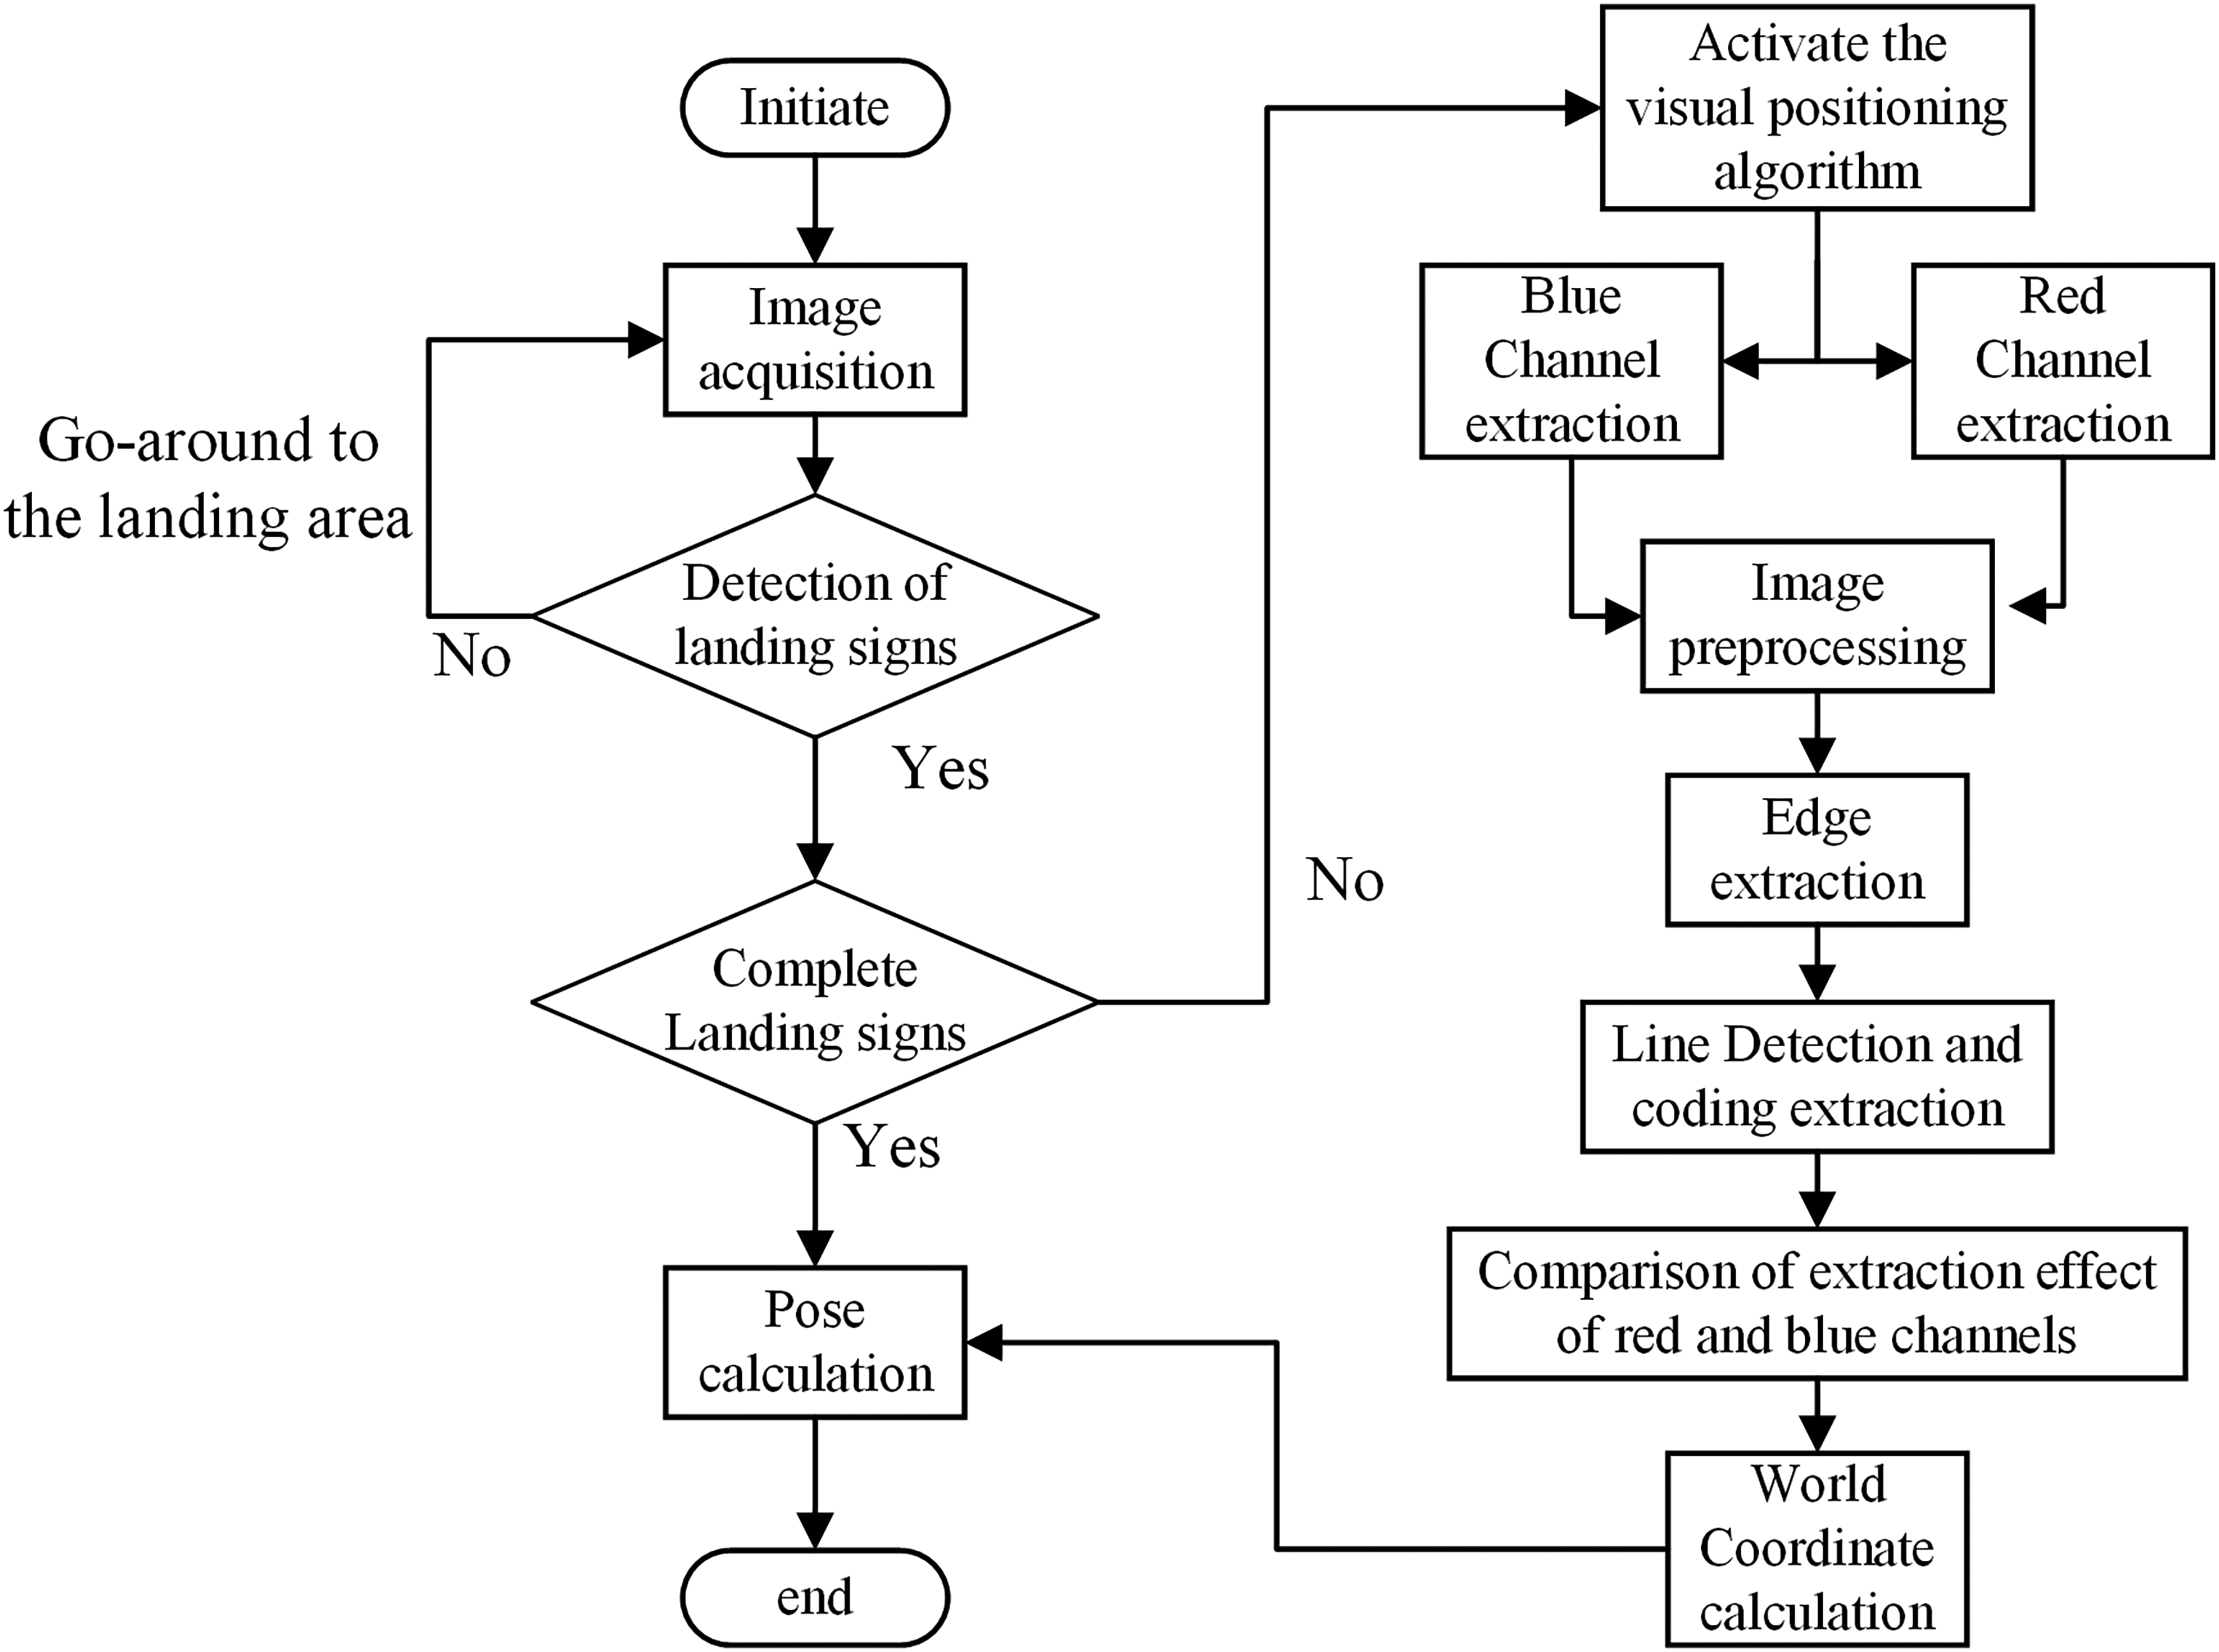
Overall design plan flow chart.
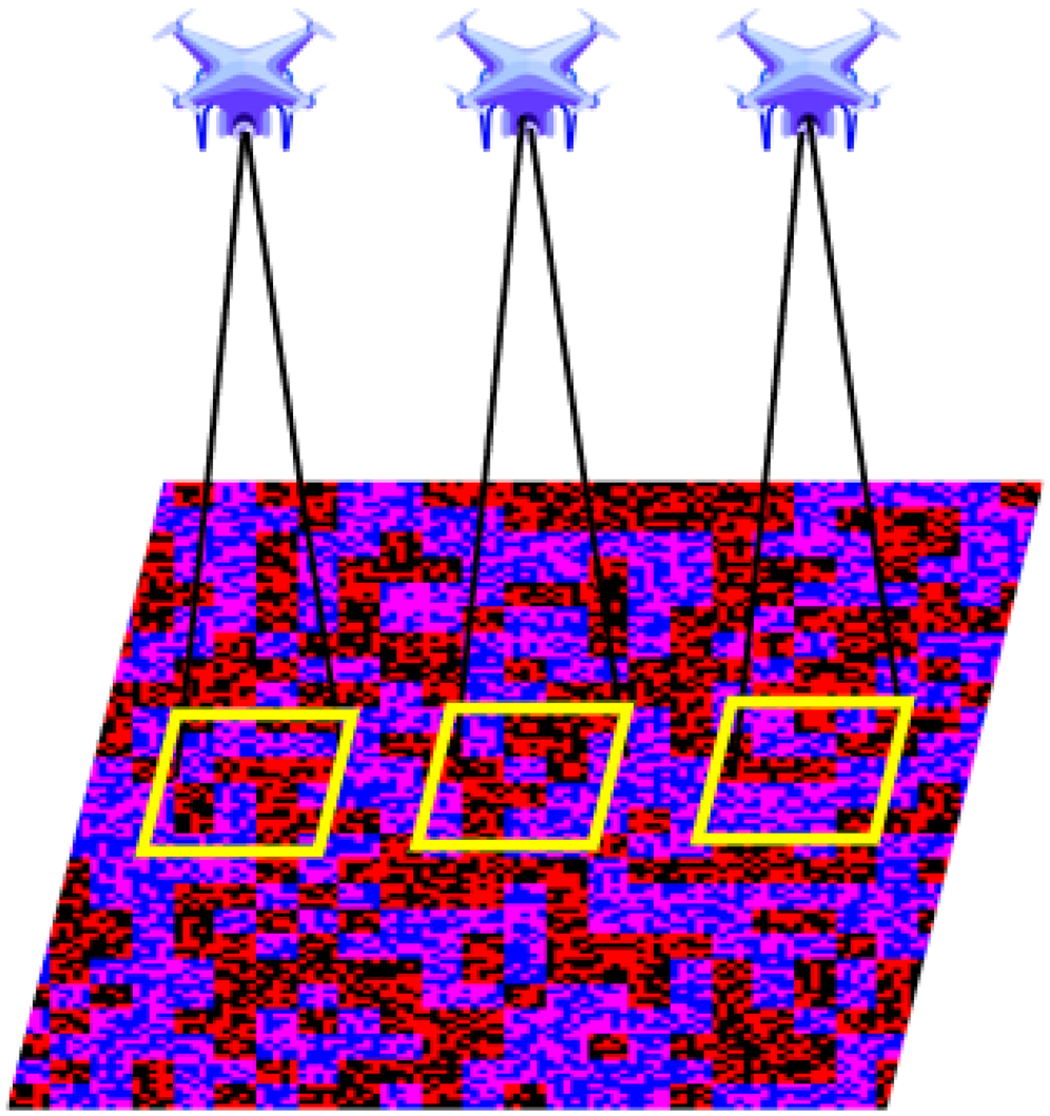
Schematic diagram of the UAV position measurement. UAV: unmanned aerial vehicle.
Landing sign design
The landing sign of the unmanned aerial vehicle autonomous landing system using visual method is very important, which needs to meet several characteristics:
It is composed of black and white colors, and the threshold segmentation efficiency is high. It has internal coded information and can be used for pose estimation. Simple and efficient, can be quickly identified.
Therefore, based on the uniqueness coding,
23
we design a new landing sign, and the specific generation process is as follows.
First, randomly generate a matrix of b square size, where each element is y (0 < y < Y), where y represents a certain color, so there can be
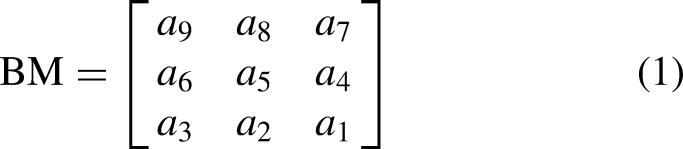

The range of B is
The global uniqueness encoding graph generation process is as follows:
Randomly generate a b × b two-dimensional (2D) matrix. Each element has values (a) For the first b rows, grow one column to the right, and form a new 2D matrix with the size of b square with the first b−1 column. There are Start from row b + 1, grow an element to the lower right corner, and form a new 2D matrix of size b square with the first b−1 row and the first b−1 column. There are Y possibilities for the value, and it is still traversing all possible values and randomly selecting a group to make b not repeat. (a) For the first b columns, grow a row down, and form a new 2D matrix of size b square with the first b−1 rows, and the value possibilities have y to the b power, which is the same as above. Starting from column b + 1, grow an element to the lower right corner, and form a b × b 2D matrix of new size with the first b−1 row and the first b−1 column. There are Y possibilities for the value, which is the same as above. Grow an element to the middle, and form a 2D matrix of new size with the b−1 front and the b−1 column. There are Y possibilities for the value, which is the same as above. Go back to step 2 and loop through steps 2-3-4 until all the B values are used. Loop through steps 1–5 until the desired matrix is grown.
By setting b = 5 and Y = 2, the black and white grid coding pattern in Figure 4 can be generated, where any 5 × 5 QR code value is globally unique.
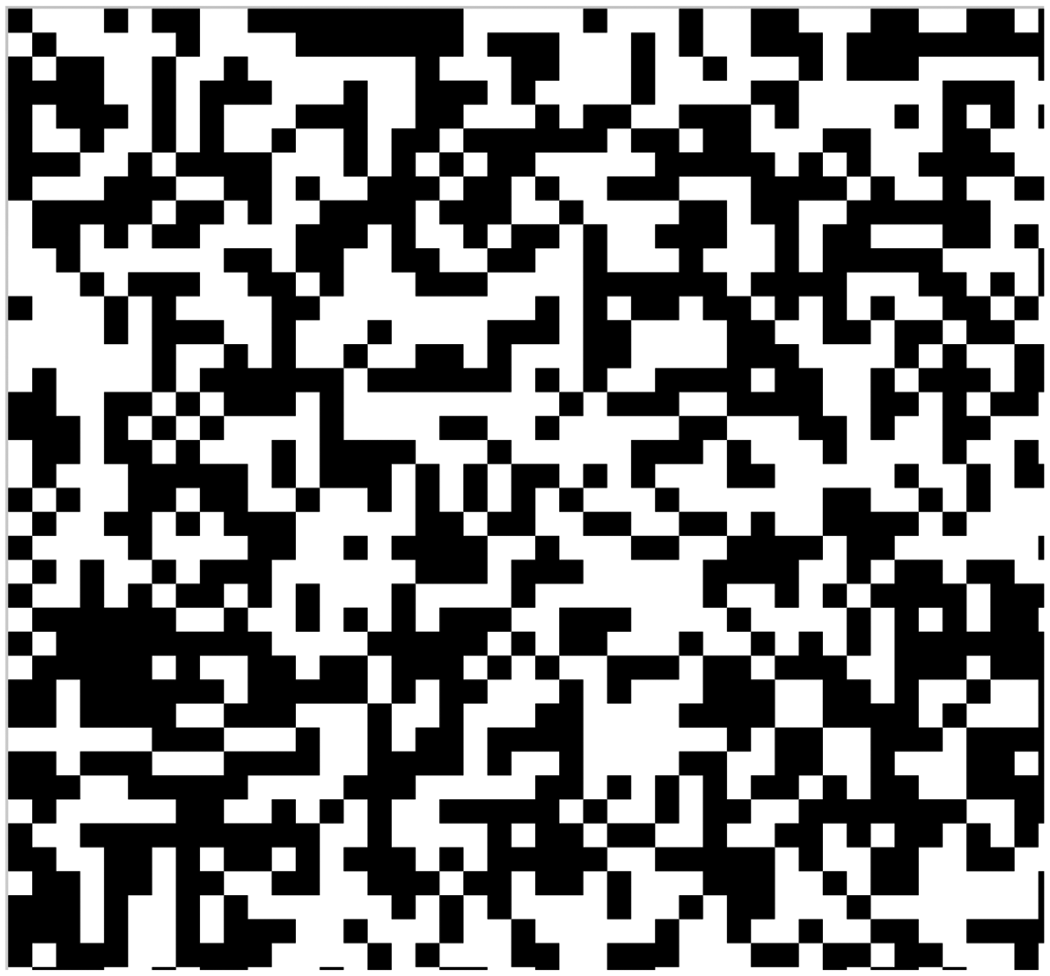
Black and white QR code diagram.
A 125 × 125 × 3 matrix is established, with the three dimensions representing R, G and B components, respectively. Since the red and blue channels are far apart, the crosstalk caused by them is small, so red and blue components are used for RGB synthesis, as shown in Figure 5. Specific operations are as follows:
Take 125 × 125 black and white coding matrix in the upper left corner of Figure 4 and put 125 × 125 × 1 into it. Take the 0 matrix of 125 × 125 and put in 125 × 125 × 2. Take the 25 × 25 black and white coding matrix in the upper left corner of Figure 4, magnify it 5 times, turn it into 125 × 125 matrix, and put 125 × 125 × 3 into it.

Colorful QR code landing sign diagram.
Image preprocessing
Contrast stretching: The minimum pixel value in the image is mapped to 0, the maximum pixel value is mapped to 255, and the intermediate value is linearly mapped, thus the dynamic range of the image is extended.
Image denoising: Due to the influence of illumination, UAV jitter, etc. the images have got a large noise, so it is necessary to carry out image filtering and denoising. Due to the large amount of pepper and salt noise in the image, the median filtering algorithm is adopted to the image. The method adopted is to replace the current pixel point value with the middle value of all pixels in the neighborhood after sorting.
Channel separation: Red and blue channels of color RGB images are extracted respectively for subsequent image processing.
Regional brightness equalization: Due to the lighting and shooting angle, the image will have uneven brightness and color deviation, the extracted red and blue channel will be mixed with other channel components, causing confusion between the extracted black and white grids. Therefore, the single threshold segmentation is not effective. The block brightness average algorithm is designed to obtain a clear grid black and white image, which is more conducive to the subsequent edge detection. The method of regional brightness mean value is to obtain the brightness mean value by partition first. If the channel brightness is greater than the mean value and greater than the partition brightness, the channel value is considered to be 255, and otherwise it is 0.
Corrosion and expansion: There are still a few small black and white dots, which can be removed by expansion and corrosion algorithm, and a clean black and white grid image with clear edges can be obtained, which is conducive to the subsequent coding detection.
Edge detection: Canny algorithm is used to detect the lines. Canny operator can find the edge by finding the local maximum of the gradient, and utilizes double threshold, noise resistance, and weak edge detection to achieve better results.
Algorithms for accurate positioning of UAV
Firstly, control the UAV to return based on its GPS positioning information. Then determine whether the landing area above the landing sign is reached. If it is reached, and the whole landing pattern can be seen at this time, use the on-board camera to shoot the entire landing pattern, and then directly use the entire landing pattern to locate. When the height drops, the whole pattern cannot be seen at this time, so the visual relative pose measurement method can be started. By extracting the red and blue channels of the image, it can be observed that any 5 × 5 can be positioned. At this time, the size of the extracted coding region needs to be compared, and choose a relatively large area. If the camera installation position is too close to the ground, the 5 × 5 grid area may not be observed, and positioning will fail. However, UAV is usually equipped with landing gear, which has a certain height and can meet the minimum 5 × 5 coding requirements for UAV positioning.
Channel separation
The landing sign is composed of two black and white coded grids assigned to the red and blue channels respectively, so different components of the red and blue channels can be extracted to meet the requirements of the 5 × 5 grids in the center, and subsequent operations can be carried out, respectively.
Straight line detection
Firstly, the previous images detected by edge detection are expanded and Hough line detection is performed, as follows:
A straight line can be represented by its slope k and intercept b in Cartesian coordinates:


After the Hough line detection, the straight-line segments are obtained and processed as follows:
Line segment merging: If the line spacing and angle are less than a threshold, replace the line segment with the coordinates of both ends of the line segment. Line segment grouping: The line segment is divided into horizontal and vertical groups, as shown in the red and green solid lines in Figure 6. The horizontal group is the green solid line, and the vertical group is the red solid line. Line segment filtering: Lines in the same group intersect, and those with large slope difference from the next side are deleted. If the lines in the same group are parallel, but the spacing between two adjacent line segments is much smaller than the spacing between other line segments, it will also be removed. As shown in Figure 6, the first red solid line in the vertical direction will intersect with the blue dot line on the right side, and the slope difference between this blue dot line and the red solid line on the right side is also large. Therefore, the blue dot line is removed, and the gap between the first and the third straight line is too large, which is twice the distance between the remaining red line segments, and the line segment is increased as follows. Line segment increase: If the spacing between adjacent line segments is too large, determine whether it is an integer multiple of the spacing between other line segments. If so, insert a new line segment with equal spacing, as shown in Figure 6, the second red short line segment added after the blue dot line is removed, and the second last long purple line segment in the vertical direction. Grid area acquisition: after the above operations, get all the grid, if the number of vertical line segments is even, take the middle two lines segments, if odd, take the middle line. In the same way, the geometric center point of the intersection point is obtained for the horizontal line segment, and three lines segments are taken, respectively. If the center point is on a line segment, remove a line segment from one side. Finally, we get a 5 × 5 coding area surrounded by four lines segments, as shown in Figure 6, which is surrounded by black dots and lines.
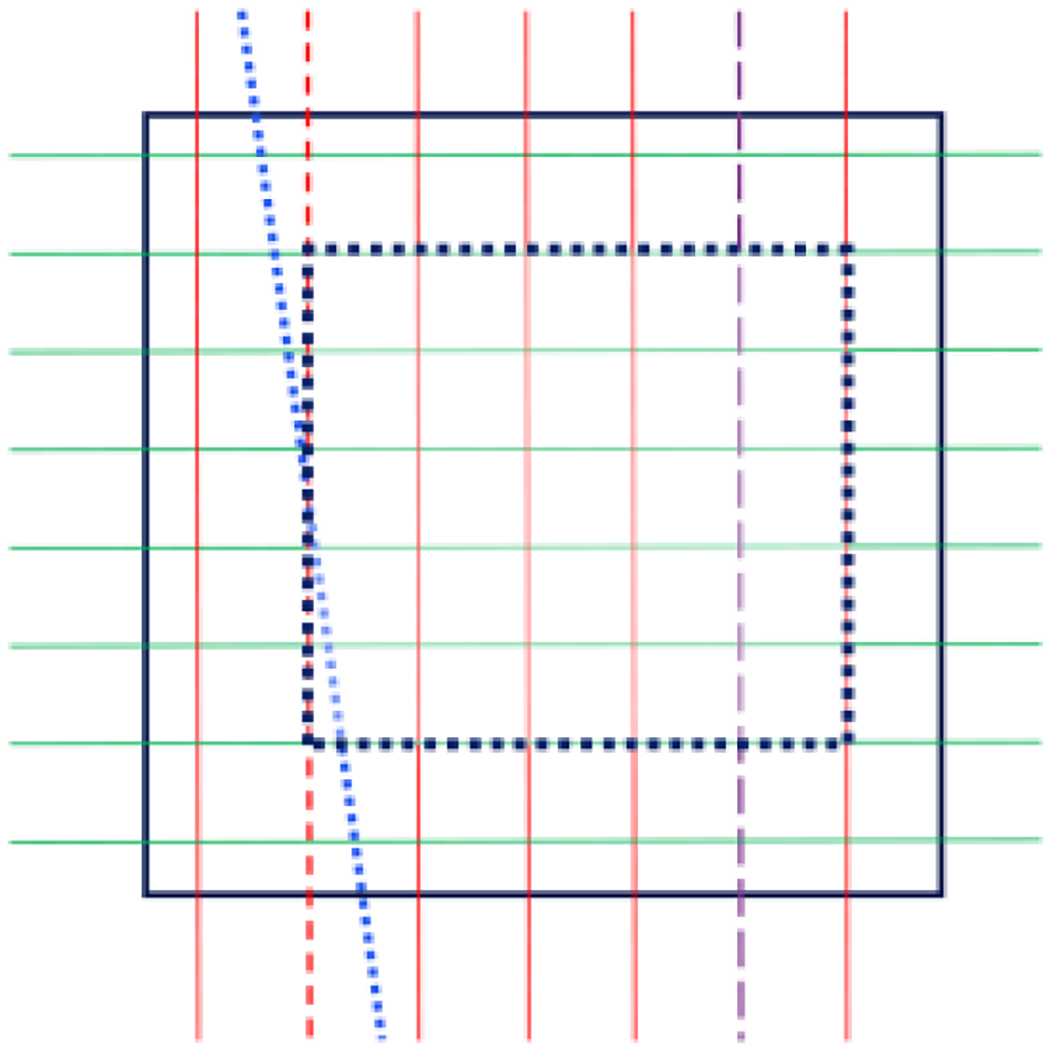
Straight line inspection diagram.
Comparison of coding extraction results
After the above operations, if only one channel of the red and blue channels successfully extracts the 5 × 5 coded grid, it can be used for 2D code recognition and positioning. When both the red and blue channels are successfully extracted into the coding grid area, and both of them can be used for 2D code recognition and positioning, then the effect of coding extraction needs to be compared. The one with the larger coding area will be used for 2D code recognition and positioning, which can achieve higher positioning accuracy.
Two-dimensional code recognition and positioning
Take the 5 × 5 grid area R in the center of the QR code, the area surrounded by black dots and lines as shown in Figure 6, calculate their respective center point coordinates and gray values, and calculate their coding value B according to the unique coding design formula mentioned above, so as to obtain the four position coordinates P(xi,yi)(1<=i<=4) of R in the entire descending pattern. We obtain the world coordinate Pw(xi,yi) for R (1<=i<=4).
Pose calculation
Using image position coordinate P and image world coordinate Pw(xi,yi), the pose of the camera in the world coordinate system can be calculated using the plane P4P. 24
The camera intrinsic parameter matrix is denoted as K, and the orientation transformation of the camera coordinate system

The camera head is generally vertically fixed directly below the UAV, so the pose of the camera in the world coordinate system is equivalent to that of the UAV in the world coordinate system. We obtain the coordinates

PNP algorithm diagram. PNP: perspective-n-point.
Vision measurement test
In this article, a common quadcopter UAV is used for indoor and outdoor field tests, the UAV is shown in Figure 8. The takeoff weight of the UAV is 249 g. The size of the UAV used is 159 × 202 × 55 mm. The maximum tilt angle of the UAV is 40°.The onboard camera has a focal length of 24 mm, a recording resolution of 2.7 k, an image sensor of 1/2.3 inch CMOS, 12 million, and an electronic shutter.

Experimental UAV. UAV: unmanned aerial vehicle.
The image taken by the UAV was transmitted to the computer in real time through the UAV image transmission system, and the computer calculated the captured image in real time, and then the position and orientation information calculated was used to assist the positioning and landing of the UAV. The airborne camera was fixed directly below the UAV, and the lens was vertically down, so the airborne camera coordinate system could replace the unmanned body coordinate system.
The signing is the color 2D code as shown in Figure 9, the length and width are 1250 mm × 1250 mm, and each small cell is 10 mm × 10 mm.

Landing sign.
The landing sign is placed horizontally on the ground, and the UAV takes it as a landing sign, and the lens is vertically down to shoot the image. Through the UAV accurate landing vision algorithm designed in the previous section, the positioning and pose measurement are carried out, and the vision guided landing is finally completed.
The specific process is shown in Figure 10, shooting the landing sign, as shown in Figure 10(a). At this time, the height is high and the grid is small, so the red channel coding grid extraction fails, and the blue component is extracted. Because the direct extraction of the blue component will appear in Figure 10(b), it needs to be preprocessed, such as filtering, dilation and erosion, and block brightness mean. Figure 10(c) is obtained, and then Canny edge detection is performed to obtain Figure 10(d), and the edge is expanded and Hough transform is performed to obtain line segments, as shown in Figure 10(e). Based on the previously provided algorithm, the middle 5 × 5 grid can be extracted, and the gray value of the center coordinate of each grid can be calculated and coded, as shown in Figure 10(f). The pose of the UAV in the world coordinate system can be obtained.
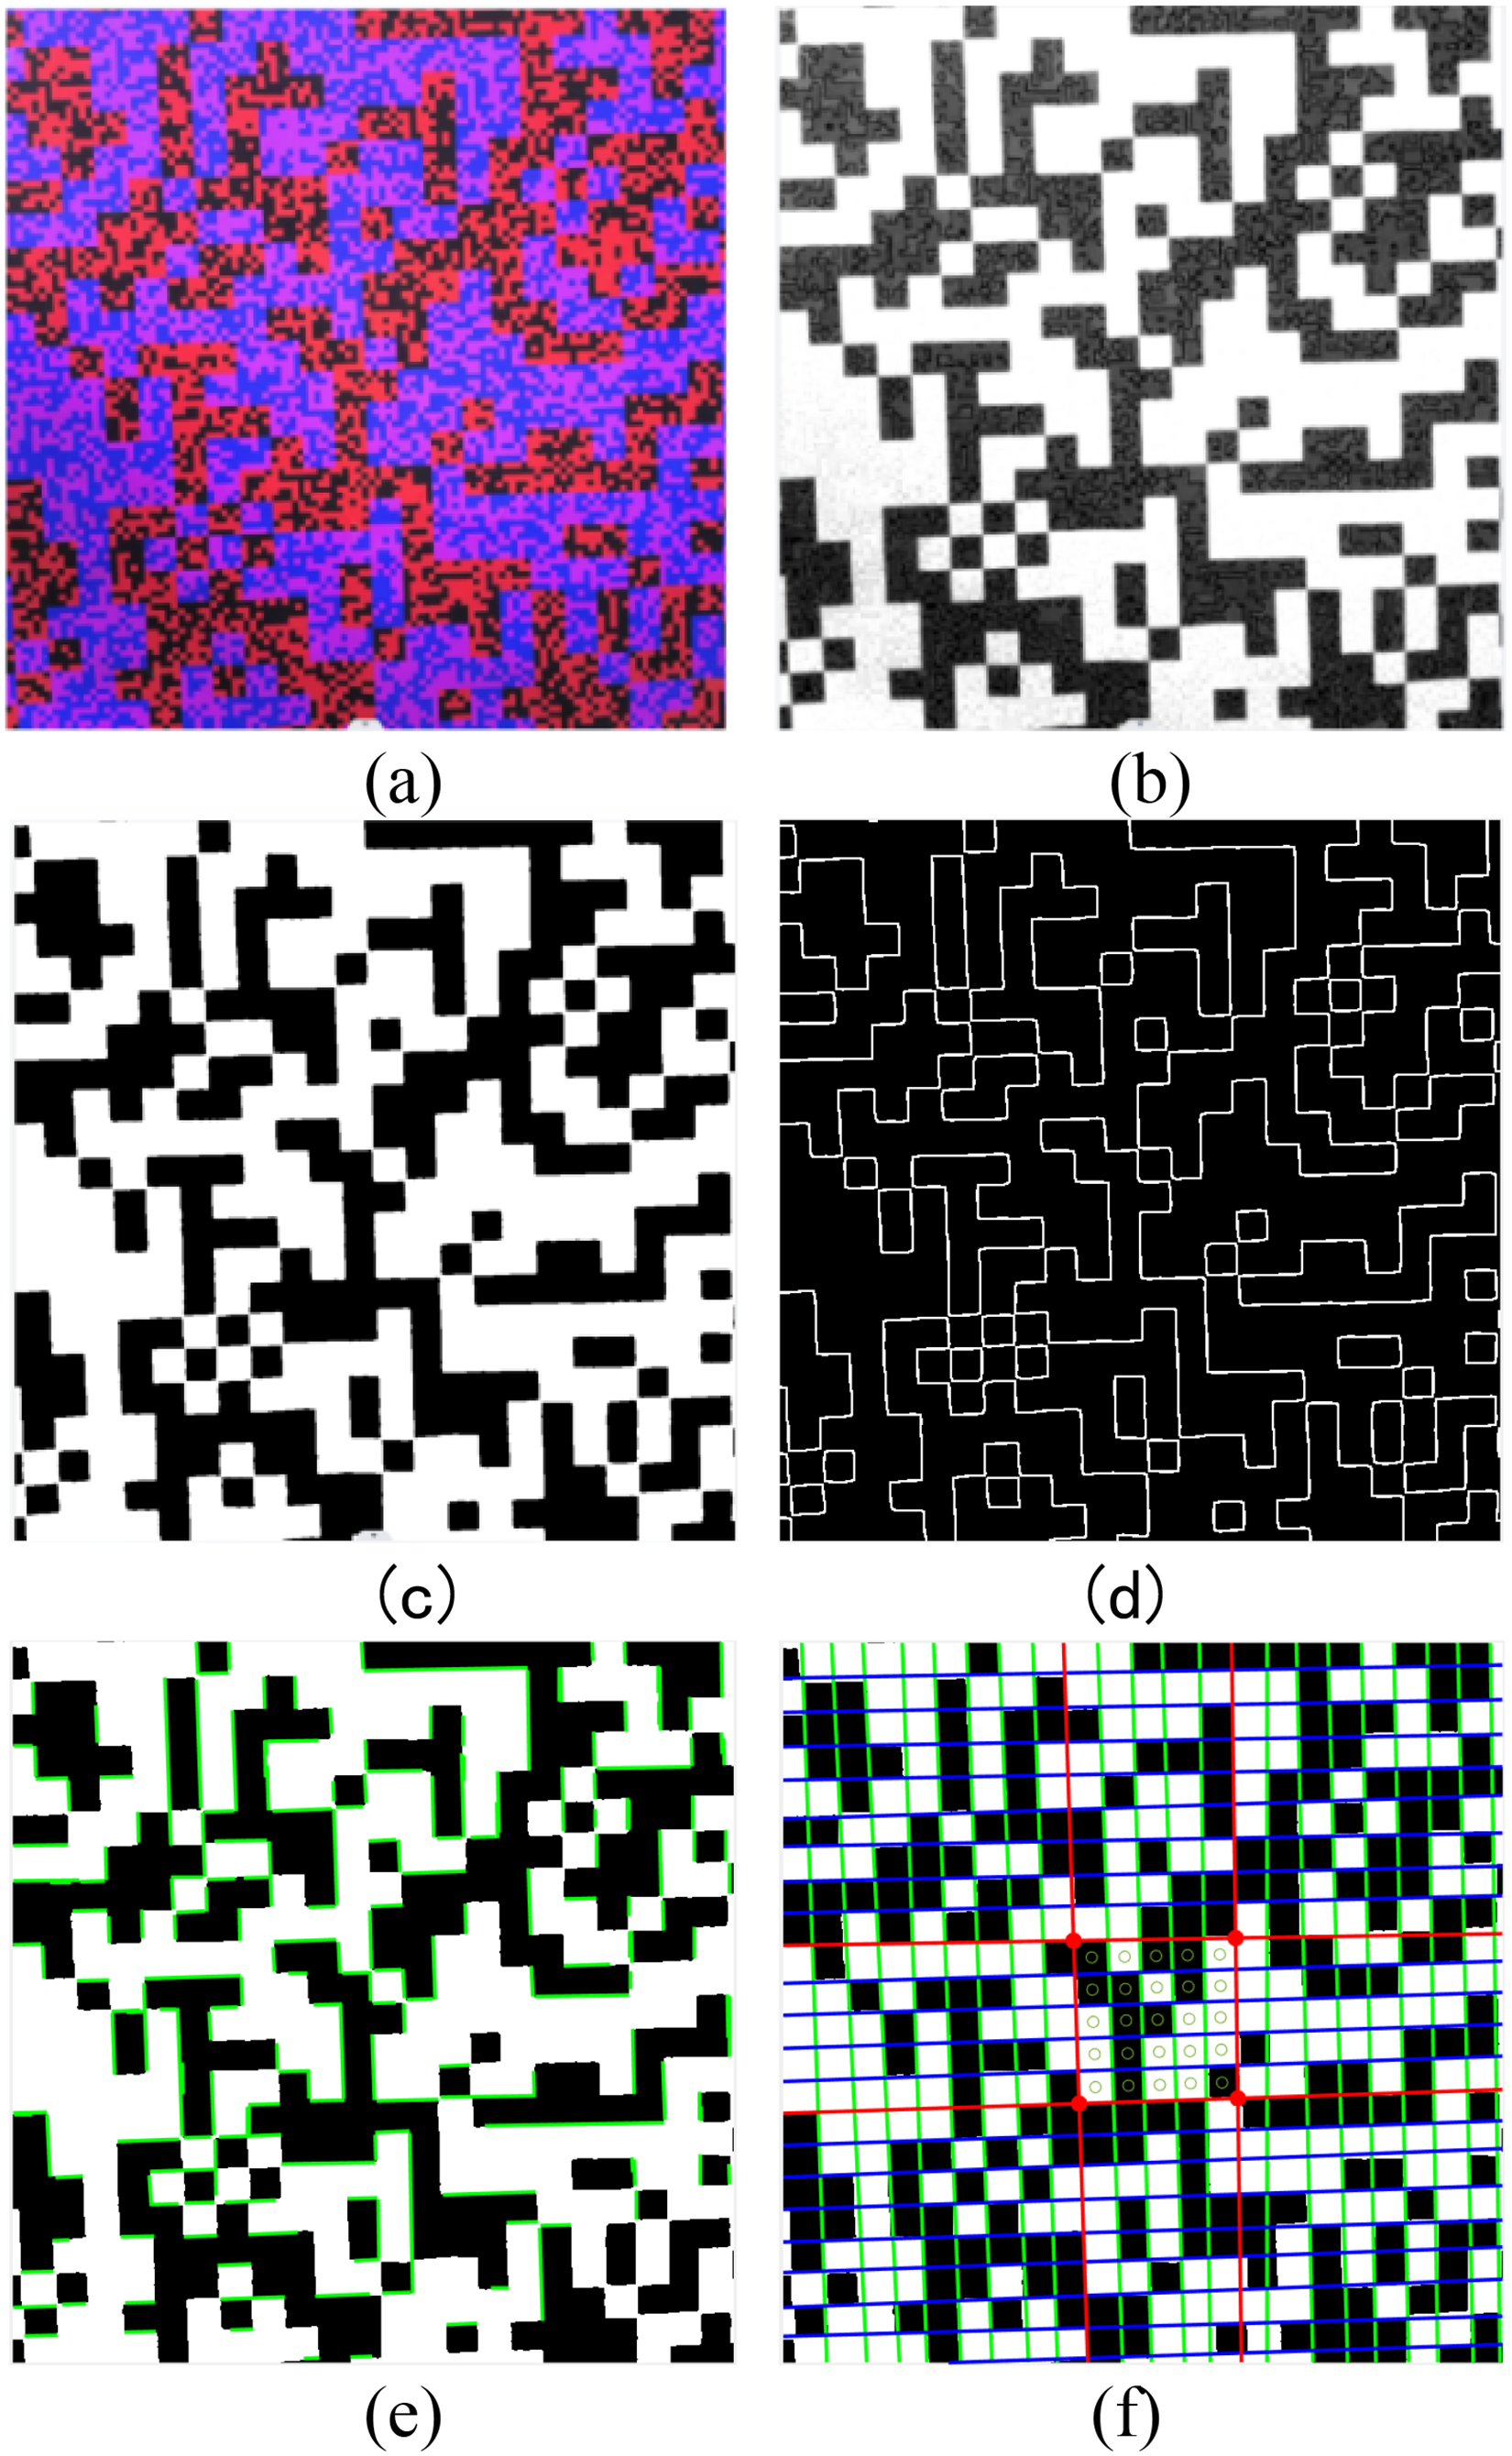
5 × 5 Grid code extraction process.
UAV field landing experiment
After experimental verification, the airborne camera can see the entire color 2D code at a height of about 154 cm, and the entire landing sign can be used as a positioning sign. When it is about 18∼154 cm, the coding and extraction effect is poor because the red channel grid is too small. At this time, the blue channel is extracted, and within the range of 1250 mm × 1250 mm of the whole pattern, any 5 × 5 large grid of the whole pattern can be relied on to complete the positioning. When it is between 8 and 18 cm, the red channel with the descending pattern can be extracted, and the positioning can still be completed by relying on any 5 × 5 small grid of the pattern. When it is below 8 cm, the minimum 5 × 5 grid cannot be met, and the positioning fails. At this time, the landing gear with the height of 8 cm can deal with this problem. In this way, the whole landing position can be realized. If the UAV cannot observe the landing sign due to deviation, it needs to fly to the landing area again and take pictures of the sign. Due to the ability to locate the landing pattern horizontally and continuously, the probability of losing the landing sign is reduced, thus reducing the number of missed flights.
The following is the shooting sampling of the down scaling process. The first row of Figure 11 is the shooting sampling of 150, 20, and 8 cm, respectively. The second row is the image without blocking brightness algorithm processing, the third row is the image after blocking brightness algorithm processing, the fourth row is the image after edge extraction, and the fifth row is the image extracted by grid coding. Where the first and second columns extract the blue channel image, and the third column extracts the red channel.

Landing process sampling and coding extraction.
The UAV landing process is shown in Figure 12(a), which represents the landing process from 154 to 21 cm. The horizontal axis represents the time series, and the vertical axis has three lines, which are the flight height and the horizontal and vertical coordinates. The sampling of the landing pose of the drone from 55 to 21 cm is shown in Figure 12 (b). The position and angle of the cone represent the pose of the UAV, the numbers indicate the sampling order, and the discontinuous numbers indicate that the pose of the frame image was not successfully calculated. This article conducted a large number of UAV positioning experiments. The position and angle of the cone represent the attitude of the UAV, while the numbers indicate the sampling order, indicating that our algorithm can achieve continuous positioning. When the UAV does not completely lose Dual channel uniqueness coding during landing, as long as any 5 × 5 coding area can be extracted, continuous precise positioning and pose measurement of the drone can be achieved.

Landing trajectory and pose sampling.
Measure results and error analysis
The diagram of continuous pose calculation is shown in Figure 13. When the UAV flies through each grid in the horizontal position, a new coding area will be formed, so as to realize the continuous positioning in the horizontal direction. The same is true in the vertical direction. The measurement results of the vertical position of the UAV are shown in Table 1, and the accuracy of the vertical displacement measurement is always maintained at a high value, which can realize the continuous positioning of the UAV.

Landing positioning process.
Vertical position measurement results.

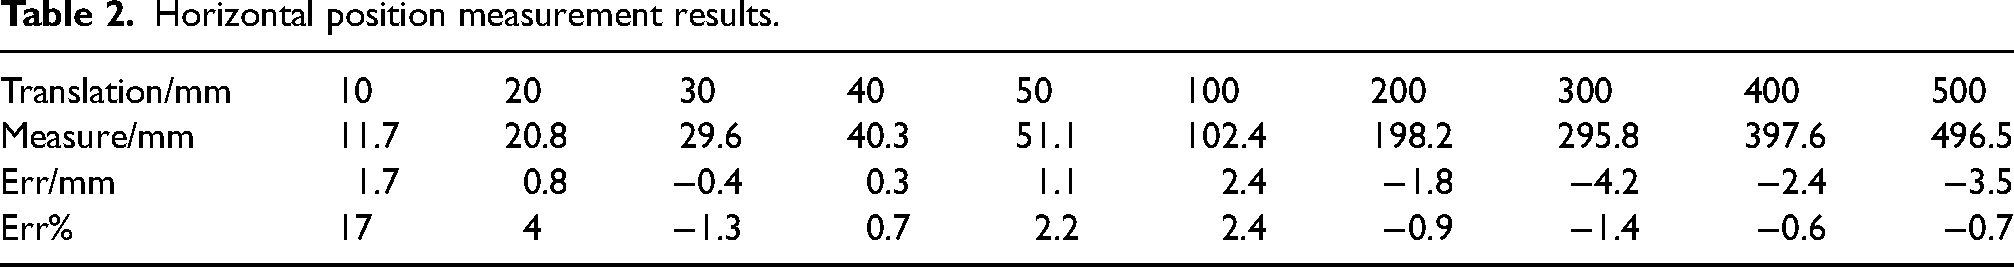
The horizontal position measurement results of the UAV at the height of 0.5 m are shown in Table 2. The horizontal displacement measurement still maintains a high accuracy, which can realize the continuous positioning of the UAV and the position of the UAV is not easy to lose.
Horizontal position measurement results.
In the real landing process of UAV, the landing environment may be various, for example, the landing sign may not be completely placed horizontally on the ground. In order to verify the robustness of the algorithm in different situations, the following tests are carried out.
The first row of Figure 14 shows the images of the camera optical axis and the normal line of the landing sign, 10°, 20°, 30°, and 40°, respectively. The second row shows the coding and extraction results of each angle. It can be seen that the algorithm can still accurately extract the coding grid when the landing sign is tilted at a certain angle, and has good robustness. When the angle exceeds 40°, the image is deformed due to the large tilt of the image, and the extraction of the coding grid will fail with a certain probability.
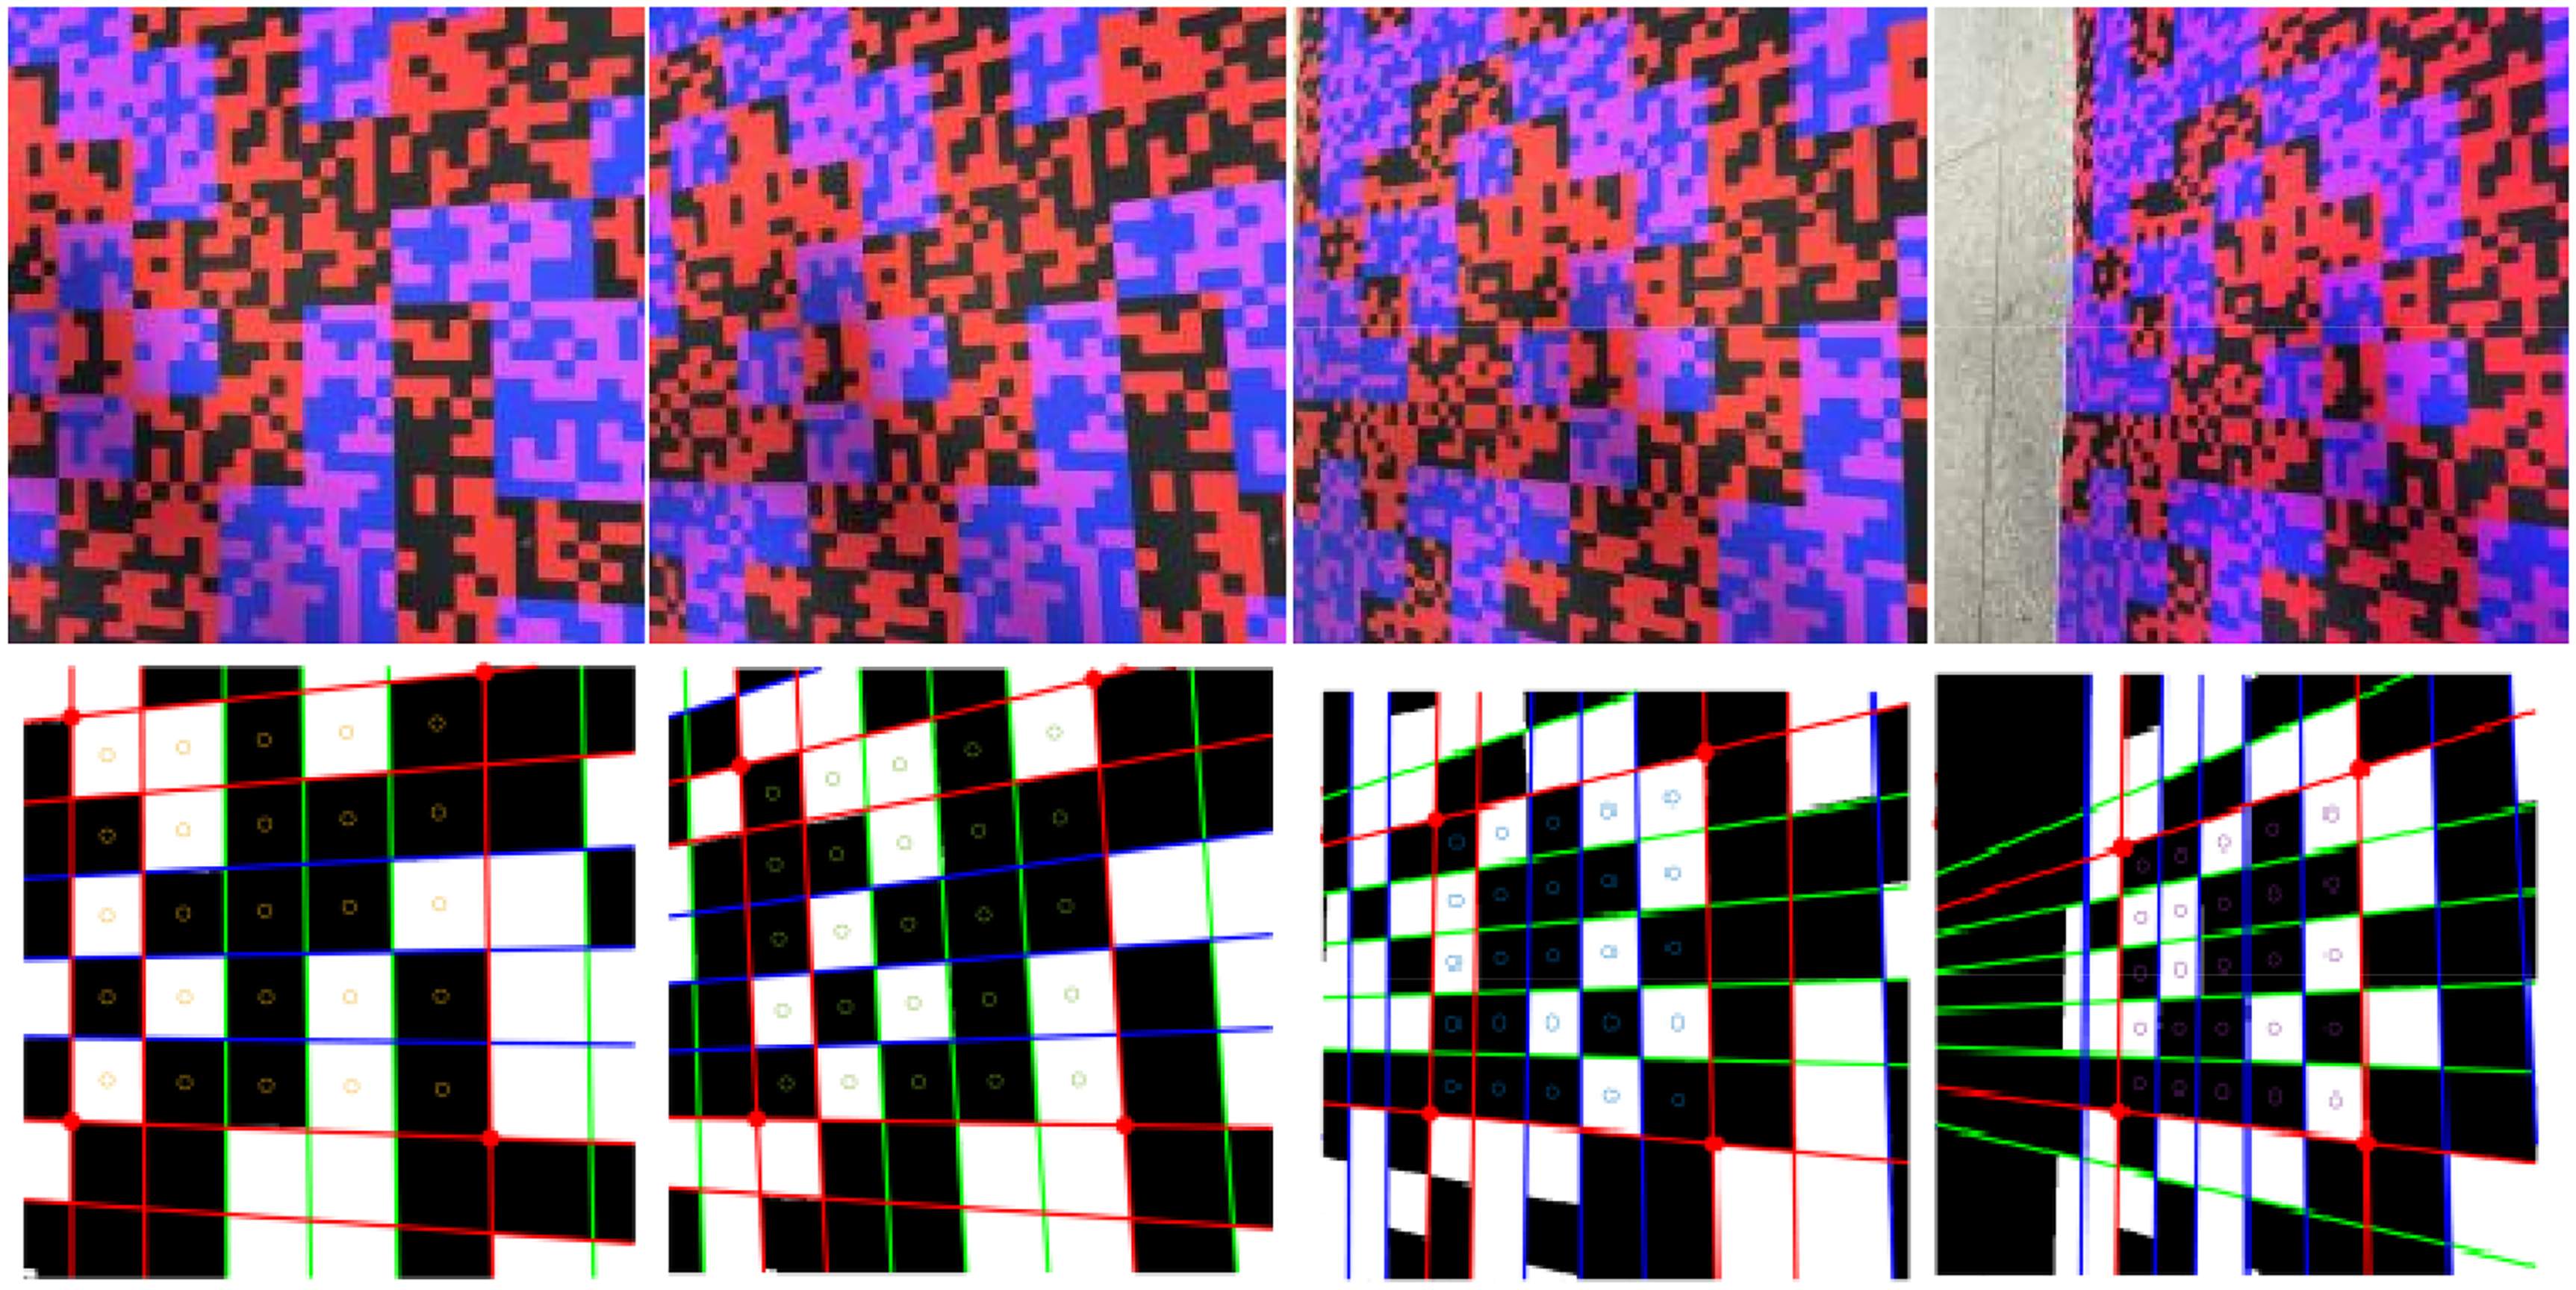
Coding extraction results at different angle.
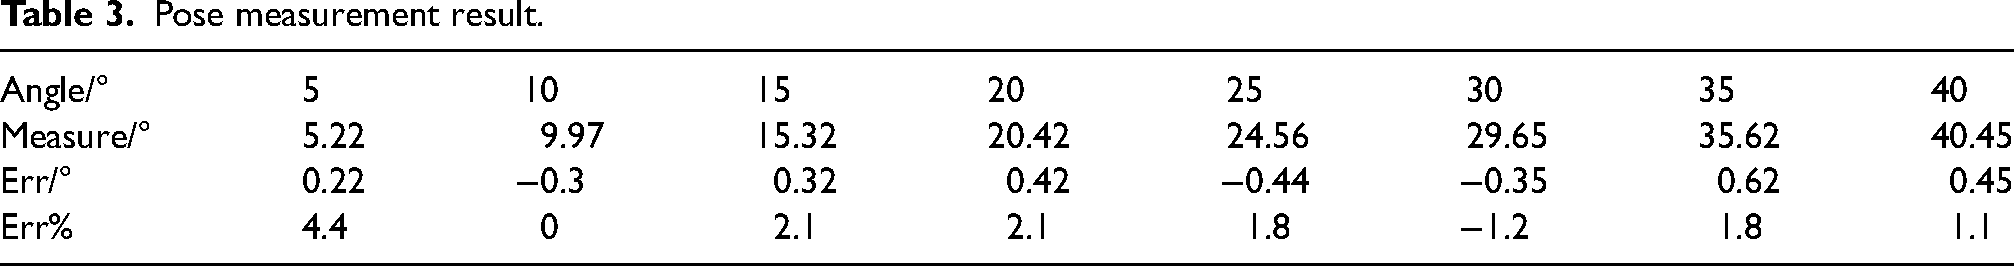
Table 3 shows the attitude measurement results at a height of 0.5 m. It can be seen that continuous high-precision measurement of UAV attitude can still be achieved even when the UAV tilts significantly.
Pose measurement result.
In addition to the technical index factors of the equipment itself, the measurement error in this project will cause certain image blur due to flight jitter, which will affect the position accuracy of the feature points, and then affect the pose calculation accuracy of the UAV. In addition, under the influence of strong illumination, the landing sign may appear reflective, resulting in the failure of the sign extraction, so the landing sign should be made of nonreflective materials.
We compared several common UAV visual localization algorithms in Table 4, where the effective distance is related to the camera field of view, resolution, and the size of landing markers, while real-time performance is related to hardware level and algorithm complexity. The algorithm proposed in this article, which use a double-layer unique encoding as the landing marker, can achieve continuous localization in both horizontal and vertical directions at a larger scale, while none of the above methods have, and the accuracy of this article is higher than the above methods.
Comparison of UAV visual localization algorithms.

UAV: unmanned aerial vehicle.
Conclusions
Aiming at the existing visual relative pose measurement system is prone to losing landing targets and resulting in landing failure when encountering crosswind and landing platforms motion interference, a visual landing system based on visual dual channel uniqueness encoding pattern is designed. At long distance, the whole pattern can be used as the landing sign. At short distance, the red and blue channels will be extracted. Any internal 5 × 5 black and white grid is used as the landing sign, and the dual channel encoding recognition and positioning algorithm is given based on the sign. According to the test, as long as any 5 × 5 coding region can be extracted, continuous accurate positioning and pose measurement of the UAV can be completed.
Footnotes
Declaration of conflicting interests
The authors declared no potential conflicts of interest with respect to the research, authorship, and/or publication of this article.
Funding
The authors disclosed receipt of the following financial support for the research, authorship, and/or publication of this article: National Natural Science Foundation of China (grant number 62273274).