
Abstract
Objective:
This study aimed to analyze the function of metastasis suppressor 1 (MTSS1) in triple negative breast cancer (TNBC).
Methods:
MTSS1 expression in 30 TNBC and paracancerous tissues was measured by quantitative reverse transcriptase polymerase chain reaction. The prognostic value of MTSS1 was assessed by Kaplan–Meier analysis followed by the log-rank test. MCF7 cells were transfected with si-MTSS1, while MDA-MB-231 cells were transfected with pcDNA3.1-MTSS1. Cell proliferation assay and transwell assay were performed to investigate the effects of MTSS1 on the biological behavior of breast cancer cells. Immunofluorescence and western blot were used to detect the influence of MTSS1 on epithelial–mesenchymal transition (EMT) markers.
Results:
MTSS1 expression was significantly lower in TNBC tissues compared with that in paracancerous tissues (0.012 vs. 0.370; P = 0.006). A lower MTSS1 expression level was also found in tumor tissues of patients with lymph node metastasis (P = 0.002) or tumor node metastasis stage (P = 0.010). Patients with low expression of MTSS1 (⩽ 0.009) had shorter disease-free survival (47.4 vs. 56.0 months; P = 0.012). The knockdown of MTSS1 in MCF7 cells inhibited cell proliferation, enhanced cell migration and invasion capacities, decreased the E-cadherin level, and increased the vimentin level, whereas overexpression of MTSS1 in MDA-MB-231 cells had the opposite effects (P < 0.05).
Conclusions:
Our findings demonstrated that MTSS1 regulates proliferation, invasion, migration, and EMT in TNBC, and that decreased MTSS1 is associated with shorter disease-free survival.
Keywords
Introduction
Breast cancer is the most common cancer in women worldwide, including China.1,2 Triple-negative breast cancer (TNBC), accounting for approximately 20% of all breast cancers, is a highly aggressive subtype of breast cancer characterized by the negative expression of the estrogen receptor (ER), the progesterone receptor (PR), and the human epidermal growth factor receptor 2 (HER2). 3 Due to lack of effective molecular targets for its treatment, TNBC has a poor clinical outcome.4-6 Therefore, the molecular mechanisms underlying TNBC need to be explored.
Metastasis and invasion are the hallmarks of cancer cells. Epithelial–mesenchymal transition (EMT) leads to loss of cell–cell adhesion and cell polarity, and the acquisition of migratory and invasive properties 7 ; thus, it is being considered as a new target for anticancer drug discovery. 8 Metastasis suppressor 1 (MTSS1; also known as Missing in Metastasis) is a 755 amino acid protein that binds to actin and promotes cytoskeleton organization, which inhibits the metastatic ability of cancer cells. 9 It is reported that MTSS1 plays a critical role in carcinogenesis and cancer metastasis. 10 Accumulating evidence has demonstrated the aberrant expression of MTSS1 in multiple cancer types. MTSS1 was reported to be a tumor suppressor to suppressing cancer metastasis, and its low expression was associated with poor prognosis in various cancers: bladder, gastric, breast, pancreatic, colorectal, ovarian, and lung.10-17 However, MTSS1 was also found to act as a metastasis driver in some tumors, such as melanomas, non-small cell lung, and hepatitis B-related hepatocellular carcinoma.11,18,19 Therefore, the function of MTSS1 in different cancers, especially TNBC, requires further investigation.
In this study, we examined MTSS1 messenger RNA (mRNA) expression in TNBC tissues and found an inverse correlation between its expression level and clinical pathology and prognosis. In addition, we explored the effects of MTSS1 on cancer cells and its underlying mechanisms.
Materials and methods
Patients
This study included patients with histopathologically confirmed primary TNBC who were admitted to the Shanghai Changning Maternity & Infant Health Hospital from January 2010 to December 2015. Patients underwent radical mastectomy or breast-conserving surgery with TAC, ECT, or ET adjuvant chemotherapy. No radiotherapy or chemotherapy was administered prior to surgery. TNBC cancer tissues and paracancerous tissues (obtained at 3 cm distance from the tumor margin) were collected from each patient for analysis. The paracancerous tissues were taken as a control group.
The present study was approved by the Ethics Committee of the Shanghai Changning Maternity & Infant Health Hospital. All patients provided written informed consent.
Analysis of gene expression using real-time quantitative PCR
RNA extraction was performed using TRIzol reagent (Thermo Fisher Scientific, Waltham, MA, USA), and RNA concentration and purity were assessed using NanoDrop® ND-1000 (Thermo Fisher Scientific). cDNA synthesis was performed using an RNase inhibitor (Epicentre, Madison, WI, USA) and SuperScript™ III Reverse Transcriptase (Thermo Fisher Scientific), and real-time quantitative PCR was performed using qPCR SYBR Green master mix (MedChemExpress, Monmouth Junction, NJ, USA). β-actin was used as an internal reference, and the relative expression of the target gene was calculated using the 2–ΔΔCt method. The primers used are listed in Table 1.
The primers sequences for qRT-PCR.
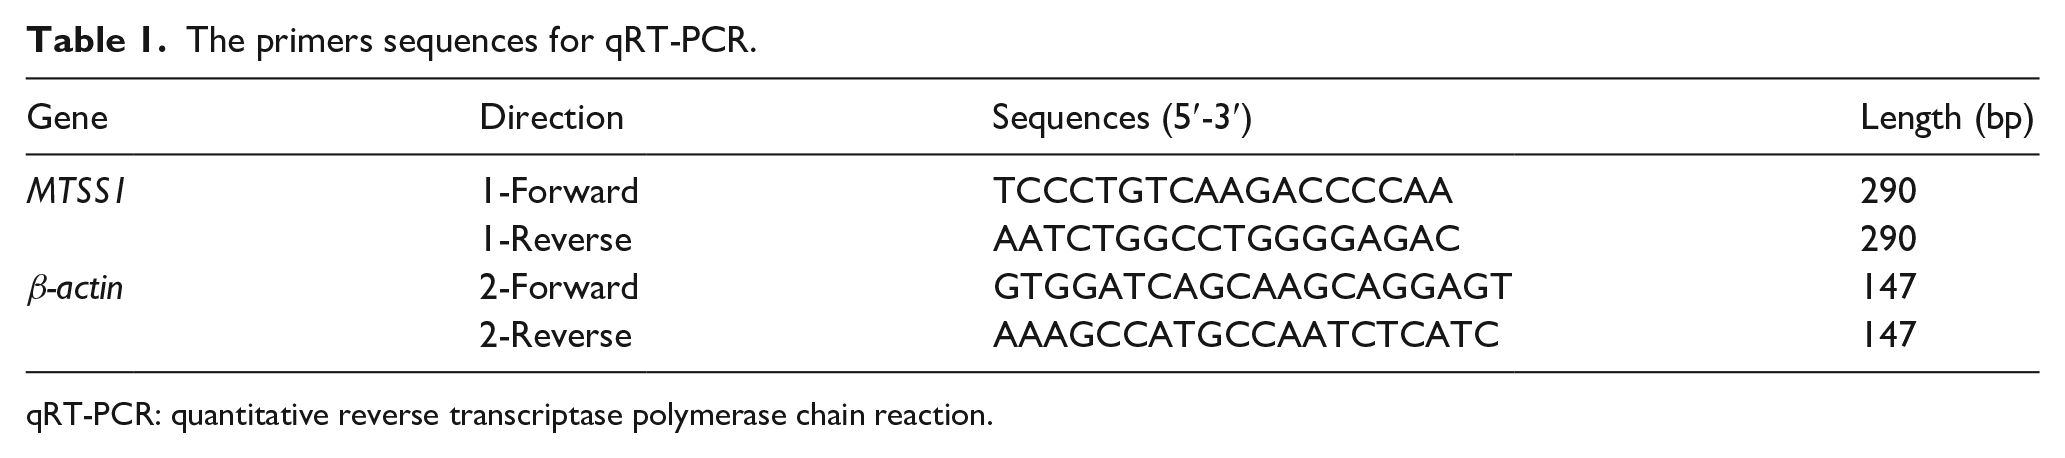
qRT-PCR: quantitative reverse transcriptase polymerase chain reaction.
Cell culture and transfection
MCF-7 cells (a breast cancer cell line with low metastatic capacity) and MDA-MB-231 cells (a breast cancer cell line with high metastatic capacity) were purchased from the Cell Bank of Chinese Academy of Sciences (Shanghai, China). These cells were authenticated by STR analysis and were cultured in Dulbecco’s modified Eagle’s medium (DMEM, Thermo Fisher Scientific) containing 10% fetal bovine serum at 37°C and 5% CO2.
MCF7 cells and MDA-MB-231 cells were seeded on 24-well plates (1 × 10⁵ cells/well) for 18 h. Then, MCF7 cells were transfected with si-MTSS1 and siNC using Lipofectamine® RNAiMAX (Thermo Fisher Scientific), while MDA-MB-231 cells were transfected with pcDNA3.1-MTSS1 and pcDNA3.1 control using Lipofectamine® LTX (Thermo Fisher Scientific).
Cell proliferation assay
At 48 h post transfection, cells were resuspended to obtain a cell suspension, and counted. Cells (2 × 10⁴/well) were seeded into a 96-well plate (three replicate wells per cell) and cultured for 1h. Then, the cells were washed twice with phosphate buffered saline (PBS) and medium in each well was replaced with complete DMEM containing 10% CCK8 (Dojindo, Kumamoto, Japan) and incubated in the dark for 1 h. The absorbance at 450 nm was measured using a microplate reader.
Transwell cell migration assay
At 48 h post transfection, cell suspension was seeded on the upper transwell chamber (Corning, USA) at 4 × 10⁴ cells in 100 μL serum-free medium. Next, 600 μL of medium containing 10% serum was added to the lower chamber. After 24 h incubation at 37°C, the sample was fixed in 4% paraformaldehyde. The cells on the upper membrane were gently wiped away. Cells on the lower membrane were stained with DAPI and photographed under a fluorescence microscope. Five fields of each well were randomly selected. The number of cells in each photograph was counted using the cell counting software, and the number of cells in the five fields of view in each well was measured. Each group had three duplicate wells.
Transwell cell invasion assay
Matrigel was diluted with DMEM (1:3). Next, 20 μL of this mixture was added to the upper surface of each transwell membrane and allowed to solidify at 37°C for 30 min. At 48 h post transfection, cell suspension in each group was added to the upper layer of transwell chamber at 1 × 10⁵ cells in 100 μL serum-free medium. Next, 600 μL of 10% serum was added to the lower layer of the chamber. After 48 h, the sample was fixed in 4% paraformaldehyde. The number of invading cells was counted. Each assay was performed in triplicate.
Immunofluorescence analysis of EMT markers
At 48 h post transfection, the medium was discarded. Cells were rinsed with PBS and fixed in 4% paraformaldehyde for 30 min. The fixative was discarded; cells were treated with 1% Triton solution for 30 min, and then washed with PBS. The blocking solution (1% bovine serum albumin) was added to the plate at 500 μL per well and incubated at room temperature (approximately 25°C) for 1 h. Cells were then washed three times with PBS. The primary antibodies for E-cadherin and vimentin were diluted 1:200, added to the corresponding groups at 200 μL per well, and incubated for 2 h at room temperature. After washing four times with PBS, the green fluorescent-labeled secondary antibody (diluted 1:100, 200 μL per well) was added to the plate, and incubated for 1 h at room temperature. After washing four times with PBS again, cells were counterstained with DAPI solution for 5 min. Images were captured under ×200 magnification by a DMRA fluorescence microscope (Leica, Germany).
Western blot
Tumor cells in the four groups were lysed with RIPA buffer containing a protease inhibitor. The protein concentration was further measured using a bicinchoninic acid protein assay kit (Thermo Fisher Scientific). Proteins were separated on 10% SDS-PAGE and transferred to PVDF membranes (Millipore, USA). The membranes were blocked with 5% skimmed milk in TBST for 1 h and then incubated with primary antibodies of vimentin (ab92547, 1:1000, abcam, USA), E-Cadherin (ab40772, 1:2000, abcam, USA), ZEB1 (ab203829, 1:500, abcam, USA) at 4°C overnight. After being washed with TBST, the membranes were incubated with HRP-conjugated goat anti-rabbit IgG (JIR111-035-003, 1:10000, Jackson ImmunoResearch, West Grove, PA, USA). GAPDH was used as the internal control.
Statistical analyses
All data were expressed as mean ± SD and analyzed using SPSS 19.0 software. Differences in MTSS1 expression between TNBC tumor and paracancerous tissues were compared using a paired t-test. Patients were divided into MTSS1 low or high expression group based on the median value. Relationship between MTSS1 expression and clinicopathological characteristics was determined using Chi-square or Fisher’s exact tests. The prognostic value of MTSS1 was assessed using the Kaplan–Meier survival analysis followed by the log-rank test. P < 0.05 was considered statistically significant.
Results
MTSS1 expression is decreased in TNBC tumor tissues and associated with poor prognosis
A total of 30 TNBC patients were included in this study. The median age was 50.67 ± 10.80 years. In order to investigate the role of MTSS1 in TNBC, we examined its mRNA levels in TNBC tumor and paracancerous tissues. The expression of MTSS1 in tumor tissues was strikingly lower than that in paracancerous tissues (0.012 ± 0.009 vs. 0.370 ± 0.667; P = 0.006; Figure 1(a)). Table 2 shows the association between MTSS1 expression and clinicopathological characteristics of patients. The median expression of MTSS1 in patients was 0.009. Low MTSS1 expression was significantly associated with lymph node metastasis (P = 0.002) and tumor node metastasis (TNM) stage (P = 0.010) and poor survival (P = 0.011).
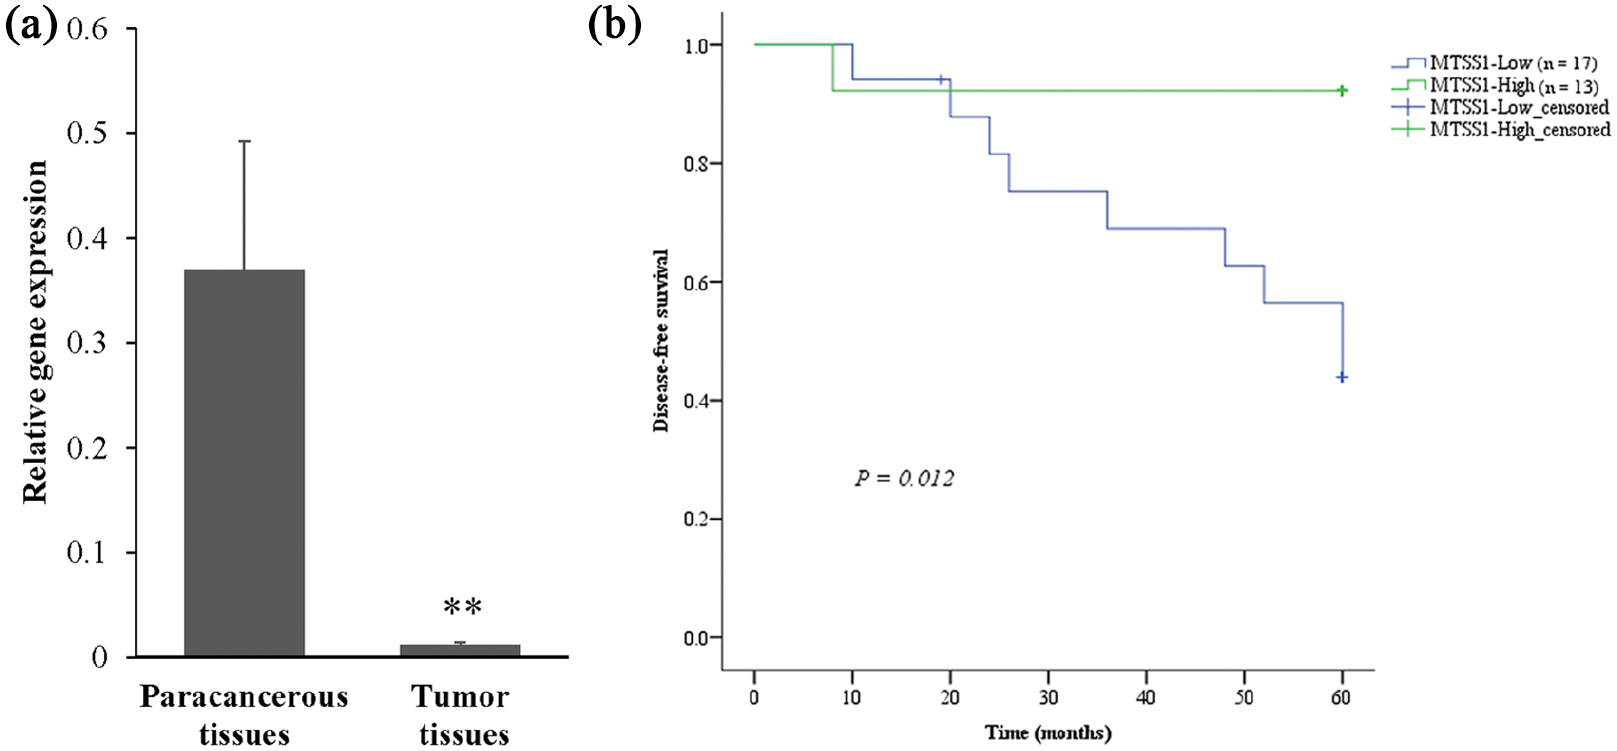
MTSS1 expression in triple-negative breast cancer (TNBC) tumor tissues (n = 30) and its association with disease-free survival. (a) Comparison of MTSS1 expression between TNBC tumor and paracancerous tissues by qRT-PCR. (b) Kaplan–Meier analysis of disease-free survival for MTSS1 expression. Data are expressed as mean and standard deviation (D).
Relationship between MTSS1 expression and clinicopathological characteristics of triple-negative breast cancer.
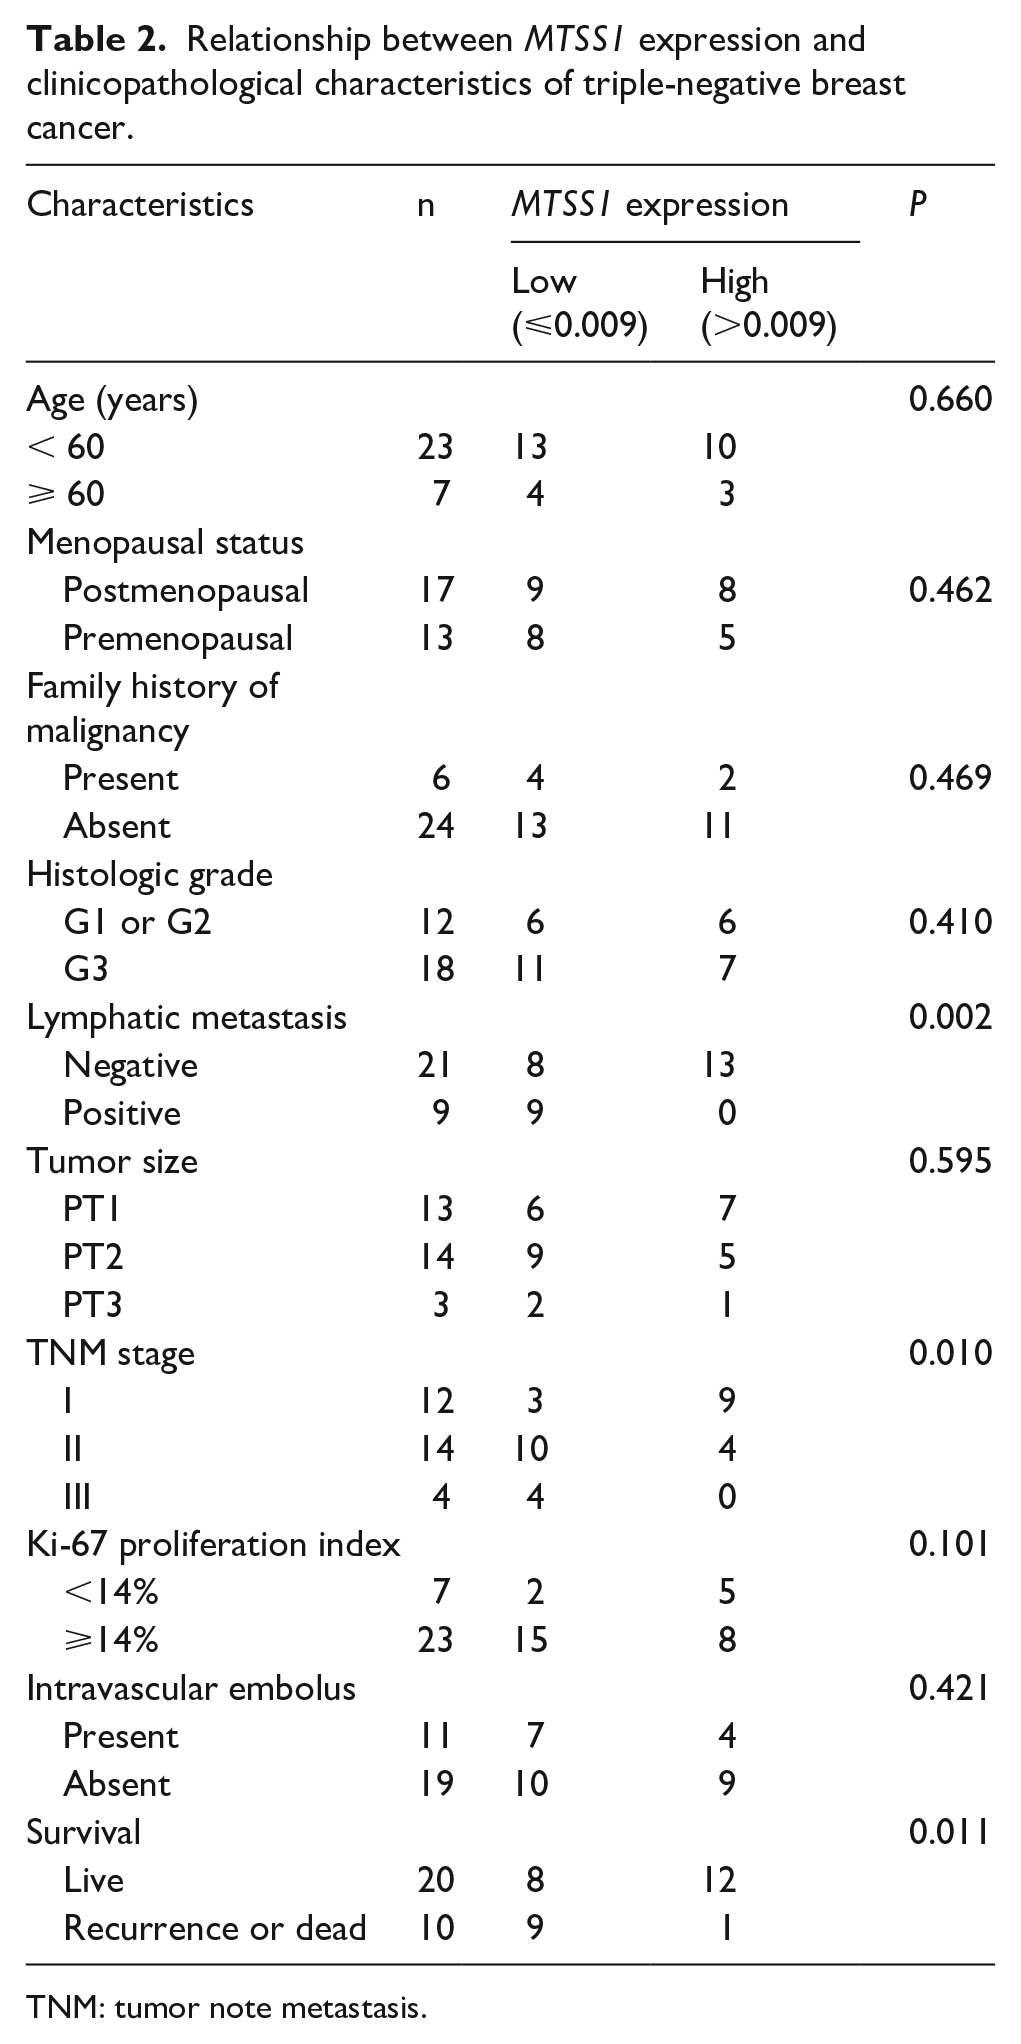
TNM: tumor note metastasis.
MTSS1 expression is positively correlated with clinical outcome
To evaluate the prognostic value of MTSS1 expression in patients with TNBC, we analyzed the association of MTSS1 expression with the clinical outcome of patients following surgery. Thus, patients with an expression of >0.009 were classified as the MTSS1 high expression group (n = 13), and those with an expression of ⩽0.009 were classified as the MTSS1 low expression group (n = 17). The median disease-free survival (DFS) of patients in the low expression group was 47.4 months (95% confidence interval (CI) 38.6, 56.2), which was shorter than that of patients in the high expression group (56.0 months; 95% CI 48.5, 63.5; P = 0.012) (Figure 1(b)). These results suggested that low MTSS1 expression was significantly associated with poor outcome in patients with TNBC.
MTSS1 affects the proliferation, migration, and invasion capacities of breast cancer cells
To determine the effect of MTSS1 on cancer cells, MTSS1 expression was suppressed in MCF-7 cells by transfection with si-MTSS1, while MTSS1 was overexpressed in MDA-MB-231 cells by transfection with pcDNA3.1-MTSS1.
Downregulation of MTSS1 reduced cell proliferation capacity of MCF7 cells (P = 0.004), while overexpression of MTSS1 enhanced the proliferation capacity of MDA-MB-231 cells (P = 0.008; Figure 2(a)). Transwell migration experiments showed that the relative number of migrated MCF7 cells in the si-MTSS1 group was increased by 125% compared with that in the control group (P = 0.001), whereas the relative number of migrated MDA-MB231 cells in the pcDNA3.1-MTSS1 group was decreased by 69% compared with that in the control group (P < 0.001; Figure 2(b) and (d)). Similarly, transwell invasion assay showed that the relative number of invaded MCF7 cells in the si-MTSS1 group was increased by 90% compared with that in the control group (P = 0.014), whereas the relative number of migrated MDA-MB231 cells in the pcDNA3.1MTSS1 group was decreased by 41% compared with that in the control group (P = 0.017; Figure 2(c) and (d)). These results demonstrate that downregulation of MTSS1 expression enhances the migration and invasion capacities of MCF7 cells, while overexpression of MTSS1 inhibits the migration and invasion capacities of MDA-MB-231 cells.
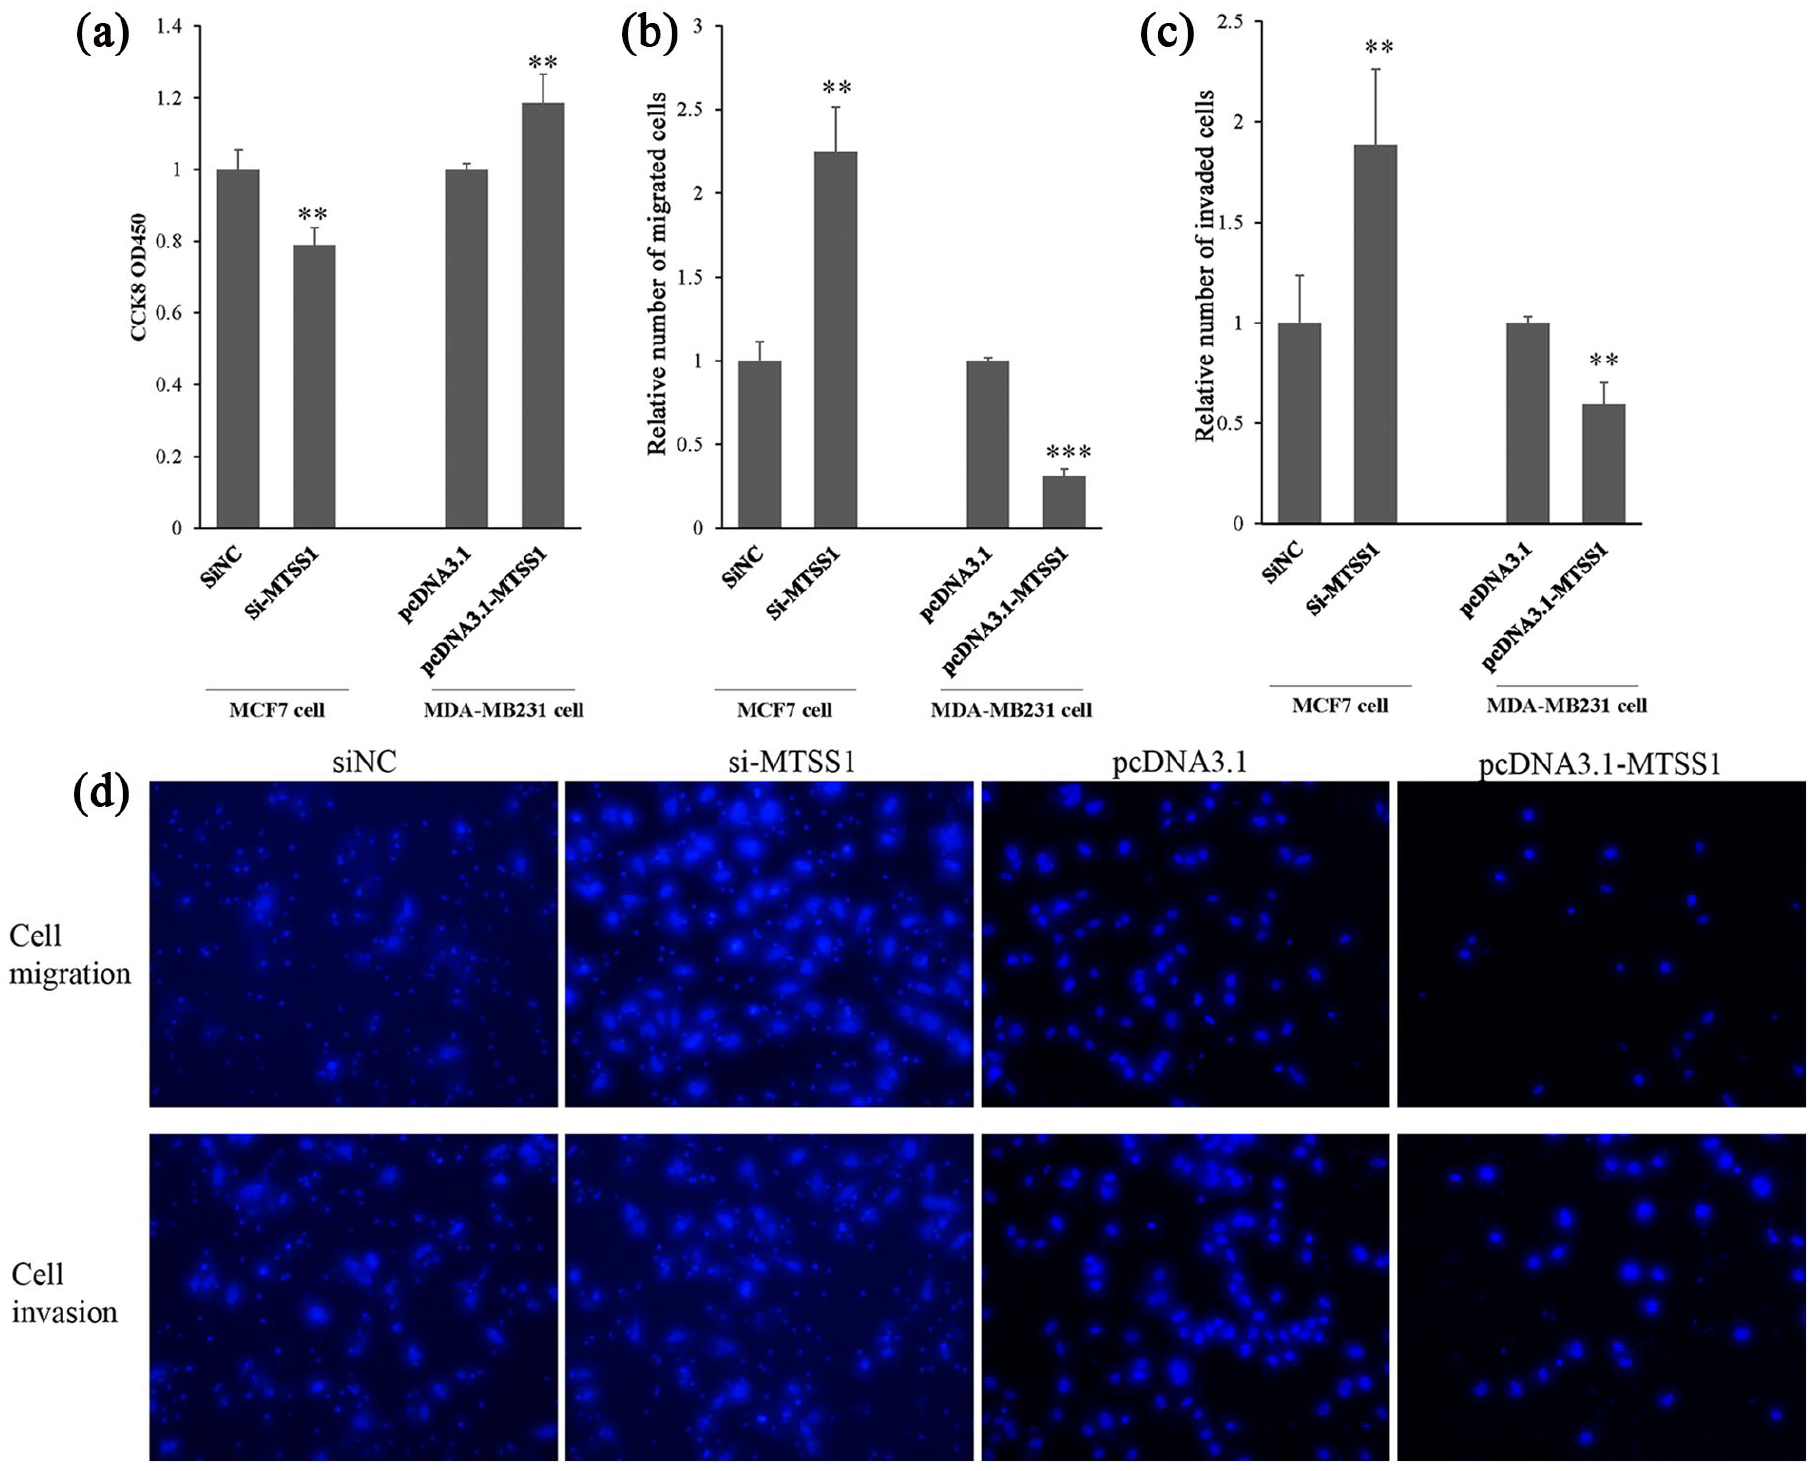
Influence of MTSS1 expression on the (a) proliferation, (b) migration, and (c) invasion of breast cancer cells. Data were represented as mean ± SD of three independent experiments.
MTSS1 affects the expression of EMT markers in breast cancer cells
Immunofluorescence results showed that E-cadherin level decreased and vimentin level increased in MCF7 cells after downregulation of MTSS1 expression, while the E-cadherin level increased and vimentin level decreased in MDA-MB-231 cells after overexpression of MTSS1 (Figure 3(a)). Further, western blot analysis showed consistent results with immunofluorescence (Figure 3(b) and (c)). Taken together, these results suggested that dysregulation of MTSS1 affects EMT in breast cancer cells.
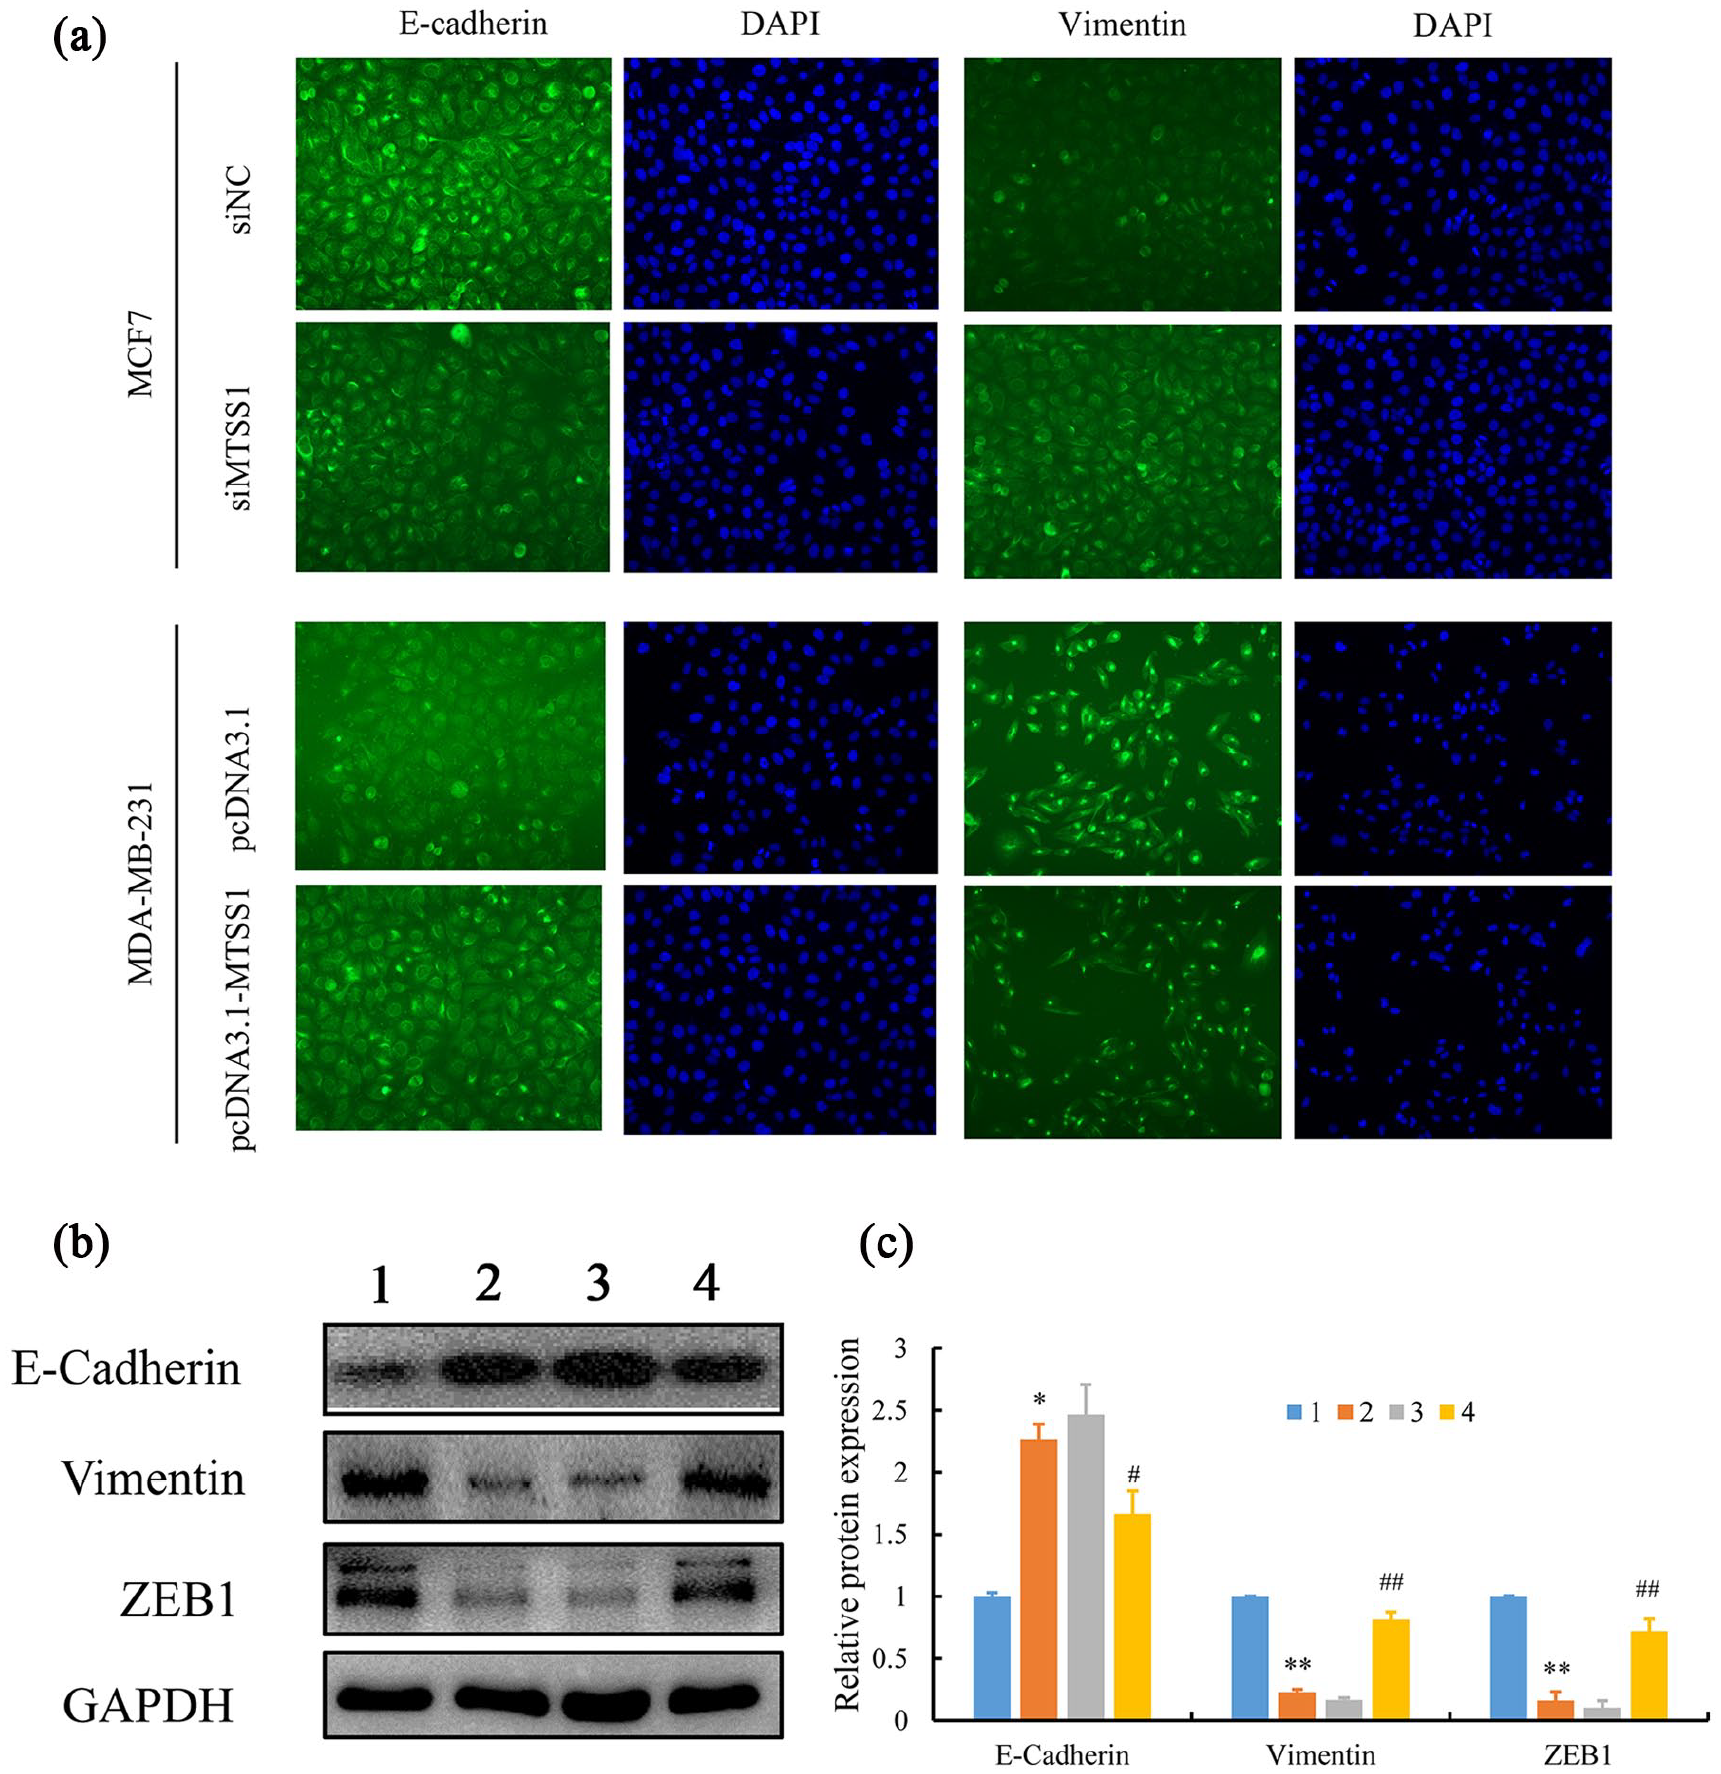
Influence of MTSS1 expression on epithelial-to-mesenchymal transition markers in breast cancer cells. (a) Representative immunofluorescence images of E-cadherin and vimentin expression in MCF-7 cells after MTSS1 silencing and in MDA-MB231 cells overexpressing MTSS1. (b) Western blot analysis of protein expression of EMT markers in MCF-7 cells and MDA-MB-231 cells. (c) Relative expression levels of EMT markers determined by western blot. Data were represented as mean ± SD of three independent experiments. Lane 1, pcDNA3.1; lane 2, pcDNA3.1-MTSS1; lane 3, si-NC; and lane 4, si-MTSS1.
Discussion
To the best of our knowledge, this study is the first to report the role of MTSS1 in TNBC from a clinical aspect. We demonstrated that expression of MTSS1 in TNBC tissues was significantly decreased compared with that in paracancerous tissues. Low expression of MTSS1 in TNBC tissues was associated with lymph node metastasis and TNM stage as well as shorter DFS. In vitro experiments further demonstrated that reduced MTSS1 expression suppressed proliferation and promoted migration and invasion of breast cancer cells, thus supporting the role of MTSS1 as a tumor suppressor in TNBC progression.
MTSS1 plays a key role in the maintenance of cell–cell adhesions and its dysregulation correlates with tumor progression in several cancer types. However, the results were inconsistent among different cancer types. Several studies have investigated the role of MTSS1 in patients with breast cancer. Parr and Jiang 10 found that the protein expression of MTSS1 was dramatically reduced in breast tumor tissues, especially in patients with poor outcome in terms of recurrence, metastasis, and death, and it was a potential prognostic indicator for DFS. ER-negative patients had a lower level of MTSS1 protein than ER-positive patients. 20 In HER2+/ER−/PR− breast cancer patients, decreased MTSS1 expression was correlated with reduced survival and worse prognosis. 20 In this study, we showed that low expression of MTSS1 in TNBC tissues was associated with lymph node metastasis and TNM stage as well as shorter DFS, suggesting that MTSS1 might play a role in governing the metastatic nature of breast cancer cells.
Tumor metastasis involves changes in cell proliferation, degradation, and movement, which are mediated by a series of related genes and molecules, such that the tumor cells infiltrate surrounding tissues and blood vessels, and form new tumors at the metastatic site. EMT is a biological process in which epithelial cells assume a mesenchymal cell phenotype, and plays an important role in the migration and invasion of epithelial-derived malignant tumor cells. 7 During the process of EMT, the expression of the epithelial cell marker E-cadherin is often downregulated, resulting in decreased intercellular proliferation, while the expression of the interstitial cell marker vimentin is increased, leading to enhanced cell migration. Previous studies have found that MTSS1 can enhance intercellular connectivity through GTPase, and MTSS1 deletion may affect cell-to-cell structural stability, thereby promoting EMT and metastasis. 21 Other studies have shown that MTSS1 is an actin-associated protein that contains the F-actin and G-actin binding domains, which bind to actin and induce the formation of pseudopod-like plasma membrane processes.9,22 It is known that cytoskeletal proteins can maintain cell morphology, movement, proliferation, and mitosis, and polymerization and depolymerization of actin can regulate the morphology and movement of tumor cells. Thus, the MTSS1 signaling pathway may play an important role in the EMT process of TNBC cells.
The MCF7 cell line (luminal A subtype, positive ER and/or PR expression, without HER2 overexpression) has a low invasive potential, while the MDA-MB-231 cell line (basal like subtype, negative ER and/or PR expression, without HER2 over-expression) has a high invasive potential.23,24 MTSS1 is strongly expressed in MCF7 cells, but hardly expressed in MDA-MB-231 cells. 10 Here, we found that when the expression of MTSS1 in MCF7 cells was silenced, the number of migrated and invaded cells was increased, suggesting that the silencing of MTSS1 promoted breast cancer cell migration and invasion. A cell proliferation assay showed that the downregulation of MTSS1 expression restrained breast cancer cell proliferation. Immunofluorescence results showed that the silencing of MTSS1 decreased the E-cadherin level and increased the vimentin level. However, overexpression of MTSS1 in MDA-MB-231 cells showed the opposite results regarding the properties of cancer cells and the expression of EMT markers. Combined with the clinical analysis, we concluded that low expression of MTSS1 in TNBC tissues inhibited cancer cell proliferation and enhanced cell migration and invasion by promoting EMT, leading to a high risk of lymph node metastasis and intravascular embolus, eventually predicting a poor survival prognosis.
Our study supported the suppressor role of MTSS1 in TNBC. However, there are several limitations to this study. First, since the sample size was relatively small, the results should be verified using a larger cohort. Second, the upstream and downstream regulatory molecules related to MTSS1 in TNBC need to be further explored.
Conclusions
MTSS1 had a low expression in TNBC tissues and was found to be associated with lymph node metastasis and TNM stage. Furthermore, this clinical finding was validated in our in vitro experiments. We showed that the silencing of MTSS1 enhanced cell migration and invasion and promoted EMT, while overexpression of MTSS1 prevented cell migration and invasion and reduced EMT. Thus, our study provides a new direction for effective clinical interventions, and suggests that MTSS1 may serve as a potential prognostic biomarker for TNBC.
Supplemental Material
Supplementary_materials_for_review – Supplemental material for Metastasis suppressor 1 acts as a tumor suppressor by inhibiting epithelial-to-mesenchymal transition in triple-negative breast cancer
Supplemental material, Supplementary_materials_for_review for Metastasis suppressor 1 acts as a tumor suppressor by inhibiting epithelial-to-mesenchymal transition in triple-negative breast cancer by Jinling Yu, Weida Shen, Beimin Gao, Jinping Xu and Bo Gong in The International Journal of Biological Markers
Footnotes
Declaration of conflicting interest
The author(s) declared no potential conflicts of interest with respect to the research, authorship, and/or publication of this article.
Funding
The author(s) disclosed receipt of the following financial support for the research, authorship, and/or publication of this article: This study was supported by Shanghai Changning District Science and Technology Commission, Shanghai, China (No. CNKW2016Y13).
References
Supplementary Material
Please find the following supplemental material available below.
For Open Access articles published under a Creative Commons License, all supplemental material carries the same license as the article it is associated with.
For non-Open Access articles published, all supplemental material carries a non-exclusive license, and permission requests for re-use of supplemental material or any part of supplemental material shall be sent directly to the copyright owner as specified in the copyright notice associated with the article.