
Abstract
This study was designed to identify the potential key protein interaction networks, genes, and correlated pathways in early-onset colorectal cancer (CRC) via bioinformatics methods. We selected microarray data GSE4107 consisting 12 patient’s colonic mucosa and 10 healthy control mucosa; initially, the GSE4107 were downloaded and analyzed using limma package to identify differentially expressed genes (DEGs). A total of 131 DEGs consisting of 108 upregulated genes and 23 downregulated genes of patients in early-onset CRC were selected by the criteria of adjusted P values <.01 and |log2 fold change (FC)| ≥ 2. The gene ontology functional enrichment analysis and the Kyoto Encyclopedia of Genes and Genomes (KEGG) pathway analysis were accomplished to view the biological process, cellular components, molecular function, and the KEGG pathways of DEGs. Finally, protein–protein interactions (PPIs) were constructed, and the hub protein module was identified. Genes such as ACTA2, ACTG2, MYH11, CALD1, MYL9, TPM2, and LMOD1 were strongly implicated in CRC. In summary, in this study, we indicated that molecular mechanisms were involved in muscle contraction and vascular smooth muscle contraction signaling pathway, which improve our understanding of CRC and could be used as new therapeutic targets for CRC.
Introduction
Colorectal cancer (CRC) is one of the most common malignant diseases in the world, and its incidences increased with age. According to estimates, more than 777 000 of new cases with CRC were registered in 2015 in the developed countries, 1,2 there were about 376 000 of new CRC cases and 191 000 of death were reported in 2015 in China. 3 Most CRC were related to old age and lifestyle factors, with only a fraction of cases caused by underlying genetic disorders. 4,5 Although numerous efforts has been taken to understand the genetic mechanism for initiation and progression of CRC, it remains a major challenge for researchers to prevent and treat early-onset CRC. Therefore, it is important and urgent to uncover the mechanisms of early-onset CRC and develop novel therapeutic routes.
Gene chip or expression profile is a gene-level detection technique that has been applied to scientific research during 2000. Using gene chips, integrated bioinformatic knowledge makes it possible to detect the expression of the entire genome within the same sample in a single experiment, which is particularly suitable to screen differentially expressed genes. 6,7 With the application of the gene chips, a large amount series of correlated CRC slice data have been produced, archived, and deposited in public databases. Reanalyzing and reintegrating those data sets may find some meaningful clues for new research. A series of microarray data sets have been carried out on CRC in recent years, 8,9 and a large number of differentially expressed genes (DEGs) have been obtained, which are involved in different pathways, biological process, cellular components, or molecular functions.
In this study, we downloaded the original raw data set (GSE4107) from the website of Gene Expression Omnibus (GEO, http://www.ncbi.nlm.nih.gov/geo/), which is a public database for archiving and querying microarray data. Gene expression profiles of patients with CRC were compared to those in normal healthy control to identify the DEGs. Subsequently, the DEGs were screened using Rstudio software installed Limma packages 10,11 ; then gene ontology (GO) and pathway enrichment analysis were performed on the online website DAVID (https://david.%20ncifcrf.gov). 12 Through analyzing their biological functions and pathways, we may sketch out the outline of CRC development at molecular level and identify the potential candidate genes for diagnosis, prognosis, and therapeutic targets.
Materials and Methods
Microarray Data
Microarray data GSE4107 13 were downloaded from the National Center Biotechnology Information Gene Expression Omnibus (https://www.ncbi.nlm.nih.gov/geo/) database, 14,15 which was executed with help of GPL570 Human Genome U133 Plus 2.0 Array. GSE4107 contains 12 patients and 10 healthy control (average age: 50 or less, ethnicity: Chinese).
Data Preprocessing
After GSE4107 was downloaded, probe identification numbers were transformed into gene symbols. For multiple probes corresponding to one gene, the significant expression value was taken as the gene expression value. After that, gene expression values were normalized using the Affy package. 16
Identification of DEGs
The raw data GSE4107 files used for analysis included the
Gene Ontology and Pathway Enrichment Analysis
The GO analysis is a useful method for annotating gene and gene product 20 and identifying characteristic biological meaning of genome and transcriptome. 21,22 The KEGG is a systematic analysis database of gene function, linking genomic information with high-level functional information. 23 Candidated DEGs functional-level enrichment were analyzed through multiple online tools. DAVID, among them, is an online website with gene annotation, visualization, and providing gene attributes. P < .05 as the cutoff criterion was considered statistically significant. 22,24,25
Integration of Protein–Protein Interaction Network and Module Analysis
First, Search Tool for the Retrieval of Interacting Genes (STRING) 26 database was used to demonstrate DEG-encoded proteins and protein–protein interaction (PPI) information. Second, to evaluate the interactive relationships among DEGs, we mapped the DEGs to STRING, and minimum required interaction score >0.400 (medium confidence) was selected as significant threshold. Then, PPI networks were constructed using the Cytoscape software. 27 The plug-in Molecular Complex Detection (MCODE), a well-known automated method to find highly interconnected subgraphs as molecular complexes or clusters in large PPI networks, was used to screen the modules or clusters of PPI network in Cytoscape. The MCODE parameters criteria were set by default, except K-core = 6. Moreover, the functional enrichment analysis was performed for DEGs in the modules with P < .05 as the cutoff criterion.
Results
Identification of DEGs
In this study, we included 12 patients with CRC and 10 healthy controls for the analysis. GSE4107 was analyzed using Rstudio software and following identifies the DEG sets. Using adjusted P values <.01 and |log2 fold change (FC)| ≥ 2 criteria, a total of 131 genes were identified; among them, 108 were upregulated and the other 23 were downregulated (Table 1).
131 Differentially Expressed Genes (DEGs) Were Identified From GSE4107, Including 108 Upregulated Genes and 23 Downregulated Genes in the Patients With Early-Onset Colorectal Cancer, Compared to Healthy Control.a

aThe upregulated genes were listed from the largest to the smallest of fold changes, and downregulated genes were listed from the smallest to largest.
Gene Term Enrichment Analysis
We uploaded DEGs to the online website DAVID to identify GO Terms and KEGG pathways and classified them into 3 functional categories: biological process (BP), cellular component (CC), and molecular function (MF; Figure 1A). As shown in Figure 1B and Table 2, GO analysis showed that the DEGs were most significantly enriched in muscle contraction and regulation of muscle contraction. Moreover, the upregulated DEGs were significantly enriched in biological process, including muscle system process, muscle contraction, and regulation of muscle contraction (Figure 1B and Table 2); the downregulated DEGs were enriched in organic acid transport, lipid metabolic process, and cellular lipid metabolic process (Figure 1B and Table 2).

Gene ontology analysis and significant enrichment of differentially expressed genes (DEGs) in early-onset colorectal cancer (CRC). (A) Gene ontology (GO) analysis classified DEGs into BP, CC, and MF group. (B) Ranking significant enriched GO terms of DEGs.
The Gene Ontology Analysis of DEGs Associated With Early-Onset Colorectal Cancer.

Abbreviation: DEG, differentially expressed gene.
Kyoto Encyclopedia of Genes and Genomes Pathway Analysis
We used online website DAVID to perform DEG functional and signaling pathway enrichment analysis. Figure 2 shows the most significantly enriched pathways of DEGs, and Table 3 lists the significantly enriched pathways of the upregulated DEGs, while there are no available significantly enriched pathways of the downregulated DEGs (Table 3). The significant signal pathway of the (upregulated) DEGs mainly enriched in vascular smooth muscle contraction and cGMP-PKG signaling pathway.

Significantly enriched signal pathway of differentially expressed genes (DEGs) in early-onset colorectal cancer (CRC).
Signaling Pathway Enrichment Analysis of DEGs Associated With Early-Onset Colorectal Cancer.

Abbreviation: DEG, differentially expressed gene.
Module Analysis, Key Candidate Genes, and Pathway Identification From PPI Network
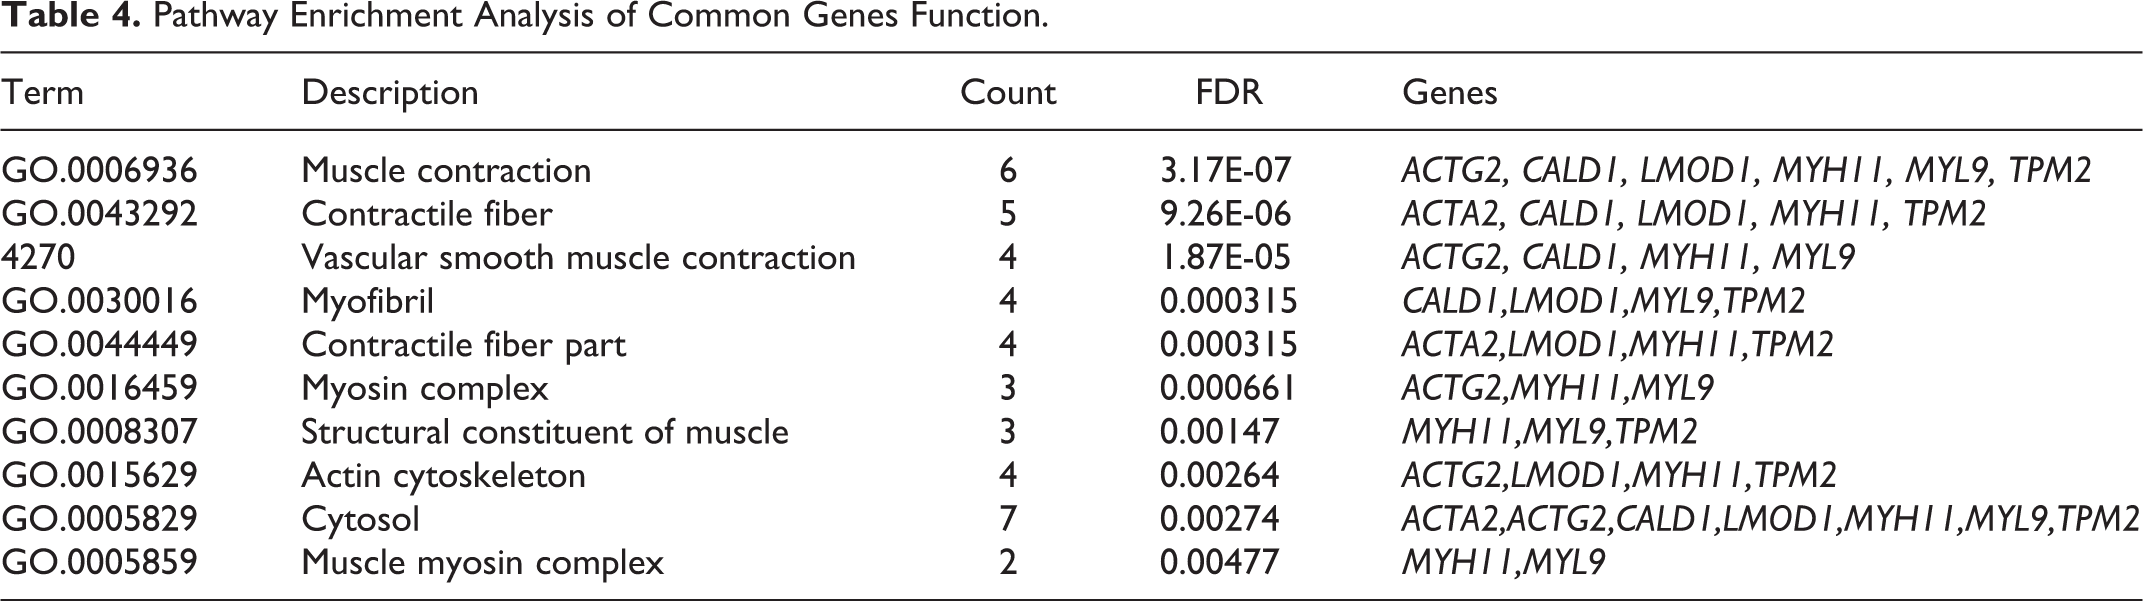
Based on the STRING online database (http://string-db.org) and Cytoscape software, a total of 131 DEGs (108 upregulated and 23 downregulated genes) were filtered into the DEG PPI network complex, containing 82 nodes and 199 edges (Figure 3A), and 49 genes did not fall into the PPI network. According to the filtering of node degree ≥10 criteria, the top 10 hub genes were ACTA2, ACTG2, FOS, DCN, MYH11, MYL9, EGR1, TPM2, LMOD1, and CALD1. Based on the MCODE, the significant module (10 nodes 42 edges, Figure 3B) from the PPI network was selected, and the functional annotation of the common genes were analyzed (Table 4). Enrichment analysis showed that the genes were mainly associated with vascular smooth muscle contraction signaling pathway.

Protein–protein interaction (PPI) network of differentially expressed genes (DEGs; Node color: Skyblue indicates up-regulated gene, Red indicates down-regulated gene). (A) Based on the STRING online database, 82 DEGs were filtered into DEGs PPI network. (B) The most significant module from the PPI network.
Pathway Enrichment Analysis of Common Genes Function.
Discussion
The CRC is a disease of accumulated genetic, epigenetic, and environmental aberrations. 28 Understanding the molecular mechanism of CRC is of very importance for diagnosis and treatment. It has been known that Wnt signaling pathway was associated with the major causes of CRC.
In this study, we expected to find out the key candidate genes and signal pathway in early-onset CRC. By comparing the 12 patients’ mucosa with 10 healthy control mucosa, 108 upregulated and 23 downregulated DEGs were screened. By using GO and PPI network analysis, 7 hub genes, namely, ACTA2, ACTG2, MYH11, CALD1, MYL9, TPM2 and LMOD1, coupled with vascular smooth muscle contraction signaling pathway have been identified.
ACTA2 (smooth muscle cell alpha actin) was identified as one of the hub genes showing the highest degree of connectivity. Lee’s group identified a correlation between early brain metastasis of lung adenocarcinoma and amplification of the ACTA2 gene, and ACTA2 could be a promising diagnostic and therapeutic target for lung cancer. 29 The second hub gene ACTG2 (actin gamma smooth muscle 2), encoding an ACTG2 protein, was related to metastasis of hepatocellular carcinoma. 30 -33 The third hub gene MYH11 (myosin-11) is a smooth muscle myosin belonging to the myosin heavy-chain family. 34 The MYH11 gene may be related to cell migration and adhesion, intracellular transport, and signal transduction, and MYH11 functions as a contractile protein, converting chemical energy into mechanical energy through adenosine triphosphate (ATP) hydrolysis. Wang et al 35 reported that MYH11 can contribute to predicting prognosis in stage II and III CRCs. Jo YS et al 36 also reported an oncogenic fusion CBFB/MYH11 and frameshift mutations in CRCs. Moreover, CALD1 (Caldesmon) encodes caldesmon protein, which is a calmodulin-binding and cytoskeleton-associated protein, and caldesmon is a biomarker for differentiation of smooth muscle. 37 -39 Yokota M group revealed that CALD1 showed a poor prognosis in colon cancer 40 Myosin regulatory light polypeptide 9 (MYL9) encoded by MYL9 is a myosin light chain that may regulate muscle contraction by conducting the ATPase activity. 41 The research unveiled that MYL9 expression level might be associated with the occurrence of non-small-cell lung cancer (NSCLC), which may be correlated to NSCLC metastasis. 42 Another hub gene, TPM2 (β-Tropomyosin), encoded tropomyosin beta chain, which is roughly 32 KD in molecular weight. 43 Bellavance 44 suggested that TPM2 has an important role in regulating actin cable information and controlling actin nucleation in vivo. The last hub gene LMOD1 (Leiomodin 1) is expressed in most tissue, with the high expression levels in thyroid, skeletal muscle, eye muscle, and ovary. 45 Aberrant expression of LMOD1 may be associated with the disease. Comley 46 revealed that LMOD1 was a novel component of the smooth muscle actin cytoskeleton.
Module analysis of the PPI networks suggested that the early-onset CRC is associated with vascular smooth muscle contraction signaling pathway, and the vascular smooth muscle cell (VSMC) principal function is contraction. 47 The principal mechanisms that regulate the contractile state of VSMCs are changes in cytosolic Ca2+ concentration. Moreover, Rho/Rho kinase, PKC, and arachidonic acid have been proposed to play a pivotal role in this event. 48
In conclusion, in this study, we investigated the potential candidate gene and signal pathway of DEGs in early-onset CRC. Genes were selected by DEG, GO, KEGG, and PPI analysis. This study has improved our understanding of the pathogenesis and underlying molecular mechanism in early-onset CRC; these selected candidate genes and pathways could give us a clue to new therapeutic targets for treatment of CRC. However, further molecular biological experiments are required to confirm the function of these identified genes in CRC.
Footnotes
Declaration of Conflicting Interests
The authors declared no potential conflicts of interest with respect to the research, authorship, and/or publication of this article.
Funding
The authors disclosed receipt of the following financial support for the research, authorship, and/or publication of this article: This work was supported by the Project of National Natural Science Foundation of China (No 81770294).